Article

Coordinating Control of an Offshore LVDC Microgrid Based Renewable Energy Resources for Voltage Regulation and Circulating Current Minimization

Department of Electronic and Electrical Engineering, Faculty of Engineering, University of Strathclyde, Royal College Building, Glasgow G1 1XW, UK
*
Author to whom correspondence should be addressed.
Energies 2021, 14(12), 3384; https://doi.org/10.3390/en14123384
Submission received: 17 May 2021 / Revised: 2 June 2021 / Accepted: 4 June 2021 / Published: 8 June 2021
(This article belongs to the Special Issue Energy and Exergy Analysis of Renewable Energy Conversion Systems)

Abstract

:
Multi-Use Platform (MUP) is a new topic addressed, extensively, under the EU funded projects that aim to exploit oceans in a sustainable way in order to reduce the costs of marine energy and to extract seafood. MUP’s electrical grid experiences many challenges, being offshore. One of these challenges is that only Alternating Current (AC) systems are considered which are inefficient, expensive and require bulky components. Considering the advantages of Direct Current (DC) systems, this paper aims to study the feasibility of using the DC system to improve the electrical infrastructure of the MUP’s grid. Floating energy unit comprising tidal, wind and solar energy resources is considered as a base unit for the MUP’s grid. The paper proposes a new distributed controller for grid voltage regulation and minimizing circulating current among parallel-connected floating energy units in an offshore Low Voltage Direct Current (LVDC) microgrid. A mathematical model is derived for n-parallel floating energy units with the proposed controller. Additionally, stability analysis for the overall model of a single floating energy unit is also presented. The analysis and simulation of the proposed DC system demonstrate that the system is stable and fault-rejected at different operating conditions.

1. Introduction

To cut the greenhouse gas emissions, there are international efforts to exploit our oceans in a sustainable way. These efforts are supported by two big projects that are funded by the EU, the Ocean of Tomorrow and Horizon 2020. Various offshore Multi-Use Platforms (MUP) are proposed under those projects for extracting energy and seafood in a sustainable way [1]. Bringing different activities together could potentially benefit each other by lowering installation and maintenance costs, increasing resource utilization, reducing the environmental impact, etc. [2]. Wind energy, as mature technology, is proposed, almost, in all structures. Most of the MUP structures involve different kinds of energy resources that share the same structure for reducing installation and maintenance costs. Aquaculture cages are proposed in many of those offshore structures for further reducing the energy costs and providing seafood.
However, MUP platforms, being located offshore, face challenges such as space limitation, high costs of system components, high costs of installations, no backup option available as the platform is offshore, and there are critical loads such as aquaculture or isolated community. Additionally, MUP local grid would experience other challenges such as turbine failure, power quality issues and circulating current phenomenon. Furthermore, only Alternating Current (AC) systems are considered for the MUP’s local grid that is inefficient, expensive and requires bulky components such as AC transformers.
On the other hand, Direct Current (DC) systems demonstrated their benefits in marine ships, electric buses, aeroplanes and electric cars applications. Therefore, considering a DC-system for the MUP’s electrical grid would bring some advantages such as reduced distribution losses by reducing AC-DC conversion stages. Additionally, dependence on one conversion level improves power transfer capability, increases system efficiency and ease of control and improves system stability. Furthermore, the DC system facilitates the connection of appliances and improves power supply reliability, and wires can handle more power with no skin effect [3]. Therefore, one of the objectives of this paper is to investigate the feasibility of using DC systems as a promising alternative approach to improve the electrical infrastructure of the MUP’s grid.
The power balance between the load demand and supply must occur, to achieve a stable bus voltage in a DC microgrid [4]. Energy Storage System (ESS) plays an important role as an energy buffer to compensate the unbalanced power via absorbing surplus energy to avoid voltage increase and supply the deficit energy to avoid decreasing the bus voltage [5].
In an isolated DC microgrid, many parallel-connected converters are operating in voltage-controlled mode [3], giving rise to some challenges such as load sharing accuracy, voltage regulation and circulating current phenomenon. To address these challenges, various control approaches are proposed in the open literature that can be classified into passive load-sharing techniques such as droop control [3,6,7,8,9,10,11,12,13,14,15,16,17,18,19] and active load sharing techniques such as master-slave [20,21], circular chain current programming [22], average current programming [23] and central limit control technique [24,25].
Among DC grid control approaches, droop control is widely used for the purpose of current sharing among parallel-connected converters for its simplicity and higher reliability. However, conventional droop control suffers from limitations that vitiate the accuracy of current sharing and voltage deviation. Study [26] emphasized that droop control suffers from a conflict between enhancing current sharing and DC voltage regulation. In other words, increasing the droop resistance results in accurate load sharing but increase the voltage deviation and vice versa. Additionally, droop control suffers from voltage deviation due to load varying. Furthermore, it suffers from current sharing problems due to the propagation of voltage error along resistive transmission lines., Basic droop control cannot do coordinated control function among multiple components with different characteristics [27]. To address these limitations, studies [28,29] proposed low bandwidth communication with the conventional droop controller to improve the voltage regulation and load sharing accuracy.
On the other hand, the advantages of active load sharing techniques guarantee accurate power-sharing and good dynamic performance. However, due to their high dependency on high-speed communications, the system redundancy and expandability is reduced, the system costs are increased, and system stability is not guaranteed [8]. However, due to the advancements in the communication infrastructure, active load sharing techniques have the potential to be improved and expanded. This paper proposes a distributed controller-based Instantaneous Average Current Sharing (IACS) technique for grid voltage regulation and for circulating current minimization among the parallel floating energy units. Consider IACS for controlling parallel DC-DC converters in an LVDC microgrid; to most of the authors’ knowledge, this has never been reported in the open literature. In a different study for the authors, this controller is modified by adding an adaptive controller for minimizing the circulating current and regulating load voltage. However, that study focused only on modelling and analysing of IACS controller itself, simplifying the energy resources to DC voltage sources. Therefore, this paper analyses the controller performance by considering the detailed model of different energy resources (wind, tidal, sola and battery storage) in order to study the stability of the whole LVDC microgrid. The contributions of this paper are the following:
  • Proposing floating energy unit comprises wind, tidal and solar resources with energy storage.
  • Modelling of a wind turbine, tidal turbine and solar array with boost converters for MPPT.
  • Modelling of an energy storage unit with a bidirectional buck/boost converter for bus voltage support.
  • Deriving the overall model of a floating energy unit considering all energy resources and their control loops.
  • Deriving the overall model of n-parallel connected floating energy units within an LVDC microgrid.

2. Offshore DC Microgrid Configuration

Figure 1 shows n floating structures with Solar Array (SA), Wind Turbine (WT), Tidal Turbine (TT) and Energy Storage System (ESS) on each structure. Both WT and TT are connected to a local DC bus via Diode Bridge (DB) and a boost DC/DC converter, while the SA and ESS as DC sources are connected directly to the DC bus via boost converter and bidirectional buck/boost converter, respectively. DC/DC converters are employed in this configuration in three different positions: converters at position 1 (Pos. 1) are used for MPPT purposes for renewable energy resources, while the ESS bidirectional converter is applied for battery charging/discharging control to regulate the local bus voltage. Converters at Position 2 (Pos. 2) are employed for boosting the structure voltage from 950 V to distribution voltage of 1500 V. IACS controller is used to control these converters for the purpose of minimizing circulating current and maintaining the distribution voltage accurately fixed at the nominal voltage at various operating points. Converters at position 3 (Posi. 3) are buck converters which are used to decrease the distribution voltage to different load voltages.

3. Proposed Grid Control

In a microgrid based Renewable Energy Sources (RES), a hierarchical control strategy is common for achieving various control goals at different grid levels. For example, a current control loop is required at the primary control level (converters at Pos. 1) for extracting maximum power from each energy source (WT, TT and SA).
Due to the intermittent nature of renewable energy sources, the voltage at the local DC bus fluctuates based on the energy balance between the demand load and the supply. Therefore, a secondary controller is applied to the bidirectional DC-DC converter of the storage system to ensure power balance and hence regulate the local bus voltage at the nominal value.
The floating energy units, proposed in this paper, are connected in parallel to the DC collection bus via DC-DC converters and distribution lines. Practically, these distribution lines have different line impedances which leads to circulating current among those energy units. Therefore, a tertiary controller based on IACS is used to control the converters at Pos. 2 in order to regulate the voltage of the DC collection bus and to minimize the circulating current among the parallel-connected energy units.
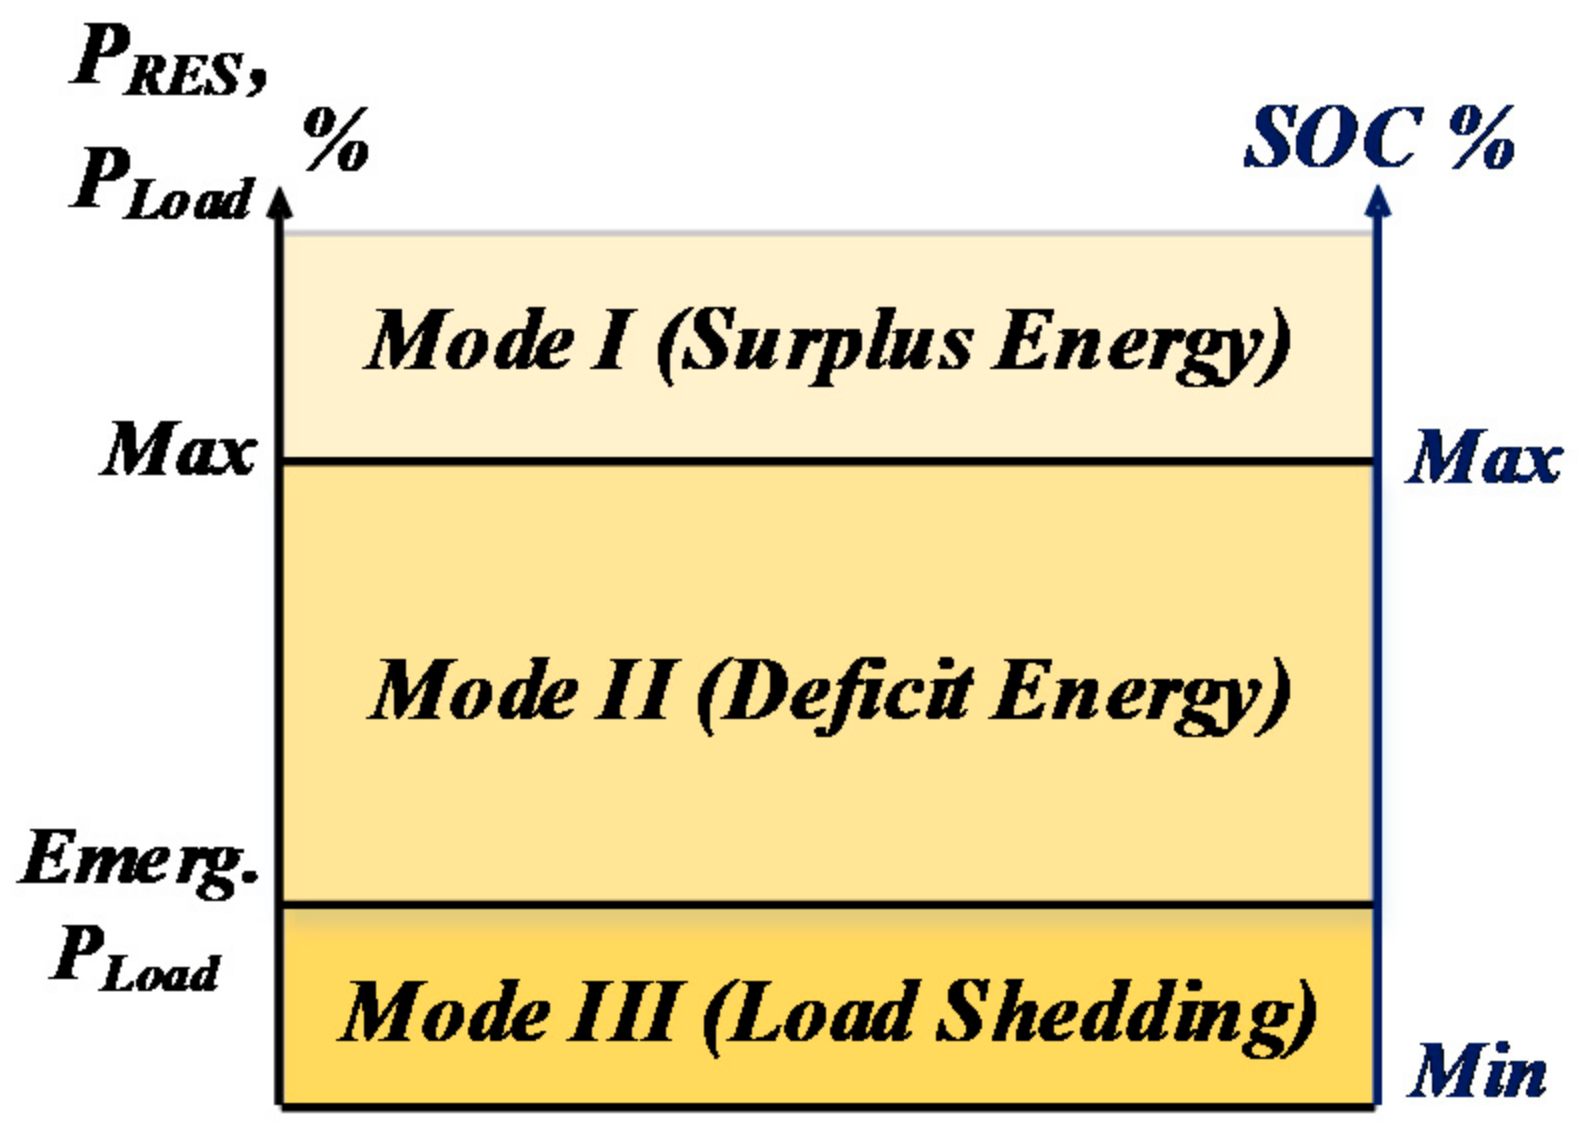
However, considering autonomous microgrid requires supervisory control level to ensure energy balance and hence accurate voltage regulation via changing the grid operation mode based on the available energy from the energy sources and the batteries’ State of Charge (SOC). Operation modes can be classified into three different modes as shown in Figure 2.
Mode I (RES Surplus Energy) occurs in real operation when there is surplus energy from the RES and the ESS is fully charged. At this time, the RES is required to instantaneously adjust their power generation according to the demand load to maintain energy balance, and this can be achieved using a pitch controller for wind/tidal turbines.
P R E S > P L o a d   a n d   S O C = M a x .   l i m i t
P R E S   <   P L o a d   a n d   S O C   >   M i n . l i m i t   w h i l e   P R E S   +   P E S S     P l o a d
P R E S     P L o a d   a n d   S O C > M i n . l i m i t   w h i l e   P R E S   +   P E S S   =   E m e r g e n c y   P l o a d
Mode II (RES deficit Energy) happens when the RES are not able to supply the required demand energy while the ESS has enough charge to supply, then both RES and ESS will deliver energy to balance the demand load.
Mode III (Load shedding) happens in case the RES are unable to deliver energy; the ESS must cover the emergency load demand according to its SOC. For this, load shedding for unnecessary loads will be in operation to balance the energy supplied by the ESS with the emergency load.

4. Mathematical Modelling and Control of System Components

4.1. Model of Wind/Tidal Turbine with MPPT Controller

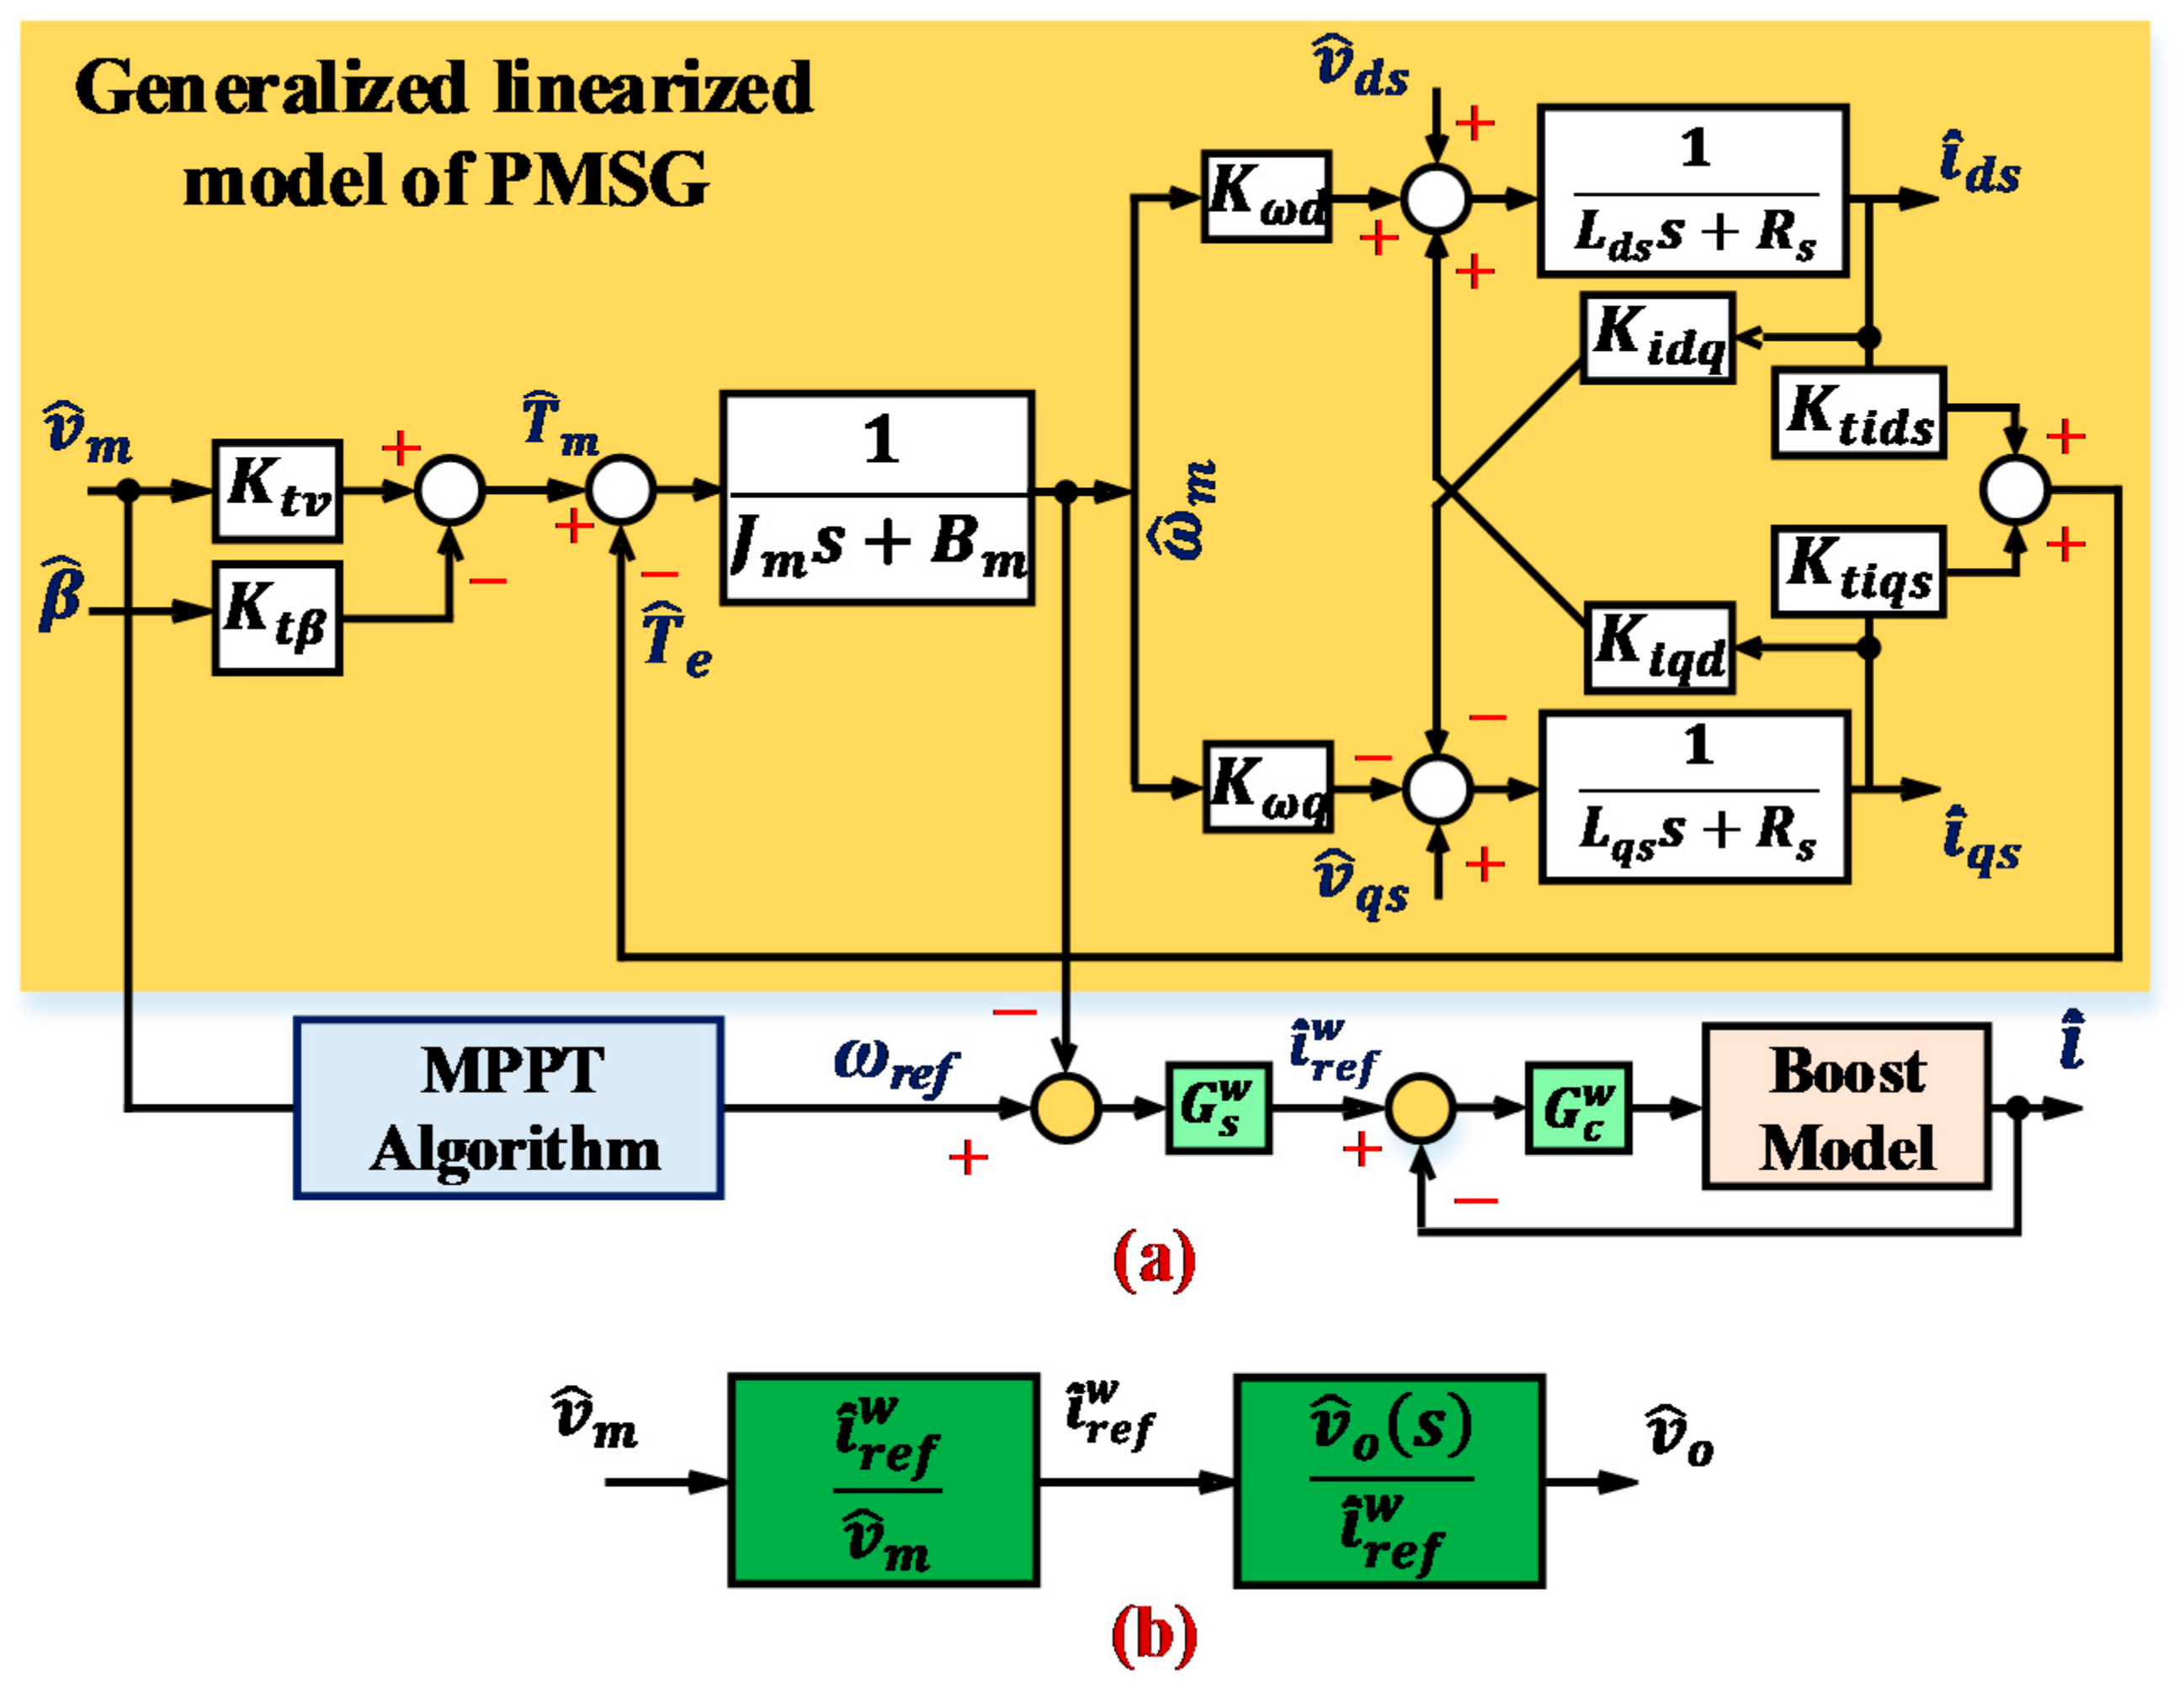
As illustrated in Figure 1, each wind or tidal turbine is connected to a Permeant Magnet Synchronous Generator (PMSG), Diode Bridge and DC/DC boost converter. Due to its widespread acceptance in wind turbines applications and its fast progress, PMSG is considered under this study to be connected to wind and tidal turbines [30]. A boost converter is used to extract the maximum power from the wind turbine via two control loops. The first loop tracks the optimal generator speed using Proportional Integral (PI) which provides a reference for the inductor current of the second current loop. The second loop also uses PI to control the inductor current which leads to controlling the speed of the generator to operate at the optimal speeds. Figure 3 shows the block diagram for speed control of PMSG connected to wind/tidal turbine. The following model applies to wind/tidal turbine as a similar configuration is considered for both of them under this study.
The mechanical output power of a wind turbine P W m can be estimated by (4)
P W m = 0.5 ρ w A w C p w λ w , β w v w 3 where C p w = 0.5176 116 λ i 0.4 β w 5 e x p 21 λ i + 0.0068 λ w where λ i = 1 / 1 λ w + 0.08 β w 0.035 β w 3 + 1
where ρ w , A w , C p w , β w , v w are the air density, rotor swept area, power coefficient, pitch angle and wind speed, respectively. λ w is the tip speed ratio ( λ w = R w ω m w / v w ) where R w is the rotor radius. The mechanical model of the wind turbine considering single mass modelling is
T m w = J m w d ω m w d t + B m w ω m w + T e w
where T m w and T e w are the mechanical and electromagnetic torques (N.m). J m w and B m w are the shaft inertia (kg.m2) and viscous friction (N.m.s). ω m w is the rotor mechanical speed (rad/s) where ( ω r w = ω m w P p w ). P p w is the number of pole pairs. The relation between the mechanical output power of the turbine in (4) and the mechanical model in (5) is built by inserting P W m = T m w ω m w = T m w λ w v w R w into (4). Then the mechanical torque can be expressed as a function of wind speed as follows
T m w = 0.5 ρ w A w C p w λ w , β w v w 2 R w / λ w
Study [31] presented a detailed mathematical derivation for a PMSG model. Stator voltage of PMSG in a dq frame is
v d s w = R s w i d s w ω r w L q s w i q s w + L d s w d i d s w / d t v q s w = ω r w L d s w i d s w + R s w i q s w + L q s w d i q s w / d t + ω r w Ψ r w
where v d s w , v q s w are the stator voltages (V); i d s w , i q s w are the stator currents of PMSG in dq frame (A). R s w is the stator winding resistance (Ω). Ψ r w is the maximum flux linkage created by the permanent magnets (Wb). ω r w is the rotor electrical speed (rad/s).
The generator electromagnetic torque equals
T e w = 3 P p / 2 Ψ r w i q s w + L d s w L q s w i q s w i d s w
The large-signal model of a DC/DC boost converter can be represented, in general, as follows
L   d i l / d t = d t v g t + 1 d t v g t v t C   d v c / d t = 1 d t i l t v t / R L
where L and C are the boost converter inductance and capacitance, respectively. v g t and v t are the boost converter input and output voltages, respectively. d t is the duty cycle and R L is the load resistance. i l is the inductor current while v c is the capacitor voltage. It is worth mentioning that the boost converter parameters ( L , C , v g , v , d and i l ) will take different symbols for various boost converters used with wind, tidal, solar and battery systems.
Equations (4)–(9) represent a nonlinear large-signal model of a wind turbine, PMSG and DC/DC boost converter. Applying linear control techniques such as PI requires a linear system. Therefore, this large-signal model can be linearized using Taylor expansion to obtain a linearized small-signal model. It is worth mentioning that all variables in the small-signal model will be denoted by hat ( ^ ) and initial values are denoted by ( 0 ). Equation (6) shows that the turbine torque T m w is a function of the wind speed v w , turbine speed ω m w and the pitch angle β w . Replacing C p w in (6) with its value in (4), then taking partial derivative for (6) with respect to ω m w , v w and β w by applying Taylor expansion, one can get the linearized small signal model of (6) as follows
T ^ m w   =   K t v w v ^ m w + K t ω w ω ^ m w + K t β w β ^ w
where
K t v w = T m w v w v w 0 ω m 0 w β 0 w ,   K t ω w = T m w ω m w v w 0 ω m 0 w β 0 w ,   K t β w = T m w β w v w 0 ω m 0 w β 0 w
The gains ( K t v w , K t ω w and K t β w ) vary by changing the system operating point. However, the turbine speed cannot be changed rapidly; hence, the effect due to the turbine speed variation on the turbine torque is ignored, i.e., K t ω w = 0 . Moreover, the pitch control is not used for MPPT; hence, the term K t β w β ^ w in (11) should be ignored [32]. By replacing T m w in (5) with (10), the linearized small signal model of a wind turbine is given.
ω ^ m w = K t v w v ^ m w K t β w β ^ w T ^ e w J m w s + B m w
Similarly, applying Taylor expansion for the nonlinear large-signal model of the PMSG (7), one can get the linearized small signal as follows
i ^ d s w   =   v ^ d s w + K ω d w ω ^ m w + K i q d w i ^ q s w / L d s w s + R s w i ^ q s w   =   v ^ q s w K ω q w ω ^ m w K i d q w i ^ d s w / L q s w s + R s w
where
K ω d w = P p w L q s w i q s 0 w ,   K ω q w = P p w L d s w i d s 0 w + P p w Ψ r w ,   K i q d w = P p w L q s w ω m 0 w   and   K i d q w = P p w L d s w ω m 0 w .
The electromagnetic torque in (8) can be linearized using Taylor expansion as follows
T ^ e w   =   K t i q s w i ^ q s w + K t i d s w i ^ d s w
where
K t i q s w   =   1.5 P p w Ψ r w + L d s w L q s w i d s 0 w   and   K t i d s w = 1.5 P p w L d s w L q s w i q s 0 w
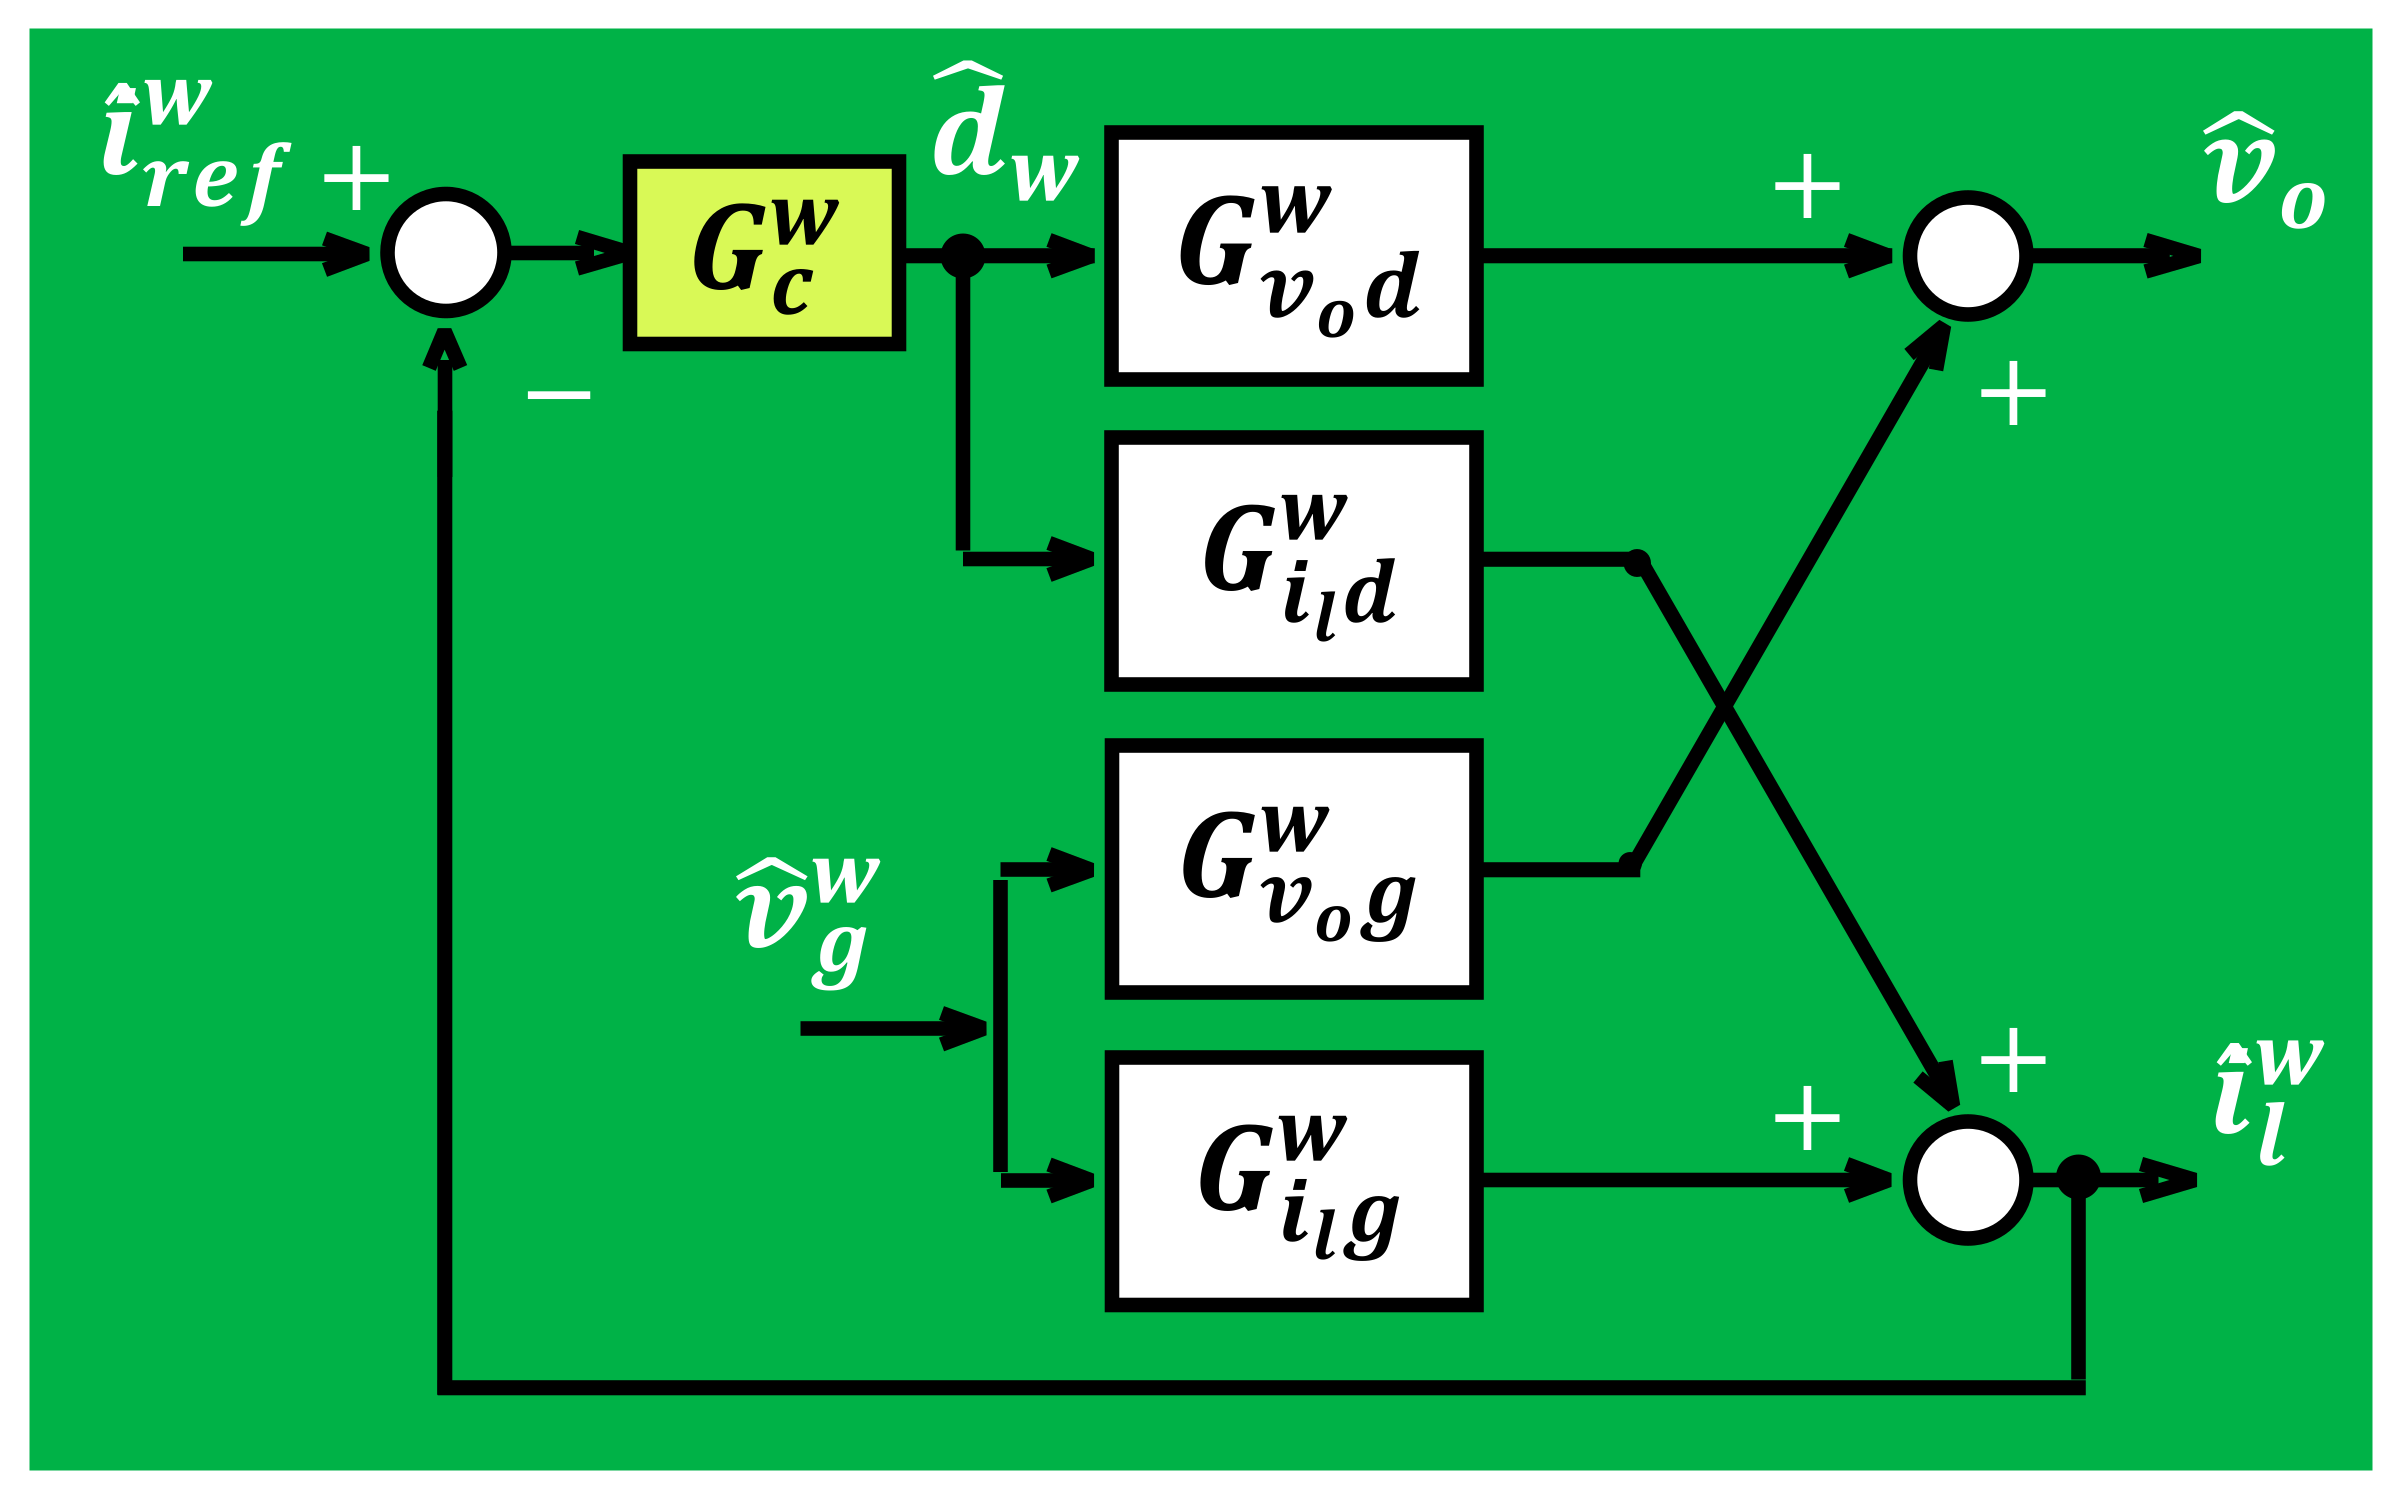
As per Figure 3, MPPT control requires manipulating the inductor current of the boost converter to get the generator working at the optimal speed. This can be achieved by changing the duty cycle of the boost converter as a control input with feedback from the inductor current of the converter as shown in Figure 4 of the linearized small-signal model of a current programmed DC/DC converter.
Figure 4 shows that the inductor current and the output voltage of the boost converter depend on the duty cycle and the input voltage as per these equations
v ^ o s = G v o d w s d ^ w s + G v o g w s v ^ g w s i ^ l w s = G i l d w s d ^ w s + G i l g w s v ^ g w s
where v ^ o is the voltage of the local DC-bus, v ^ g w is the input voltage of the boost converter connected to the wind turbine, i ^ l w and d ^ w are the inductor current and the duty cycle of the same boost converter. The transfer functions of this converter are given as follows [33]
G v o d w = v ^ o s d ^ w s = G d o w 1 s ω z w d e n w s G v o g w = v ^ o s v ^ g w s = G g o w 1 d e n w s G i l d w = i ^ l w s d ^ w s = 2 V o D ` w 2 R L w 1 + s 0.5 R L w C w d e n w s G i l g w = i ^ l w s v ^ g w = 1 D ` w 2 R L w 1 + s R L w C w d e n w s
where d e n w s = 1 + s Q w ω o w + s ω o w 2 , G d o w = V o D ` w , ω z w = D ` w 2 R L w L w , ω o w = D ` w L w C w , Q w = D ` w R L w C w L w , G g o w = 1 D ` w and D ` w = 1 D w . V o , D w , L w and C w are steady-state values of the local bus voltage, duty cycle and the inductance and capacitance of the boost converter connected to a wind turbine, respectively.
Equations (10)–(15) represent the mathematical linearized small-signal model of a wind turbine, PMSG and boost converter as the block diagram of Figure 5 shows.
Figure 5 illustrates two PI controllers with transfer functions G s w and G c w for speed and current regulation, respectively. k s w and k c w are the proportional gains while T s w and T c w are the integral gains of the speed and current controllers, respectively. The first PI controller generates the reference current for the second controller. In Figure 5, it is required to obtain the closed-loop transfer function between the inductor current i ^ l w and the reference current i ^ r e f w for stability analysis purposes. The reference current-to-inductor current transfer function can be derived using the second line of (14) by substituting d ^ w with [ G c w ( i ^ r e f w i ^ l w ) ] and applying superposition theorem, i.e., putting v ^ g w = 0 . One can get the required transfer function as follows
G s w = k s w 1 + 1 s 1 T s w         and             G c w = k c w 1 + 1 s 1 T c w
The stability of the current closed-loop of Figure 4 depends on the roots of the denominator of (17) which is the characteristic equation ( 1 + G i l d w G c w = 0 ) . The coefficients of this equation are all positive which means that all roots are on the left half-plane of the s-plane, i.e., the closed-loop current transfer function of (17) is stable.
i ^ l w i ^ r e f w = G i l d w G c w 1 + G i l d w G c w
To analyse the stability of the DC-bus voltage with varying wind speed, it is required to derive the transfer function between the voltage of the local DC-bus and the wind speed as per the simplified block diagram of Figure 5b. The required transfer function comprises two transfer functions of i ^ r e f w v ^ m and v ^ o s i ^ r e f w . The transfer function from the wind speed to the reference current can be derived from the block diagram of Figure 5a which yields
i ^ r e f w = G s w ω ^ r e f w ω ^ m w i ^ r e f w v ^ m = G s w f P W m Q c w K t v w 1 + Q c w Z w
where
Q c w = 1 J m w s + B m w ,   Z w = K t i q s w Y w + K t i d s w X w ,   f P W m = 0.5551 P W m 2 + 1.183 P W m + 0.425 , X w = a 1 w s + a 2 w b 1 w s 2 + b 2 w s + b 3 w   ,   Y w = a 3 w s + a 4 w b 1 w s 2 + b 2 w s + b 3 w
and
a 1 w = L q s w K ω d w ,   a 2 w = R s w K ω d w K i q d w K ω q w ,   a 3 w = L d s w K ω q w ,   a 4 w = R s w K ω q w + K i d q w K ω d w ,   b 1 w = L q s w L d s w ,   b 2 w = L q s w + L d s w R s w ,   b 3 w = R s w 2 + K i d q w K i q d w .
The transfer function between the reference current i ^ r e f w and the local bus voltage v ^ o can be obtained using Figure 4 and (14). From Figure 4, one can obtain d ^ w = G c w i ^ r e f w i ^ l w . From this equation, put the value of i ^ l w into the second line of (14), and afterwards, solve for d ^ w ; then, put it in the first line of (14). One can get the DC-bus voltage as a function of the reference current and the input voltage as follows
v ^ o = G v o d w G c w 1 + G c w G i l d w i ^ r e f w + n u m w s 1 + G c w G i l d w v ^ g w
where n u m w s = G v o g w 1 + G c w G i l d w G c w G i l g w . By substituting i ^ r e f w into (19) with its value from (18), one can obtain the overall transfer function of a wind turbine with PMSG and a boost converter as follows
v ^ o s = f P W m Q c w K t v w 1 + Q c w Z w G s w G v o d w G c w 1 + G c w G i l d w v ^ w + n u m w s 1 + G c w G i l d w v ^ g w
As mentioned earlier, the tidal turbine has a similar dynamic behaviour as the wind turbine as per (4) with two differences. Instead of the air density, water density is considered for tidal case, and water current speed is applied instead of wind speed. Moreover, the same configuration of a wind turbine is considered for a tidal turbine, so the overall transfer function of the wind turbine holds for the tidal turbine which can be copied from (20) considering the mentioned differences between the wind and the tidal turbines and the parameters of the turbine and the PMSG of each case.
v ^ o s = f P T m Q c T K t v T 1 + Q c T Z T G s T G v o d T G c T 1 + G c T G i l d T v ^ T + n u m T s 1 + G c T G i l d T v ^ g T
where
Q c T = 1 J m T s + B m T K t ω T   ,   K t v T = T m T v T v T 0 ω m 0 T β 0 T   ,   f P T m = 0.5551 P T m 2 + 1.183 P T m + 0.425 , Z T = K t i q s T Y T + K t i d s T X T ,   K t ω w = T m w ω m w v w 0 ω m 0 w β 0 w   ,   X T = a 1 T s + a 2 T b 1 T s 2 + b 2 T s + b 3 T   ,   Y T = ( a 3 T s + a 4 T ) b 1 T s 2 + b 2 T s + b 3 T a 1 T = L q s T K ω d T ,   a 2 T = R s T K ω d T K i q d T K ω q T ,   a 3 T = L d s T K ω q T ,   a 4 T = R s T K ω q T + K i d q T K ω d T ,   b 1 T = L q s T L d s T ,   b 2 T = L q s T + L d s T R s T ,   b 3 T = R s T 2 + K i d q T K i q d T . G s T = k s T 1 + 1 s 1 T s T   ,   G c T = k c T 1 + 1 s 1 T c T G v o d T = v ^ o s d ^ T s = G d o T 1 s ω z T d e n T s   ,   G i l d T = 2 V o D ` T 2 R L T 1 + s 0.5 R L T C T d e n T s G v o g T = v ^ o s v ^ g T s = G g o T 1 d e n T s   ,   G i l g T = i ^ l T s v ^ g T = 1 D ` T 2 R L T 1 + s R L T C T d e n T s d e n T s = 1 + s Q T ω o T + s ω o T 2 ,   G d o T = V o D ` T , ω z T = D ` T 2 R L T L T , ω o T = D ` T L T C T   , Q T = D ` T R L T C T L T   , G g o T = 1 D ` T , D ` T = 1 D T .   n u m T s = G v o g T 1 + G c T G i l d T G c T G i l g T
V o , D T , L T and C T are steady-state values of the local bus voltage, duty cycle and the inductance and capacitance of the boost converter connected to a tidal turbine, respectively. P T m is the mechanical output power of a tidal turbine. f P T m is the MPPT algorithm which gives the optimal per unit rotor speed as a reference at various mechanical input powers. v ^ g T is the input voltage variations of the boost converter connected to a tidal turbine. v ^ T is water current speed associated with a tidal turbine.

4.2. Model of Solar Array with MPPT Controller

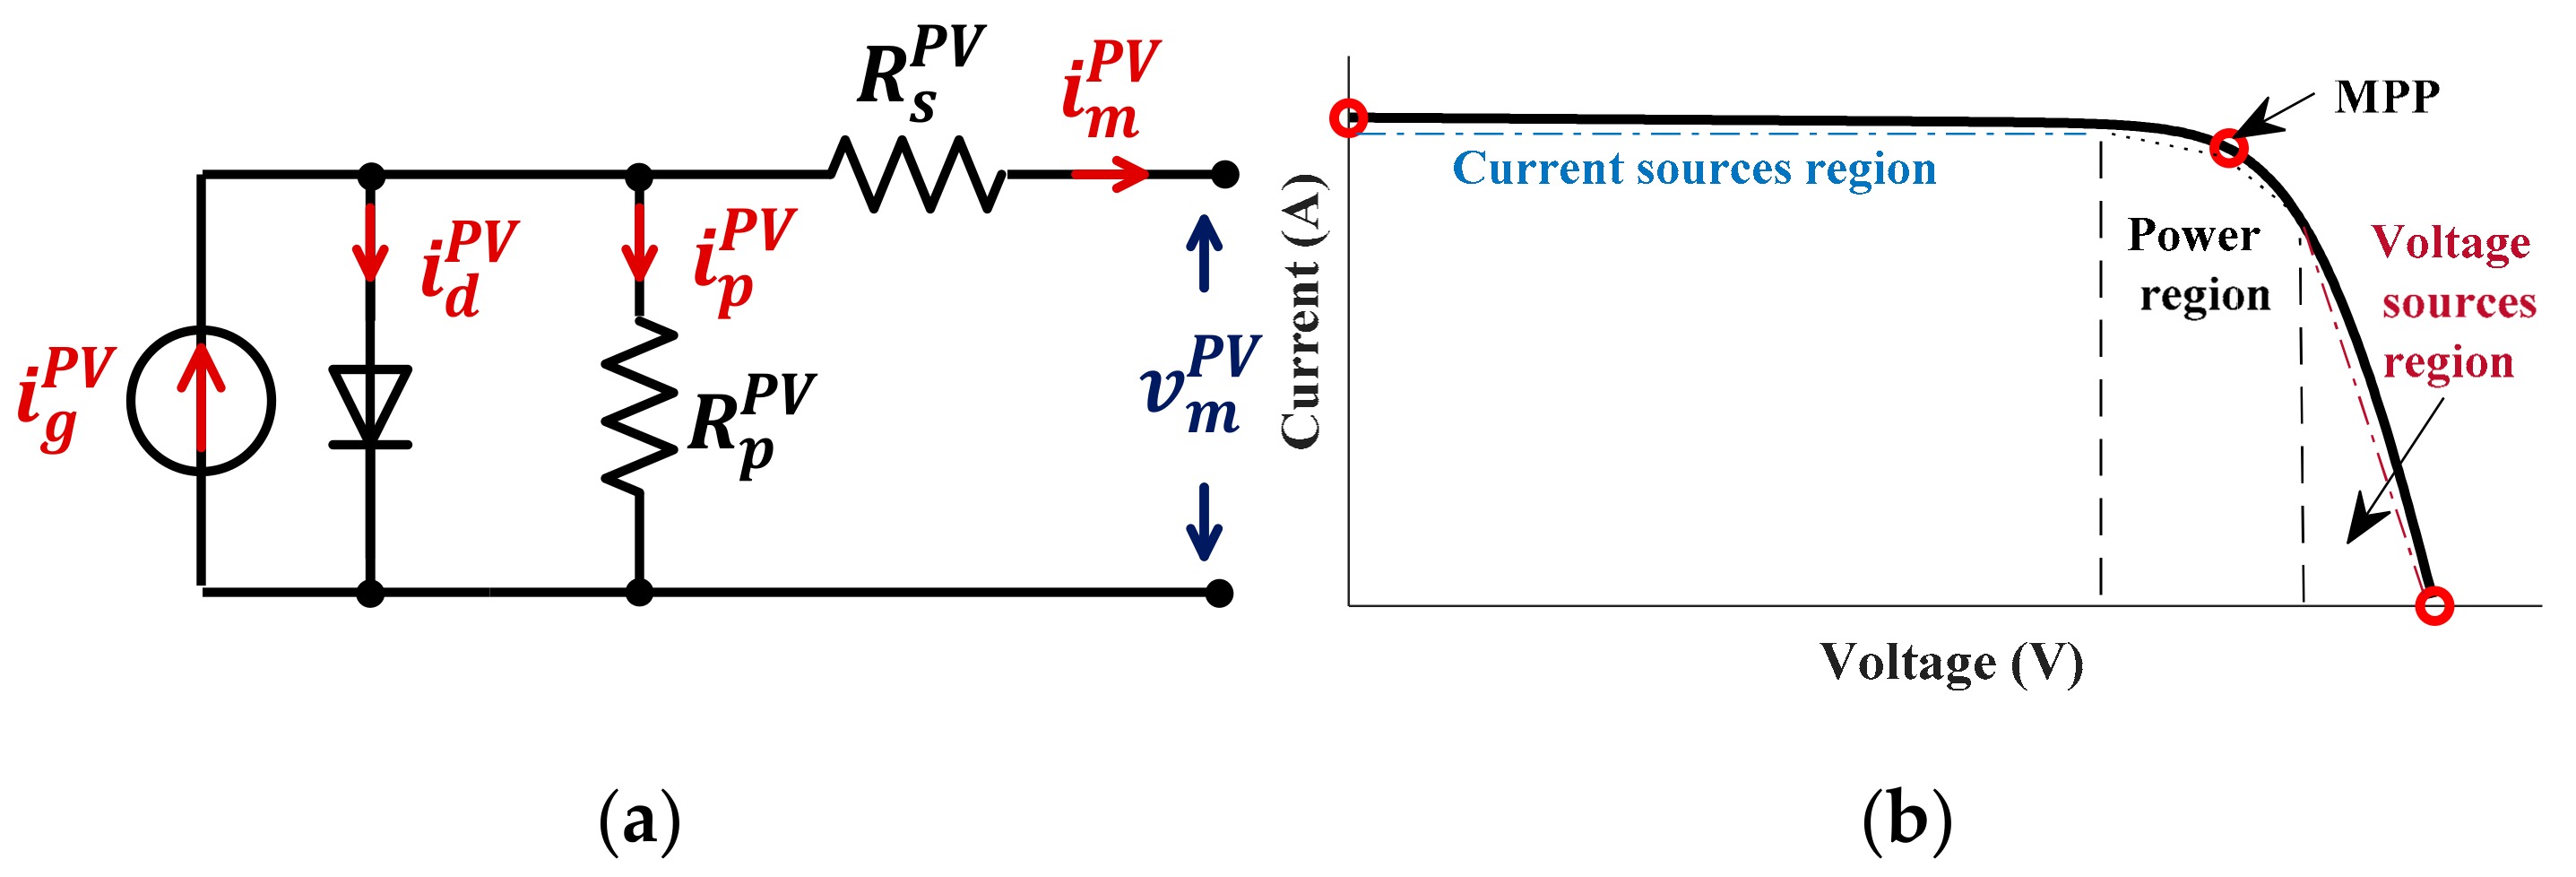
A Photovoltaic (PV) array consists of many PV modules connected in series and parallel as per the required design. PV cell is the basic unit of the PV module which includes electrically connected series and parallel cells. One cell can produce electrical power around 1 to 2 W according to the available irradiance. The PV cell is modelled in literature with various equivalent circuits according to the number of diodes considered to a single-diode circuit, two-diodes circuit and three-diodes circuit. The single-diode model has the advantages of simplicity and reasonable accuracy which make it the most commonly used model for simulation studies. Figure 6a shows the equivalent circuit of a real PV cell considering the dynamic resistances R s P V which represents the structural resistances of the PV cell and R p P V for modelling the leakage current of p-n junction. i g P V refers to the current generated by the light as per (22).
i g P V G , T = G P V G r P V I s c P V + K s c P V ( T P V T r P V
where G P V and G r P V are solar irradiance and the standard irradiance at the Standard Test Condition (STC). T P V and T r P V are real cell temperature and the temperature at STC. I s c P V and K s c P V are the short circuit current at STC and the short circuit current temperature coefficient provided by the manufacturer.
Figure 6b shows the nonlinear relationship between the current i m P V and voltage v m P V outputs of the PV module described by (23).
i m P V = i g P V i d P V i p P V where i d P V = I 0 e q v m P V + R s P V i m P V M s k T P V a 1 i p P V = v m P V + R s P V i m P V R p P V
It is worth mentioning that Equation (23) adding M s can be used to represent a PV module which has a number ( M s ) of series connected PV cells, where q is the electron charge (1.602 × 10⁻¹⁹ C), k is the Boltzmann’s constant (1.38 × 10⁻²³ J/K), T P V is the temperature of the p-n junction, and a is the diode ideality factor. I 0 is the diode reverse current saturation which is a function of T .
Using a single PV module in a power system is unrealistic for its low output power. Therefore, normally many modules are electrically connected in parallel and series according to the designed output power and voltage, respectively. A model of a PV system based multi-modules is derived in the study [34] using Norton equivalent circuit. Norton theorem is applied, first, to get the equivalent circuit of a single PV module without the current source ( I s ) and diode section to avoid nonlinearity of the diode as per Figure 6a. Then, the Norton theorem is applied again to get the equivalent circuit of a PV system (PV array) consisting of N s , series connected modules, and N p , parallel connected modules, as Figure 7 shows.
The equivalent current source and resistance are given as follows
i s _ a r y P V = N p R p P V R p P V + R s P V i g P V i d P V R a r y P V = N s N p R p P V + R s P V
The Equation (24) is applied to a PV array that has the same type of PV modules and exposed to the same environmental conditions. The relationship between the output current i a r y P V and voltage v a r y P V of a PV array is obtained based on Figure 7a as follows
i a r y P V = N p R p P V R p P V + R s P V i g P V i d _ a r y P V v a r y P V R a r y P V
where i d _ a r y P V = I 0 e q M s k T P V a v a r y P V N s 1 and v a r y P V = N s v m P V , considering the assumption of modules similarity made above.
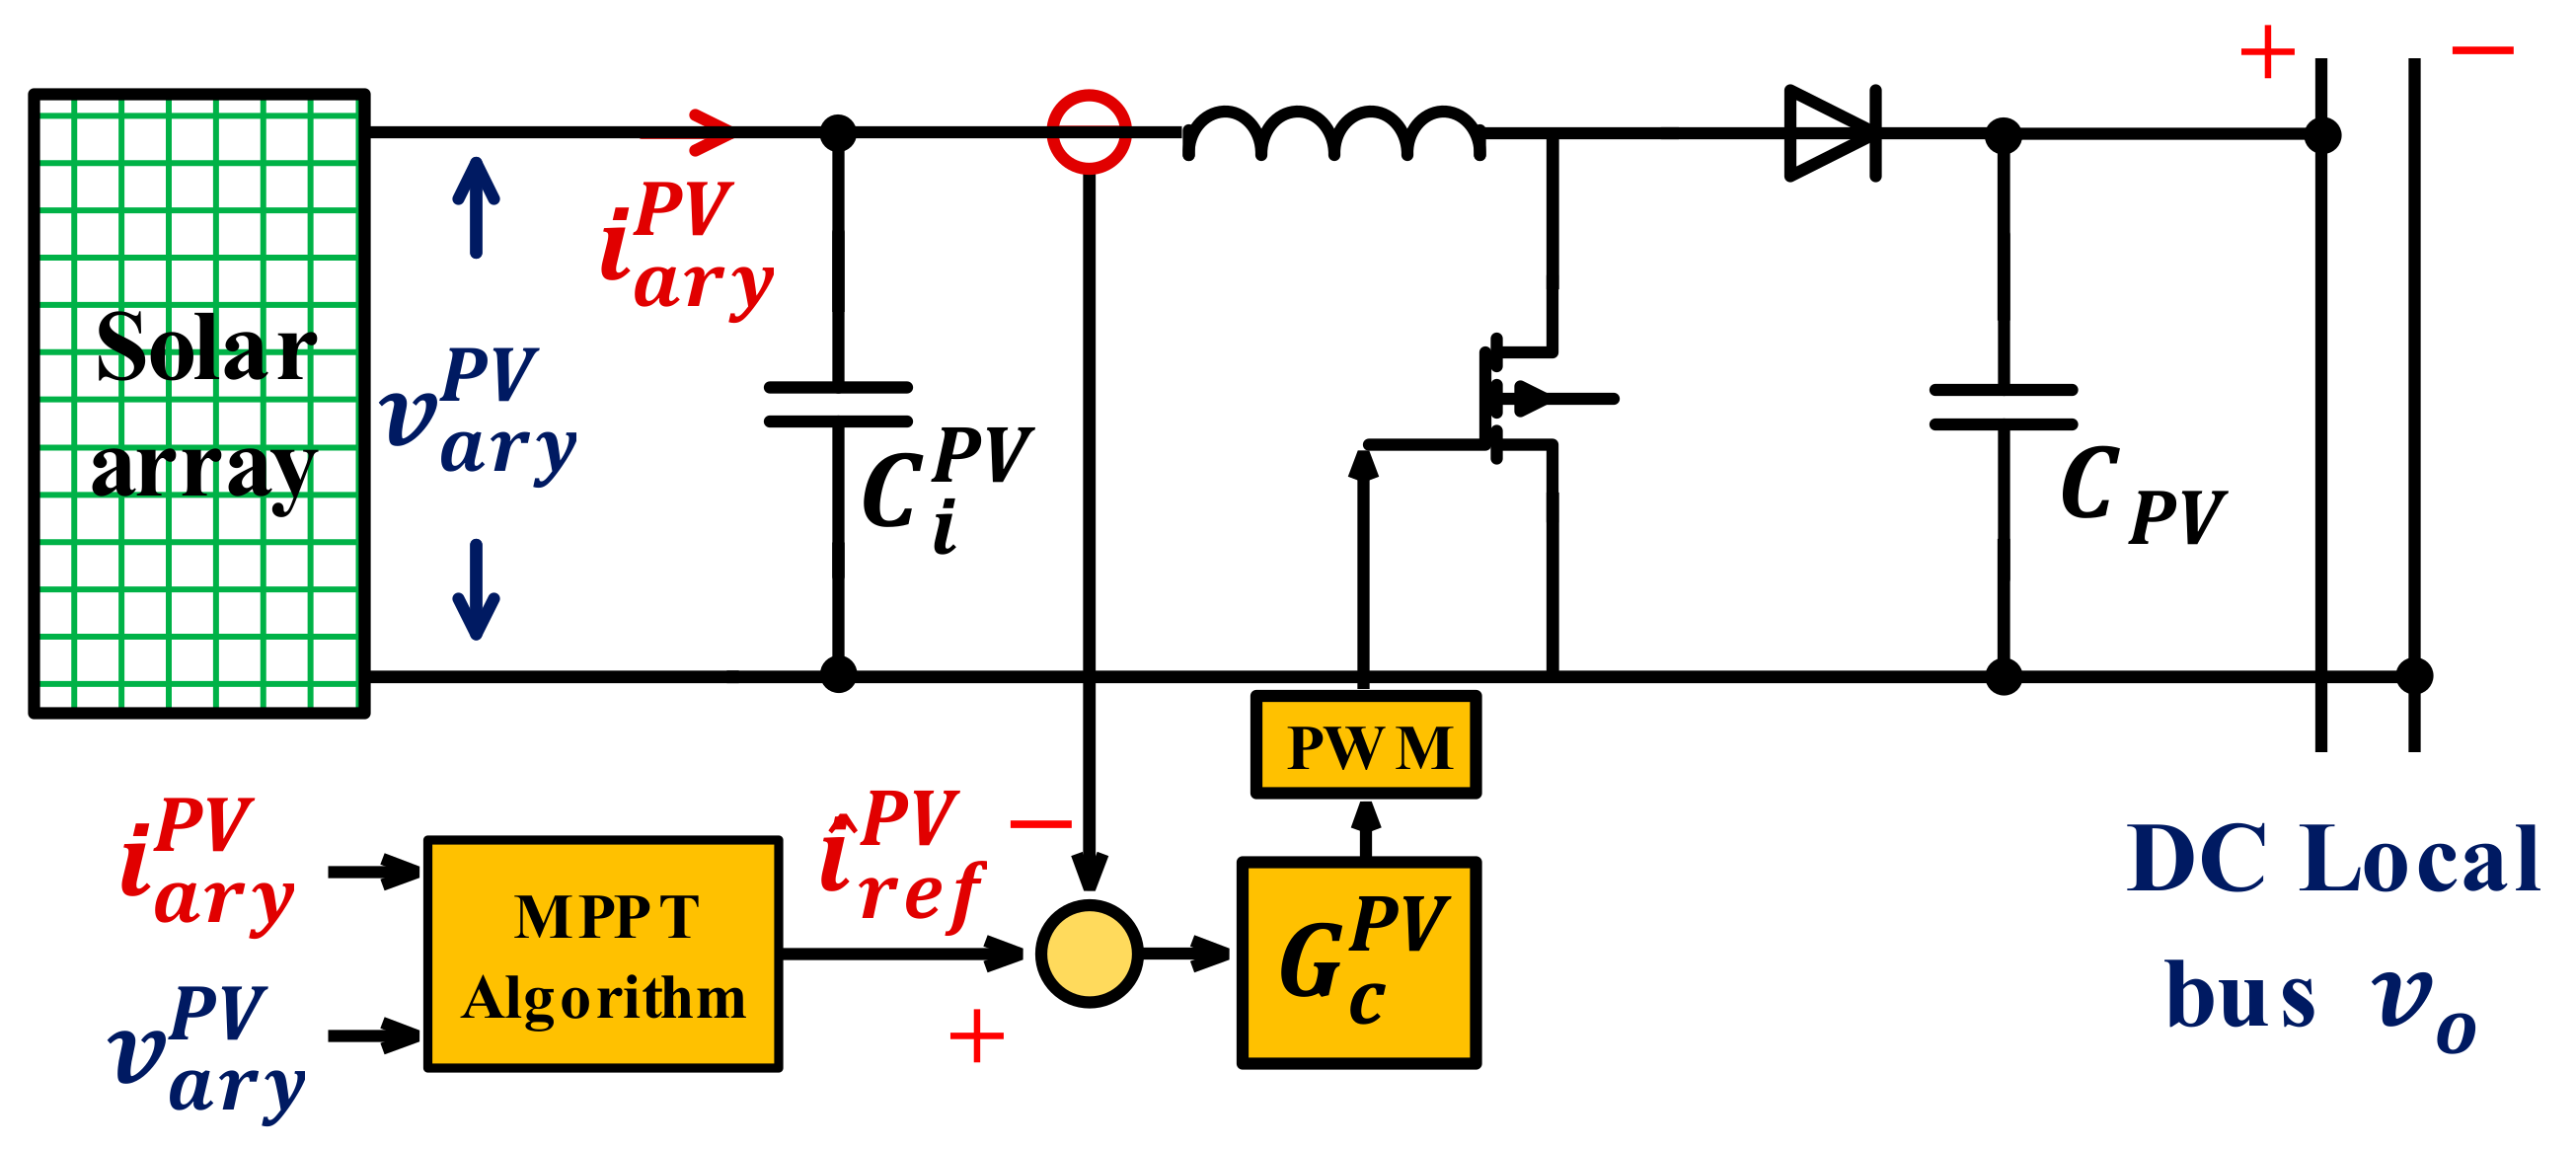
To extract the maximum power from the PV array, a DC/DC boost converter with a current control loop is applied as per Figure 8. A PI-controller is used to control the inductor current of the boost converter to track the reference current provided by an MPPT algorithm which is out of the scope of this study. The boost converter is chosen in this case as its input current (inductor current) is adjustable. This current is also the output of a PV array which is required to be compensated to an optimal value. Unfortunately, a buck converter could not do this job as its inductor is located at the output side, which means that the converter input current is always lower than or equal to the output current, i.e., compensating the buck converter output current does not achieve the MPPT where the output current from the array will be lower than the optimal current.
The small-signal model of a current programmed boost converter with a PI-current control loop is illustrated in Figure 9. The transfer functions of the current programmed boost converter are derived earlier in the wind turbine section, and this is copied below with the parameters of the solar PV array.
G v o d P V = v ^ o s d ^ P V s = G d o P V 1 s ω z P V d e n P V s G v o g P V = v ^ o s v ^ g P V s = G g o P V 1 d e n P V s G i l d P V = i ^ l P V s d ^ P V s = 2 V o D ` P V 2 R L P V 1 + s 0.5 R L P V C P V d e n P V s G i l g P V = i ^ l P V s v ^ g P V = 1 D ` P V 2 R L P V 1 + s R L P V C P V d e n P V s
where
d e n P V s = 1 + s Q P V ω o P V + s ω o P V 2 ,   G d o P V = V o D ` P V ,   ω z P V = D ` P V 2 R L P V L P V , ω o P V = D ` P V L P V C P V ,   Q P V = D ` P V R L P V C P V L P V , G g o P V = 1 D ` P V   and   D ` P V = 1 D P V .
V o , D P V , L P V and C P V are steady-state values of the local bus voltage, duty cycle and the inductance and capacitance of the boost converter connected to a PV array, respectively. Figure 9 shows that the local DC-bus voltage is a function of the reference current i ^ r e f P V and the input voltage v ^ g P V of the converter as follows
v ^ o = G v o d P V G c P V 1 + G c P V G i l d P V i ^ r e f P V + n u m P V s 1 + G c P V G i l d P V v ^ g P V
where n u m P V s = G v o g P V 1 + G c P V G i l d P V G c P V G i l g P V . Equation (27) represents the overall transfer function of a PV system connected to a boost converter with a current closed loop. This transfer function is used for analysing the stability of the PV array.

4.3. Model of Bidirectional Buck/Boost Converter with Storage Unit Controller

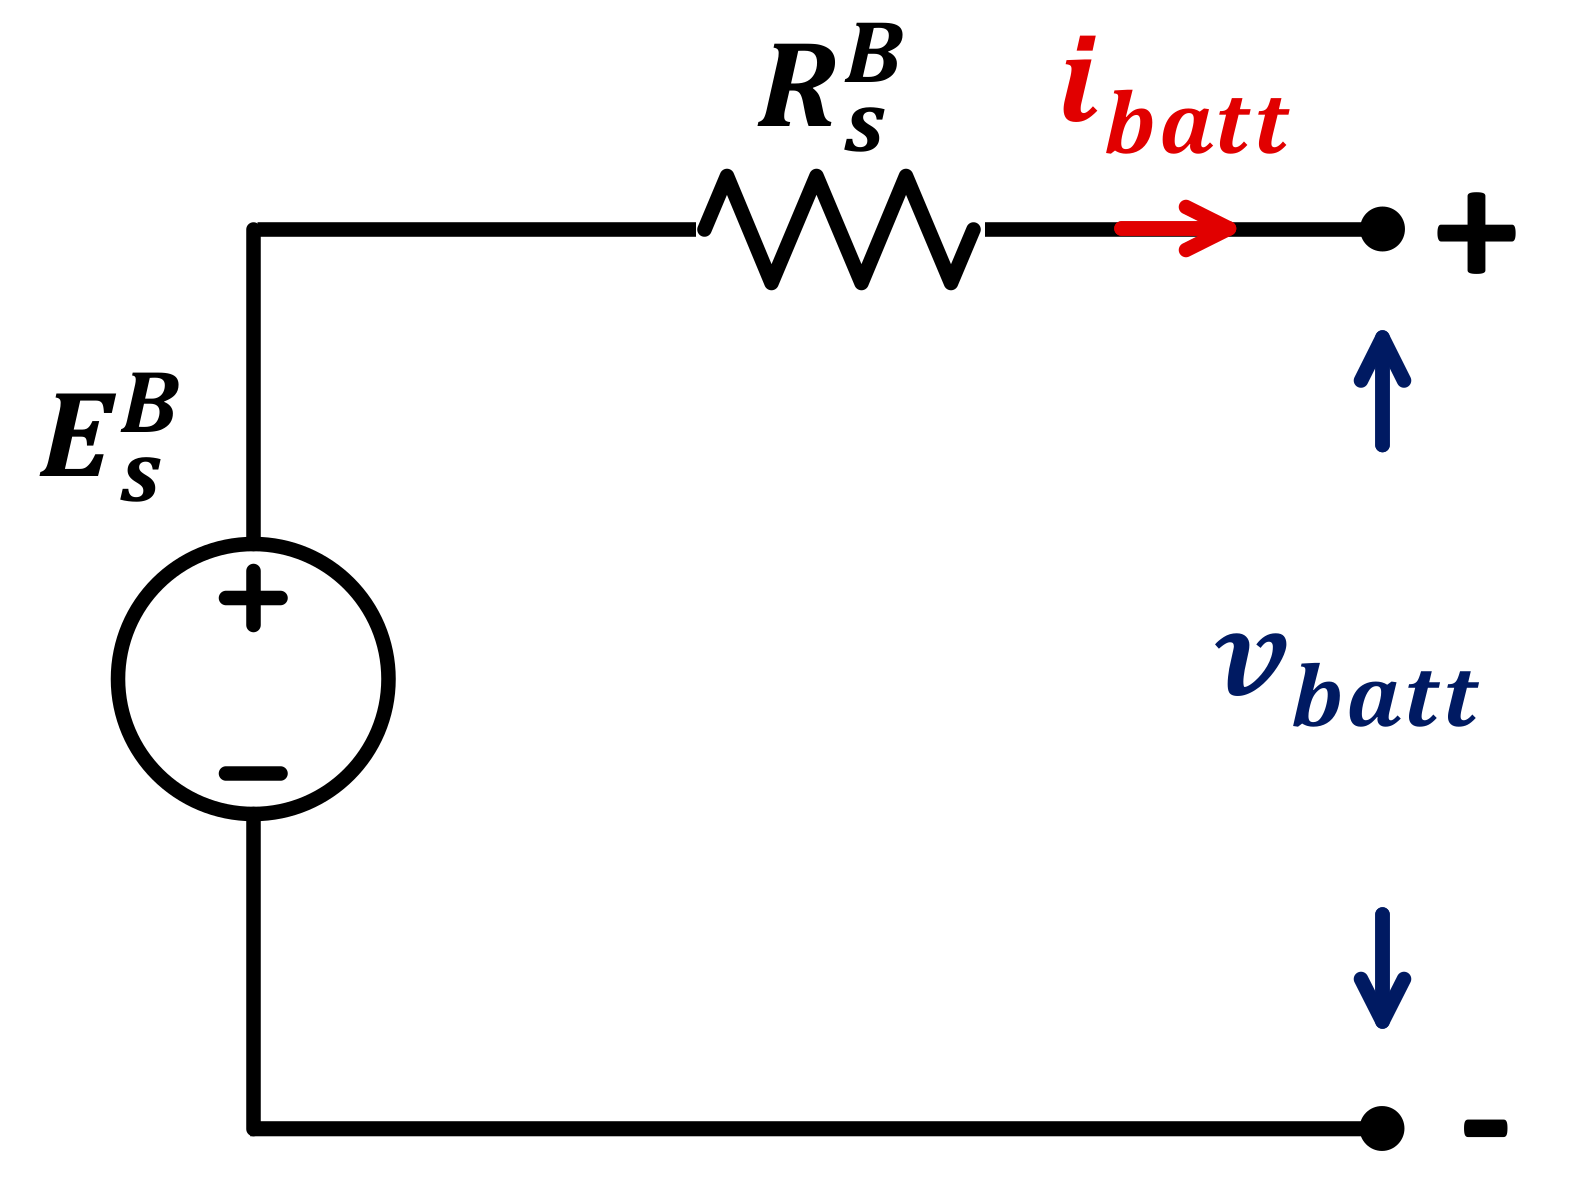
Many battery models are introduced in the literature with different degrees of complexity. Study [35] classified these models to electrochemical, experimental and electrical models. Among these categories, electrical models would be the better option to represent the batteries electrical characteristics. There are four types of batteries in the market: lead acid, nickel-cadmium, nickel-metal-hydride and lithium-ion. Lithium-ion batteries are used in large-scale applications for regulation and power management purposes [36]. The equivalent circuit of the battery model, as shown in Figure 10, could be applied for all battery types. This equivalent circuit includes a voltage source which is a function of the battery capacity Q c a p B and the battery current i b a t t at no load. In series with this voltage source, a resistor R s B is connected which represents the battery internal resistance. The battery output voltage and current are denoted as v b a t t and i b a t t , respectively. study [37] presented a dynamic model for the four battery types mentioned above.
The mathematical dynamic model of a Lead Acid battery is given in (28) and (29) for charging/discharging cycles, respectively.
v b a t t = E c h B i b a t t R s B where E c h B = E 0 Z Q c a p B i t 0.1 Q c a p B i f t Z Q c a p B Q c a p B i t i t + v e x p t
v b a t t = E d c h B i b a t t R s B where E d c h B = E 0 B Z B Q c a p B Q c a p B i t B i t B + i f t B + v e x p B t
where E c h B and E d c h B are the open-circuit voltage between battery terminals during charging and discharging, respectively. E 0 B is the battery constant voltage. Z B is the polarization constant. i t B is the actual battery charge ( i b a t t d t ) where i b a t t t is the battery current. i f t B is the battery filtered current via a low pass filter. v e x p B t is the exponential zone voltage which can be obtained from
d v e x p B d t = B c B i b a t t t v e x p B t + A c B   m t
where A c B and B c B are the amplitude of the exponential voltage zone and the inverse of the time constant of that zone. m t refers to the current mode of the battery ( m t = 0 for discharge and 1 for charge mode).
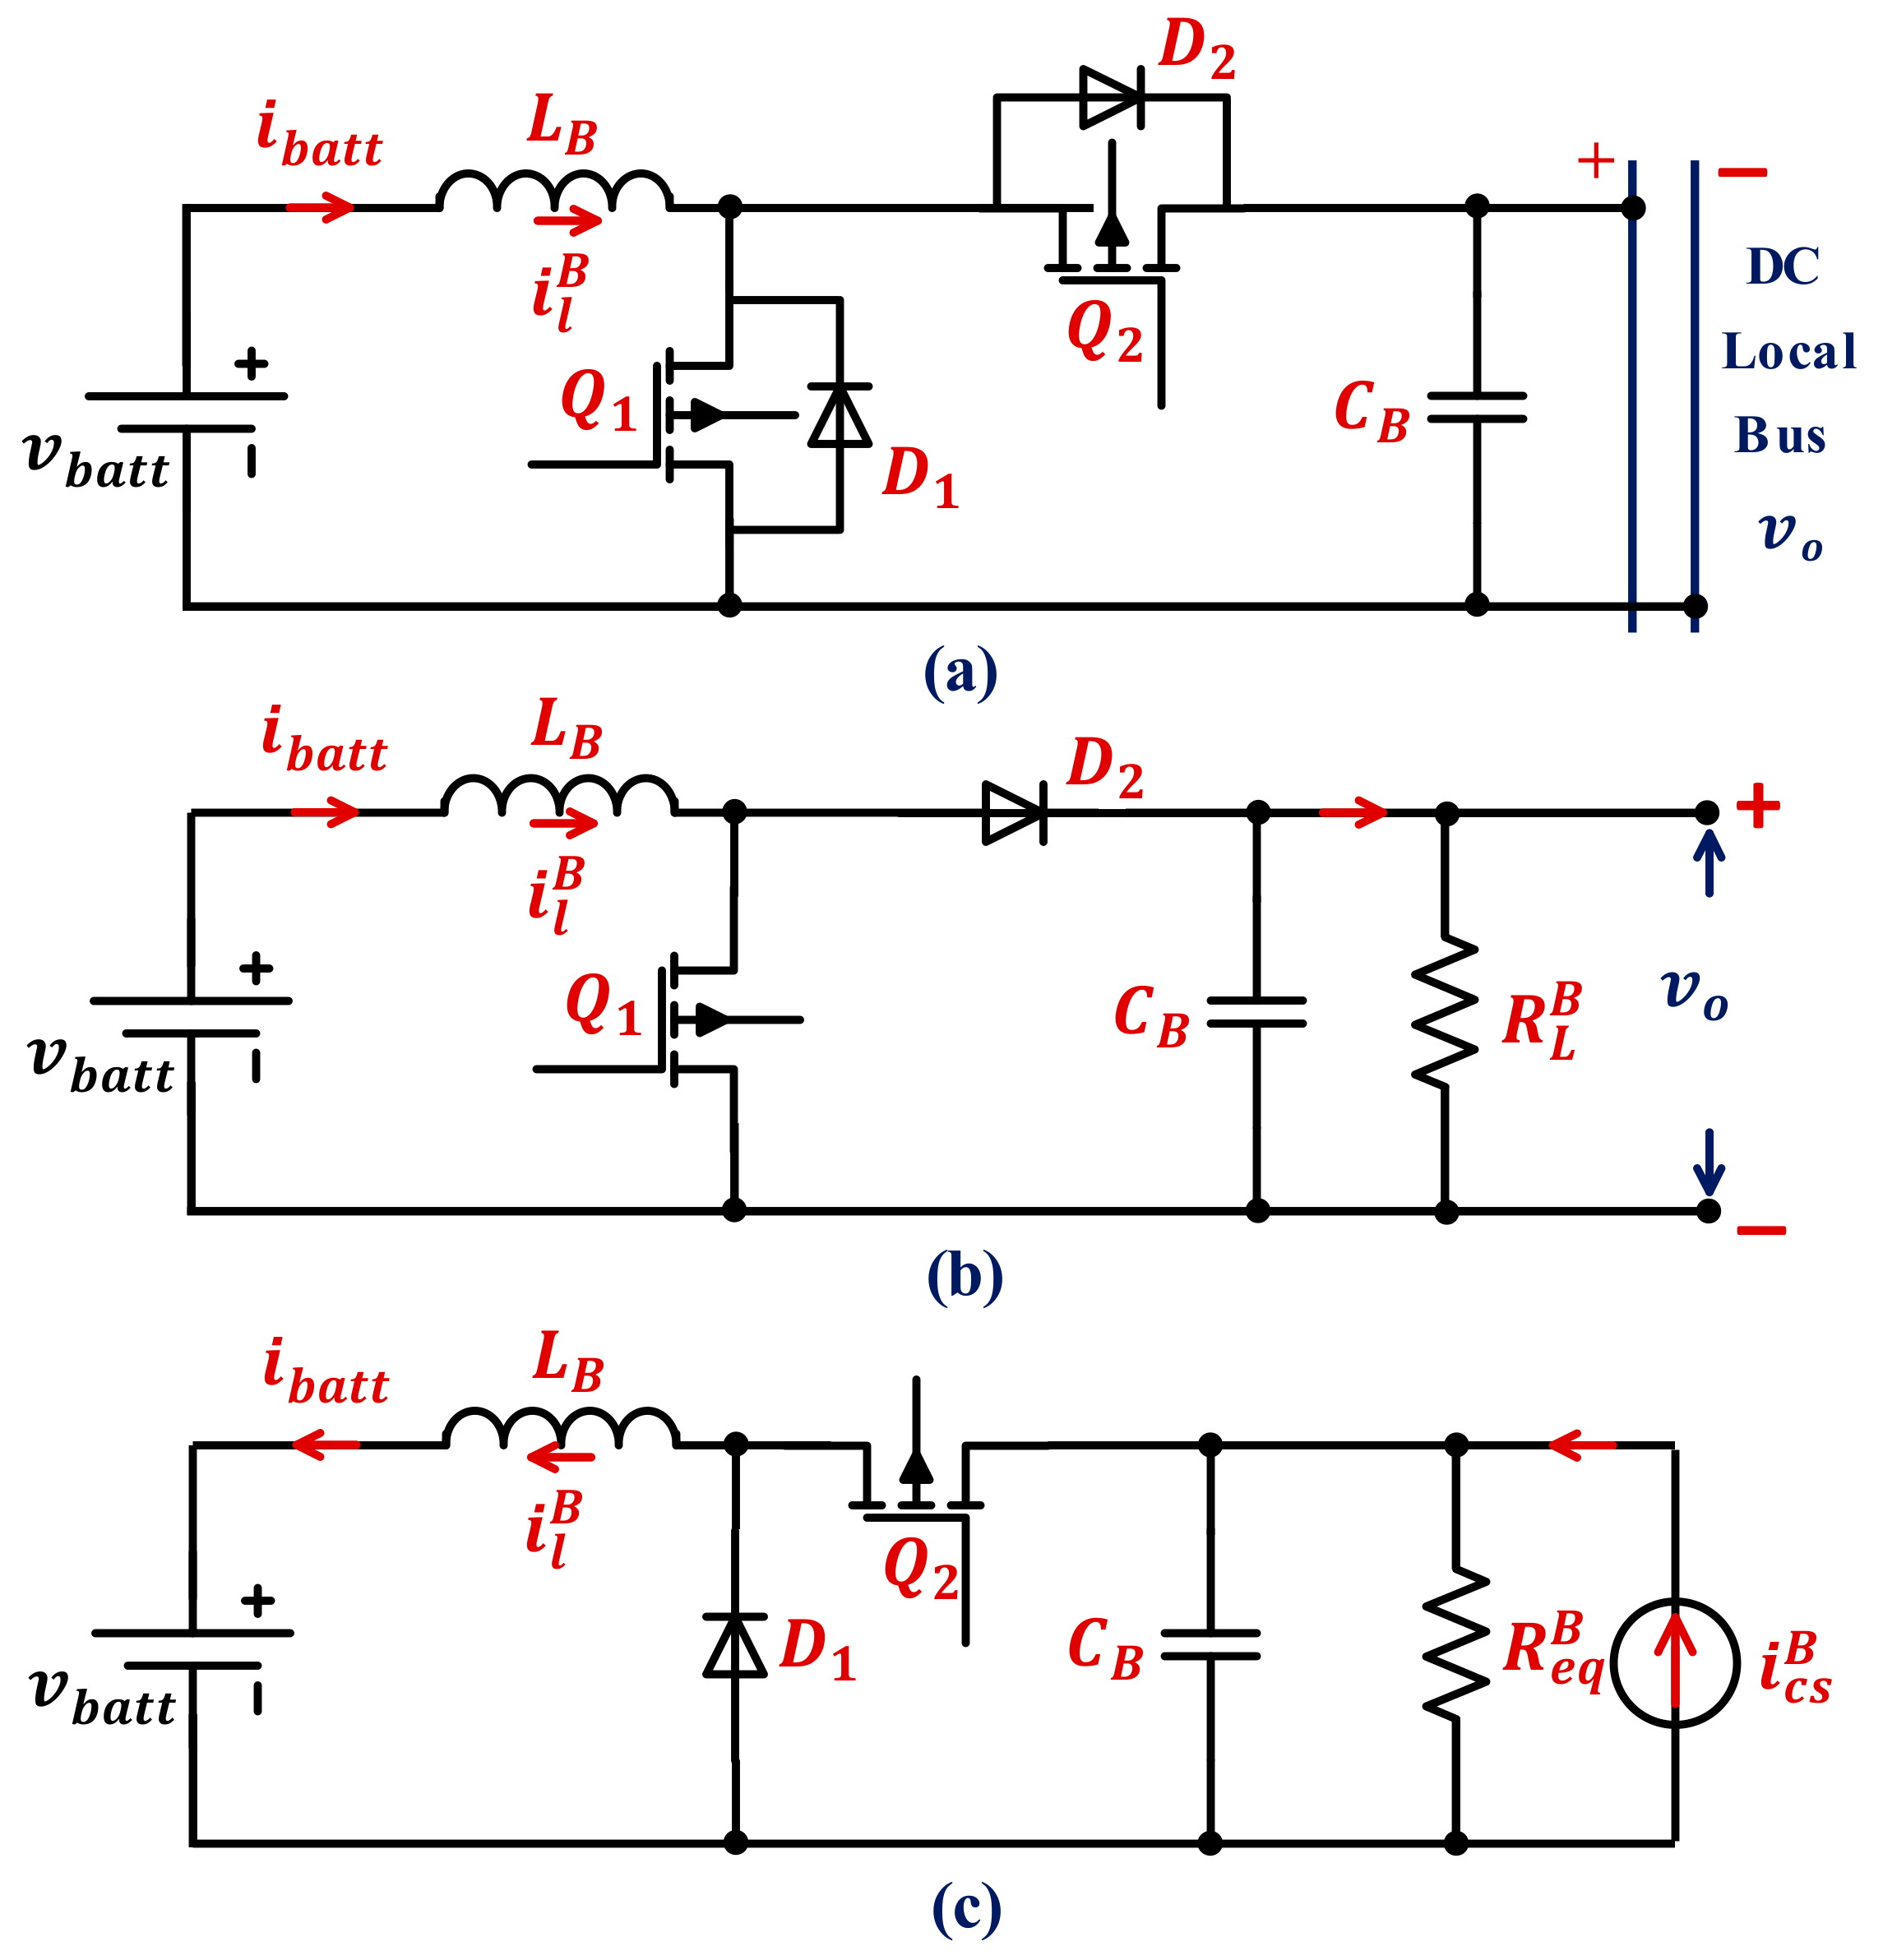
To protect the batteries against rapid degradation and for controlling the DC bus voltage, a control system with two cascaded loops is employed for controlling the charging and discharging processes of the battery via a DC/DC bidirectional converter. The outer loop regulates the DC-bus voltage using a PI-controller which provides a reference current for the inner loop. The inner loop regulates the delivered (discharge mode) or received (charge mode) current by the battery via providing the bi-directional converter with the duty cycle which applied to switch Q1 (see Figure 11) after a Pulse Width Modulation (PWM). The pulse applied to Q2 is the complement of that applied to the Q1. Turning the two switches Q1 and Q2 simultaneously would damage the converter, so proper dead time should be applied between the driving signals. The battery system is designed to work in two operation modes (charging and discharging) as an offshore islanded microgrid is considered which is supplied by unpredictable energy sources.
Figure 11 shows the bi-directional converter configuration with the converter configurations during discharging and charging mode. During step-up (discharging mode), Q2 is in off-state, and only the anti-parallel diode (D2) appeared as per Figure 11b. While Q1 will be in off-state during step-down (charging mode) and only (D1) is represented as per Figure 11c. Analysing the stability of the bidirectional converter requires deriving the mathematical dynamic models of the converter during boosting and bucking modes.
During discharge mode (see Figure 11b), the bi-directional converter is typically a boost converter with the battery system at the input (low-voltage side) and the load at the output (high-voltage side). Therefore, the current programmed boost converter model derived earlier by (15) can be applied for the bi-directional converter during discharging phase. This model is copied below, considering the designed parameters of the bi-directional converter. It is worth mentioning that the battery current is equal to the inductor current of the bi-directional converter (i.e., i b a t t = i l B )
G v o d B = v ^ o s d ^ B s = G d o B 1 s ω z B d e n B s G v o g B = v ^ o s v ^ g B s = G g o B 1 d e n B s G i l d B = i ^ l B s d ^ B s = 2 V o D ` B 2 R L B 1 + s 0.5 R L B C B d e n B s G i l g B = i ^ l B s v ^ g B = 1 D ` B 2 R L B 1 + s R L B C B d e n B s
where d e n B s = 1 + s Q B ω o B + s ω o B 2 , G d o B = V o D ` B , ω z B = D ` B 2 R L B L B , ω o B = D ` B L B C B , Q B = D ` B R L B C B L B , G g o B = 1 D ` B and D ` B = 1 D B . And V o , D B , L B and C B are steady-state values of the local bus voltage, duty cycle and the inductance and capacitance of the bi-directional converter connected to a battery system, respectively. Referring to (31) all transfer functions have the same denominator. This denominator implies that the converter is stable as all poles are located in the left-half plane where L B , C B , R L B and D B are positive values. Moreover, the transfer function at the first line of (31) shows a zero in the right half-plane. This zero has no impact on the system at low frequencies; however, it tends to destabilize the output voltage due to phase reversal which happens at high frequencies with a duty cycle step change.
During charging mode, the current in the inductor is reversed to be delivered from the load side to the battery. The dynamic model can be derived during this mode as follows. As described earlier, the battery system is connected to an islanded DC microgrid supplied by renewable energy resources (wind, tidal and solar). These energy sources are current-controlled for extracting the maximum power, i.e., they can be modelled using Norton theorem as a current source i c s B in parallel with an internal resistance R i B , where i c s B is the total current delivered by wind, solar and tidal generators, while R i B is the internal equivalent resistance of these energy sources. Figure 11c represents the DC/DC bidirectional converter during bucking mode with the battery system at the output and the current source at the input (high voltage side). To obtain the dynamic model of the bi-directional converter during charging mode, the circuit diagram of Figure 11c is analysed when Q2 is turned ON and OFF as follows.
To maintain the nomenclature of d B , the switch Q2 is activated while Q1 is switched off, and this could occur during the cycle period 1 d B T s B . The circuit diagram of Figure 12a is applied, which gives the system equations
L B d i l B d t = v o v g B C B d v o d t = i c s B v o R e q B i l B
where R e q B is the equivalent resistance of R L B and R i B in parallel.
Figure 12b shows the circuit diagram when Q2 is turned off and Q1 is active which occurs during d B T s B and gives the system equations
L B d i l B d t = v g B C B d v o d t = i c s B v o R e q B
Consider the converter switching frequency is f s B , then the switching cycle is T s B . To get the converter equation during the whole time period T s B , the average model of switching Equations in (32) and (33) is obtained as follows:
d i l B d t = 1 L B v o 1 d B v g B d v o d t = 1 C B i c s B v o R e q B i l B 1 d B
Equation (34) represents a nonlinear average model of the bidirectional DC/DC converter during charge mode. To obtain the steady-state values of the state variables ( i l B and v o ), one can put the derivative parts in (34) equal to zero which gives
V g B = 1 D B V o ,         I l B = 1 1 D B I c s B V o R e q B
Taylor expansion is applied for the nonlinear model of (34) to get the small-signal linearized model as per (36):
d i ^ l B d t = 1 L B D ` B v ^ o V o d ^ B v ^ g B d v ^ o d t = 1 C B i ^ c s B v ^ o R e q B D ` B i ^ l B I l B d ^ B
Taking Laplace to transform for (36) and using superposition theorem, i.e., put i ^ c s B and v ^ g B equal to zero, one can get the transfer functions of control d ^ B -to-output v ^ o and the line v ^ g B -to-output v ^ o during battery charge mode as per the first and second lines of (37), respectively, as follows:
G v o d B s = v ^ o d ^ B = V o D ` B 1 + 1 V o D ` B 2 I c s B V o R e q B s d e n B s   G i l d B = i ^ l B d ^ B = G d c 0 B 1 + V o C B 2 V o R e q B I c s B s d e n B s
where
G d c 0 B = 1 D ` B 2 2 V o R e q B I c s B
Moreover, the small-signal model (36) can be used to drive the control-to-inductor current ( G i l d B ) and line-to-inductor current ( G i l g B ) transfer functions as per third and fourth lines of (37), respectively, during charge mode.
The transfer functions of a bidirectional converter during discharging and charging phases have similar denominators as per (31) and (37). Therefore, the stability discussion held before for (31) stands for (37). The transfer function in the first line of (37) shows that there is a zero which could be in the right half or the left half-plane depending on the value of the total current supplied by the renewable energy sources comparing with the load current as follows:
i f   I c s B > V o R e q B ,       z e r o   a t   l e f t h a l f   p l a n e I c s B < V o R e q B ,       z e r o   a t   r i g h t h a l f   p l a n e
However, charge mode occurs only when the current source ( I c s B ) is higher than the load current ( V o / R e q B ) considering high internal impedance for all energy sources. In other words, this zero will be always at the left half-plane.
It is worth mentioning that the transfer functions in this figure must be defined as per the battery operation phase. In other words, transfer functions of (31) are used for the discharge model, while for the charge model the transfer functions of (37) are applied in Figure 13.
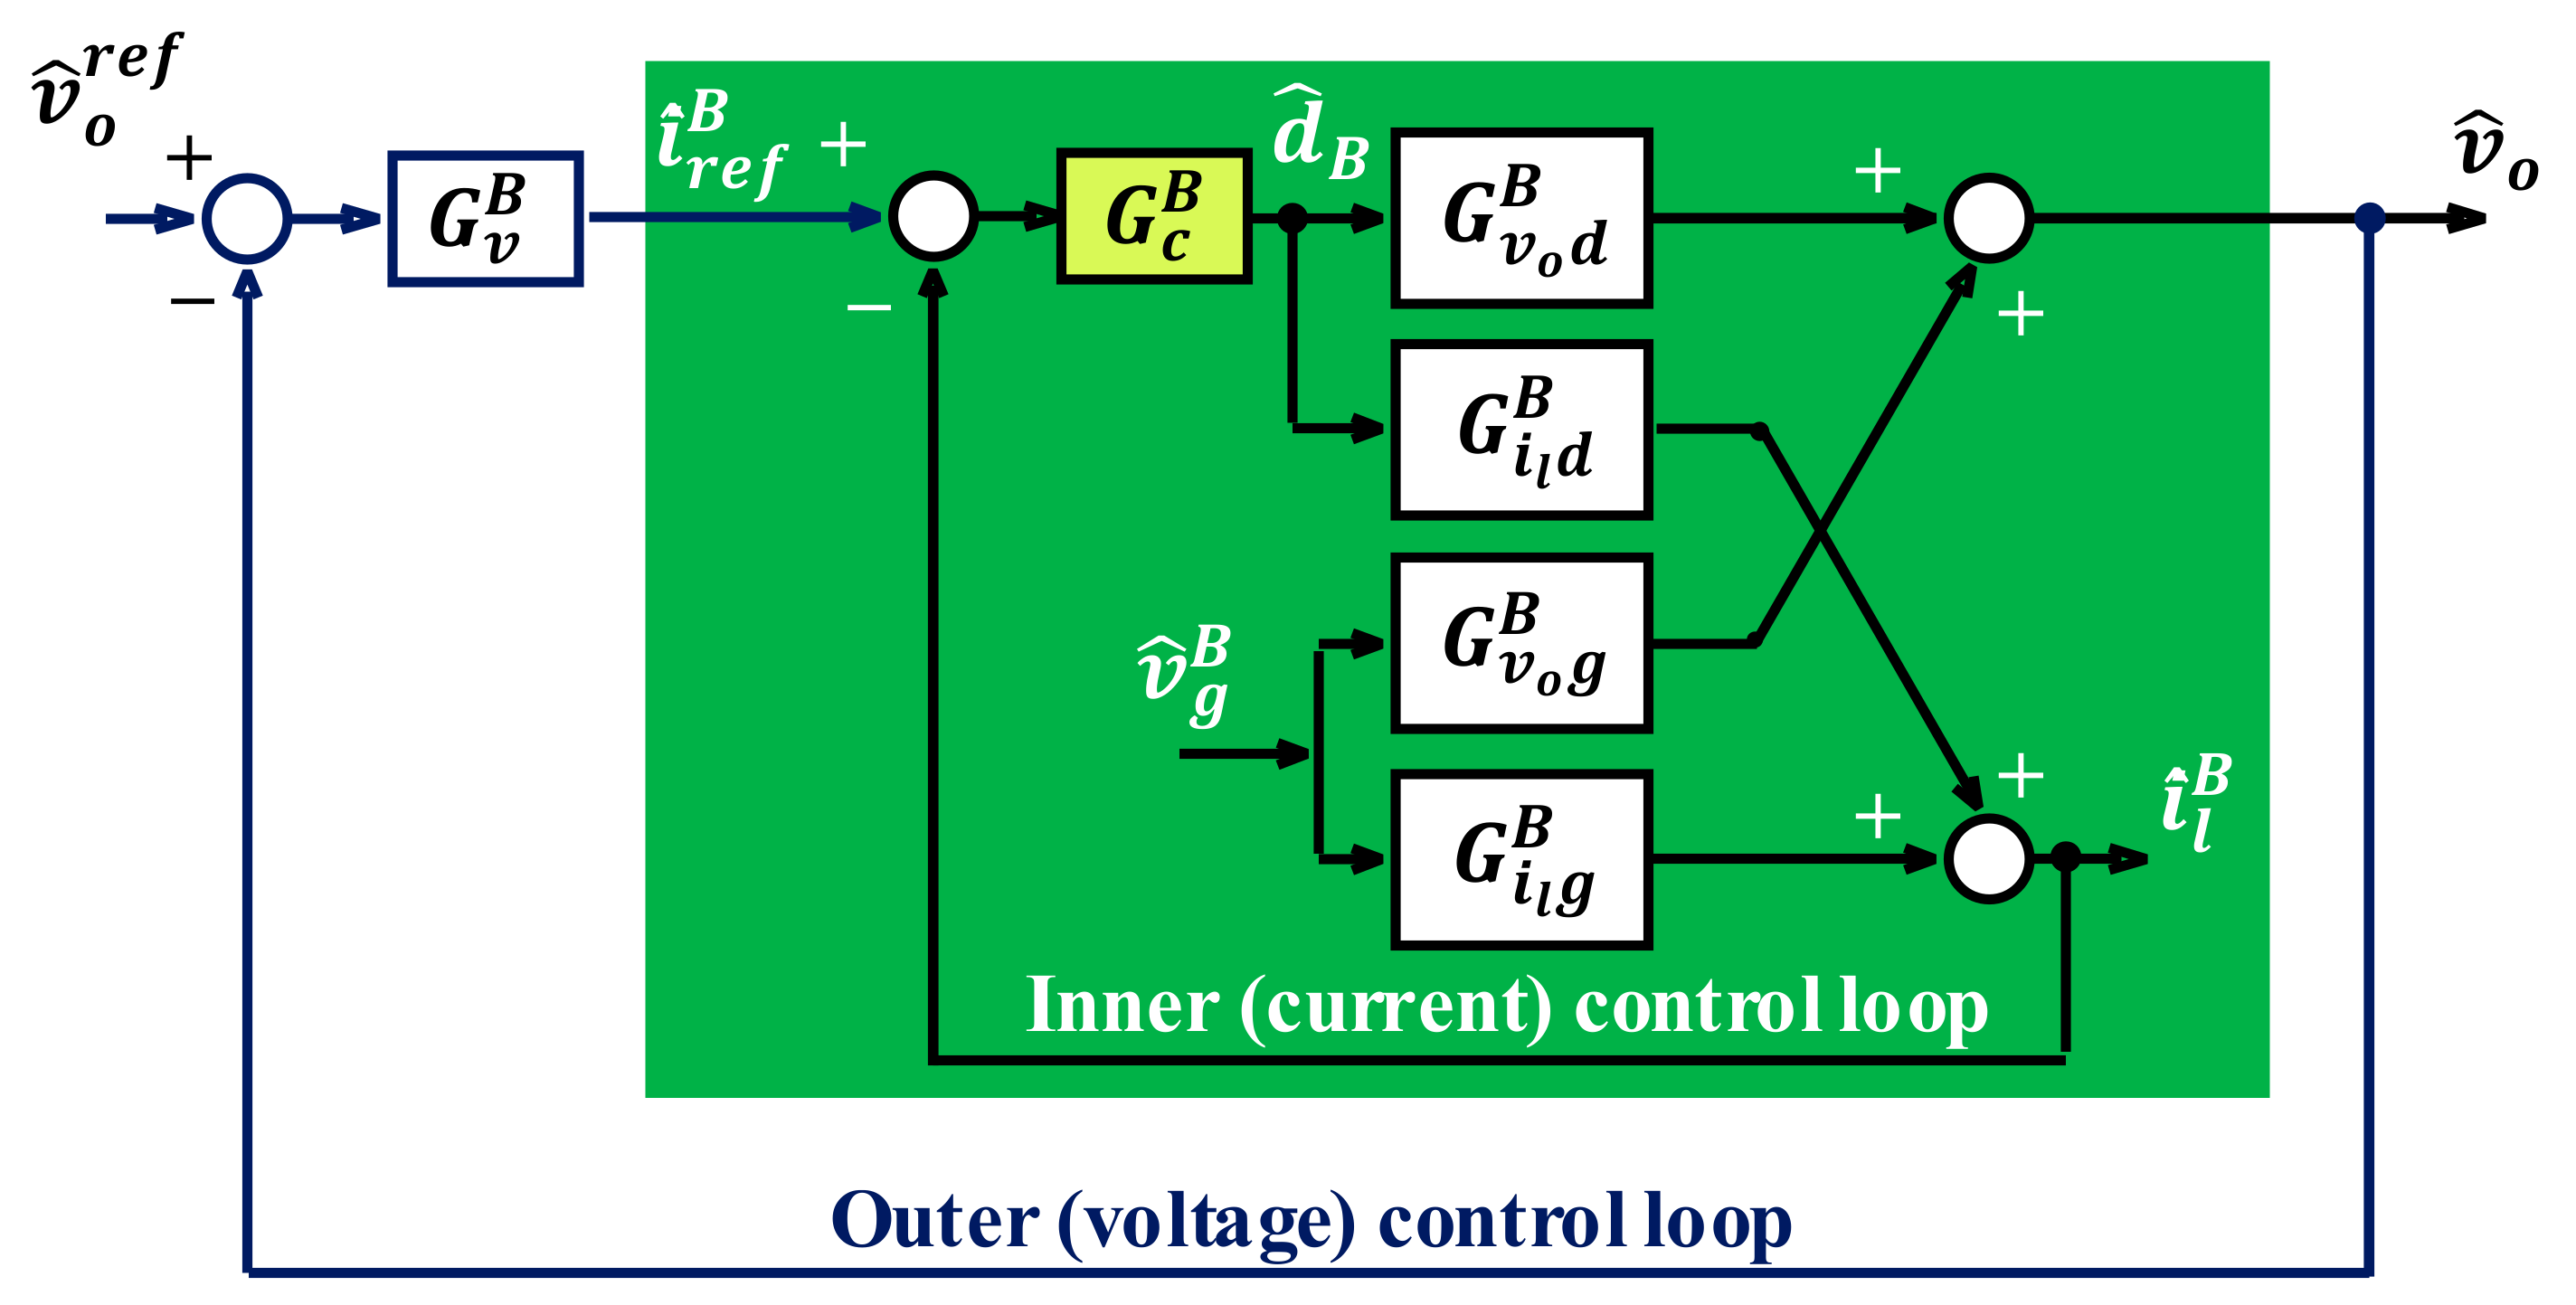
To regulate the local bus voltage v ^ o during different operation modes, a two closed loops control system is employed as described earlier in this section (see Figure 13). The converter model with the controller shows that the output voltage variations v ^ o depends on two independent ac variables which are the input voltage v ^ g B and reference voltage v ^ r e f B variations. The following section derives the mathematical equation which relates the output voltage with these inputs.
First, obtain the closed-loop transfer function of the inner loop while the outer voltage loop is open. The relationship between the output voltage variation and the input variations of i ^ r e f B and v ^ g B is derived earlier for the boost converter of the wind turbine as per Equation (19). This equation is copied here considering the two operation phases of the bi-directional converter as follows
v ^ o = G v o d B G c B 1 + G c B G i l d B i ^ r e f B + n u m B s 1 + G c B G i l d B v ^ g B
where
n u m B s = G v o g B 1 + G c B G i l d B G c B G i l g B
Equation (39) is derived for tuning the PI-controller of the outer loop using the inner closed-loop transfer function ( v ^ o / i ^ r e f B ) while the input voltage v ^ g B = 0 . To get the output voltage variation as a function of the reference voltage v ^ r e f B , and the input voltage v ^ g B , this can be achieved by applying superposition principle to the block diagram of Figure 13 which yields
v ^ o = G v o d B G c B G v B 1 + G c B G i l d B + G v o d B G c B G v B v ^ r e f B + G v o g B 1 + G c B G i l d B G v o d B G i l g B G c B 1 + G c B G i l d B + G v o d B G c B G v B v ^ g B Simplified   to   v ^ o = G C L _ v o r e f B v ^ r e f B + G C L _ v o g B v ^ g B
where G v B = k v B 1 + 1 s 1 T v B is PI-voltage controller transfer function with k v B and T v B which are the proportional and integral gains, respectively. It is important to highlight that the output voltage Equation (40) is valid for discharging and charging battery modes and so working on certain battery mode requires choosing the transfer functions derived for that mode.
Tuning the PI-controllers, G c B and G v B , of the inner and outer control loops can be achieved using pidtune command in Matlab. For tuning the inner loop controller G c B , the open-loop transfer function G i l d B is considered, while the open-loop transfer function ( v ^ o / i ^ r e f B ), which is the inner closed loop as per (40), is used for tuning the outer controller, G v B . To analyze the stability and the transient behavior of the proposed controller, one should analyze the location of the poles and the zeros of G C L _ v o r e f B and G C L _ v o g B as presented in following section.

4.4. Overall Model of a Single Floating Energy Unit

Figure 14 illustrates the overall model of a single floating structure comprises a wind turbine, tidal turbine, solar array and a battery system connected to a local DC bus. Each energy source has a current loop for MPPT, while the battery system has a cascaded voltage and current loops for controlling the voltage of the local DC bus. Figure 14 implies that the DC-bus voltage v ^ o at a floating turbine depends on the variations on wind speed v ^ w , tidal speed v ^ T and solar irradiance represented by the current reference i ^ r e f P V and the reference voltage of the DC-bus v ^ r e f B . This can be written a mathematical form as follows
v ^ o = f P W m Q c w K t v w 1 + Q c w Z w G s w G v o d w G c w 1 + G c w G i l d w v ^ w + f P T m Q c T K t v T 1 + Q c T Z T G s T G v o d T G c T 1 + G c T G i l d T v ^ T + G v o d P V G c P V 1 + G c P V G i l d P V i ^ r e f P V + G v o d B G c B G v B 1 + G c B G i l d B + G v o d B G c B G v B v ^ r e f B + G v o g B 1 + G c B G i l d B G v o d B G i l g B G c B 1 + G c B G i l d B + G v o d B G c B G v B v ^ g B + n u m T s 1 + G c T G i l d T v ^ g T + n u m w s 1 + G c w G i l d w v ^ g w + n u m P V s 1 + G c P V G i l d P V v ^ g P V
Equation (41) shows that the stability of the voltage at the local bus of a floating structure depends on the characteristic equations (i.e., the denominators of all the transfer functions between v ^ o and v ^ w , v ^ T , i ^ r e f P V , v ^ r e f B , v ^ g B , v ^ g T , v ^ g w and v ^ g P V which are
1 + Q c w Z w 1 + G c w G i l d w = 0 1 + Q c T Z T 1 + G c T G i l d T = 0 1 + G c B G i l d B + G v o d B G c B G v B = 0 1 + G c P V G i l d P V = 0 1 + G c T G i l d T = 0 1 + G c w G i l d w = 0 1 + G c P V G i l d P V = 0
Applying the Routh–Hurwitz stability criterion, for the closed-loop transfer function of a system to be stable, the characteristic equation of that system must have all zeros on the left half-plane. Regarding the characteristic equations at the first and second lines of (42), to ensure that have all zeros on the left half-plane, one should ensure that the numerators of both terms have positive coefficients. The term 1 + G c w G i l d w has positive coefficients as the transfer functions G c w and G i l d w has positive coefficients. Similarly, this analysis is held for the characteristic equations with similar term as for those in the fourth to seventh lines of (42). The term 1 + Q c w Z w is expanded to show its coefficients which yields
1 + Q c w Z w = g 3 s 3 + g 2 s 2 + g 1 s + g 0 = 0
where
g 3 = J m w L q s w L d s w g 2 = J m w L q s w + L d s w R s w + B m w L q s w L d s w g 1 = J m w R s w 2 + P p w L d s w ω m 0 w P p w L q s w ω m 0 w + B m w L q s w + L d s w R s w + L q s w P p w L q s w i q s 0 w 1.5 P p w L d s w L q s w i q s 0 w L d s w P p w L d s w i d s 0 w 1.5 P p w Ψ r w + L d s w L q s w i d s 0 w g 0 = B m w R s w 2 + P p w L d s w ω m 0 w P p w L q s w ω m 0 w + R s w P p w L q s w i q s 0 w P p w L q s w ω m 0 w P p w L d s w i d s 0 w 1.5 P p w L d s w L q s w i q s 0 w R s w P p w L d s w i d s 0 w + P p w L d s w ω m 0 w P p w L q s w i q s 0 w 1.5 P p w Ψ r w + L d s w L q s w i d s 0 w
The steady-state currents i q s 0 w and i d s 0 w are negative for PMSG. The coefficients g 3 and g 2 are positive values for both SPMSG and IPMSG. First, considering SPMSG (i.e., i d s 0 w = 0 and L d s w L q s w = 0 ), this means that g 1 is positive as the third and fourth terms of g 1 will be zero. g 0 has a positive sign as the third term goes to zero. Secondly, if IPMSG is considered (i.e., L d s w L q s w ), then the third term of g 1 will turn to negative due to the negative sign of i q s 0 w , and the fourth term will turn positive. Similarly, the third term of g 0 will turn to positive while the sign of the second term of this coefficient will be positive if ( P p w ω m 0 w L d s w i d s 0 w > R s w i q s 0 w ). The same analysis is applied to the characteristic equation of the tidal turbine in the second line of (42).
It is required to analyse the floating structure voltage stability during discharging and charging phases separately. The characteristic equation in the third line of (42) is considered. During discharging phase, the transfer functions of (31) are used to extract the coefficients of this characteristic equation
1 + G c B G i l d B + G v o d B G c B G v B = n 4 s 4 + n 3 s 3 + n 2 s 2 + n 1 s + n 0 = 0
where
n 4 = T c B T v B ω o B 2 n 3 = T c B T v B Q B ω o B + V o T c B T v B K c B C B D ` B 2 V o K c B K v B T c B T v B L B D ` B 3 R L B n 2 = T c B T v B + V o K c B K v B T c B T v B D ` B + 2 V o T v B K c B T c B + 0.5 R L B C B D ` B 2 R L B V o L B T c B + T v B K c B K v B D ` B 3 R L B n 1 = 2 V o T v B K c B D ` B 2 R L B + V o T c B + T v B K c B K v B D ` B V o L B K c B K v B D ` B 3 R L B n 0 = V o K c B K v B D ` B
Therefore, the stability of the local voltage of a floating structure during battery discharge mode requires all coefficients n 0 to n 4 to be positive and so choosing the parameters of the PI-controllers must avoid the critical values which make the system unstable as per n 2 and n 3 .
Similarly, the coefficients of the characteristic equation during battery charging mode can be obtained using the transfer functions of (37) as follows
1 + G c B G i l d B + G v o d B G c B G v B = m 4 s 4 + m 3 s 3 + m 2 s 2 + m 1 s + m 0 = 0
where
m 4 = T c B T v B ω o B 2 m 3 = T c B T v B Q B ω o B K c B T c B T v B V o C B D ` B 2 + K c B K v B T c B T v B D ` B 3 I c s B V o R e q B m 2 = T c B T v B + K c B K v B T c B T v B V o D ` B + K c B K v B T c B + T v B D ` B 3 I c s B V o R e q B K c B T c B T v B D ` B 2 2 V o R e q B I c s B K c B T v B V o C B D ` B 2 m 1 = K c B K v B T c B + T v B V o D ` B + K c B K v B D ` B 3 I c s B V o R e q B K c B K v B D ` B 2 2 V o R e q B I c s B m 0 = K c B K v B V o D ` B
For the system to be stable during the charging phase, all coefficients m 4 to m 1 have to be positive. Therefore, tuning the controller parameters must fulfil this stability requirement.

4.5. Model of n-Parallel Floating Energy Units with IACS Controller

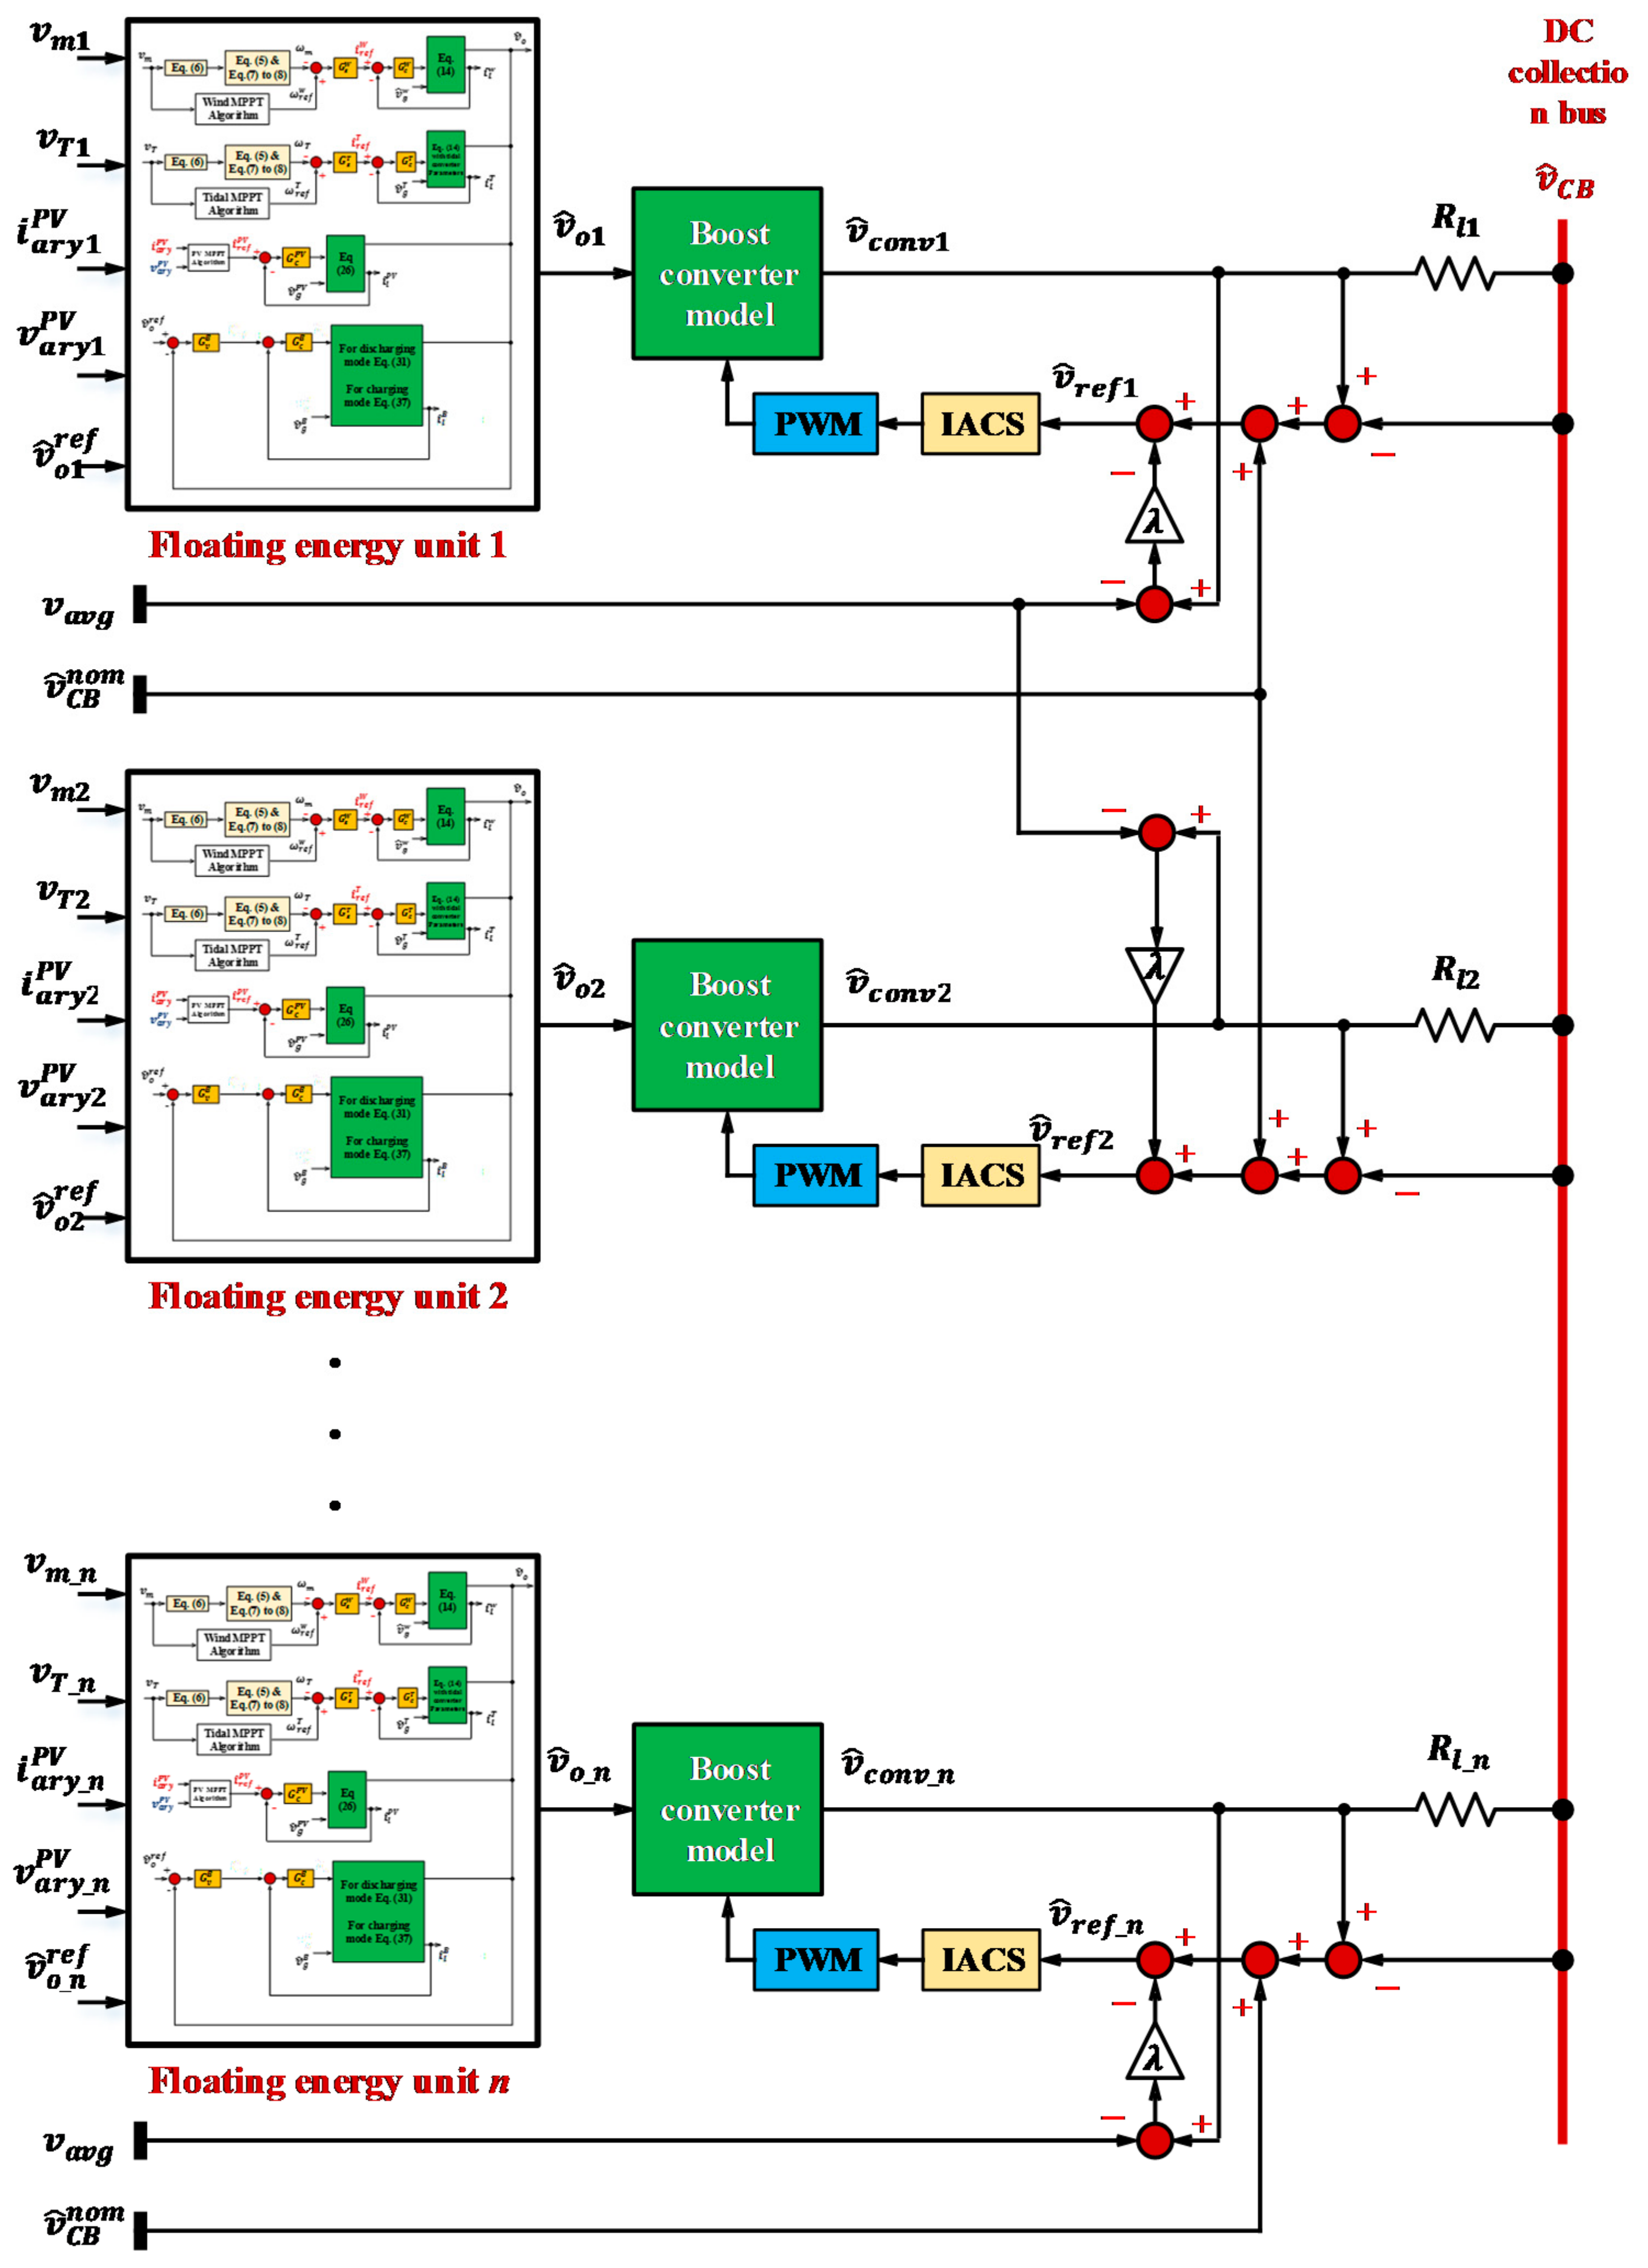
Figure 15 shows the model of an offshore LVDC-microgrid comprises n-floating structures which connected to a DC-collection bus via a boost converter and transmission line with resistance R l i . v ^ C B n o m refers to the nominal voltage of the DC-collection bus, while v ^ C B is the measured voltage of the collection bus.
Description of IACS and its stability analysis with n-parallel connected boost converter is introduced in a different study for the author. IACS controller is used to control the boost converter (position 2) for minimizing the circulating current among the floating structures due to the different line impedances. Moreover, it is used for disturbance rejection and maintaining the DC-collection voltage fixed at the nominal value. The stability of the whole DC-microgrid is guaranteed as the stability of each floating structure is analysed earlier in this study and considering the stability of n-parallel boost converter with IACS is also analysed in a different study by the author.

5. Simulation Results

The simulation section is divided into two parts. The first part is to show the dynamic performance of a single floating energy unit comprises a wind turbine (3 MW), two tidal turbines (2 MW), a solar PV array (327 kW) and a battery system. It also shows the performance of the battery controller to maintain the output voltage of a single floating unit fixed at different operating conditions. Resistive and inductive loads are considered as the MUP loads are mainly lighting and feeding system-based motors. The second part analyses the dynamic performance of a 2-parallel connected floating energy unit with/without considering the IACS controller applied. The simulation parameter list for the wind, tidal, solar and bidirectional converter is provided in Appendix A.

5.1. Part I: Single Floating Energy Unit

This part shows the dynamic performance of a single floating energy unit at normal operating condition, deficit energy supply, load shedding and fault condition.

5.1.1. Case a: RES with Surplus Energy (Normal Operation)

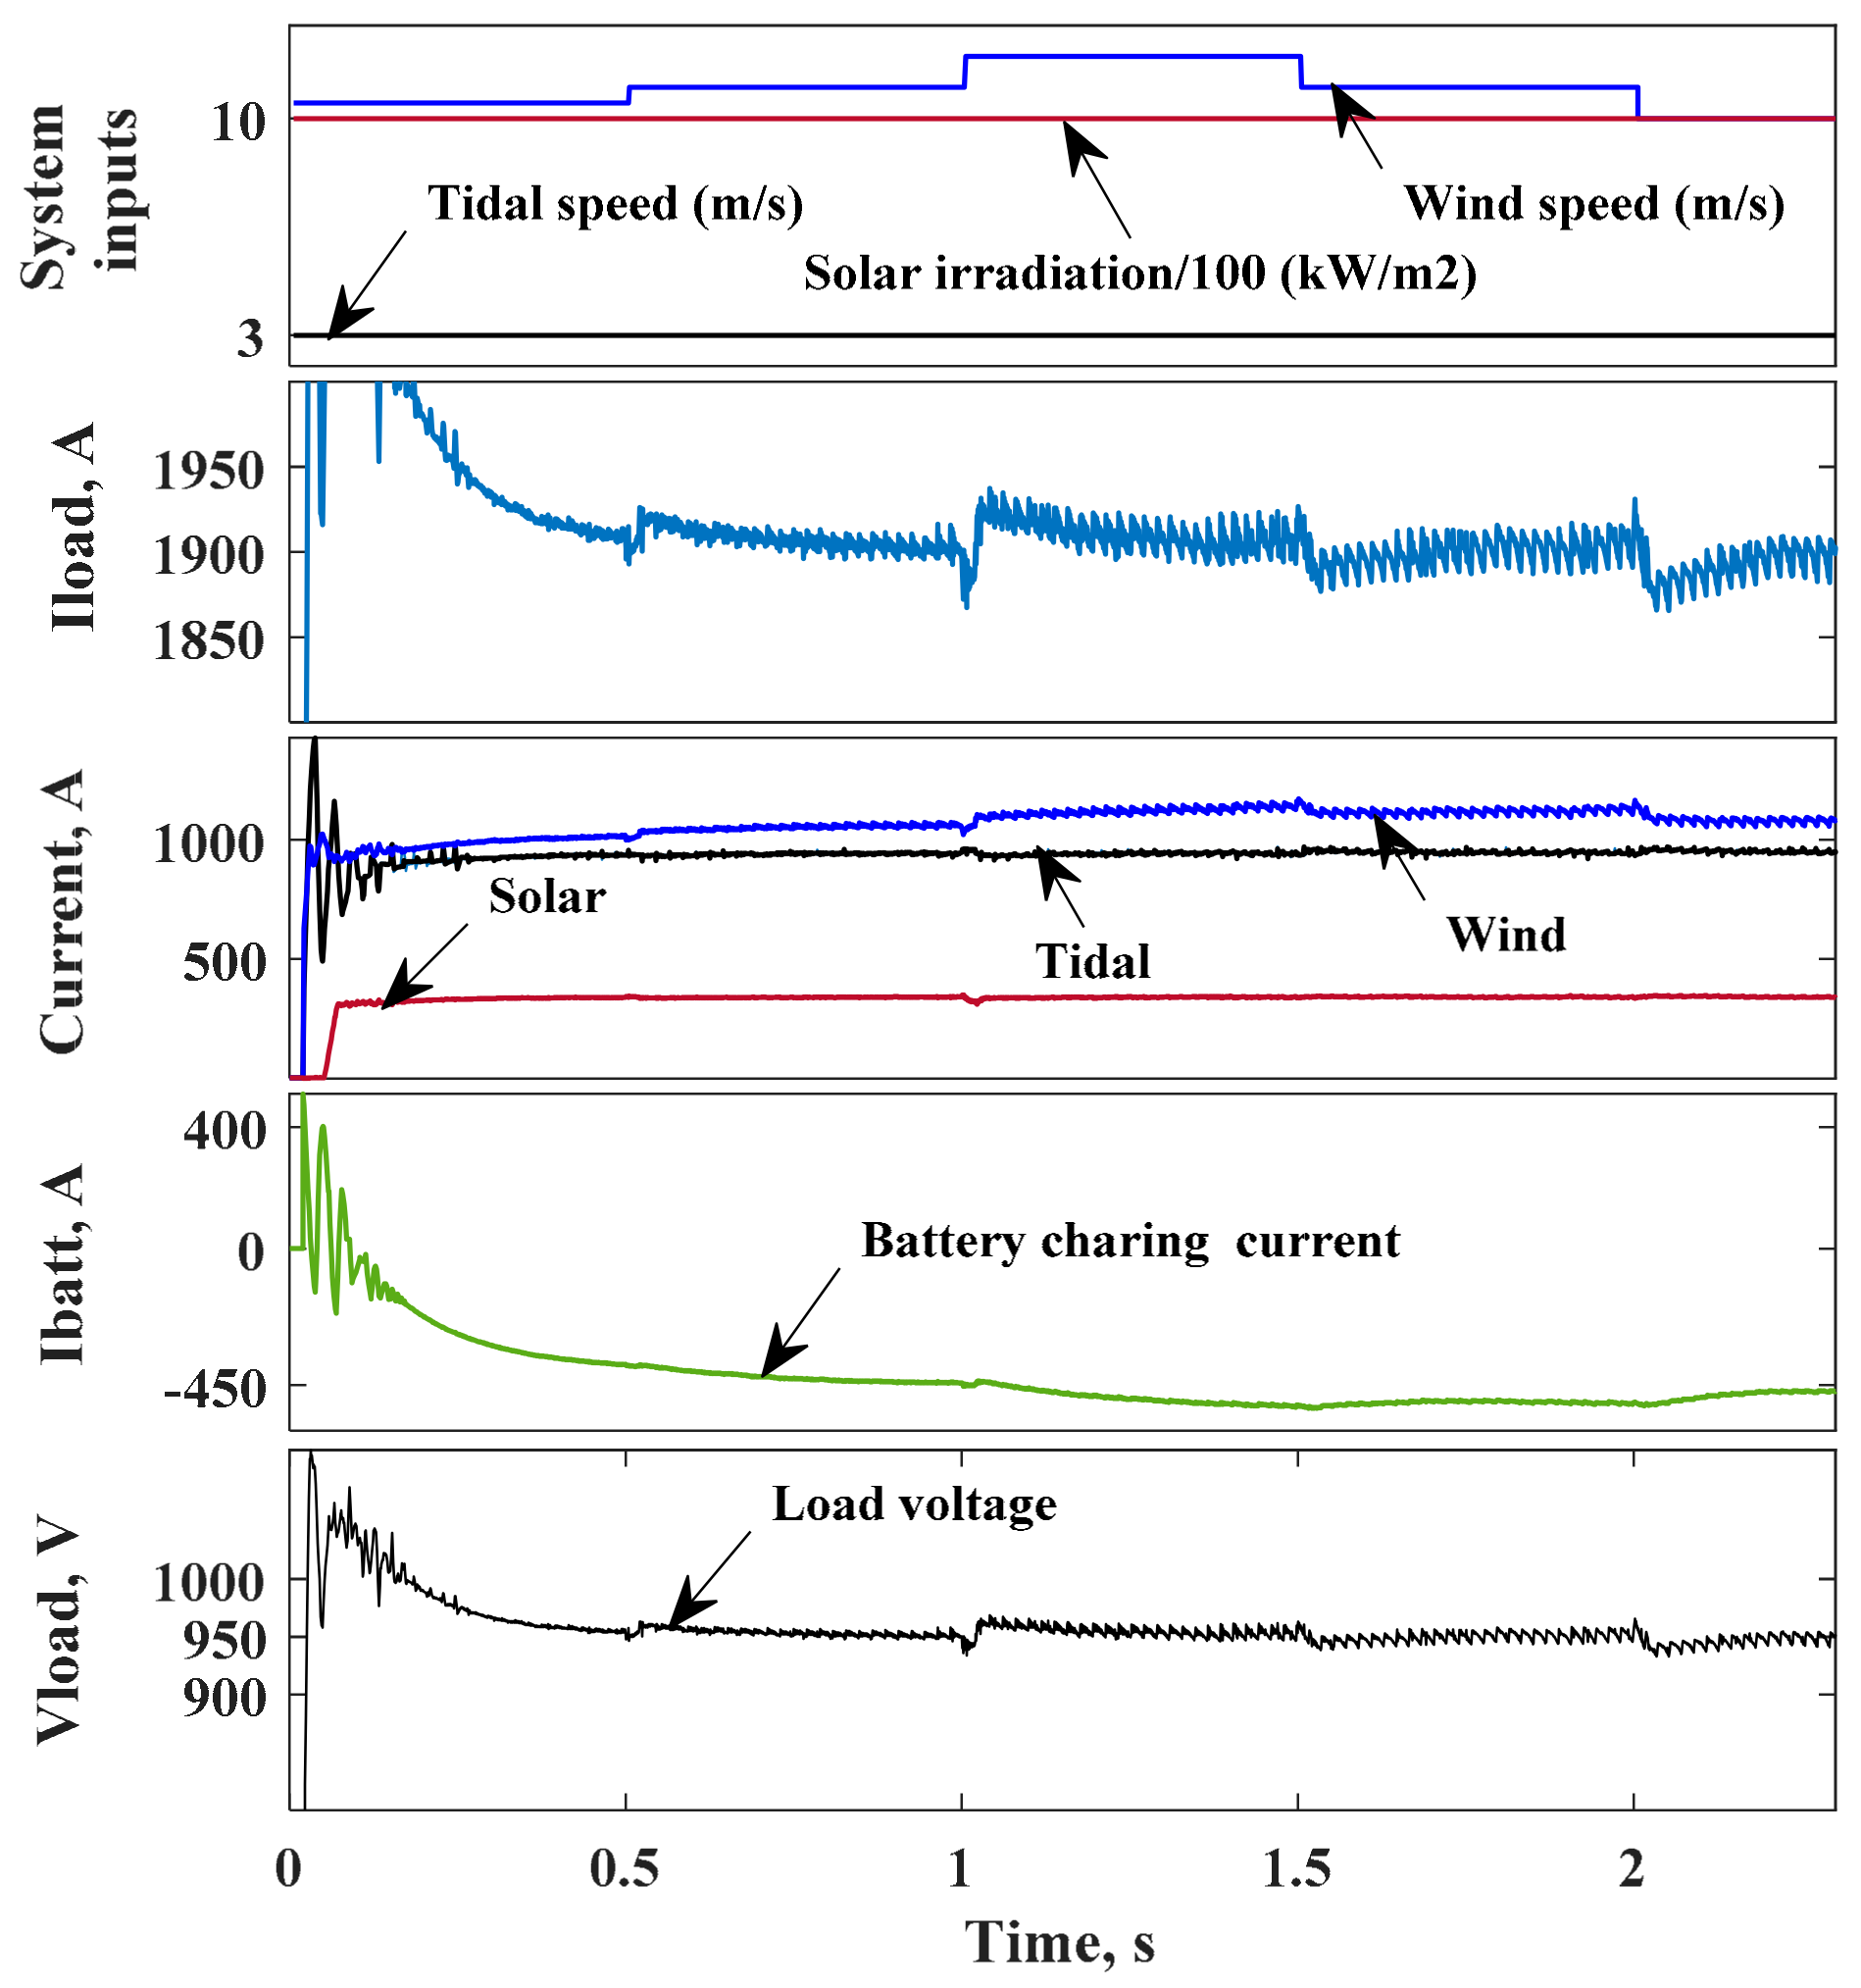
In this case, RES deliver enough energy to cover the load demand ( R l o a d = 0.5 ) , while the battery system is in charging mode or fully charged. This test considers variable wind speed to show the intermittent nature of the wind energy while solar and tidal energy supply the rated power. The simulation is run for 2.3 s. Figure 16 shows the load current is satisfied by the RES while the surplus energy is supplied to the battery. The load voltage is regulated at the nominal voltage using the battery charging/discharging controller. Although there is voltage overshoot and undershoot due to wind speed step change, the figures show stable operation with load voltage regulated within the acceptable limits.

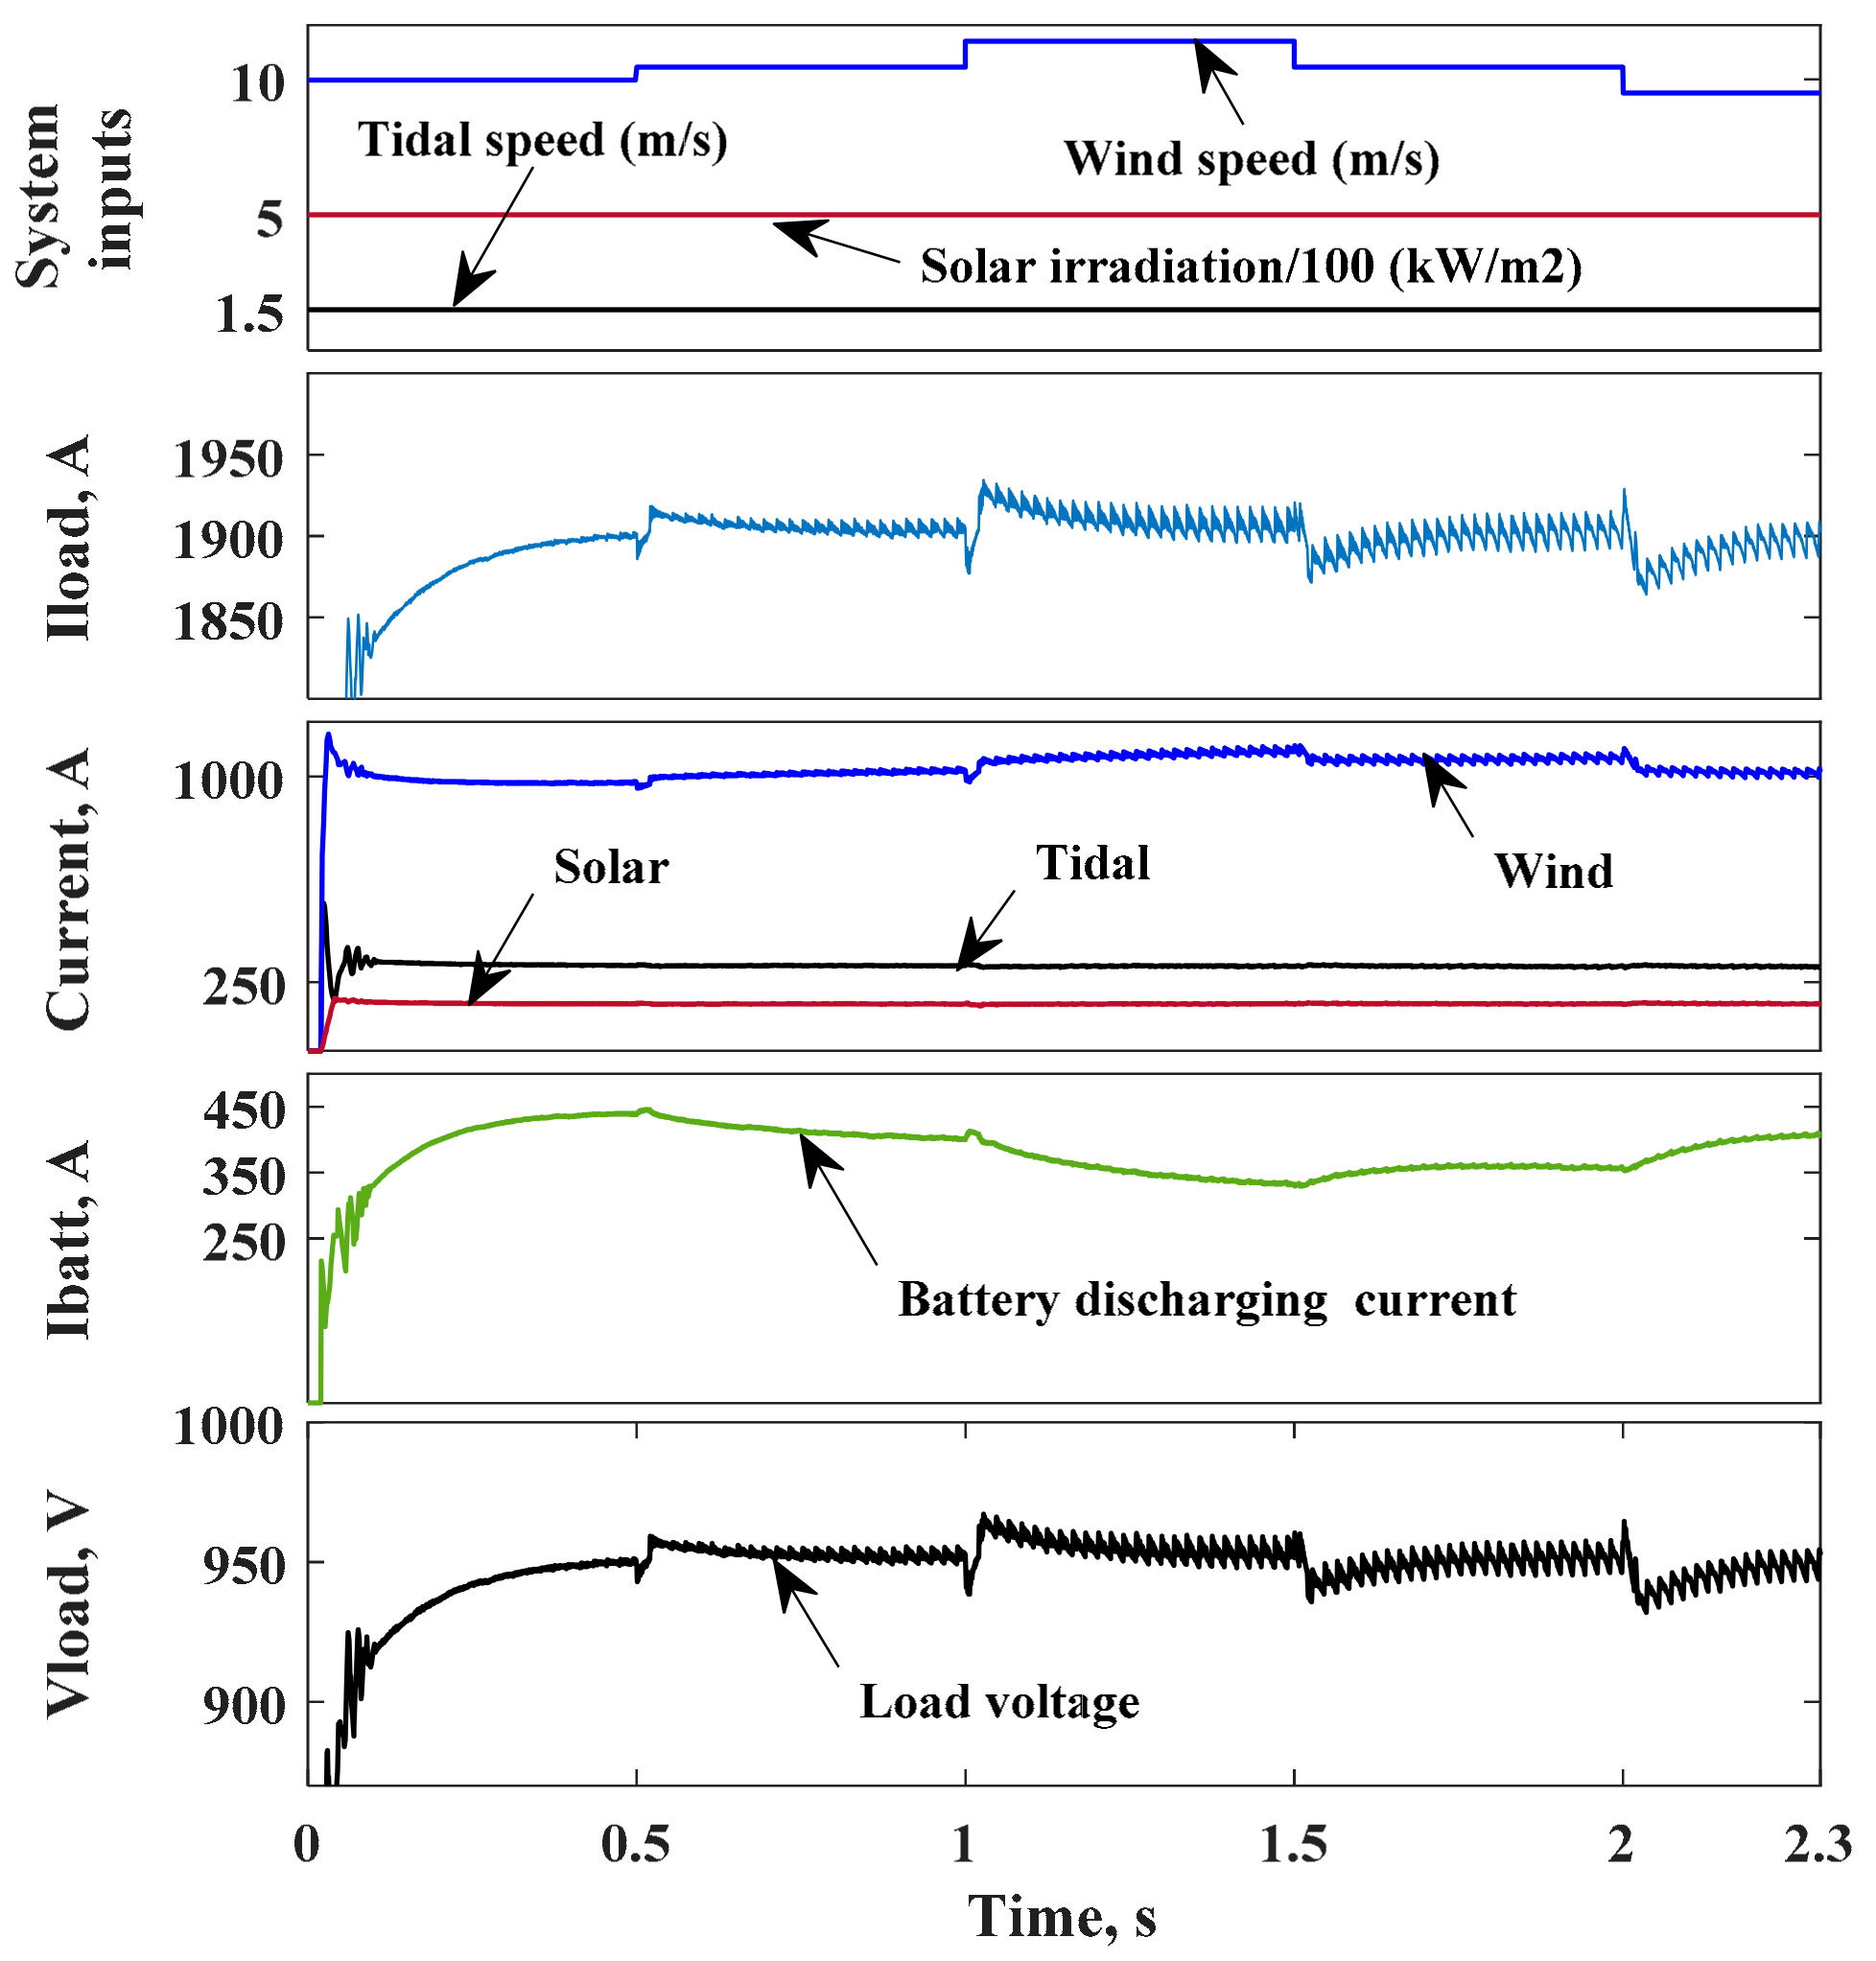
5.1.2. Case b: RES with Lower Energy Supply (Deficit Energy)

When the RES supplies power lower than the demand load, then both the battery system and the RES will supply the required load. The same load ( R l o a d = 0.5 ) is considered as in case-a, with lower energy supplied by the tidal turbine and the solar array. Wind turbine works at variable wind speeds but with lower energy output comparing with case-a. Figure 17 shows the load current is supplied by the RES and battery due to the deficit energy in the RES. The load voltage is regulated at the nominal voltage using the battery charging/discharging controller. Although there is voltage overshoot and undershoot due to wind speed step change, the figures show stable operation with load voltage regulated within the acceptable limits. The transient overshoot at the starting which appeared in case-a is not seen in case-b due to the limited energy supplied from the RES. The battery current plot shows discharging current to support the load voltage via balancing the input supply power with the output load power. However, this mode of operation is considered for a short time before load shedding as the battery storage is designed only to meet the emergency load demand.

5.1.3. Case c: RES with Zero Energy Supply (Load Shedding)

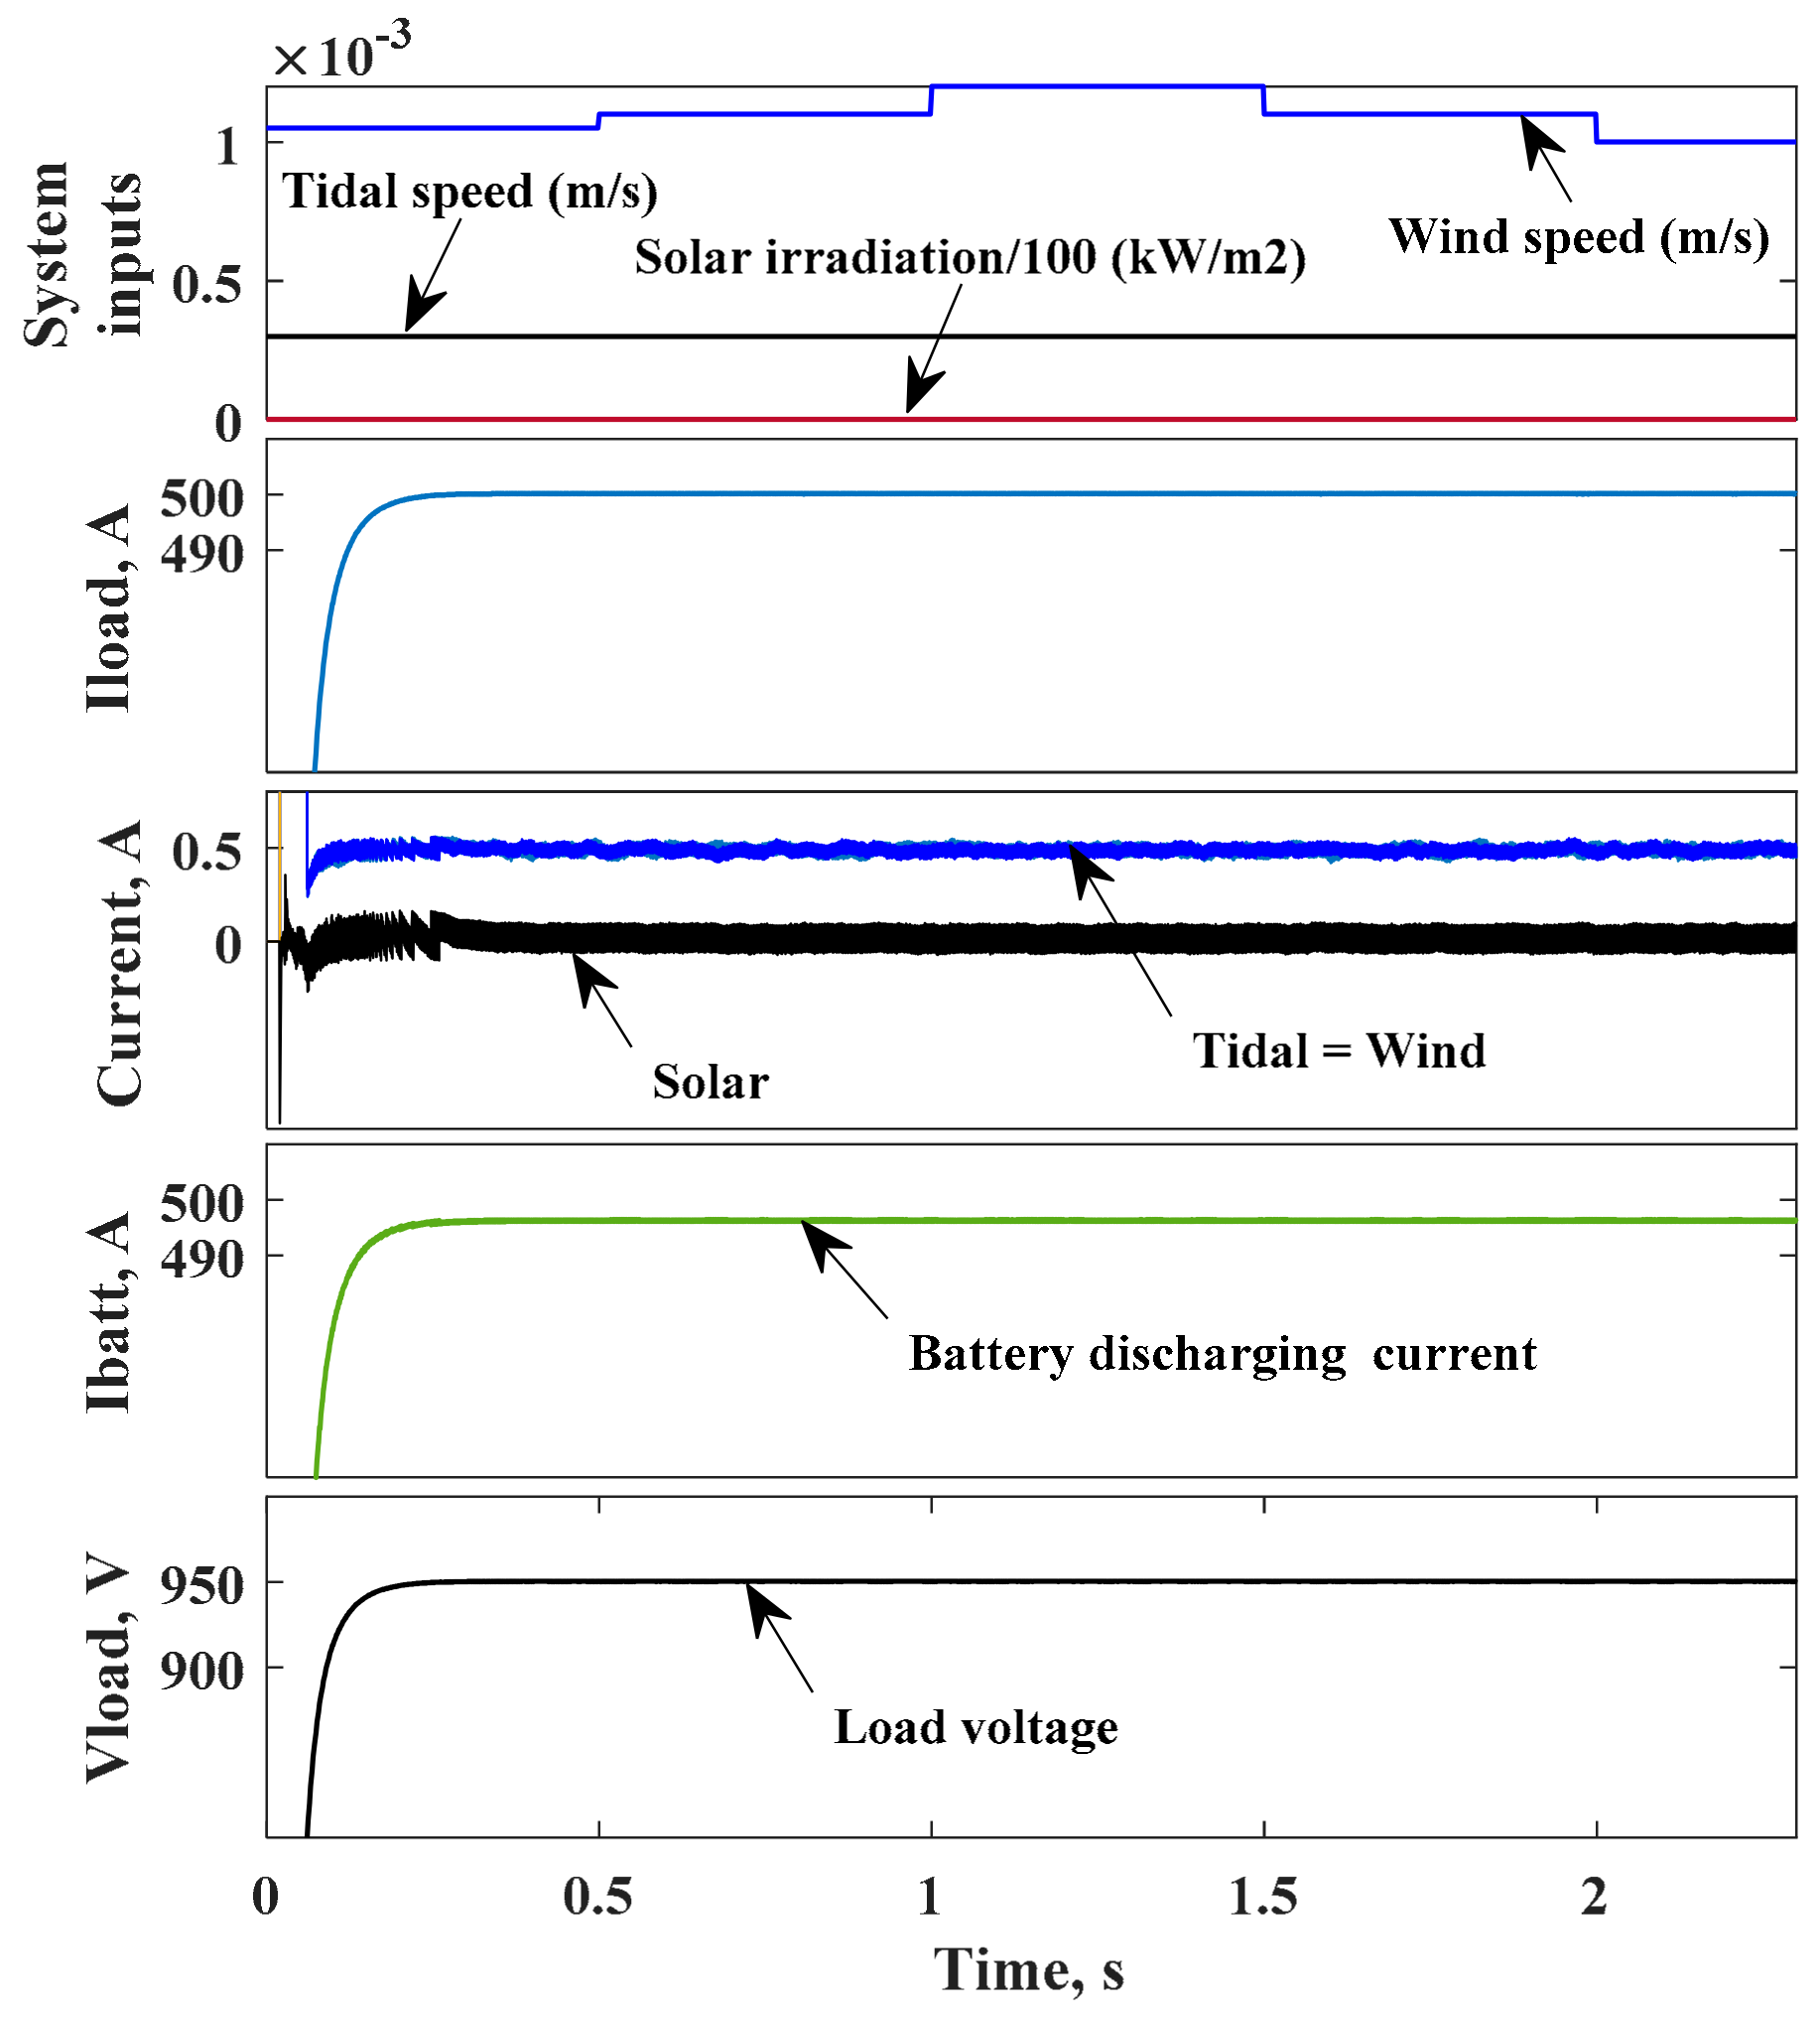
When the RES units deliver zero energy, then load shedding must be considered to allow the battery storage supplies only the emergency load to maintain the load voltage regulated at the nominal value. The emergency load is 475 kW ( V l o a d = 950   V , I l o a d = 500   A and R l o a d = 1.9   ). Figure 18 shows the worst-case scenario while load shedding is applied and only the emergency load is supplied by the battery system. The load voltage is regulated at the nominal voltage using the battery charging/discharging controller. The voltage overshoot and undershoot shown in the two previous cases disappeared in this case as the load voltage is supported only by the battery system. Additionally, there is no transient overshoot at the start for the same reason.

5.1.4. Case d: Tidal Turbine Breakdown (Fault Condition)

The operating condition of case-a is repeated under this case to study the transient stability of the floating unit voltage due to tidal turbine-2 outage. Tidal turbine-2 is isolated from the system at 0.6 s due to an internal fault. The battery storage compensates the turbine energy to maintain the load voltage regulated until the turbine re-join the grid at 1.3 s. Figure 19 shows a stable operation, although, voltage undershoot is recorded at 0.6 s due to a fault that leads to disconnecting the tidal turbine-2. The battery system is changed from charging to discharging mode to support the load voltage. By the time of re-connecting the turbine, voltage overshoot is shown at 1.3 s and the battery system is back to charging mode.
Figure 16, Figure 17, Figure 18 and Figure 19 confirm the stability of the local voltage of the floating energy unit at different operating conditions as introduced earlier in the stability analysis Section 4.4.

5.2. Part II: Two-Parallel-Connected Floating Energy Units

This part of the simulation section shows the performance of 2-parallel-connected floating energy units considering the circulating current between them. Two energy storage scenarios are examined. One scenario considers single energy storage at the load side, while the other considers 2-energy storage units at the output of the floating energy units. The third scenario considers applying IACS for minimizing the circulating current.

5.2.1. Scenario 1: Two-Floating Energy Units with Single Energy Storage

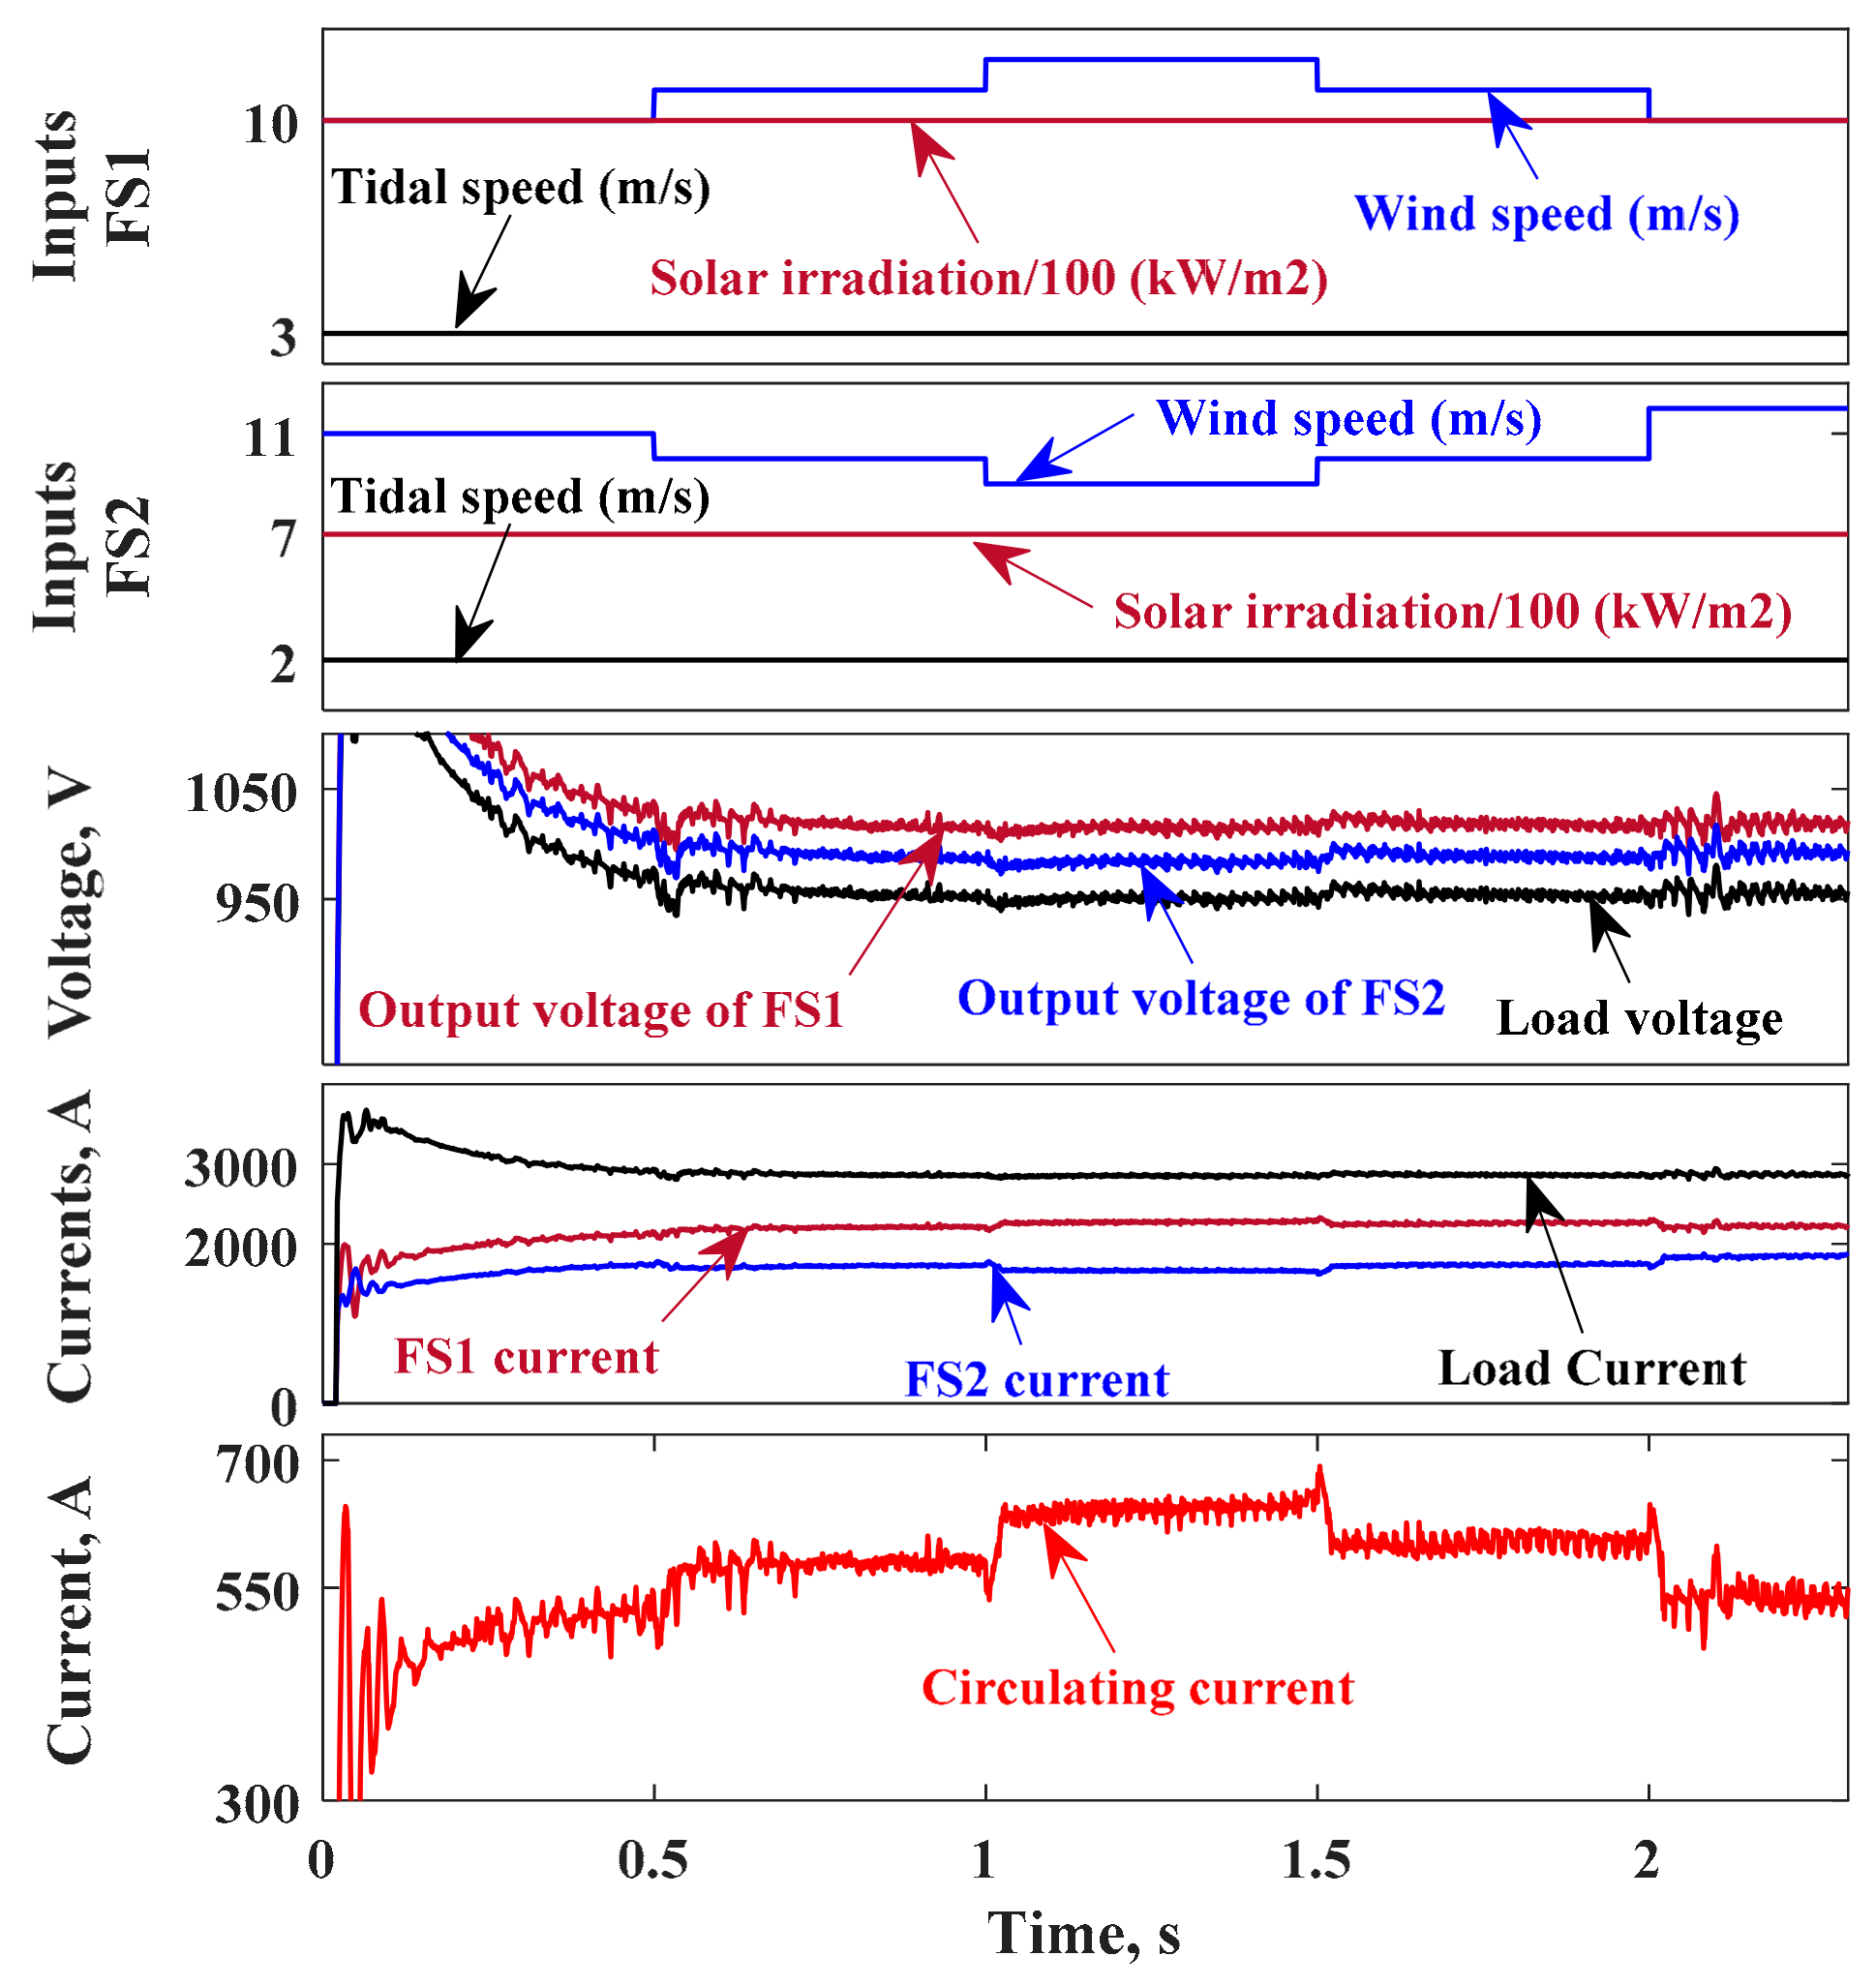
A single energy storage system is connected in parallel to the load, mainly, to meet emergency load during low RES energy delivered and for supporting the load voltage during transient conditions. Resistive load power is considered with R l o a d = 0.33   . While different line impedances are considered with R l 1 = 0.0283 and R l 2 = 0.02   . The input parameters (tidal speed, wind speed and solar irradiation) for both units are different. The simulation results for the two energy units are shown in Figure 20. The figures show the output voltages and currents of the two energy units, load current, load voltage and circulating current between the two units.
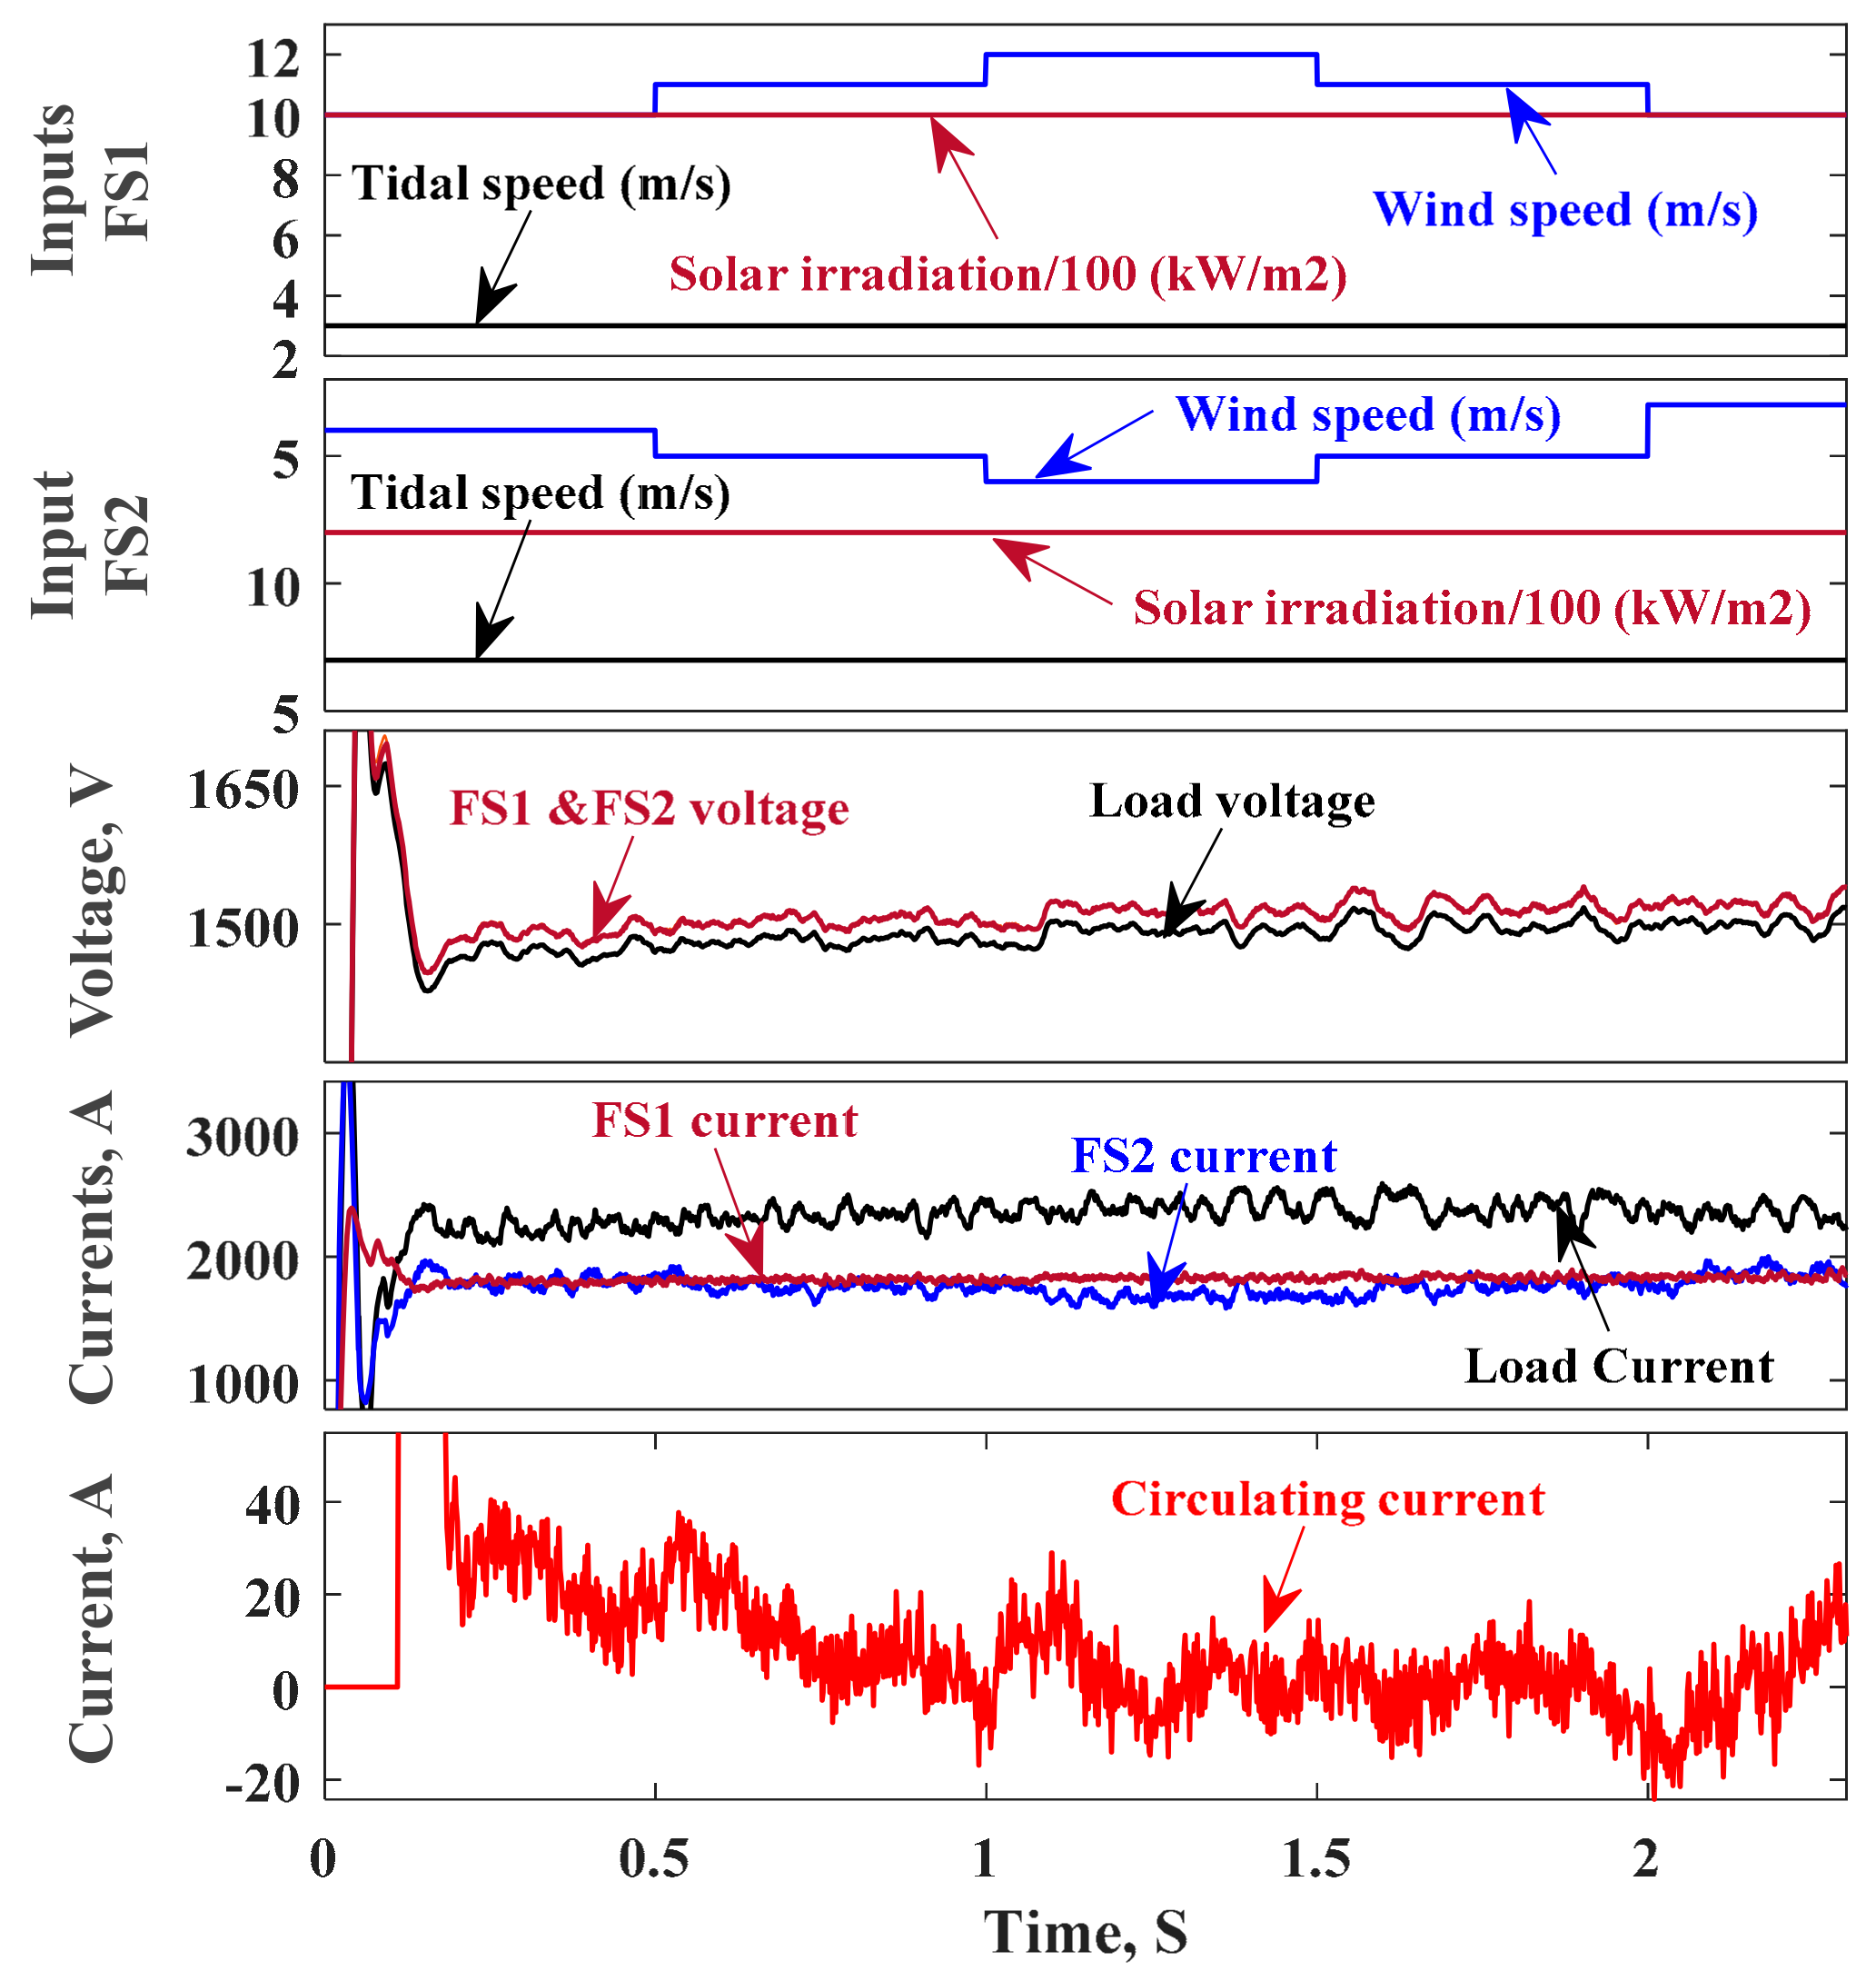
Figure 20 shows that the storage controller is able to regulate the load voltage by absorbing the surplus energy delivered by the RES. However, due to line impedance mismatch, the output voltages of the two floating energy units are different which allow the circulating current to pass between them. To avoid this circulating current, two energy storage units are employed as per scenario-2.

5.2.2. Scenario 2: Two-Floating Energy Units with Two-Energy Storage Units

The simulation setup of the previous scenario is used under this scenario to show the impact of using two energy storage units on the circulating current instead of a single unit as per the previous scenario. The controllers of the two storage units regulate the output voltages of their floating energy units to the same voltage value to minimize the circulating current. The simulation results are shown in Figure 21. The figures show the output voltages and currents of the two energy units, load current, load voltage and circulating current between the two floating units.
Figure 21 shows that the load voltage is regulated using the controllers of the two storage units by absorbing the surplus energy delivered by the RES in each floating unit. The circulating current is reduced in this scenario comparing with the previous case with single energy storage and this returning to the advantage of regulating the output voltage of each floating energy unit. Although the circulating current is reduced as expected, the figure shows a slow response for minimizing the circulating current. Additionally, the load voltage is not regulated properly at the nominal voltage. The next scenario considers the use of the IACS controller which is developed in a different study for the authors.

5.2.3. Scenario 3: Two-Floating Energy Units with IACS Controller

The simulation setup of scenario-1 is used under this scenario to show the impact of employing the IACS controller on minimizing the circulating current comparing with scenario-2. The simulation results are shown in Figure 22. The figures show the output voltages and currents of the two energy units, load current, load voltage and circulating current between the two floating units.
Figure 22 shows a fast response for the circulating current, approximately 0.25 s comparing with 2 s in scenario-2. Another advantage of using the IACS controller is boosting the output voltage of the floating structure to a higher voltage level (voltage of the collection bus) which has a positive impact on the system efficiency via reducing the distribution line losses. Additionally, the load voltage is regulated properly at the nominal voltage.

6. Conclusions

To conclude this paper, a new control approach based on IACS is proposed for accurate voltage regulation and minimizing circulating current among parallel floating energy units connected in an LVDC-microgrid. Every floating energy unit comprises tidal, wind and solar energy resources with a storage unit. Mathematical modelling is performed for all components (tidal, wind, solar) with the DC-DC boost converter for MPPT and a mathematical model for bidirectional buck/boost converter is derived which controls the storage unit for voltage regulation. Additionally, an overall model for a single floating energy unit and n-parallel floating energy units is derived. Stability analysis is held for all components with the DC-DC converters, and then, stability analysis is performed for the overall model of the floating energy unit and n-parallel floating units. Matlab/Simulink setup is used to investigate the dynamic performance of a single floating energy unit with DC load at a different operating condition which confirms the stability analysis held in Section 4.4. Another Matlab/Simulink setup is used to investigate the performance of the proposed control scheme based on 2-parallel floating energy units supplying a DC-load. The simulation results showed excellent dynamic performance for the proposed control scheme in regulating the grid voltage and minimizing the circulating current among the floating energy units.

Author Contributions

Conceptualization, W.N.; Investigation, W.N.; Methodology, O.A.-L.; Project administration, K.A.; Supervision, O.A.-L.; Validation, W.N.; Writing—original draft, W.N.; Writing—review & editing, O.A.-L. All authors have read and agreed to the published version of the manuscript.

Funding

This research received no external funding.

Institutional Review Board Statement

Not applicable.

Informed Consent Statement

Not applicable.

Data Availability Statement

Not applicable.

Conflicts of Interest

The authors declare no conflict of interest.

Appendix A

Table A1. Parameters list of wind and tidal turbines.
DescriptionWind TurbineTidal Turbine
Turbine parameters
Rated power (kW)3000750
Rotor radius (m)517.025
Air density/Water density (kg/m2)1.2251025
Rated wind/current speed (m/s)123
Cut-in wind/current speed (m/s)3
Cut-out wind/current speed (m/s)25
PMSG parameters
Generator pole pairs 2626
Shaft moment of inertia (kg·m2)466 × 103117 × 103
Viscous friction (N·m·s)0.0011890.001189
Stator phase resistance Rs (Ω)1.63 × 10−36.52 × 10−3
Direct stator inductance (H)0.94 × 10−33.74 × 10−3
Quadrature stator inductance (H)1.47 × 10−35.88 × 10−3
Flux linkage (V·s)8.2958.295
Boost converter parameters
Input boost inductor, L (H)1.7 × 10−31.2 × 10−3
Output boost capacitor, C (F)24.5 × 10−63 × 10−3
Switching frequency (Hz)50 × 10350 × 103
System parameters
Speed controller proportional gain, k s p 75007500
Speed controller integral gain, k s i 50005000
Current controller proportional gain, k c p 20002000
Current controller integral gain, k c i 5050
Table A2. Parameters list of a solar PV array.
DescriptionSolar System
Solar module (CS6X-310P)
Nominal max. power (W)310
Operating voltage at MPP (V)36.4
Operating current at MPP (A)8.52
Open circuit voltage (V)44.9
Short circuit current (A)9.08
Module efficiency (%)16.16
Operating temperature (°C)−40 to 85
Shunt resistance, R p (Ω)333.67
Series resistance, R s (Ω)0.35
Number of cells per module, M s 72
Diode ideality factor, a1.0114
The temperature of the p-n junction, T (°C)25
Solar array size
Number of series-connected modules per string, Ns17
Number of parallel strings per array, Np62
Boost converter parameters
Input boost inductor, L (H)6 × 10⁻³
Output boost capacito C 0 (F)1 × 10⁻⁴
Switching frequency (Hz)50 × 103
Table A3. Parameters list of a battery system.
DescriptionSolar System
Bi-directional converter
Steady-state input voltage (battery side), V b a t t (V)600
Steady-state output voltage (load side), V o b (V)1500
Input boost inductor, L (H)3.4 × 10⁻³
Output boost capacitor, C 0 (F)2.2 × 10⁻⁶
Switching frequency (Hz)50 × 103
PI-controllers gains
Inner controller proportional gain, k p c B 1.28 × 10⁻³
Inner controller integral gain T i c B 1.57 × 10⁻⁴
Outer controller proportional gain, k p v B 2.27 × 10⁻⁵
Outer controller integral gain, T i v B 1.32 × 10⁻⁷

References

  1. Nassar, W.M.; Anaya-Lara, O.; Ahmed, K.H.; Campos-Gaona, D.; Elgenedy, M. Assessment of multi-use offshore platforms: Structure classification and design challenges. Sustainability 2020, 12, 1860. [Google Scholar] [CrossRef] [Green Version]
  2. Bard, J. Multi-Use Platform Concepts for the Oceans of Tomorrow. Available online: https://www.icoe-conference.com/publication/multi-use-platform-concepts-for-the-oceans-of-tomorrow/ (accessed on 7 June 2021).
  3. Prabhakaran, P.; Goyal, Y.; Agarwal, V. Novel Nonlinear Droop Control Techniques to Overcome the Load Sharing and Voltage Regulation Issues in DC Microgrid. IEEE Trans. Power Electron. 2018, 33, 4477–4487. [Google Scholar] [CrossRef]
  4. He, X.; Ji, H.; Song, Y.; Song, G.; Cai, H.; Mi, Y. Voltage stability control for DC microgrid with energy storage. In Proceedings of the 2017 IEEE Conference on Energy Internet and Energy System Integration (EI2), Beijing, China, 26–28 November 2017; pp. 1–6. [Google Scholar]
  5. Wu, D.; Tang, F.; Dragicevic, T.; Guerrero, J.M.; Vasquez, J.C. Coordinated Control Based on Bus-Signaling and Virtual Inertia for Islanded DC Microgrids. IEEE Trans. Smart Grid 2015, 6, 2627–2638. [Google Scholar] [CrossRef] [Green Version]
  6. Lu, X.; Guerrero, J.M.; Sun, K.; Vasquez, J.C.; Teodorescu, R.; Huang, L. Hierarchical Control of Parallel AC-DC Converter Interfaces for Hybrid Microgrids. IEEE Trans. Smart Grid 2014, 5, 683–692. [Google Scholar] [CrossRef] [Green Version]
  7. Augustine, S.; Mishra, M.K.; Lakshminarasamma, N. Adaptive Droop Control Strategy for Load Sharing and Circulating Current Minimization in Low-Voltage Standalone DC Microgrid. IEEE Trans. Sustain. Energy 2015, 6, 132–141. [Google Scholar] [CrossRef]
  8. Xiao, H.; Luo, A.; Shuai, Z.; Jin, G.; Huang, Y. An Improved Control Method for Multiple Bidirectional Power Converters in Hybrid AC/DC Microgrid. IEEE Trans. Smart Grid 2016, 7, 340–347. [Google Scholar] [CrossRef]
  9. Augustine, S.; Lakshminarasamma, N.; Mishra, M.K. Control of photovoltaic-based low-voltage dc microgrid system for power sharing with modified droop algorithm. IET Power Electron. 2016, 9, 1132–1143. [Google Scholar] [CrossRef]
  10. Zhao, X.; Li, Y.W.; Tian, H.; Wu, X. Energy Management Strategy of Multiple Supercapacitors in a DC Microgrid Using Adaptive Virtual Impedance. IEEE J. Emerg. Sel. Top. Power Electron. 2016, 4, 1174–1185. [Google Scholar] [CrossRef]
  11. Guerrero, J.M.; Vasquez, J.C.; Matas, J.; De Vicuna, L.G.; Castilla, M. Hierarchical Control of Droop-Controlled AC and DC Microgrids—A General Approach Toward Standardization. IEEE Trans. Ind. Electron. 2011, 58, 158–172. [Google Scholar] [CrossRef]
  12. Meng, L.; Dragicevic, T.; Vasquez, J.C.; Guerrero, J.M. Tertiary and Secondary Control Levels for Efficiency Optimization and System Damping in Droop Controlled DC–DC Converters. IEEE Trans. Smart Grid 2015, 6, 2615–2626. [Google Scholar] [CrossRef] [Green Version]
  13. Nasirian, V.; Davoudi, A.; Lewis, F.L.; Guerrero, J.M. Distributed Adaptive Droop Control for DC Distribution Systems. IEEE Trans. Energy Convers. 2014, 29, 944–956. [Google Scholar] [CrossRef] [Green Version]
  14. Wang, P.; Lu, X.; Yang, X.; Wang, W.; Xu, D. An Improved Distributed Secondary Control Method for DC Microgrids With Enhanced Dynamic Current Sharing Performance. IEEE Trans. Power Electron. 2016, 31, 6658–6673. [Google Scholar] [CrossRef]
  15. Oliveira, T.R.; Silva, W.W.A.G.; Donoso-Garcia, P.F. Distributed Secondary Level Control for Energy Storage Management in DC Microgrids. IEEE Trans. Smart Grid 2017, 8, 2597–2607. [Google Scholar] [CrossRef]
  16. Xiao, J.; Wang, P.; Setyawan, L. Hierarchical Control of Hybrid Energy Storage System in DC Microgrids. IEEE Trans. Ind. Electron. 2015, 62, 4915–4924. [Google Scholar] [CrossRef]
  17. Meng, L.; Dragicevic, T.; Vasquez, J.; Guerrero, J.; Sanseverino, E.R. Hierarchical control with virtual resistance optimization for efficiency enhancement and State-of-Charge balancing in DC microgrids. In Proceedings of the 2015 IEEE First International Conference on DC Microgrids (ICDCM), Atlanta, GA, USA, 7–10 June 2015; pp. 1–6. [Google Scholar]
  18. Ito, Y.; Zhongqing, Y.; Akagi, H. DC microgrid based distribution power generation system. In Proceedings of the 4th International Power Electronics and Motion Control Conference, IPEMC 2004, Xi’an, China, 14–16 August 2004; Volume 1743, pp. 1740–1745. [Google Scholar]
  19. Xia, Y.; Wei, W.; Peng, Y.; Yang, P.; Yu, M. Decentralized Coordination Control for Parallel Bidirectional Power Converters in a Grid-Connected DC Microgrid. IEEE Trans. Smart Grid 2018, 9, 6850–6861. [Google Scholar] [CrossRef]
  20. Kou, P.; Liang, D.; Gao, L. Distributed Coordination of Multiple PMSGs in an Islanded DC Microgrid for Load Sharing. IEEE Trans. Energy Convers. 2017, 32, 471–485. [Google Scholar] [CrossRef]
  21. Rajagopalan, J.; Xing, K.; Guo, Y.; Lee, F.C.; Manners, B. Modeling and dynamic analysis of paralleled DC/DC converters with master-slave current sharing control. In Proceedings of the Applied Power Electronics Conference, APEC ‘96, San Jose, CA, USA, 3–7 March 1996; Volume 672, pp. 678–684. [Google Scholar]
  22. Wu, T.F.; Chen, Y.K.; Huang, Y.H. 3C strategy for inverters in parallel operation achieving an equal current distribution. IEEE Trans. Ind. Electron. 2000, 47, 273–281. [Google Scholar] [CrossRef]
  23. Roslan, A.M.; Ahmed, K.H.; Finney, S.J.; Williams, B.W. Improved Instantaneous Average Current-Sharing Control Scheme for Parallel-Connected Inverter Considering Line Impedance Impact in Microgrid Networks. IEEE Trans. Power Electron. 2011, 26, 702–716. [Google Scholar] [CrossRef]
  24. Siri, K.; Lee, C.Q.; Wu, T. Current distribution control for parallel connected converters. II. IEEE Trans. Aerosp. Electron. Syst. 1992, 28, 841–851. [Google Scholar] [CrossRef]
  25. Batarseh, I.; Siri, K.; Lee, H. Investigation of the output droop characteristics of parallel-connnected DC-DC converters. In Proceedings of the 1994 Power Electronics Specialist Conference—PESC’94, Taipei, Taiwan, 20–25 June 1994; Volume 1342, pp. 1342–1351. [Google Scholar]
  26. Jian, Z.H.; He, Z.Y.; Jia, J.; Xie, Y. A Review of Control Strategies for DC Micro-grid. In Proceedings of the Fourth International Conference on Intelligent Control and Information Processing (ICICIP), Beijing, China, 9–11 June 2013. [Google Scholar]
  27. Dragičević, T.; Lu, X.; Vasquez, J.C.; Guerrero, J.M. DC Microgrids—Part I: A Review of Control Strategies and Stabilization Techniques. IEEE Trans. Power Electron. 2016, 3, 4876–4891. [Google Scholar]
  28. Lu, X.; Guerrero, J.M.; Sun, K.; Vasquez, J.C. An Improved Droop Control Method for DC Microgrids Based on Low Bandwidth Communication With DC Bus Voltage Restoration and Enhanced Current Sharing Accuracy. IEEE Trans. Power Electron. 2014, 29, 1800–1812. [Google Scholar] [CrossRef] [Green Version]
  29. Anand, S.; Fernandes, B.G.; Guerrero, J.M. Distributed Control to Ensure Proportional Load Sharing and Improve Voltage Regulation in Low-Voltage DC Microgrids. IEEE Trans. Power Electron. 2013, 28, 1900–1913. [Google Scholar] [CrossRef] [Green Version]
  30. Davari, M.; Mohamed, Y.A.I. Robust DC-Link Voltage Control of a Full-Scale PMSG Wind Turbine for Effective Integration in DC Grids. IEEE Trans. Power Electron. 2017, 32, 4021–4035. [Google Scholar] [CrossRef]
  31. Yaramasu, V.; Wu, B. Model Predictive Control of Wind Energy Conversion Systems; John Wiley & Sons: Hoboken, NJ, USA, 2016. [Google Scholar]
  32. Nasiri, M.; Milimonfared, J.; Fathi, S.H. Modeling, analysis and comparison of TSR and OTC methods for MPPT and power smoothing in permanent magnet synchronous generator-based wind turbines. Energy Convers. Manag. 2014, 86, 892–900. [Google Scholar] [CrossRef]
  33. Erickson, R.W.; Maksimovic, D. Fundamental of Power Electronics; Springer: New York, NY, USA, 2001. [Google Scholar]
  34. Yazdani, A.; Fazio, A.R.D.; Ghoddami, H.; Russo, M.; Kazerani, M.; Jatskevich, J.; Strunz, K.; Leva, S.; Martinez, J.A. Modeling Guidelines and a Benchmark for Power System Simulation Studies of Three-Phase Single-Stage Photovoltaic Systems. IEEE Trans. Power Deliv. 2011, 26, 1247–1264. [Google Scholar] [CrossRef]
  35. Tremblay, O.; Dessaint, L.; Dekkiche, A. A Generic Battery Model for the Dynamic Simulation of Hybrid Electric Vehicles. In Proceedings of the 2007 IEEE Vehicle Power and Propulsion Conference, Arlington, TX, USA, 9–12 September 2007; pp. 284–289. [Google Scholar]
  36. Poullikkas, A. A comparative overview of large-scale battery systems for electricity storage. Renew. Sustain. Energy Rev. 2013, 27, 778–788. [Google Scholar] [CrossRef]
  37. Tremblay, O.; Dessaint, L.A. Experimental Validation of a Battery Dynamic Model for EV Applications. World Electr. Veh. J. 2009, 3, 289–298. [Google Scholar] [CrossRef] [Green Version]
Figure 1. Configuration of an offshore Direct Current (DC) microgrid comprises n-floating energy units connected in parallel to DC collection bus.
Energies 14 03384 g001
Figure 2. Microgrid various operating modes.
Energies 14 03384 g002
Figure 3. Block diagram of speed control of Permeant Magnet Synchronous Generator (PMSG) connected to wind/tidal turbine.
Energies 14 03384 g003
Figure 4. Current programmed boost converter model used with a wind turbine.
Energies 14 03384 g004
Figure 5. (a) Small signal block diagram of a wind turbine, PMSG and boost converter with speed control; (b) simplified block diagram.
Energies 14 03384 g005
Figure 6. Solar PV cell (a) equivalent circuit based single-diode; (b) I-V characteristic curve.
Energies 14 03384 g006
Figure 7. Solar PV array (a) Norton equivalent circuit; (b) P-V relationship curve.
Energies 14 03384 g007
Figure 8. Block diagram of a PV solar array with boost converter and controller.
Energies 14 03384 g008
Figure 9. Model of a current programmed boost converter with PI-controller.
Energies 14 03384 g009
Figure 10. Battery generic model.
Energies 14 03384 g010
Figure 11. (a) Bi-directional converter configuration, (b) configuration during discharging mode, (c) configuration during charging mode.
Energies 14 03384 g011
Figure 12. DC/DC bidirectional converter analysis during charging mode when: (a) Q2 is ON state, (b) Q2 is OFF state.
Energies 14 03384 g012
Figure 13. Current programmed bidirectional model with a two loops cascade controller.
Energies 14 03384 g013
Figure 14. Overall model of a floating structure with tidal, wind, solar and battery sources.
Energies 14 03384 g014
Figure 15. n-parallel floating structures connected to a DC-collection bus with IACS controllers.
Energies 14 03384 g015
Figure 16. Case-a: performance of a single floating energy unit at the normal operating condition when RES supplying surplus energy.
Energies 14 03384 g016
Figure 17. Case-b: performance of a single floating energy unit at energy deficit condition when RES supply lower energy than load demand.
Energies 14 03384 g017
Figure 18. Case-c: performance of a single floating energy unit at load shedding condition when RES supply zero energy.
Energies 14 03384 g018
Figure 19. Case-d: performance of a single floating energy unit at the fault of tidal turbine-2.
Energies 14 03384 g019
Figure 20. Simulation results of two floating energy units connected in parallel with a single energy storage unit.
Energies 14 03384 g020
Figure 21. Simulation results of two floating energy units connected in parallel with 2-energy storage units.
Energies 14 03384 g021
Figure 22. Simulation results of two floating energy units with IACS.
Energies 14 03384 g022
Publisher’s Note: MDPI stays neutral with regard to jurisdictional claims in published maps and institutional affiliations.