Article

The Potential Use of Fly Ash from the Pulp and Paper Industry as Thermochemical Energy and CO2 Storage Material

Institute of Chemical, Environmental and Bioscience Engineering, TU Wien, Getreidemarkt 9/166, 1060 Vienna, Austria
*
Authors to whom correspondence should be addressed.
Energies 2021, 14(11), 3348; https://doi.org/10.3390/en14113348
Submission received: 17 April 2021 / Revised: 31 May 2021 / Accepted: 3 June 2021 / Published: 7 June 2021
(This article belongs to the Special Issue Development in Thermochemical Energy Storage)

Abstract

:
As a part of our research in the field of thermochemical energy storage, this study aims to investigate the potential of three fly ash samples derived from the fluidized bed reactors of three different pulp and paper plants in Austria for their use as thermochemical energy (TCES) and CO2 storage materials. The selected samples were analyzed by different physical and chemical analytical techniques such as X-ray fluorescence spectroscopy (XRF), X-ray diffraction (XRD), particle size distribution (PSD), scanning electron microscopy (SEM), inductively coupled plasma atomic emission spectroscopy (ICP-OES), and simultaneous thermal analysis (STA) under different atmospheres (N2, CO2, and H2O/CO2). To evaluate the environmental impact, leaching tests were also performed. The amount of CaO as a promising candidate for TCES was verified by XRF analysis, which was in the range of 25–63% (w/w). XRD results indicate that the CaO lies as free lime (3–32%), calcite (21–29%), and silicate in all fly ash samples. The results of STA show that all fly ash samples could fulfill the requirements for TCES (i.e., charging and discharging). A cycling stability test of three cycles was demonstrated for all samples which indicates a reduction of conversion in the first three reaction cycles. The energy content of the examined samples was up to 504 kJ/kg according to the STA results. More energy (~1090 kJ/kg) in the first discharging step in the CO2/H2O atmosphere could be released through two kinds of fly ash samples due to the already existing free lime (CaO) in those samples. The CO2 storage capacity of these fly ash samples ranged between 18 and 110 kg per ton of fly ash, based on the direct and dry method. The leaching tests showed that all heavy metals were below the limit values of the Austrian landfill ordinance. It is viable to say that the valorization of fly ash from the pulp and paper industries via TCES and CO2 storage is plausible. However, further investigations such as cycling stability improvement, system integration and a life cycle assessment (LCA) still need to be conducted.

1. Introduction

Continuous increases in the human population, massive urbanization, our global energy management, today’s lifestyles, and our dependency on fossil fuel energy, with less or no attention to the environment, has brought us to a position where the future existence of biological life on earth depends on today’s decisions [1]. Any misunderstanding or underestimation of our ecological situation will lead to an irreversible trend on earth, resulting in major life threating issues.
The energy demand of humanity is mainly based on fossil fuel energy, which contributes to global warming through conversion into CO2 [2]. Changing this trend, by shifting to renewable energy sources such as wind and solar energy, is essential. However, renewable energy sources pose a major drawback, which is their dependency on time and place. For instance, the sun delivers more energy in the summer, when the consumption of heat energy is as high as it is in the winter, and the availability of solar energy and energy consumption depends on the time of day [3].
Therefore, the storage of renewable energy sources is necessary to overcome the drawback of solar and wind energy and to make them sustainable and competitive with fossil fuel energy sources.
To store solar heat, there are different methods available. These can be divided into sensible, latent, and thermochemical energy storage (TCES) [4]. Sensible heat storage uses materials with high heat capacities, such as water and sand, to store heat. Latent heat storage uses the enthalpy of the phase change of a material to store and release heat. Paraffin and metal salts are commonly used materials for these purposes [5]. Sensible heat storage and latent heat storage are state-of-the-art heat storage technologies and the most commonly developed energy storage systems.
However, these two kinds of energy storage systems do not allow heat energy to be stored from one season for use in another. TCES can compensate for this drawback by storing heat through a reversible endothermic chemical reaction and releasing the stored heat through a reversible exothermic reaction, when and where the heat is required. Another advantage of TCES is its high energy density compared with sensible or latent heat storage [6]. Simulation methods of a concentrated solar plant in a combined cycle with TCES suggest that the facility’s energy efficiency can be improved by more than 45 percent [7].
TCES is still under development and is a futuristic energy storage technology. Figure 1 illustrates the comparison of sensible, latent, and TCES (sorption/chemical conversion) with respect to energy density, development stage, material availability, simplicity, and long-term storage [8].
Figure 1 shows that suitable materials for TCES still need to be found and developed. There are TCES materials available, such as metal carbonates (CaCO3, SrCO3, BaCO3), metal hydroxides (Ca(OH)2, Mg(OH)2), metal oxides (Co3O4, CuO, Mn2O3), which can be used at various temperatures [9,10].
But an optimal material that can fulfill all the high requirements of TCES material, such as a high energy density, a high cycle stability, fast kinetics for charging and discharging, low cost, and high availability, has not yet been found [1].
The search for an optimal TCES material worldwide has been focused on raw materials. In general, raw materials have drawbacks, such as a low cycle stability [11], a low conversion rate [12], a high sintering effect [13], and a high cost. To overcome these drawbacks, either doped TCES materials or mixture of a TCES material with other suitable inert or TCES materials have been created [14,15,16,17,18]. For instance, the cycling stability of doped-CaCO3 with SiO2 was improved as reported by Chen et al. [14], and doping MgO by 10% CaO has enhanced the hydration rate of MgO [15]. Carrillo et al. investigated the pure metal oxides of Mn2O3 and Co3O4 versus doped ones, and discussed the advantages and disadvantages of each system concerning cycling stability [16]. In another work, Carrillo et al. improved the energy density of Mn2O3 and cycling stability by doping with 20% Fe [17]. Block et al. studied the various binary metal oxide systems and reported for and against them in terms of kinetics, energy density, and cycling stability, concluding that Mn-/Fe-oxide and Mn-/Cu-Oxide are interesting candidates for storing solar heat [18]. Figure 2 shows the state of the art of the research on TCES material.
CaO is also a promising TCES material, as it reacts with water vapor (H2O) and carbon dioxide (CO2) to build two TCES systems: calcium hydroxide (Ca(OH)2) and calcium carbonate (CaCO3), with relatively high energy content values of 1946 kJ/kg and 3178 kJ/kg, respectively [19]. The following reactions illustrate two TCES systems, which can be built based on CaO (Equations (1) and (2)).
CaO   ( s ) + H 2 O   ( g )     Ca ( OH ) 2   ( s ) Δ H R = ± 109   kJ / mol
CaO   ( s ) + CO 2   ( g )     CaCO 3   ( s ) Δ H R = ± 178   kJ / mol
The use of raw CaO as a TCES material has certain drawbacks, such as slow carbonation conversion, slower dehydration (compared to rehydration), agglomeration, less thermal conductivity, and the sintering of CaO at high temperatures, resulting in decreased cycle stability [20]. To solve these drawbacks, the carbonation has been accelerated by dotting CaO with CeO2, and the activation energy of carbonation can be decreased from 107 to 40 kJ/mol by increasing the mass ratio of CeO2/CaO from 0 to 2 [21]. Chen et al. investigated doped CaCO3 with SiO2 to improve the cycle stability of CaCO3 by 28% and with an attenuation ratio of 0.85% per cycle [14]. The positive impact of aluminum silicate (Ca3Al2O6) on reducing the sintering effect on CaO at high temperatures has been also reported [22]. Khosa et al. investigated the impact of ZnO as a new dopant on CaO/CaO3, and reported a better cycling stability after 21 cycles with 5% of ZnO [23]. In another study, Wang et al. prevented the sintering of CaO by an optimal coating range of 8–10% with TiO2, resulting in improving the carbonation/decarbonation cycles [24]. High carbonation conversion above 0.7 of CaO was also achieved after 50 carbonation/decarbonation cycles as reported by Chen et al., by doping CaO with MgO and MnO2 through a sol-gel process [25]. The results of the investigation of Lu et al. indicated that with Li2SO4 content between 3–5% wt., the 51% CaO conversion after 11 cycles of decarbonation at 750 °C and carbonation at 600 °C can be reached, compared to 27% CaO conversion at the same experimental conditions without Li2SO4 [26]. To summarize, SiO2, Ca3Al2O6, MnO2, ZnO, TiO2, CeO2, Li2SO4, and MgO all have a beneficial effect on the carbonation/decarbonation of CaO, and the majority of these components are present in fly ash generated from various sectors such as coal, MSWI, biomass, and pulp and paper.
CaO is also the main component of all fly ash samples, along with Al2O3 and SiO2 [27]. In addition to the systematic search for TCES materials to find suitable TCES materials (Figure 2), we also investigated fly ash samples as Ca-based waste materials generated from municipal solid waste incinerators from different technologies (grate furnaces, rotary kiln, and fluidized beds) in Austria for their potential for TCES and CO2 capture [27]. Among the six fly ash samples from municipal solid waste incinerations (MSWIs), only one could meet the minimum requirements of TCES material, i.e., the charging step (endothermic reaction), the discharging step (exothermic reaction), and the cycle stability test. The energy content of this fly ash sample was 340 kJ/kg [19]. However, fly ash from MSWIs is categorized in general as a hazardous material, which makes their use and acceptance as TCES a challenging issue.
Moreover, different integrations of TCES into the combustion process using fly ash as in situ and off-site were presented in previous investigations [19,27]. In the in situ approach, the fly ash generated at the plant site can be charged by the injection of fly ash into the burning chamber for the endothermic carbonation reaction (heat storage), and when heat is required, the charged fly ash can be injected in to flue gas for the exothermic carbonation reaction (heat release). In the off-site approach, extra TCES facilities for charging and discharging are required either at the plant site or on another place where the fly ash can be transported.
The use of byproducts and waste materials rich in promising TCES materials from any industry is an interesting and novel approach to finding other candidate materials (byproduct/waste) for use as TCES material (Figure 3). This new pathway makes TCES more economically and ecologically sustainable [1].
There are performed investigations available regarding the potential use of bottom ash [28], waste/byproduct including MSW fly ash [29], and coal/biomass fly ash [30] as sensible heat storage materials where the heat capacity of unchanged materials without reaction is used, but not as thermochemical energy storage with chemical reaction, which is the focus of our investigation in this work.
For the potential use of byproduct/waste from industries as TCES materials with chemical reaction, other byproduct materials, such as carbide slag from the industrial production of C2H2 or PVC by the hydrolysis of calcium carbide, was studied for the use as TCES material by Sun et al., and was found to be a good candidate under high pressure of 1.3 MPa, and an optimum temperature range of 800–850 °C [31]. Oil shale ash was proposed for TCES, as their main components are calcium, magnesium, and silica. However, less potential could be identified [32].
To expand and continue our investigations in the line with the use of byproduct/waste for TCES, we decided to go a step further and investigate fly ash samples that are richer in CaO and are categorized in general as non-hazardous product/waste, such as fly ash samples from pulp and paper industries, in contrast to fly ash generated from municipal solid waste (MSW). To do so, we collected three fly ash samples generated from three different fluidized bed reactor plants in the pulp and paper industries in Austria. Different physical and chemical analyses were performed, such as XRF, XRD, PSD, ICP-OES, and SEM, to characterize the samples. Simultaneous thermal analysis (STA) was executed to identify fly ash samples that can fulfill the minimum requirements—the endothermic charging step, the exothermic discharging step, and the cycle stability test—for their use as TCES materials. To determine the CO2 storage capacity of fly ash samples, the carbonation was carried out in a pure CO2 atmosphere in STA. For knowledge about the environmental impact of fly ash samples, a leaching test was performed.

2. Materials and Methods

2.1. General Physical Properties of Fly Ash Samples

The fly ash samples were collected from three different fluidized bed incinerators in Austria. The biogenic feed and the relevant technical information for each plant are summarized in Table 1. The used technology at Plants B and C is a circulating fluidized bed combustor (CFBC), whereas Plant A uses a bubbling fluidized bed combustor (BFBC). The biological sludge fraction is co-combusted in Plant C, unlike Plants A and B. Most fly ash produced in Plants A, B, and C is being used in cement industries. Fractions that are not suitable for use in the cement industries due to the contamination with heavy metals, are categorized as waste, and will be landfilled in non-hazardous sites after the stabilization process. No additives are injected into the flue gas before the separation of fly ash in all combustors.
Physical and chemical characterization of fly ash samples were performed by different analytical techniques such as particle size distribution (PSD), X-ray fluorescence spectroscopy (XRF), inductively coupled plasma atomic emission spectroscopy (ICP-OES), X-ray diffractometry (XRD), simultaneous thermal analysis (STA), leaching test, and scanning electron microscopy (SEM), using different equipment available at TU Wien. Each method’s technical details, as well as related sample preparations, have already been covered in our previous publications [19,27].

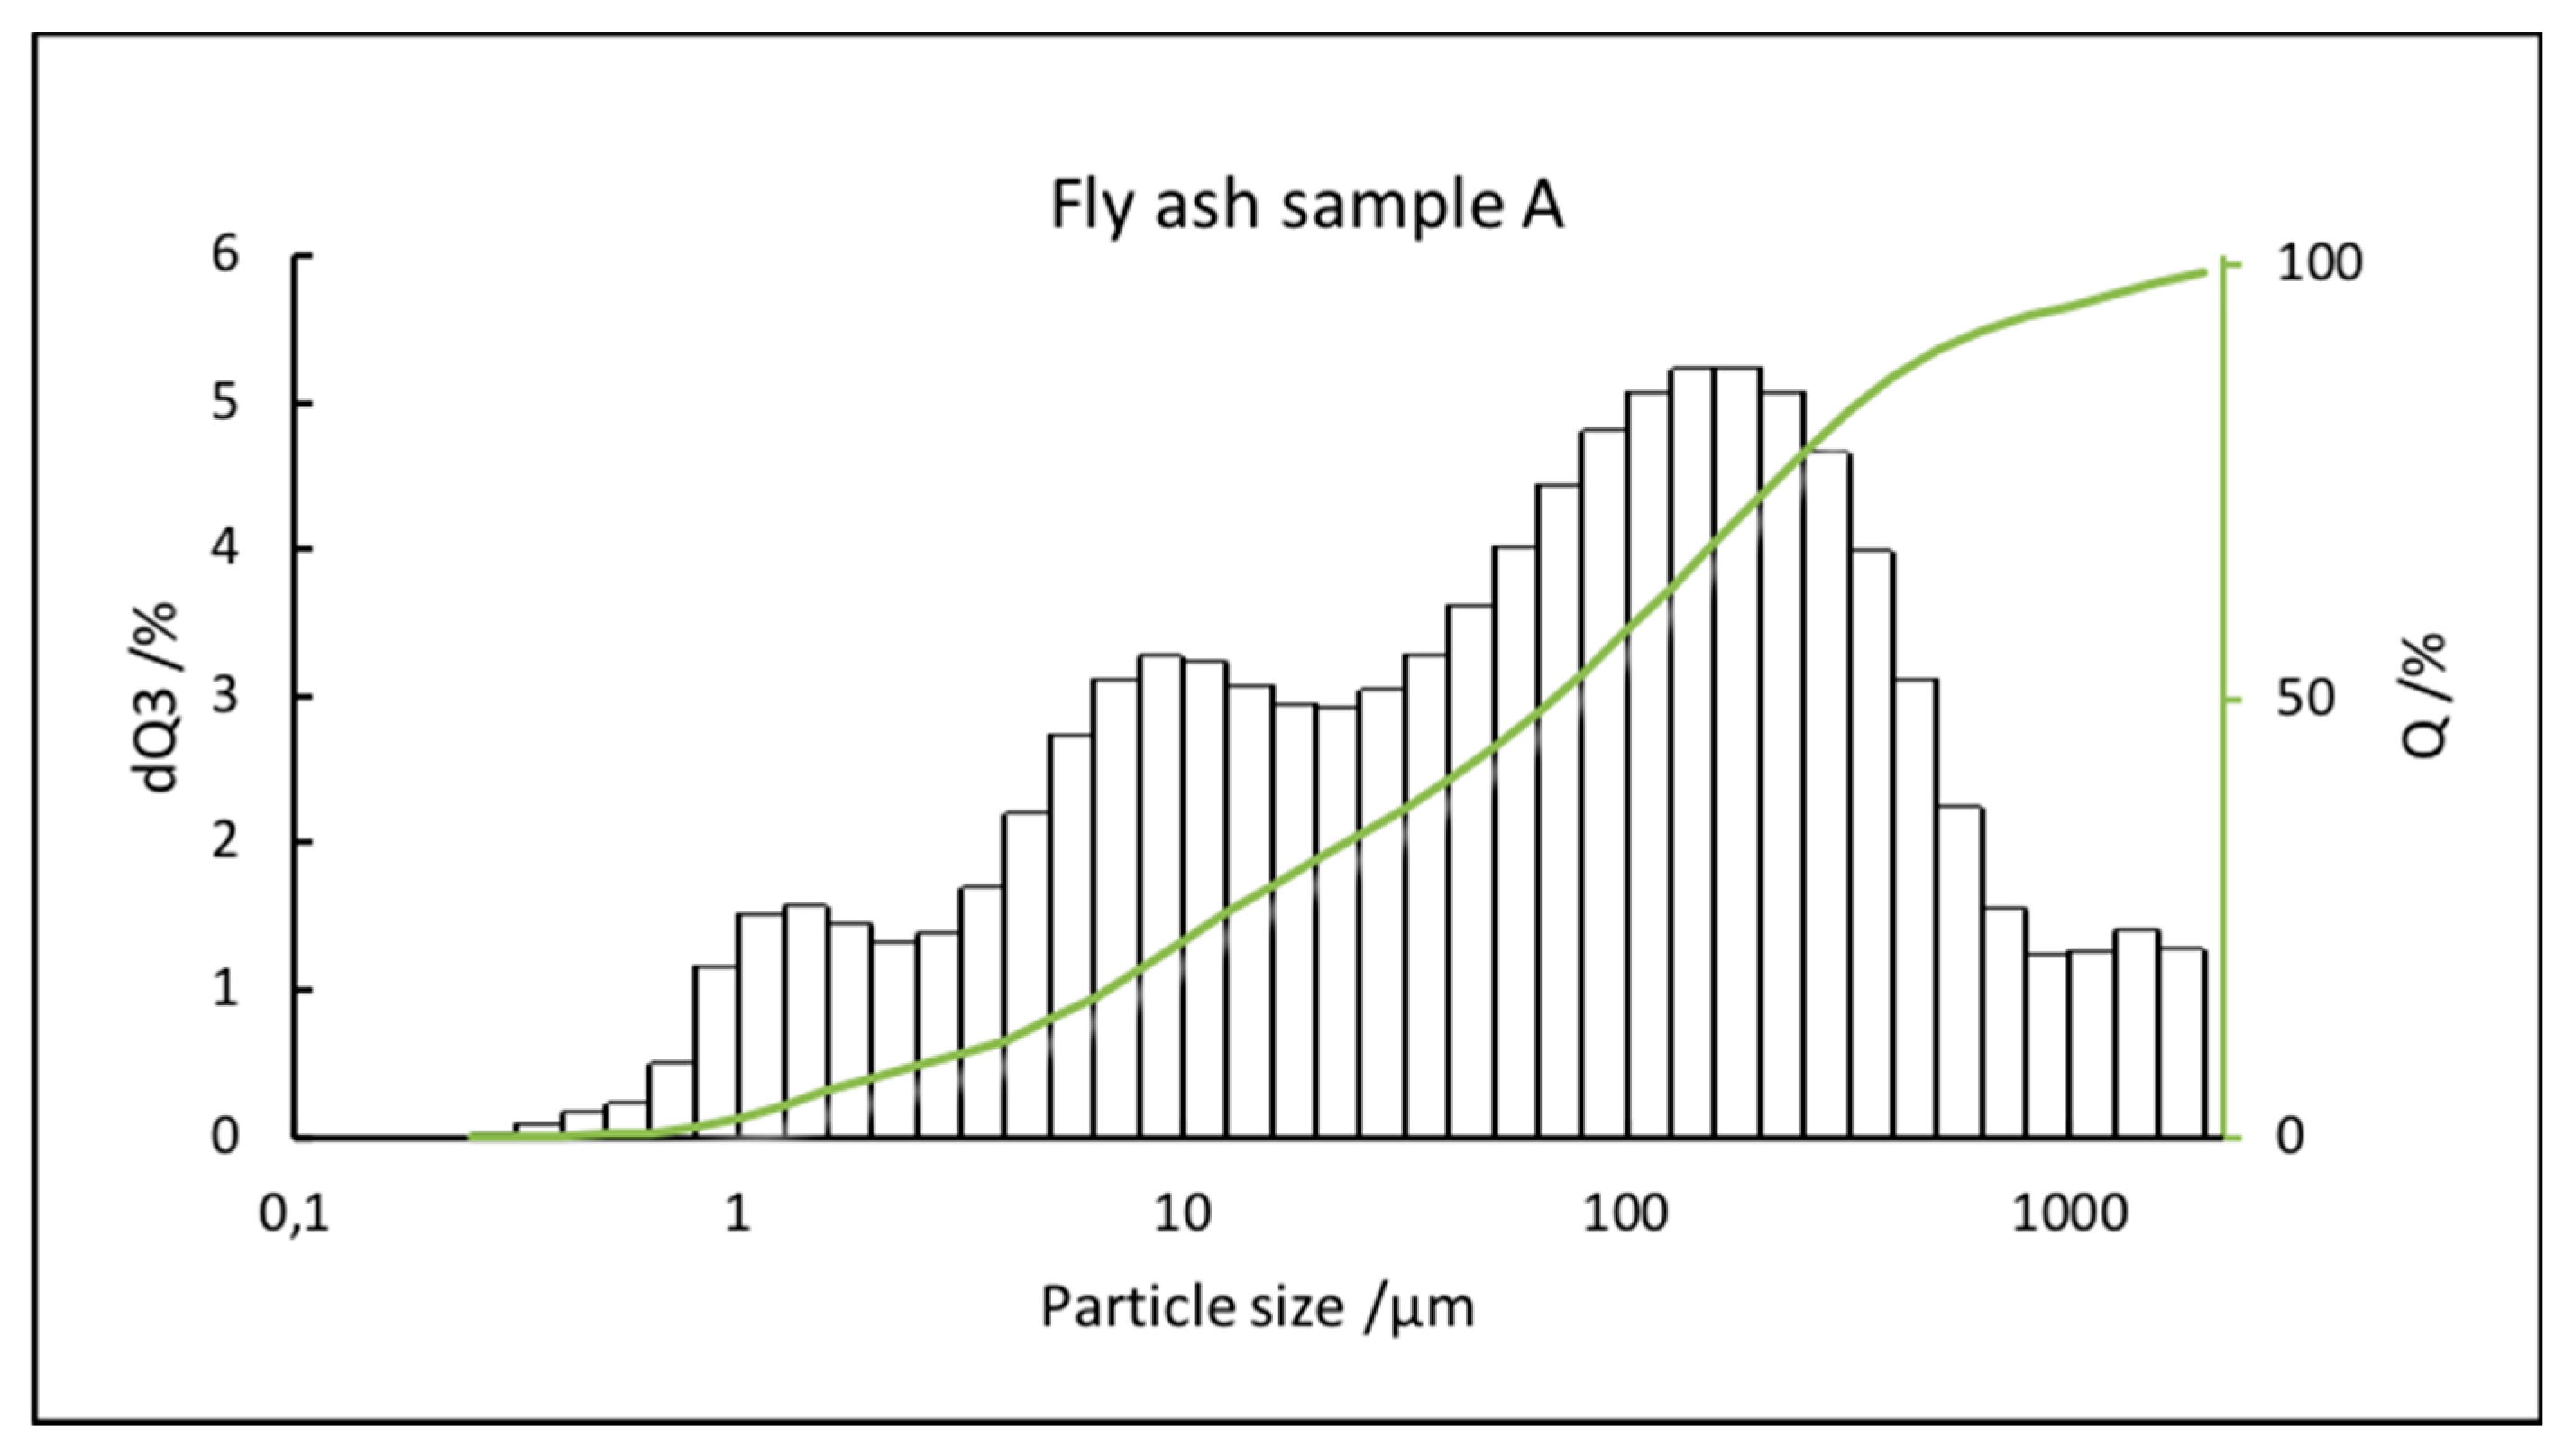
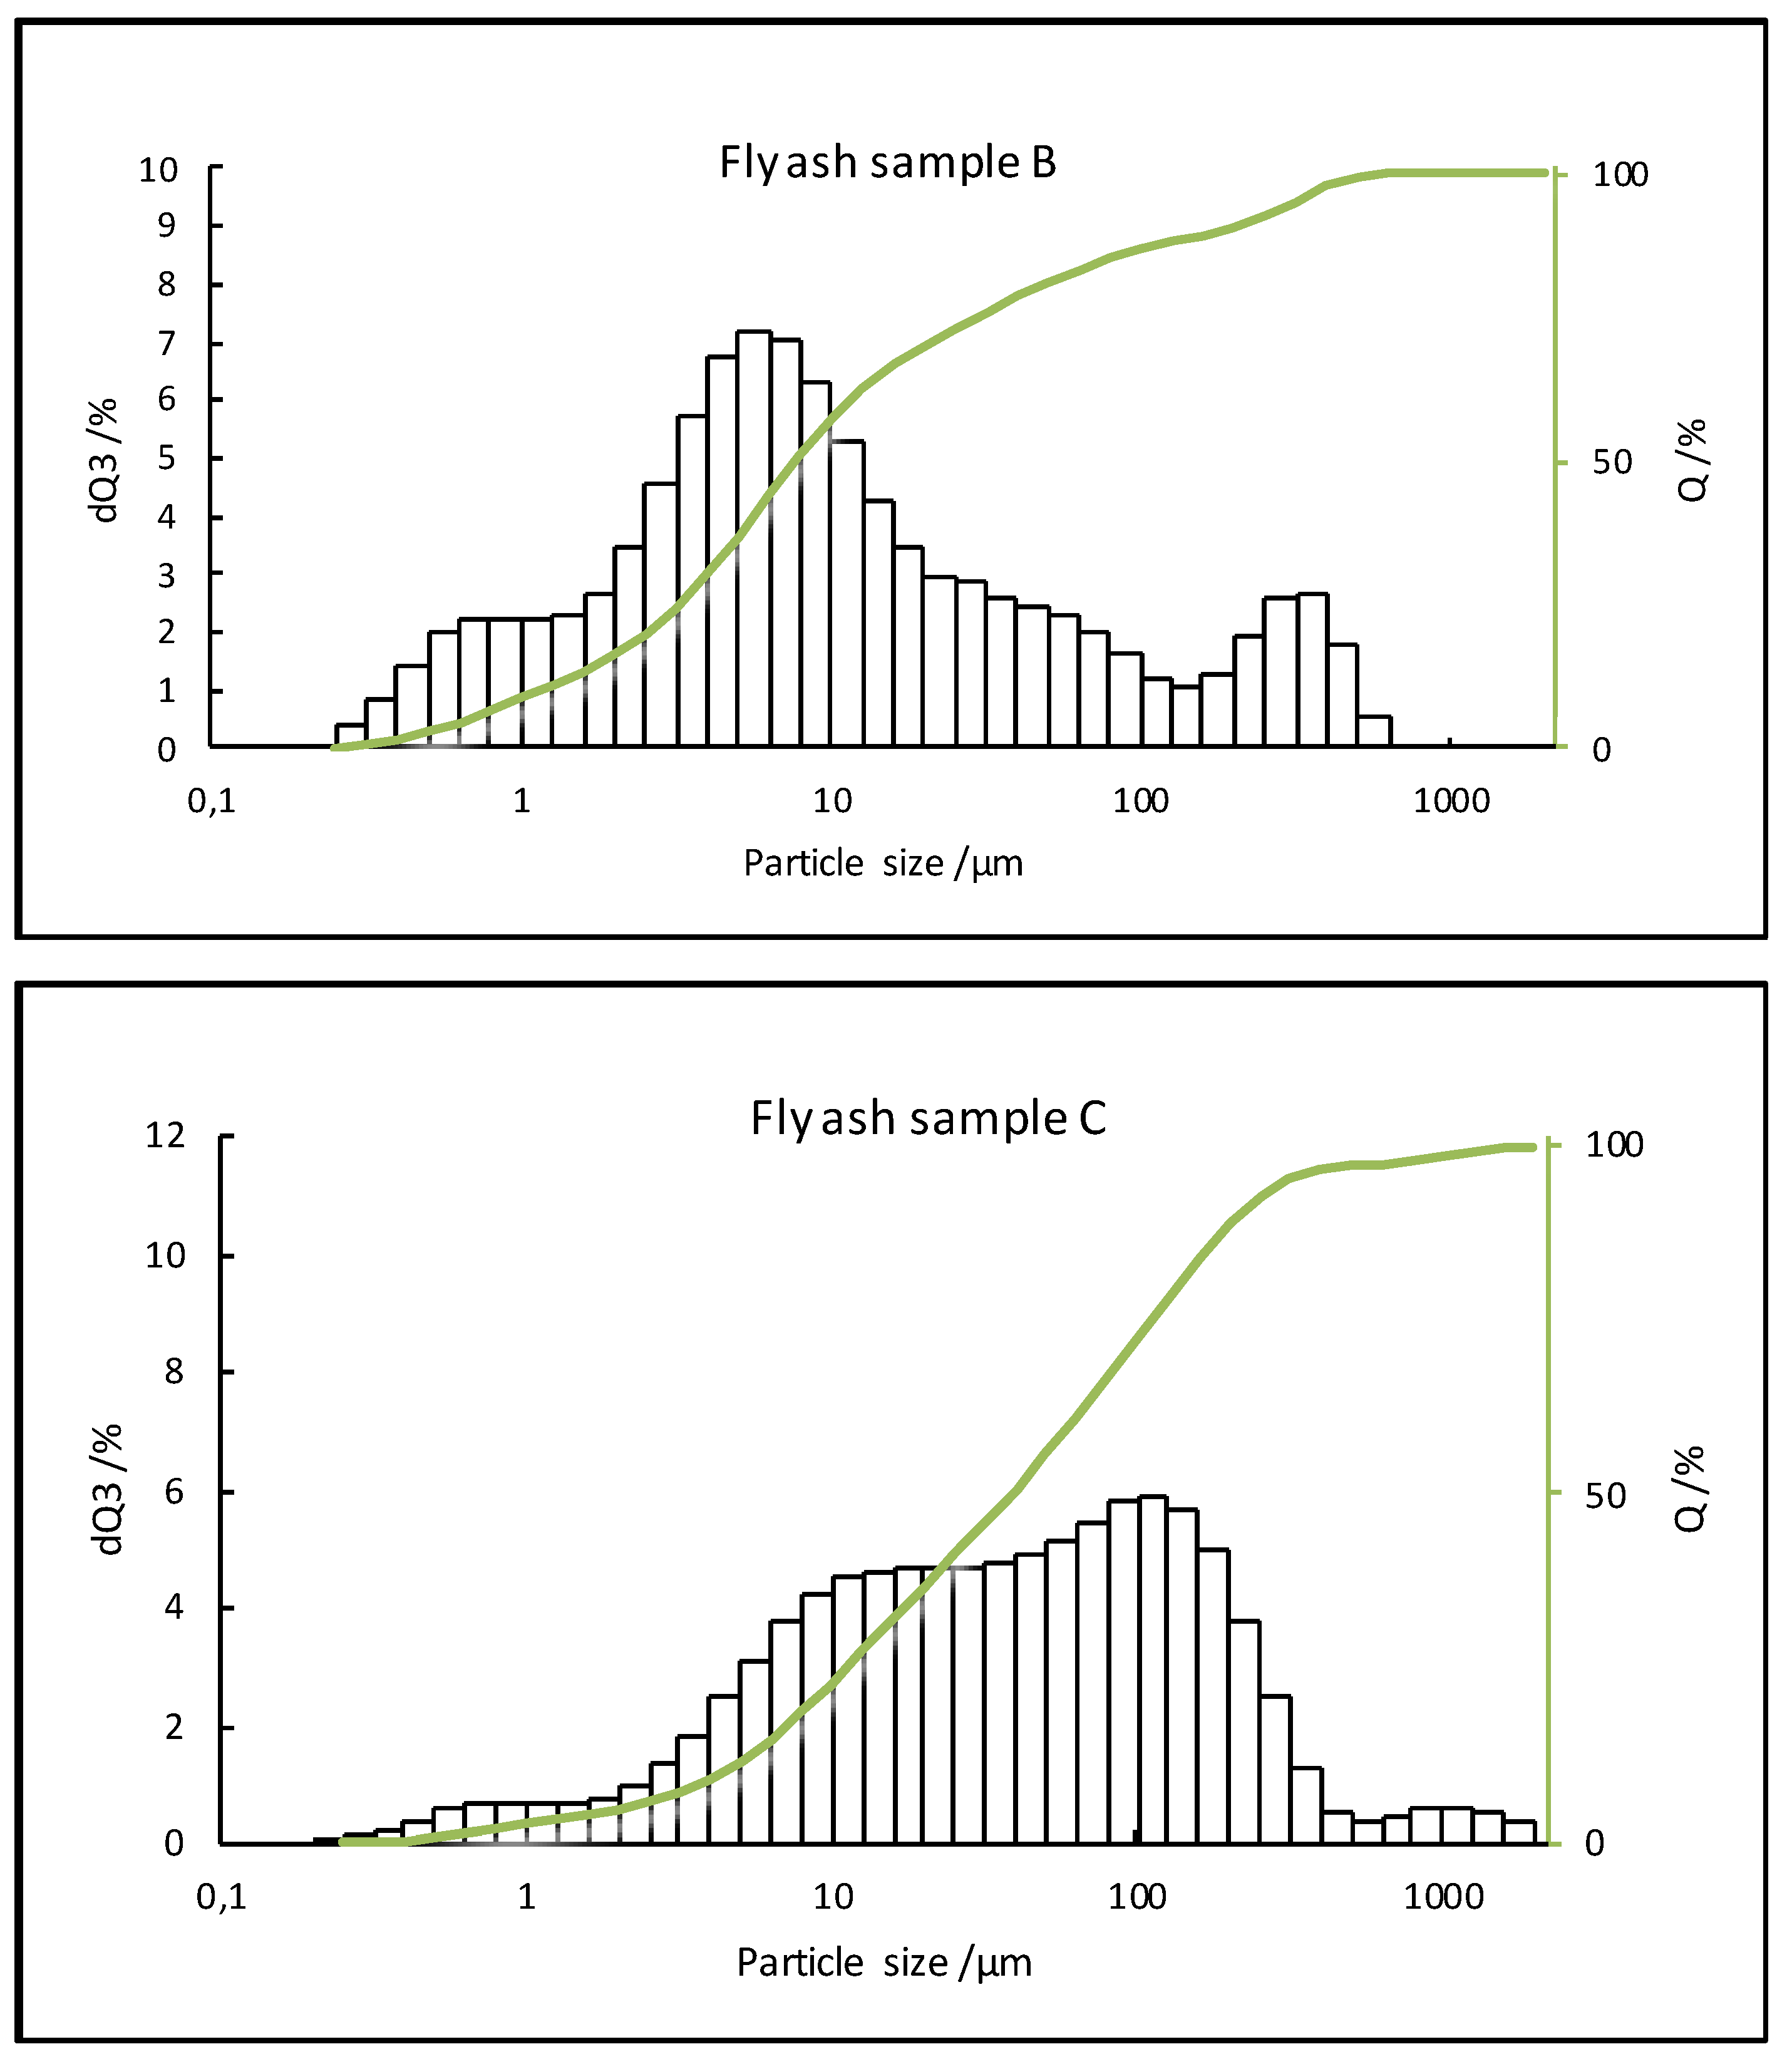
2.2. Particle Size Distribution (PSD)

The laser diffraction analyzer was used for the PSD measurement (Mastersizer 2000, Malvern PANalytical, Almelo, The Netherlands) with the 633 and 466 nm red and blue neon helium light source. The measurement of particle sizes in 50 different categories of 0.02 to 2000 μm was achieved using this arrangement. All the samples examined were dry-dispersed at an air pressure of 2 bar injector. On the vibrating gutter, a mass was placed between 2 and 10 g, and an average measurement of at least six was carried out for each sample [19,27].

2.3. X-ray Fluorescence Spectroscopy (XRF)

The chemical composition and percentage of the fly ash was determined XRF (Panalytical Axios, Almelo, The Netherlands). Samples for XRF were prepared with 6 g lithium tetra borate per 0.5 g of ash, derived from fly ash at 1000 °C. The perls were heated in a platinum sink and mixed in a Philips PerlX3 model (PANalytical B.V., Almelo, The Netherlands). The SIEMENS SRS 3000 spectrometer with a Rh target tube contained an elemental analysis under standard conditions [19,27].

2.4. Inductively Coupled Plasma Atomic Emission Spectroscopy (ICP-OES)

Total nonmatrix element content analysis has been performed by means of an ICP-OES (Optima 8300 ICP-OES spectrometer fitted with a SC-2 DX FAST sample preparation equipment) in aqua regia under EN 13657 (2002) and afterwards by means of the EN 11885 (2009) analysis (Perkin Elmer, Waltham, MA, USA). For the calibration, a special standard of a single element was employed [19,27].

2.5. X-ray Diffractometry (XRD)

A PANalytical X’pert-Pro diffractometer has been measured in powder XRD (CuK_, 45 kV, 50 mA, continuous scan, Soller slits 0,04 rad, Bragg–Brentano HD mirror, X’Celerator detector, 2Q range 5_–70_, 200 s/step measuring time) (PANalytical, Almelo, The Netherlands). The fly ash samples were manually pulverized for 5–10 min. The PANalytical HighScore Plus program suite on the ICDD database was used for evaluation and phase identification (ICDD, 2017) [19,27].

2.6. Simultaneous Thermal Analysis (STA)

A Netzsch STA 449 Jupiter instrument with a TGA–DSC sample holder was used in the data generation in the varied environments (Erich Netzsch GmbH & Co. Holding KG, Selb, Germany). The instrument kept an air-cooled double-jacket, a heated vapor intake, heated transmission line and heated collar. The oven was regulated by an S-type thermocouple in temperature operation range between 25 °C and 1250 °C. All samples were taken with various gas atmospheres (N2, CO2 and CO2/H2O) in aluminum oxide crucibles [19,27].
To obtain representative samples for STA measurements, the received ashes from industries were mixed and STA measurements were repeated with different samples. Minor deviation in the STA results could be identified. The sample mass used for STA measurements in each run was ca. 30 mg. The experimental conditions and temperature profiles can be found in results and discussion.

2.7. Leaching Test

The leachability test was conducted on the original samples in compliance with EN 12457-4 standard (2002). The sample size ratio was 10 (L/S) with ionized water, and was then analyzed using the ICP-OES (Optica 8300 ICP-OES spectrometer with SC-2 DX FAST sample preparation equipment) in accordance with EN 11885 (2009) (Perkin Elmer, Waltham, MA, USA) [19,27].

2.8. Scanning Electron Microscopy (SEM)

The SEM pictures have been made with an FEI Quanta 250 FEGSEM (FEI, Hillsboro, OR, USA). For the record an acceleration voltage of 5 kV was chosen under a high vacuum of 6 × 10 6 mbar. An increase of 1000 can be quite good compared to greater resolutions for the thermal treatment of the samples [19,27].

3. Results and Discussion

3.1. X-ray Fluorescence Spectroscopy (XRF)

The results of the chemical composition of the fly ash samples in oxide form are presented in Table 2. The chemical composition of fly ash samples is significantly influenced by fuel composition, combustion technology, and additives injected into air pollution control devices (APCDs) [33].
Fly Ash Samples A and B show a very comparable chemical composition. CaO, SiO2, and Al2O3 make up the majority of the total oxide content in these two samples, accounting for more than 90% of the total oxide content. CaO is the main component of fly ash samples A and B (above ~60%), while SiO2 in Fly Ash Sample C is the dominant component (above ~34%). Scheeper et al. reported that CaO is the most abundant element in wood ashes [34].
The chemical composition of Sample C differs from Samples A and B due to the difference in fuel compositions; e.g., sewage sludge results in a noticeably higher content of phosphorus (~4%) and iron oxide (~5%) in its chemical composition. Moreover, the higher content of sulfates and magnesium oxide of Sample C almost doubles compared to Samples A and B.
In addition to this, Sample C contains higher K2O (above ~4%) compared to the other two samples, which contain less than 1%.
Based on the XRF analysis, the high content of CaO in Samples A and B (>60%) is an interesting CaO-based candidate material for TCES investigations.

3.2. Inductively Coupled Plasma Atomic Emission Spectroscopy (ICP-OES)

Austrian landfill ordinance sets the limit value of the total content of three elements, particularly arsenic (As), cadmium (Cd), and mercury (Hg), as one criterion for waste categorization as hazardous or non-hazardous. The results of the total content of these three elements are determined by ICP-OES and presented in Table 3. The total content of other elements for Samples A and B is also determined.
The results show that the total content of As, Cd, and Hg for all fly ash samples is significantly below the limit values prescribed in the Austrian landfill ordinance. The high content of Al (above ~45,000 mg/kg) is notable for Samples A and B. Iron (Fe) is the element with the next highest content (above ~5900 mg/kg) followed by Zn with a content above ~2500 mg/kg. The metal contents of Cu, Pb, and Ba are in the range of 464–706 mg/kg. The contents of other metals such as Cr, Mo, Co, Ni, Sb, and Sn are lower than 70 mg/kg, except Sn and Sb for Sample A, with a higher content of Sb and Sn, (144 and 111 mg/kg, respectively).

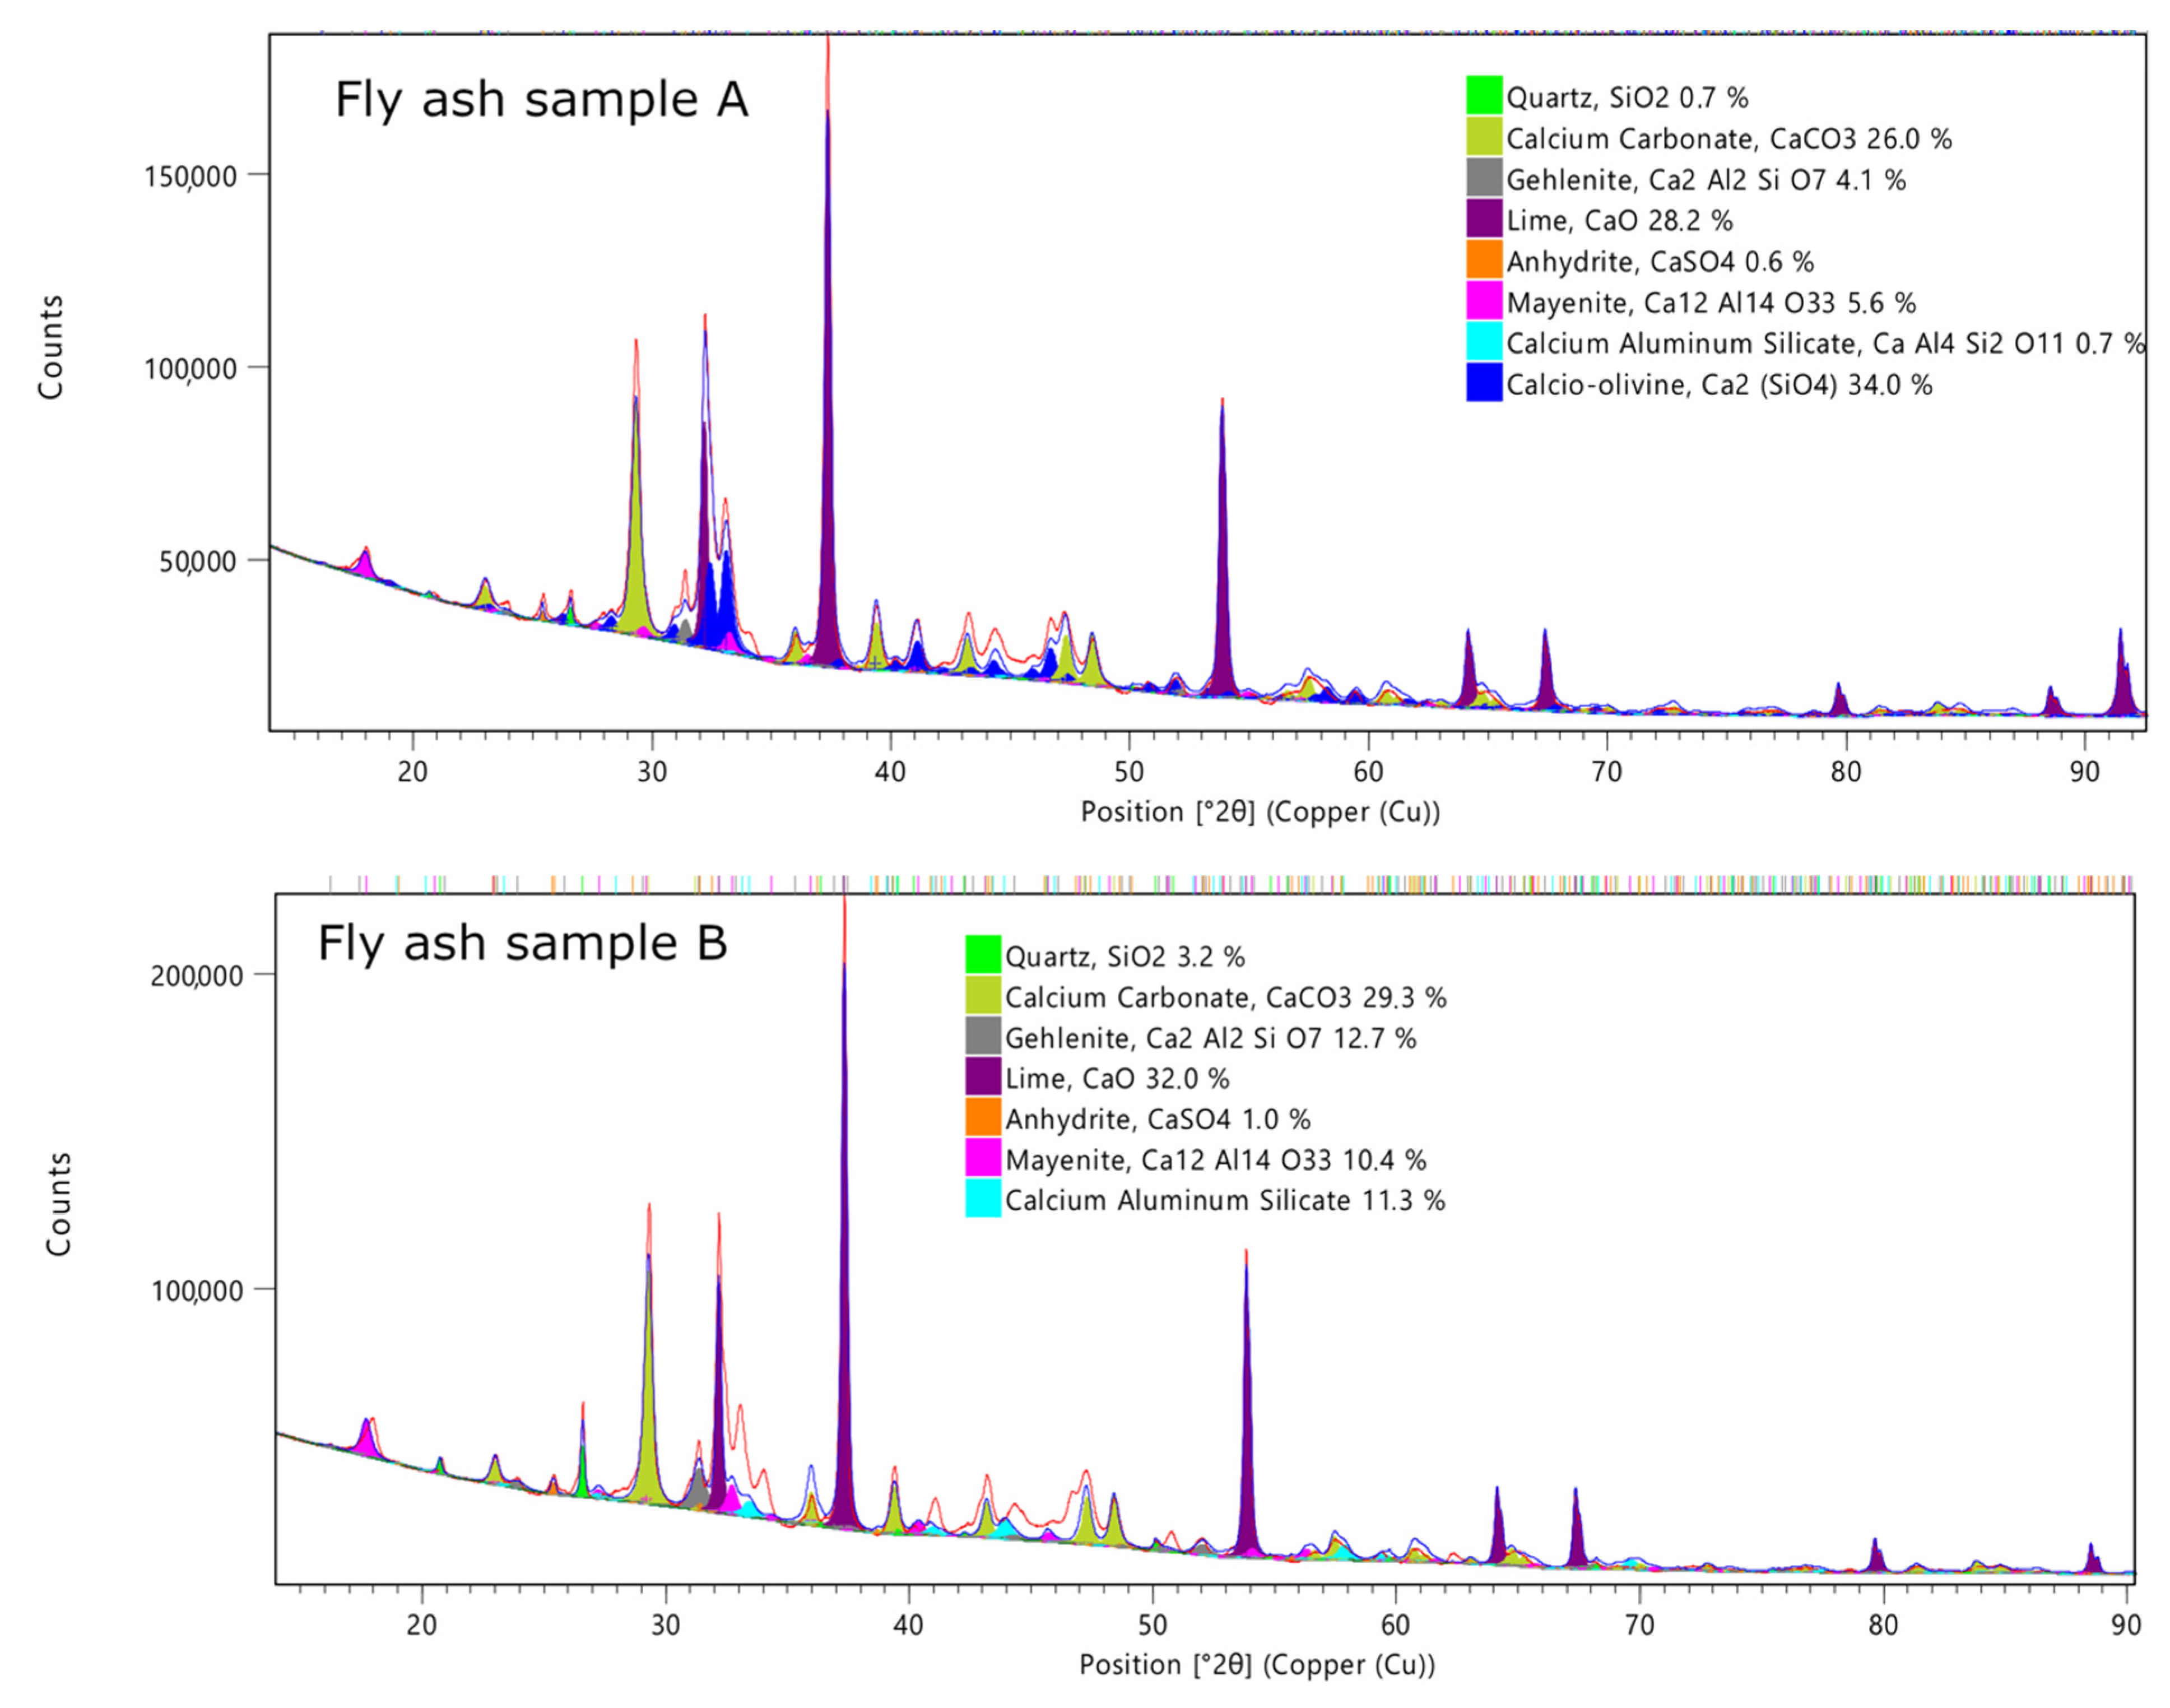
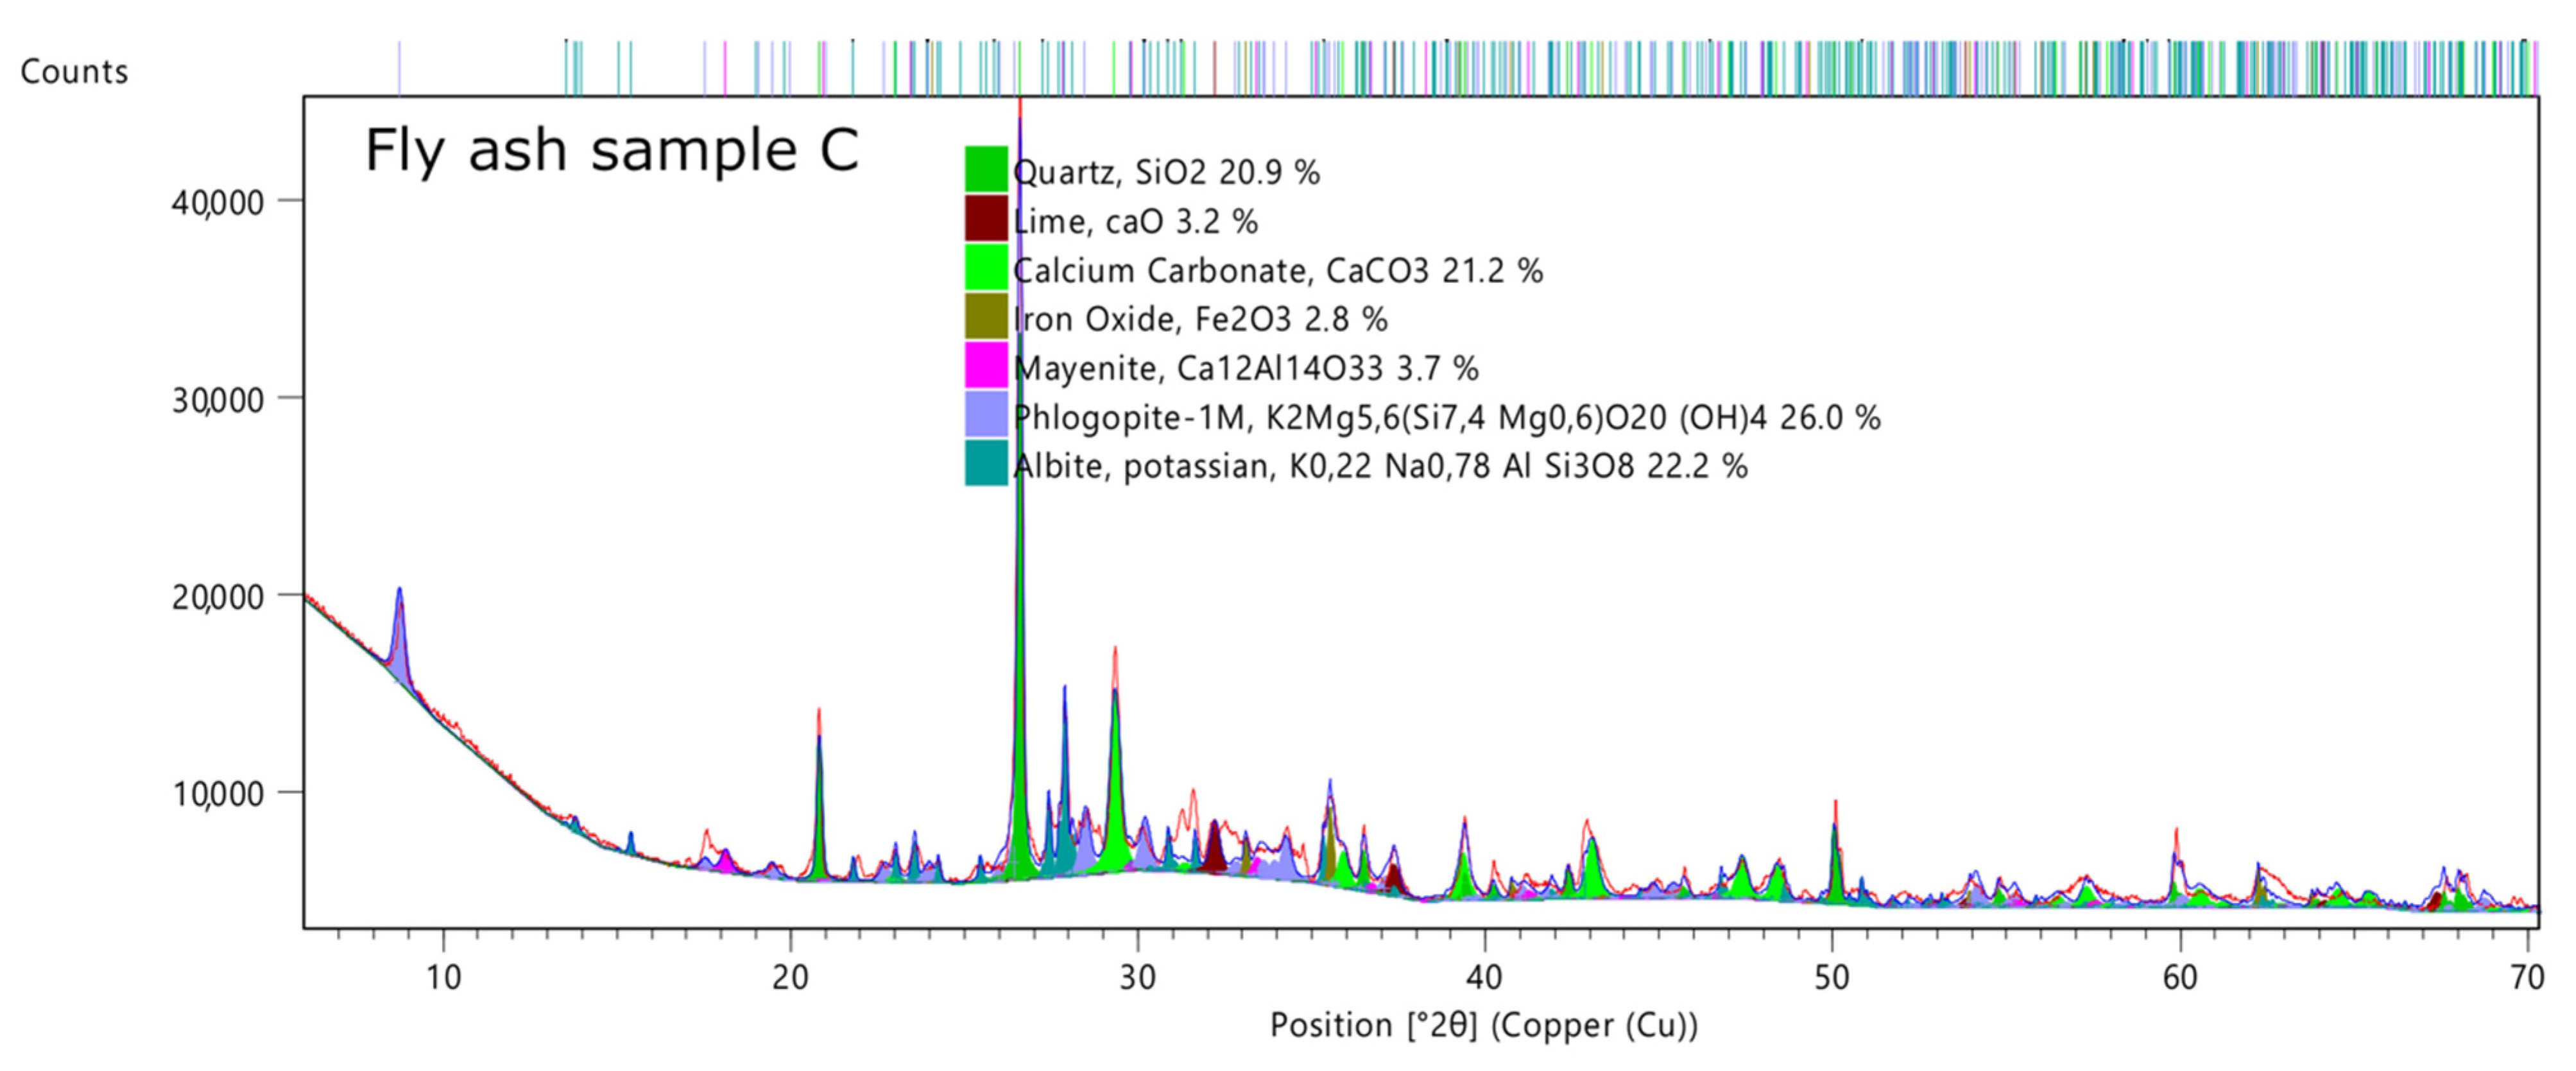
3.3. X-ray Diffractometry (XRD)

XRF analysis revealed the information about the elements in the fly ash samples in oxide form. To identify the phases of elements found via XRF, XRD analysis was performed. The results and evaluation of crystal phases are presented in Figure 4.
Since all of the samples had complex phase compositions, peak search routines were helpful in locating specific compounds. In all fly ash samples, quartz, calcite, and lime were identified. Mayenite and gehlenite were found to be aluminosilicates; however, albite and phlogopite were indicated in Sample C. The found iron in Sample C was in the form of hematite.
Based on the qualitative phase analysis of XRD, Ca appeared in the forms of calcite, lime, aluminosilicates, and anhydrite. In Samples A and B, less anhydrite was found.

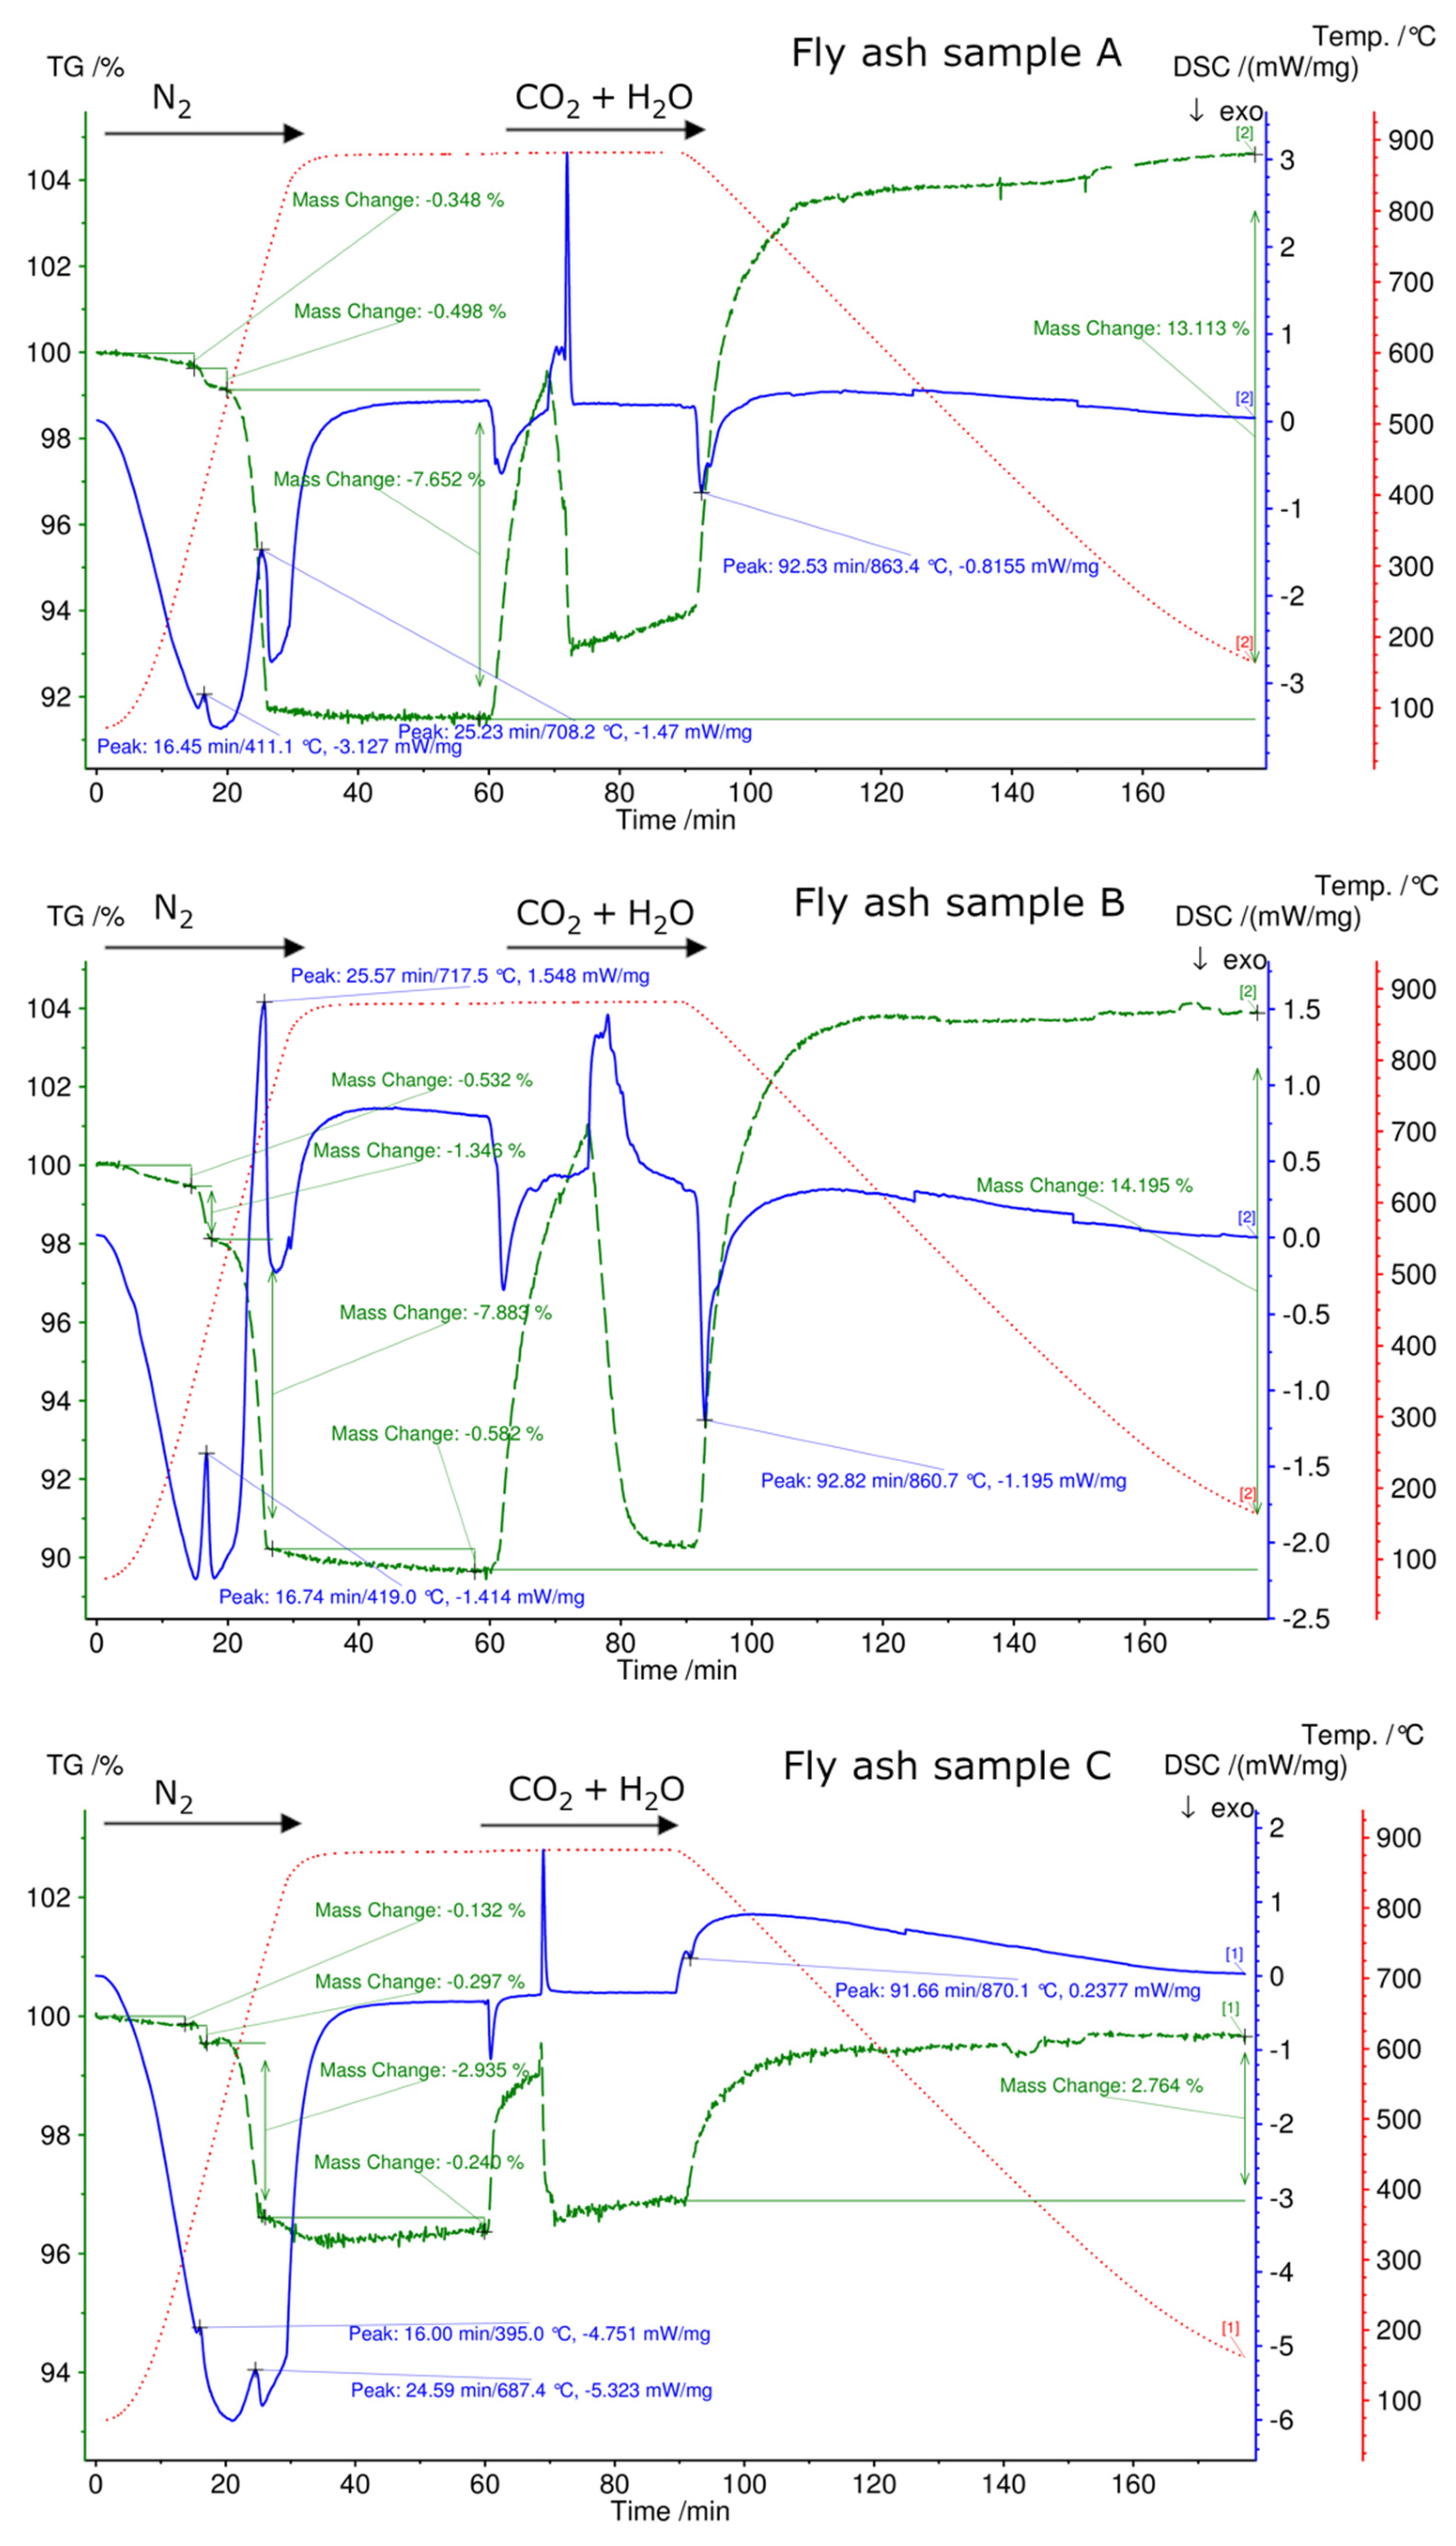
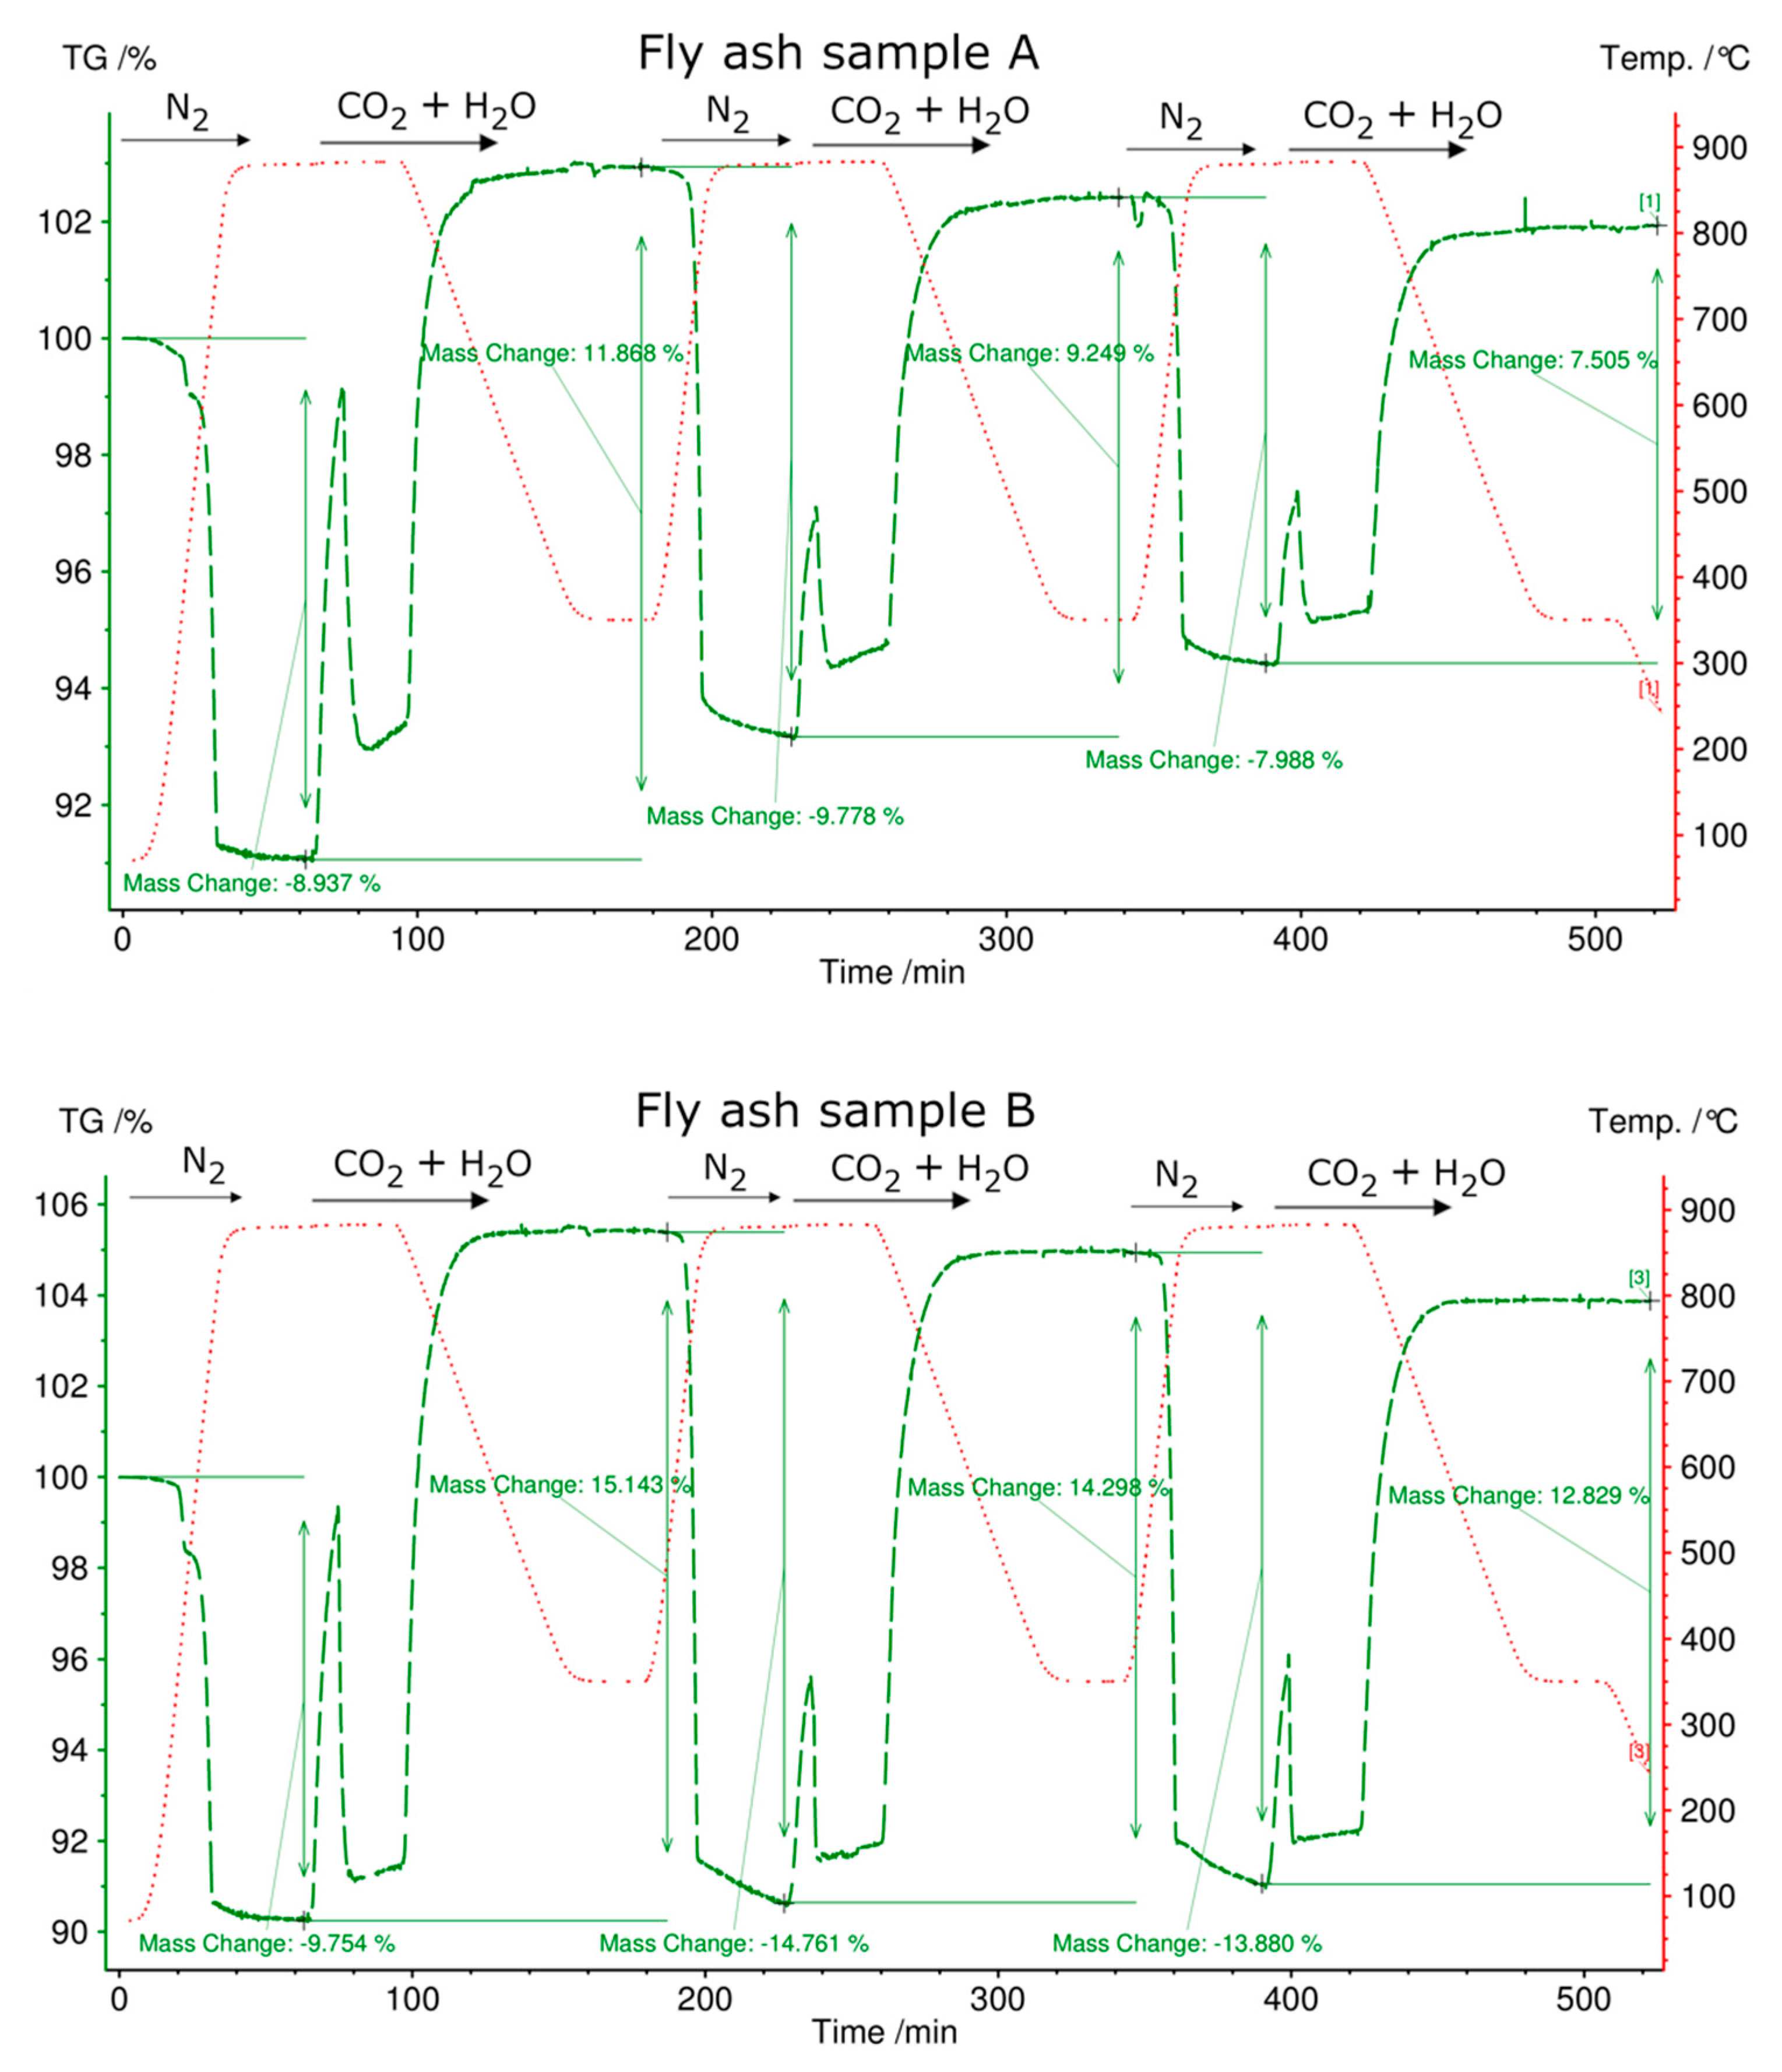
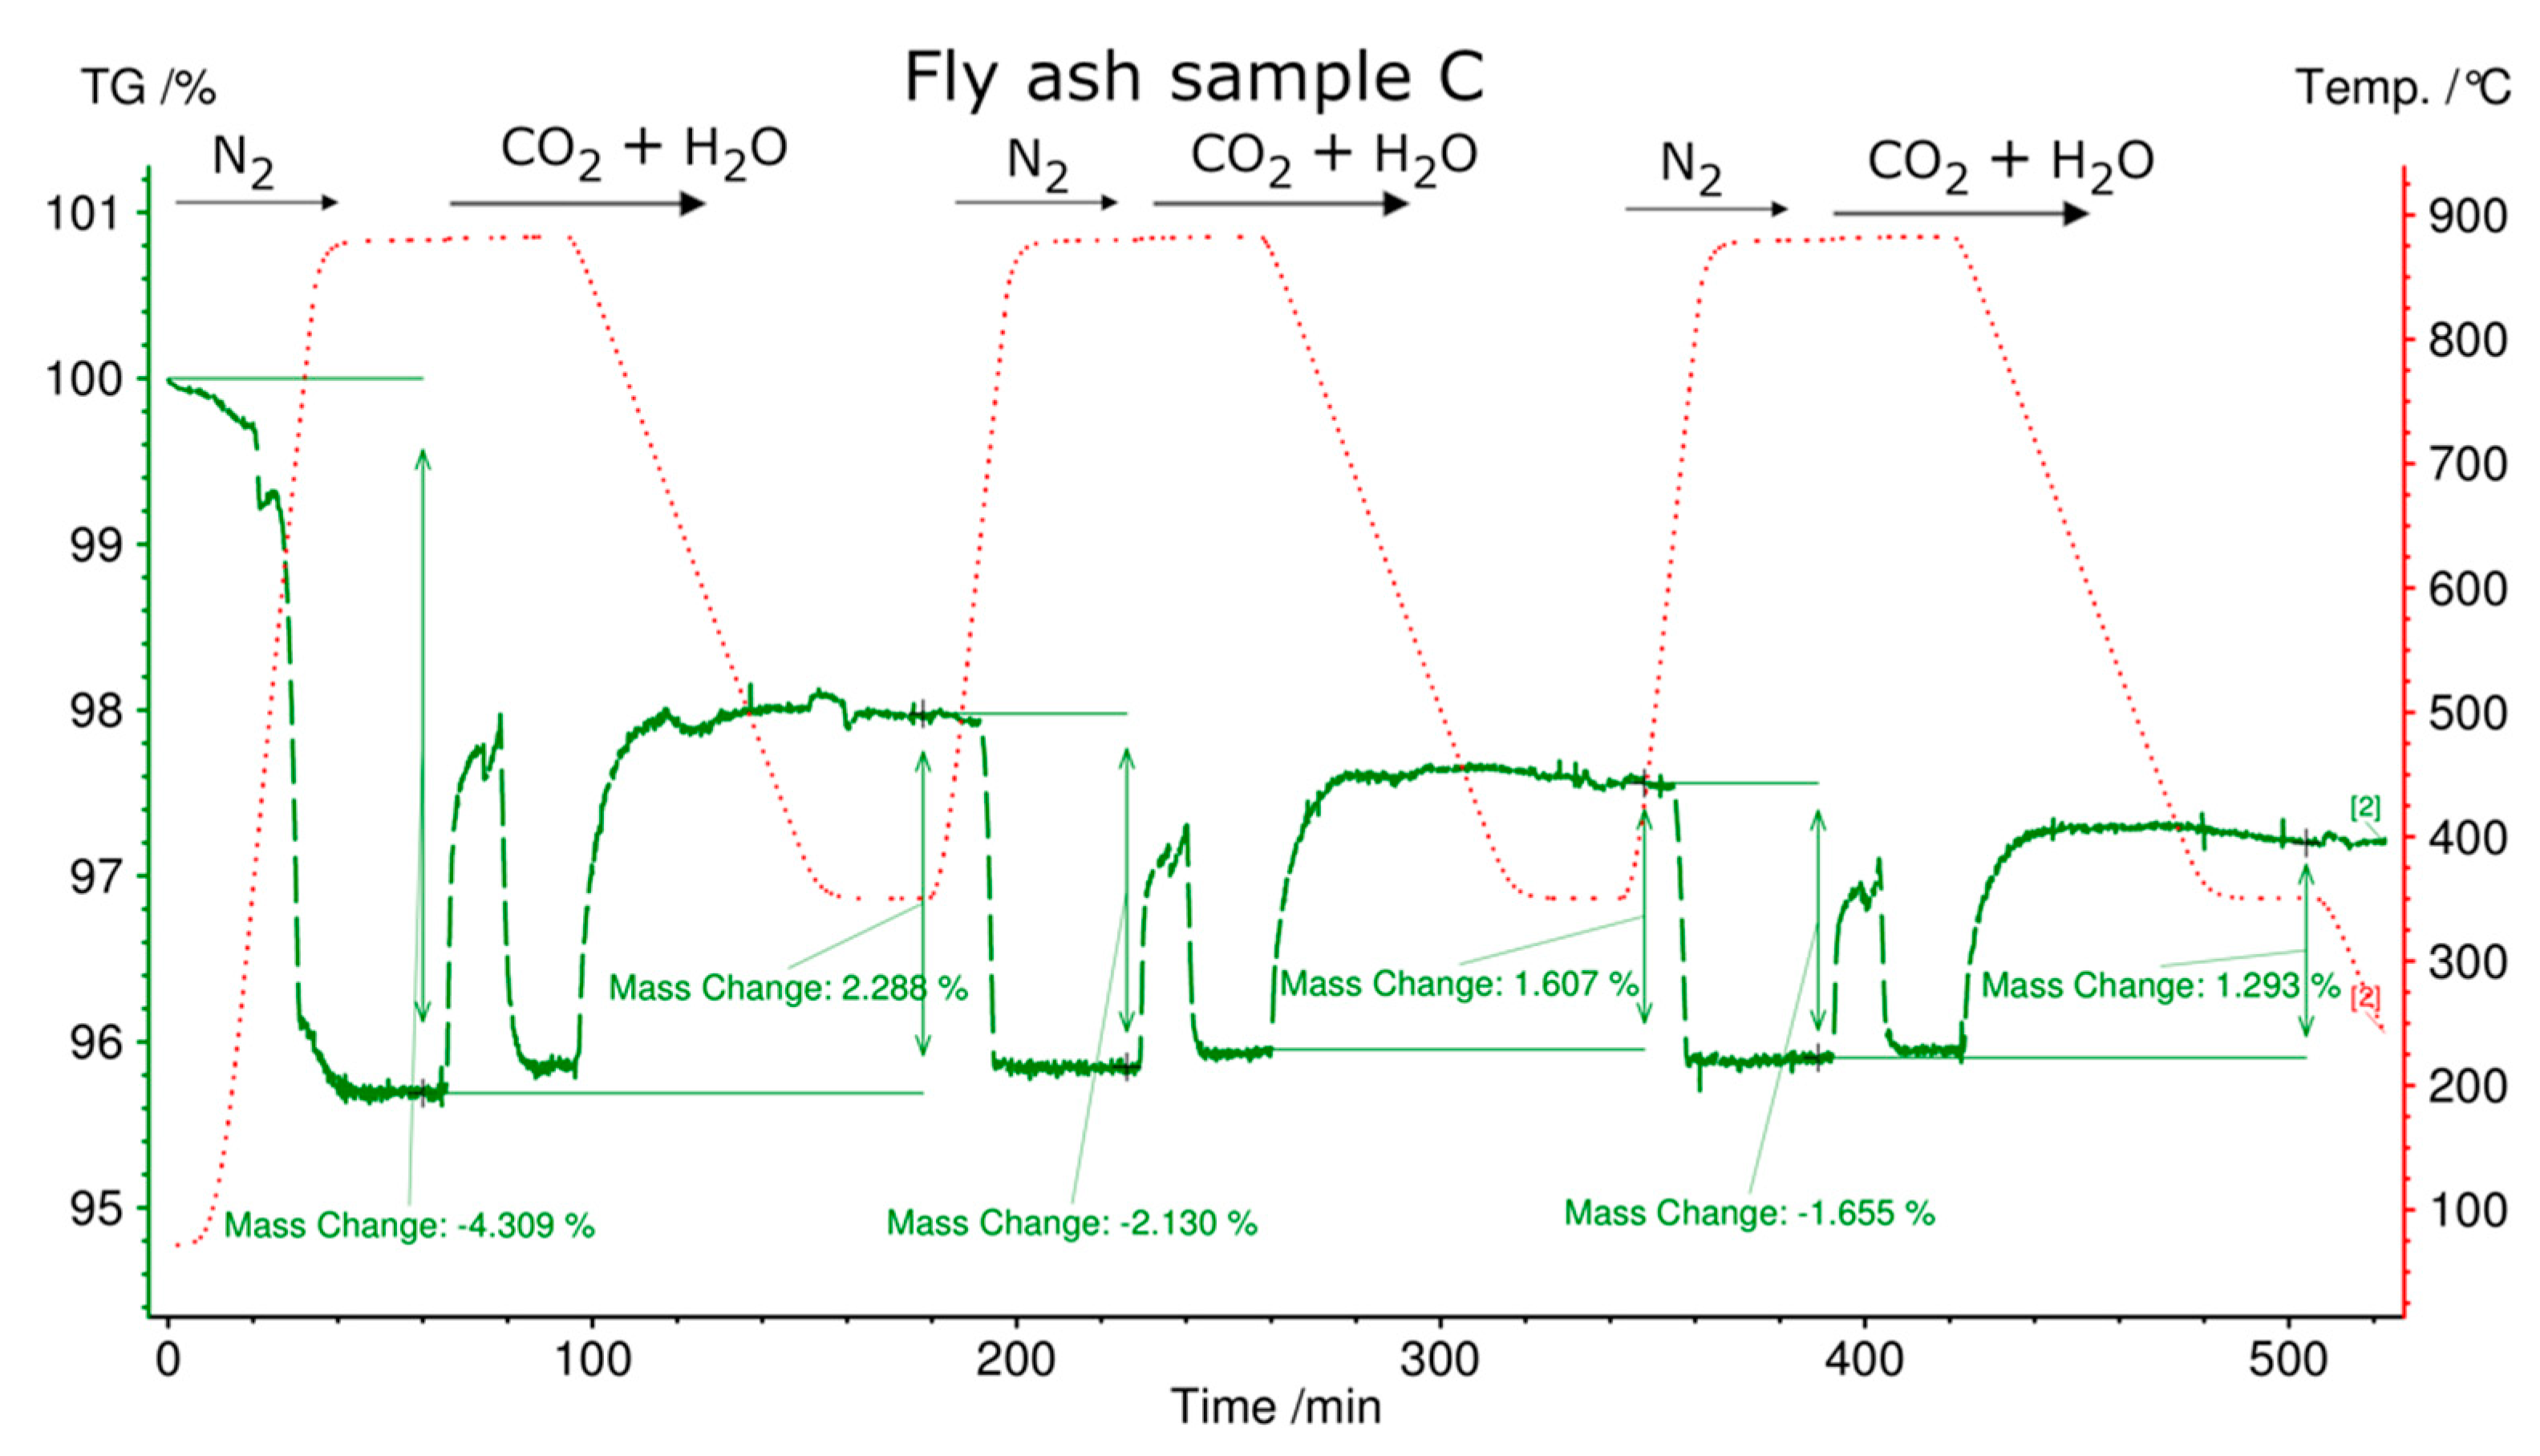
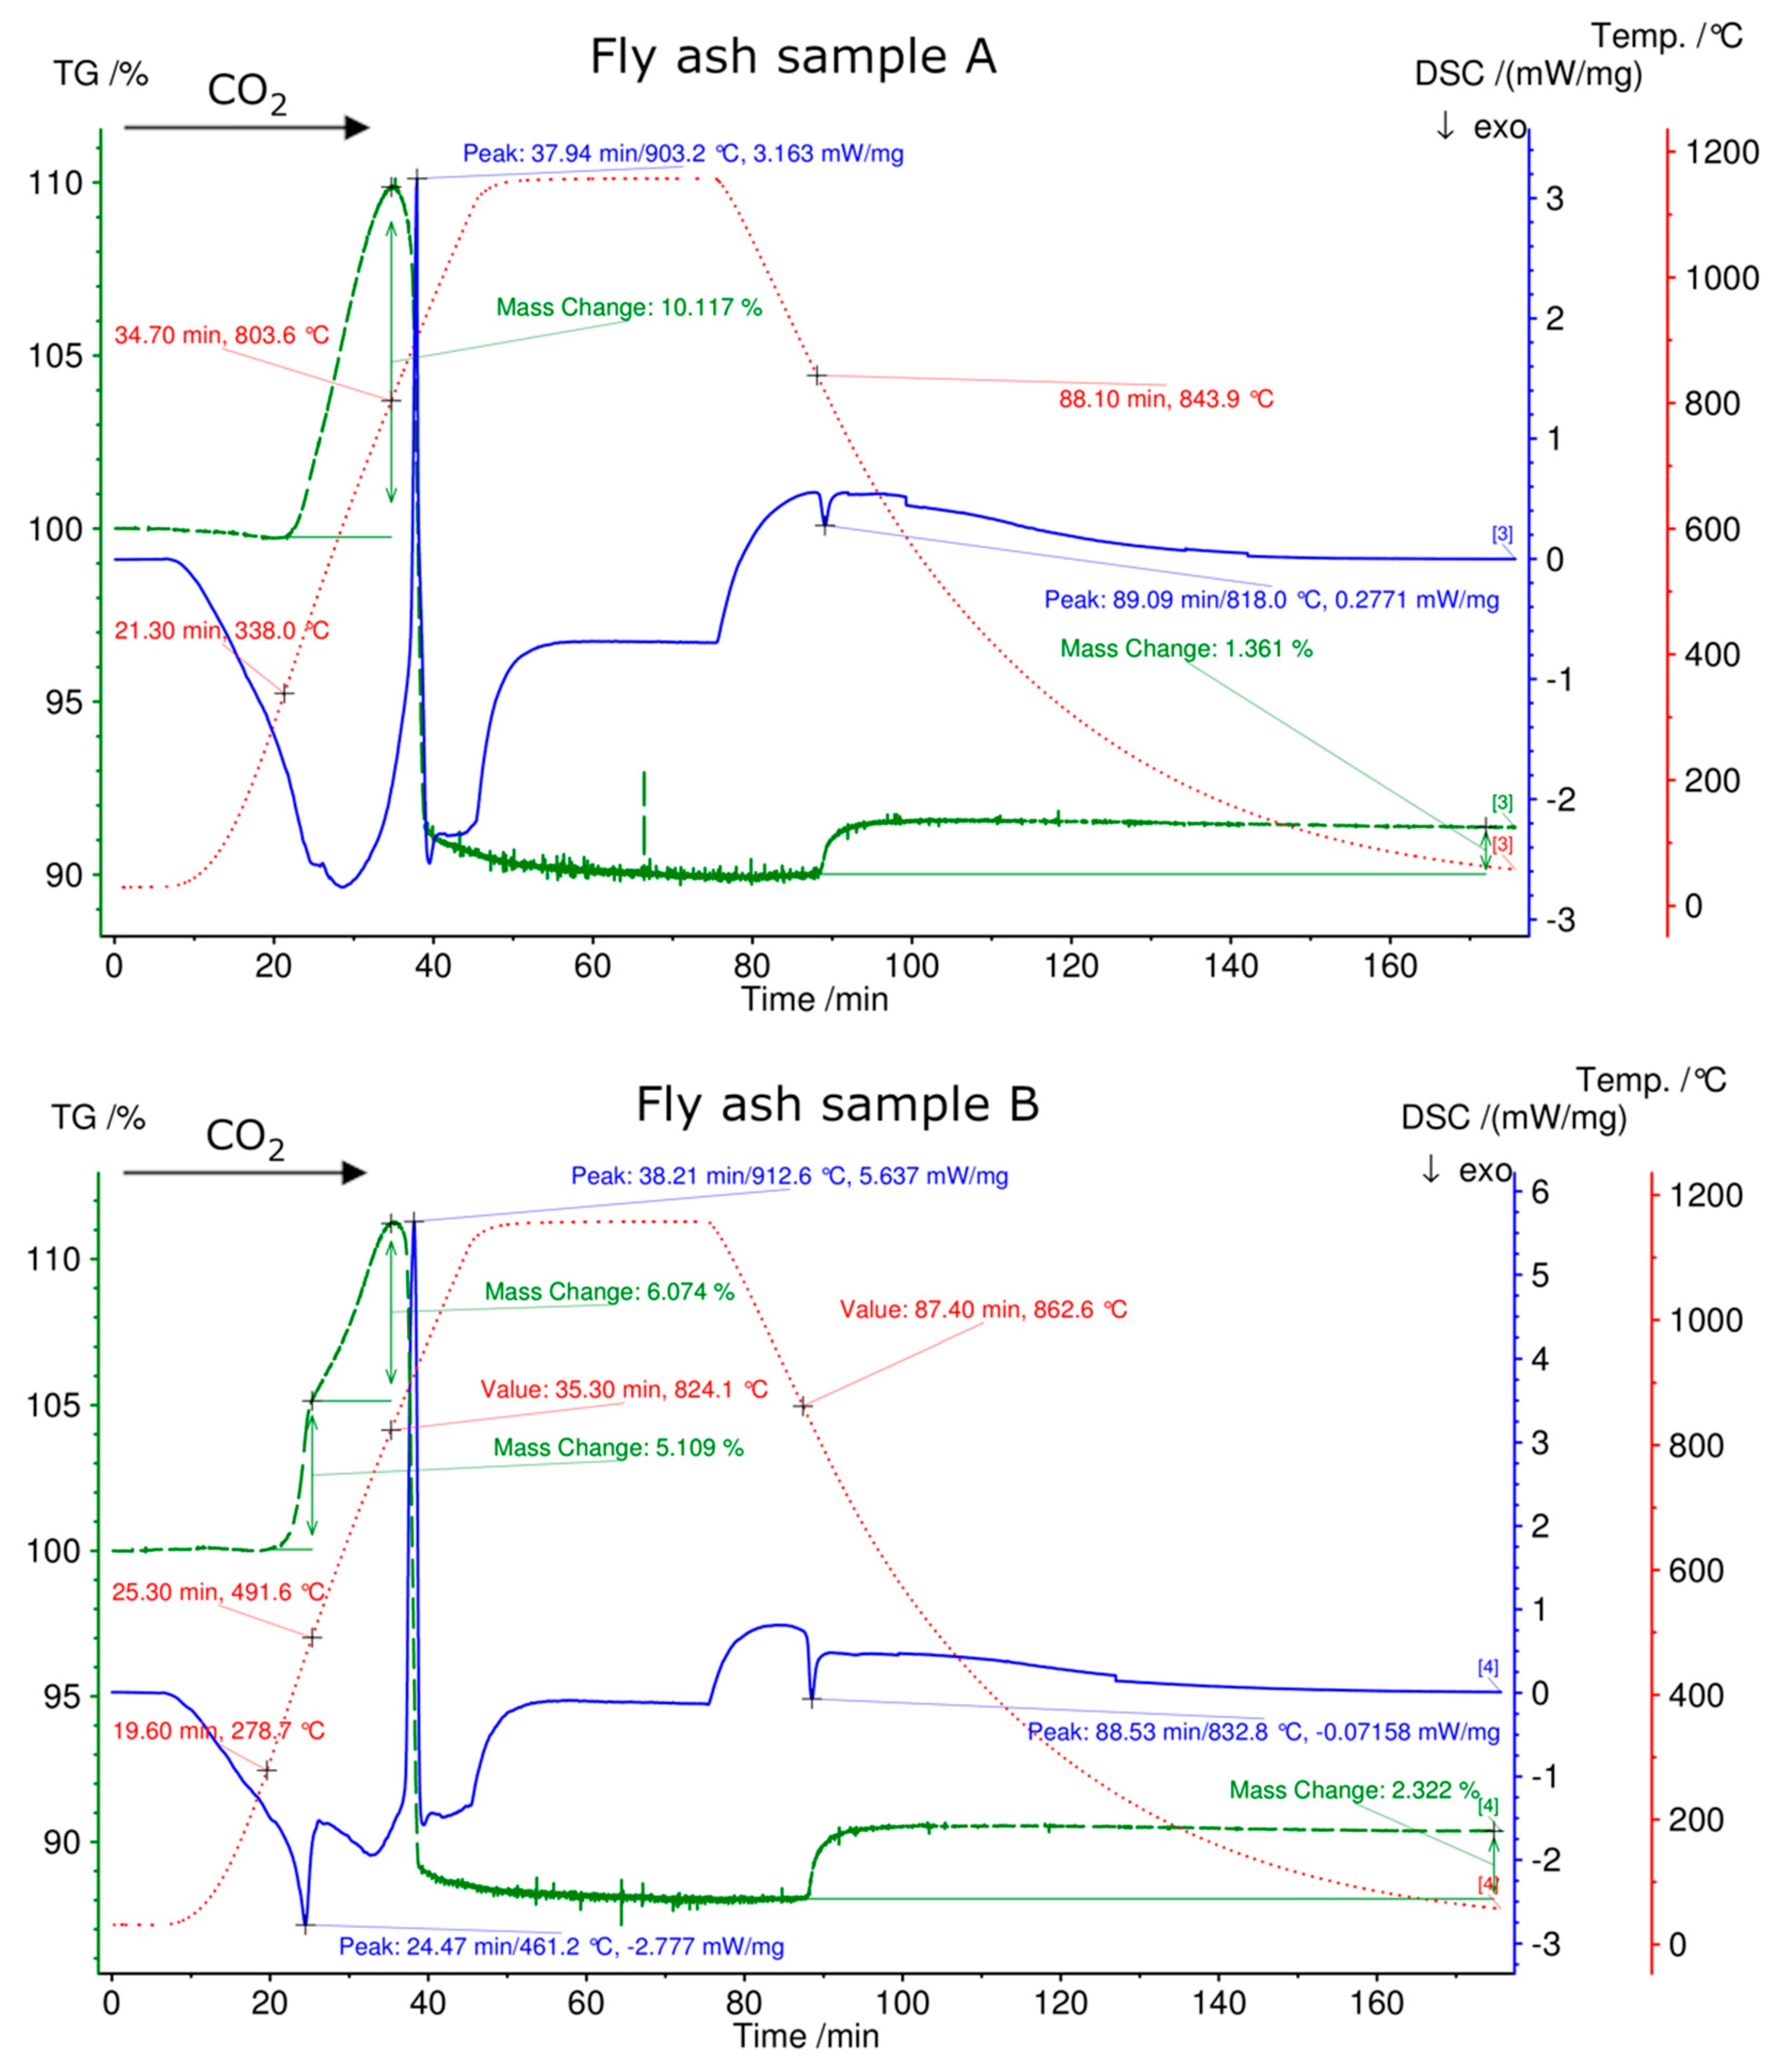
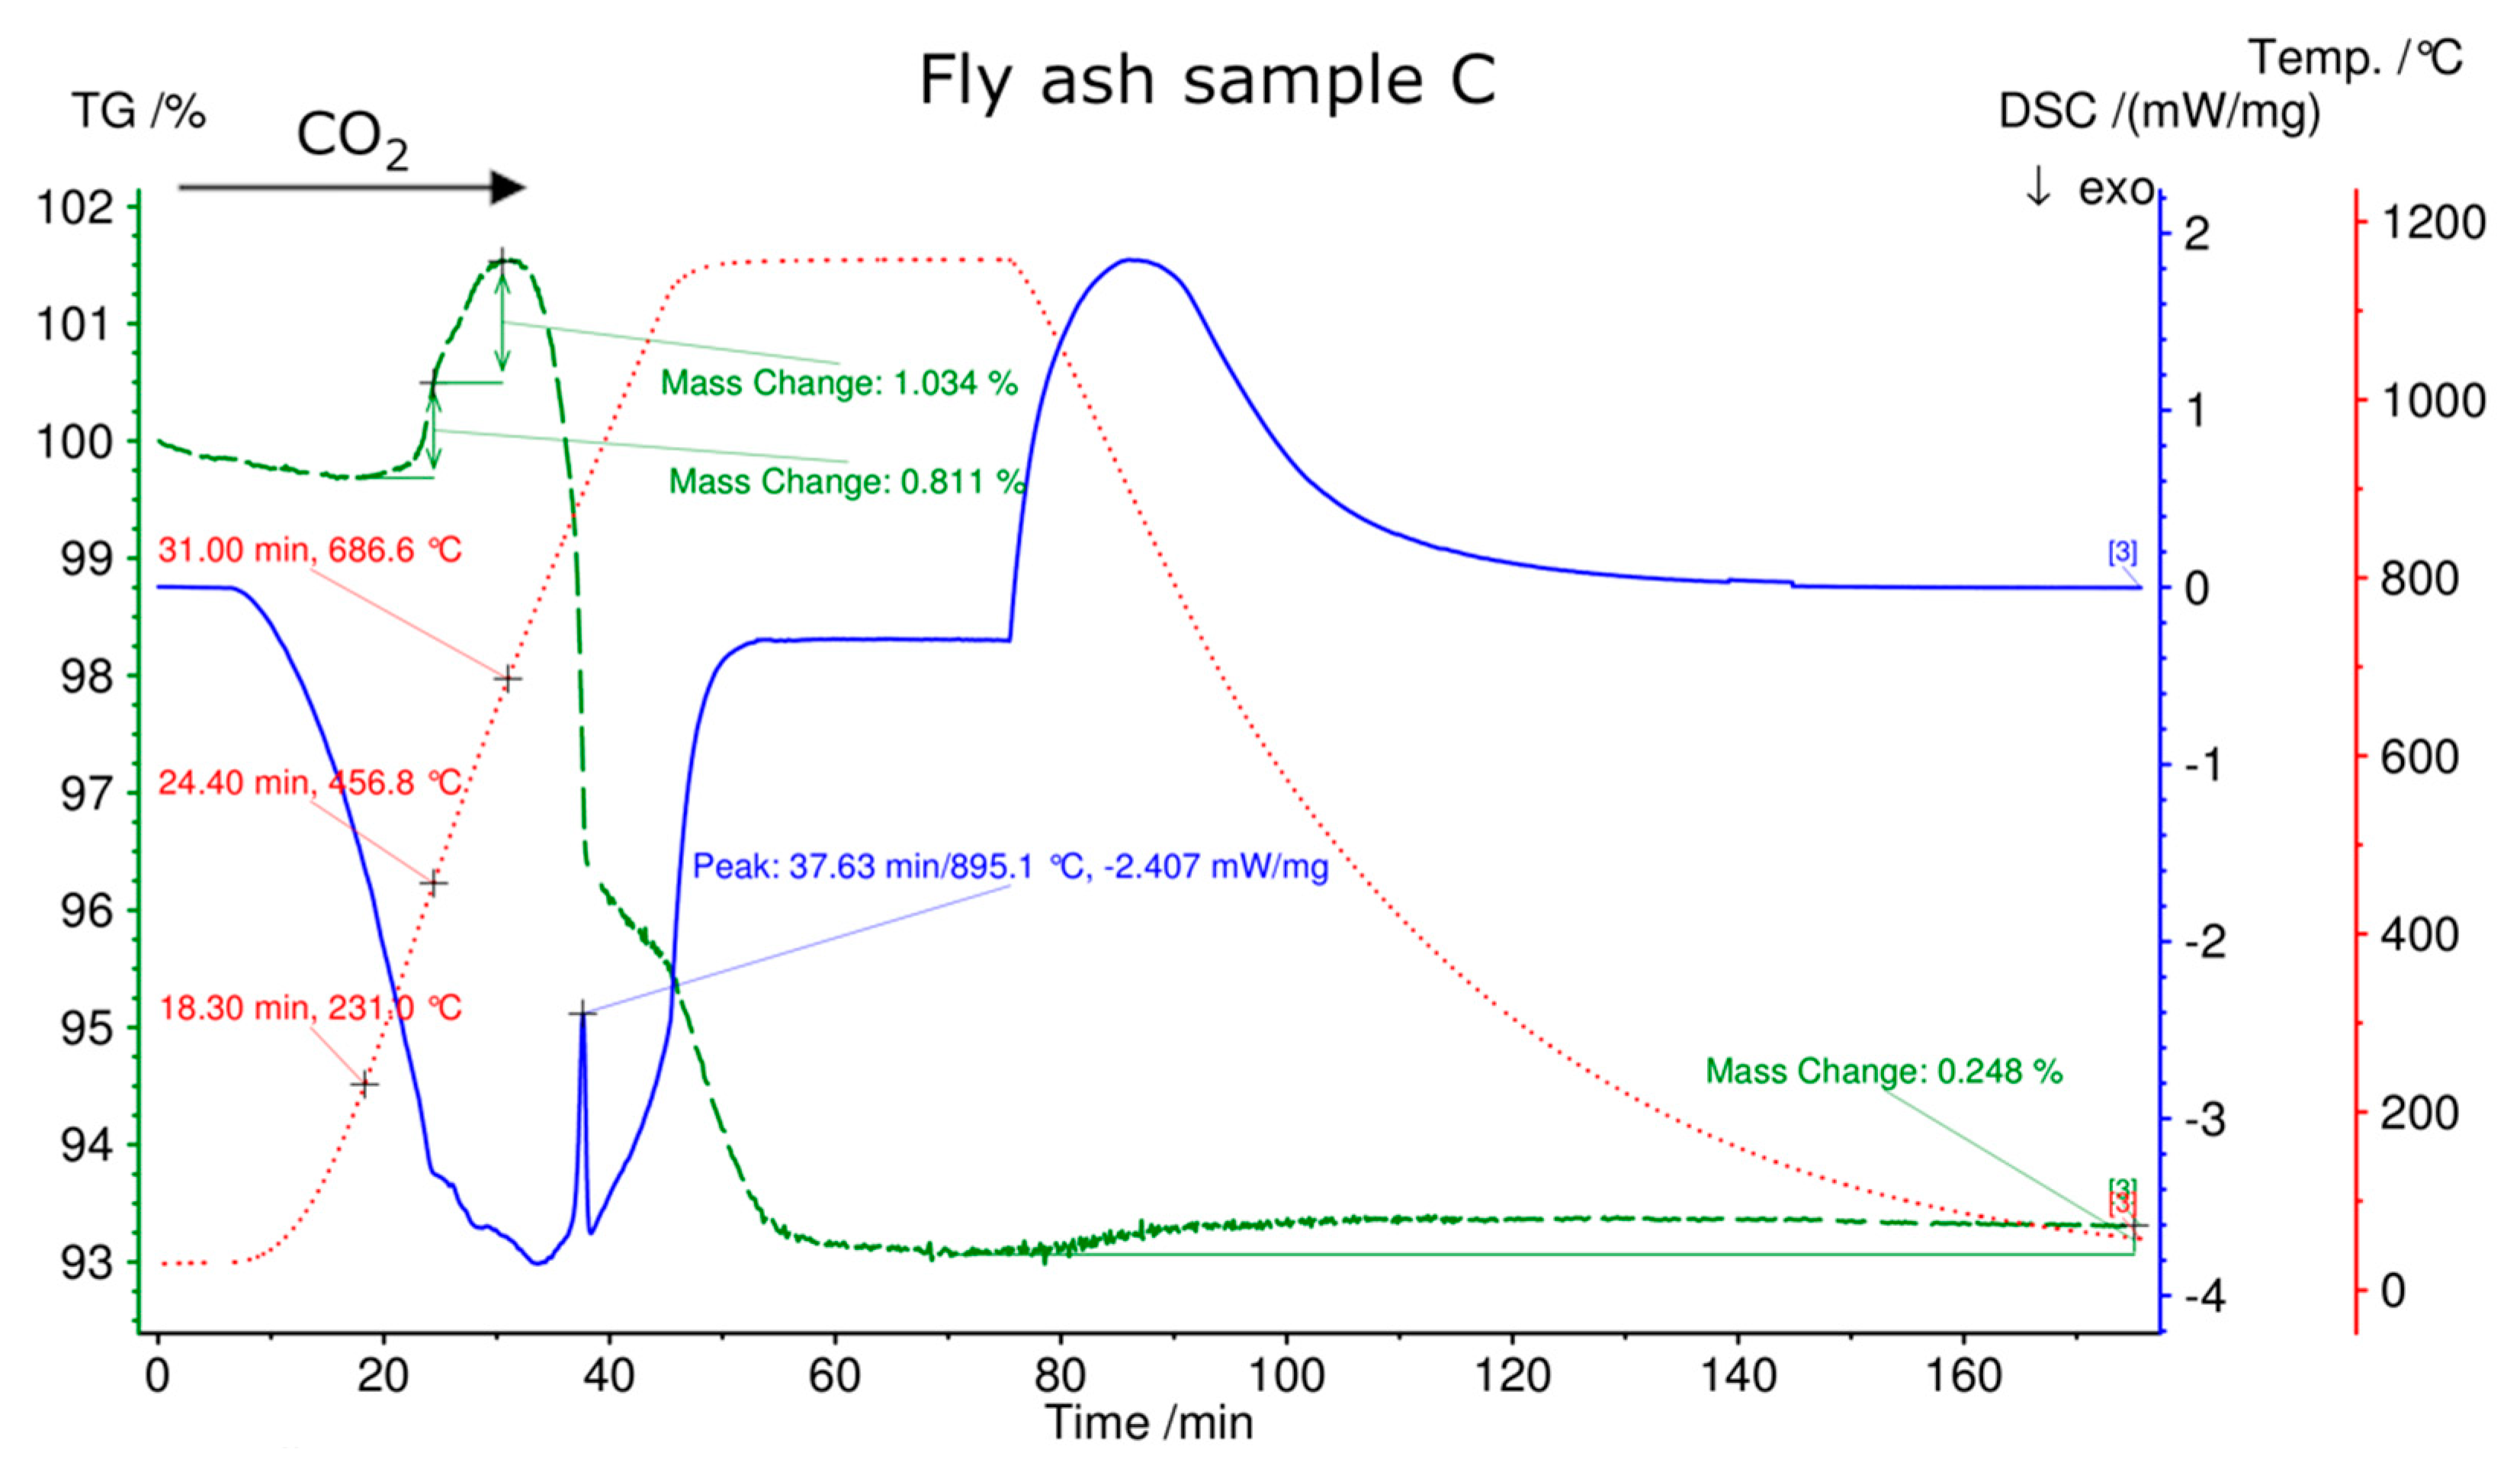
3.4. Simultaneous Thermal Analysis (STA)

To investigate the ability of fly ash samples regarding their potential to store heat (charging step) and release (discharging step) heat, the samples were subjected to STA. The charging step (endothermic reactions) was performed in an N2 atmosphere up to a sample temperature of 880 °C using a heating rate of 30 °C/min, whereas the discharging (exothermic reactions) was executed in CO2 and H2O atmosphere while cooling the system from 880 °C to 70 °C at a cooling rate of 10 °C/min. Figure 5 illustrates these experimental runs for Samples A, B, and C. The green line, blue line, and dashed red line represent the mass change, differential scanning calorimetry (DSC), and temperature profile, respectively. In the temperature range of 70–880 °C, three steps of a mass loss of 8.5% in total in Sample A and four steps of a mass loss of 10% and 3.4% in total in Samples B and C could be identified, respectively. The designated endothermic peaks on DSC signals indicated endothermic reactions (charging) with a thermal treatment up to 880 °C; thus, the samples can store excess heat energy available from any renewable sources, such as concentrated solar power.
After maintaining the temperature for 30 min at 880 °C, the atmosphere changed into a mixture of CO2 (100 mL/min) and H2O (1 gh−1), and was maintained for another 30 min at this temperature to stabilize the system before cooling down to 70 °C. In all examined fly ash samples, the change in atmosphere caused a mass increase, followed by an exothermic peak, which decreased after a couple of minutes, and then an endothermic peak. This effect occurs in all three tested samples. However, further investigation is needed in order to clarify this issue.
The carbonation reaction of the charged fly ash samples in the presence of water vapor started while cooling the system from 880 °C to 70 °C. Mass increases of 13.11%, 14.19%, and 2.76% could be identified through the carbonation of Samples A, B, and C, respectively, followed by exothermic carbonation peaks designated on DSC signals. It is worth mentioning that, for Samples A and B, the mass increase in the carbonation discharging step was greater than the mass loss in the charging step in the N2 atmosphere. This finding is the result of the already existing free lime in Samples A and B, confirmed by XRF and XRD results.
Table 4 and Table 5 summarize the detailed information of the mass change in charging and discharging and the related temperature range for each mass change, including the exothermic or endothermic reactions identified by DSC signals.
The desorption of physically and chemically adsorbed water in fly ash samples causes a mass shift of 0.1–0.5 percent in the temperature range 70–356 °C [35]. The second mass loss in the temperature range 313–534 °C occurred because of the decomposition of metal hydroxides, such as Mg(OH)2 and Ca(OH)2 [36]. The third mass loss from 434 °C to 880 °C indicates the decomposition of carbonates, and the fourth mass loss from 716 to 880 °C, regarding Samples B and C, is related to the breakdown of sulfates and chlorides [19,27,35,36]. The complete carbonation was reached after approximately 40 min in each step for all kind of fly ash samples.
The energy content of fly ash samples up to 880 °C in an N2 atmosphere and the amount of energy released through exothermic carbonation reactions are given in Table 6. The calculated stored energies are based on integrations of DSC signals with a linear baseline for endothermic reactions (charging), and the released energies for the exothermic carbonation reaction (discharging) are based on the mass increase, assuming exclusively carbonation as the reason.
The cycling stability test was performed for all fly samples because they met the first requirement (heat storage/charging step) and second requirement (heat release/discharging step) for use as TCES materials. The selected experimental condition for each cycle was the same as previously described for one charging and discharging step (barring the system cooling from 880 °C to 350 °C and maintaining 350 °C for 30 min). Three cycles were performed for each fly ash sample.
The mass change for each charging and discharging is illustrated in Figure 6, and the related stored and released heat energies are summarized in Table 7. The mass signal indicates that the carbonation conversion in the presence of water vapor reduces in the first three steps, as well as the decarbonation step of the second and third cycles.
A comparison of carbonation conversion of the first and third cycles shows a conversion reduction of 4.3%, 2.3%, and 0.9% for Fly Ash Samples A, B and C, respectively. This indicates that there is a lack of cycle stability in all these fly ash samples under the selected experimental conditions.
To evaluate the CO2 storage potential and thermal behavior of the fly ash samples under a pure CO2 atmosphere, they were subjected to STA on an as-received basis, with an operating condition of heating up the system from room temperature to 1150 °C, using a heating rate of 30 °C/min. The results of the performed experiments are shown in Figure 7. Based on the direct and dry method (L/S = 0), Samples, A, B, and C can store 100 kg, 110 kg, and 18 kg CO2 per ton fly ash, respectively. The same experimental run with MSW fly ash showed a CO2 storage capacity of 27 CO2 kg/t [27]. Viet et al. indicated a high carbonation degree of gasification fly ash with a capacity of 87.5 kg/t fly ash and less CO2 sequestration capacity of 3.1 kg/t fly ash from waste to energy plants [37].
Dindi et al. reported that the CO2 storage capacity of coal fly ash are in the range of 7.6–296 kg/t fly ash relating to different used method and chemical composition of fly ash samples [38].
The carbonation for Samples B and C occurs in two steps based on the thermogravimetric (TG) signal, whereas the carbonation of Sample A shows one step continuously. In the first step of carbonation, the outer layer of CaO is carbonated, which is controlled by chemical kinetics, and in the second, slower step, the inner part of CaO is controlled by the diffusion of CO2 in the pores [39]. The reason why these two carbonation steps cannot be observed for Sample A is beyond the scope of this study. However, it is an interesting issue for more investigation.
Based on the DSC signal, Sample B indicates the exothermic carbonation reaction, whereas the exothermic carbonation reaction for Samples B and C is not as obvious. The initial carbonation temperature is not the same for all samples (Sample A at 338 °C; Sample B at 278 °C; Sample C at 231 °C). The decarbonation temperature of Sample C at 686 °C is distinguished significantly from Sample A at 803 °C and Sample B at 824 °C. This difference may be the result of the high content of SiO2 in Sample C, verified by XRF analysis, which led to a higher thermal conductivity and reduced the carbonation and decarbonation temperatures [14,40].
Clear endothermic decarbonation peaks can be identified by DSC at a maximum of 903 °C, 912 °C, and 895 °C for Samples A, B, and C, respectively.
In the cooling phase of all experiments from 880 °C to room temperature (carbonation phase), a mass increase for all fly ash samples due to the carbonation of charged fly ash can be observed, followed by exothermic carbonation peaks designated by DSC signals of Sample A and B.

3.5. Leaching Test

The leaching test (EN 12457-4) was used to assess the first environmental effects of the fly ash samples. “Analysis of leaching plays an important role in determining the use and treatment of fly ash samples” [27]. The results of this test (EN 12457-4) are summarized in Table 8. The limit values for categorizing hazardous/non-hazardous waste material are also added in Table 8. “The limit values are the lower limits for [the] non-hazardous-waste category, whereas the highest limits are listed in brackets, as set by the Austrian landfill ordinance” [27].
According to the test results, all heavy metals in leachate are below the Austrian landfill ordinance’s limit value [41]. Moreover, by comparing these results with the literature values summarized in the work of Cherian, the leachate content is significantly lower with respect to each metal [42]. Nonetheless, the leaching capacity of heavy metals is pH-dependent, and the values may differ depending on the performed procedure test [43].
Less concern is needed from an environmental point of view regarding the mobility of heavy metals. In general, Samples A, B, and C are categorized as a non-hazardous waste/byproduct material. Samples A and B are used as a cement additive or as a soil stabilizer for construction. As regards landfilling, they can be disposed of in non-hazardous waste sites according to disposal regulations.
The pH value of Sample A is 10.2, which is less than those of Samples B and C, which are 12.5 and 12.6, respectively. The pH value of pulp and paper fly ash is in the range between 8 and 13, with an average value of 11 [34].
Less environmental concern of these fly ash samples makes their use and acceptance as CO2 and TCES materials easier.

3.6. Particle Size Distribution (PSD)

To investigate further the potential of fractionized fly ash samples for TCES use, a particle size distribution (PSD) analysis reveals important information. Therefore, PSD analysis was performed, and the results are shown in Figure 8.
Sample B shows a finer particle size (less than 1000 µm) compared with Samples A and C. However, this is in the particle size range of fly ash samples reported in the literature from 1 to 10,000 µm [42]. Sample A indicates a multimodal/trimodal distribution with modes at approximately 2, 10, and 100 µm. Sample B shows a unimodal distribution in the range of 0.02–2000 µm, with a mode at approximately 10 µm. Sample C indicates a wide unimodal distribution with a wide mode in the range of approximately 10–100 µm. It could be interesting to evaluate the chemical composition of fractionized fly ash samples to identify where CaO is accumulated. In this case, the CaO-rich fraction of fly ash with a smaller amount of inert materials can be evaluated and used as CO2 and TCES materials.

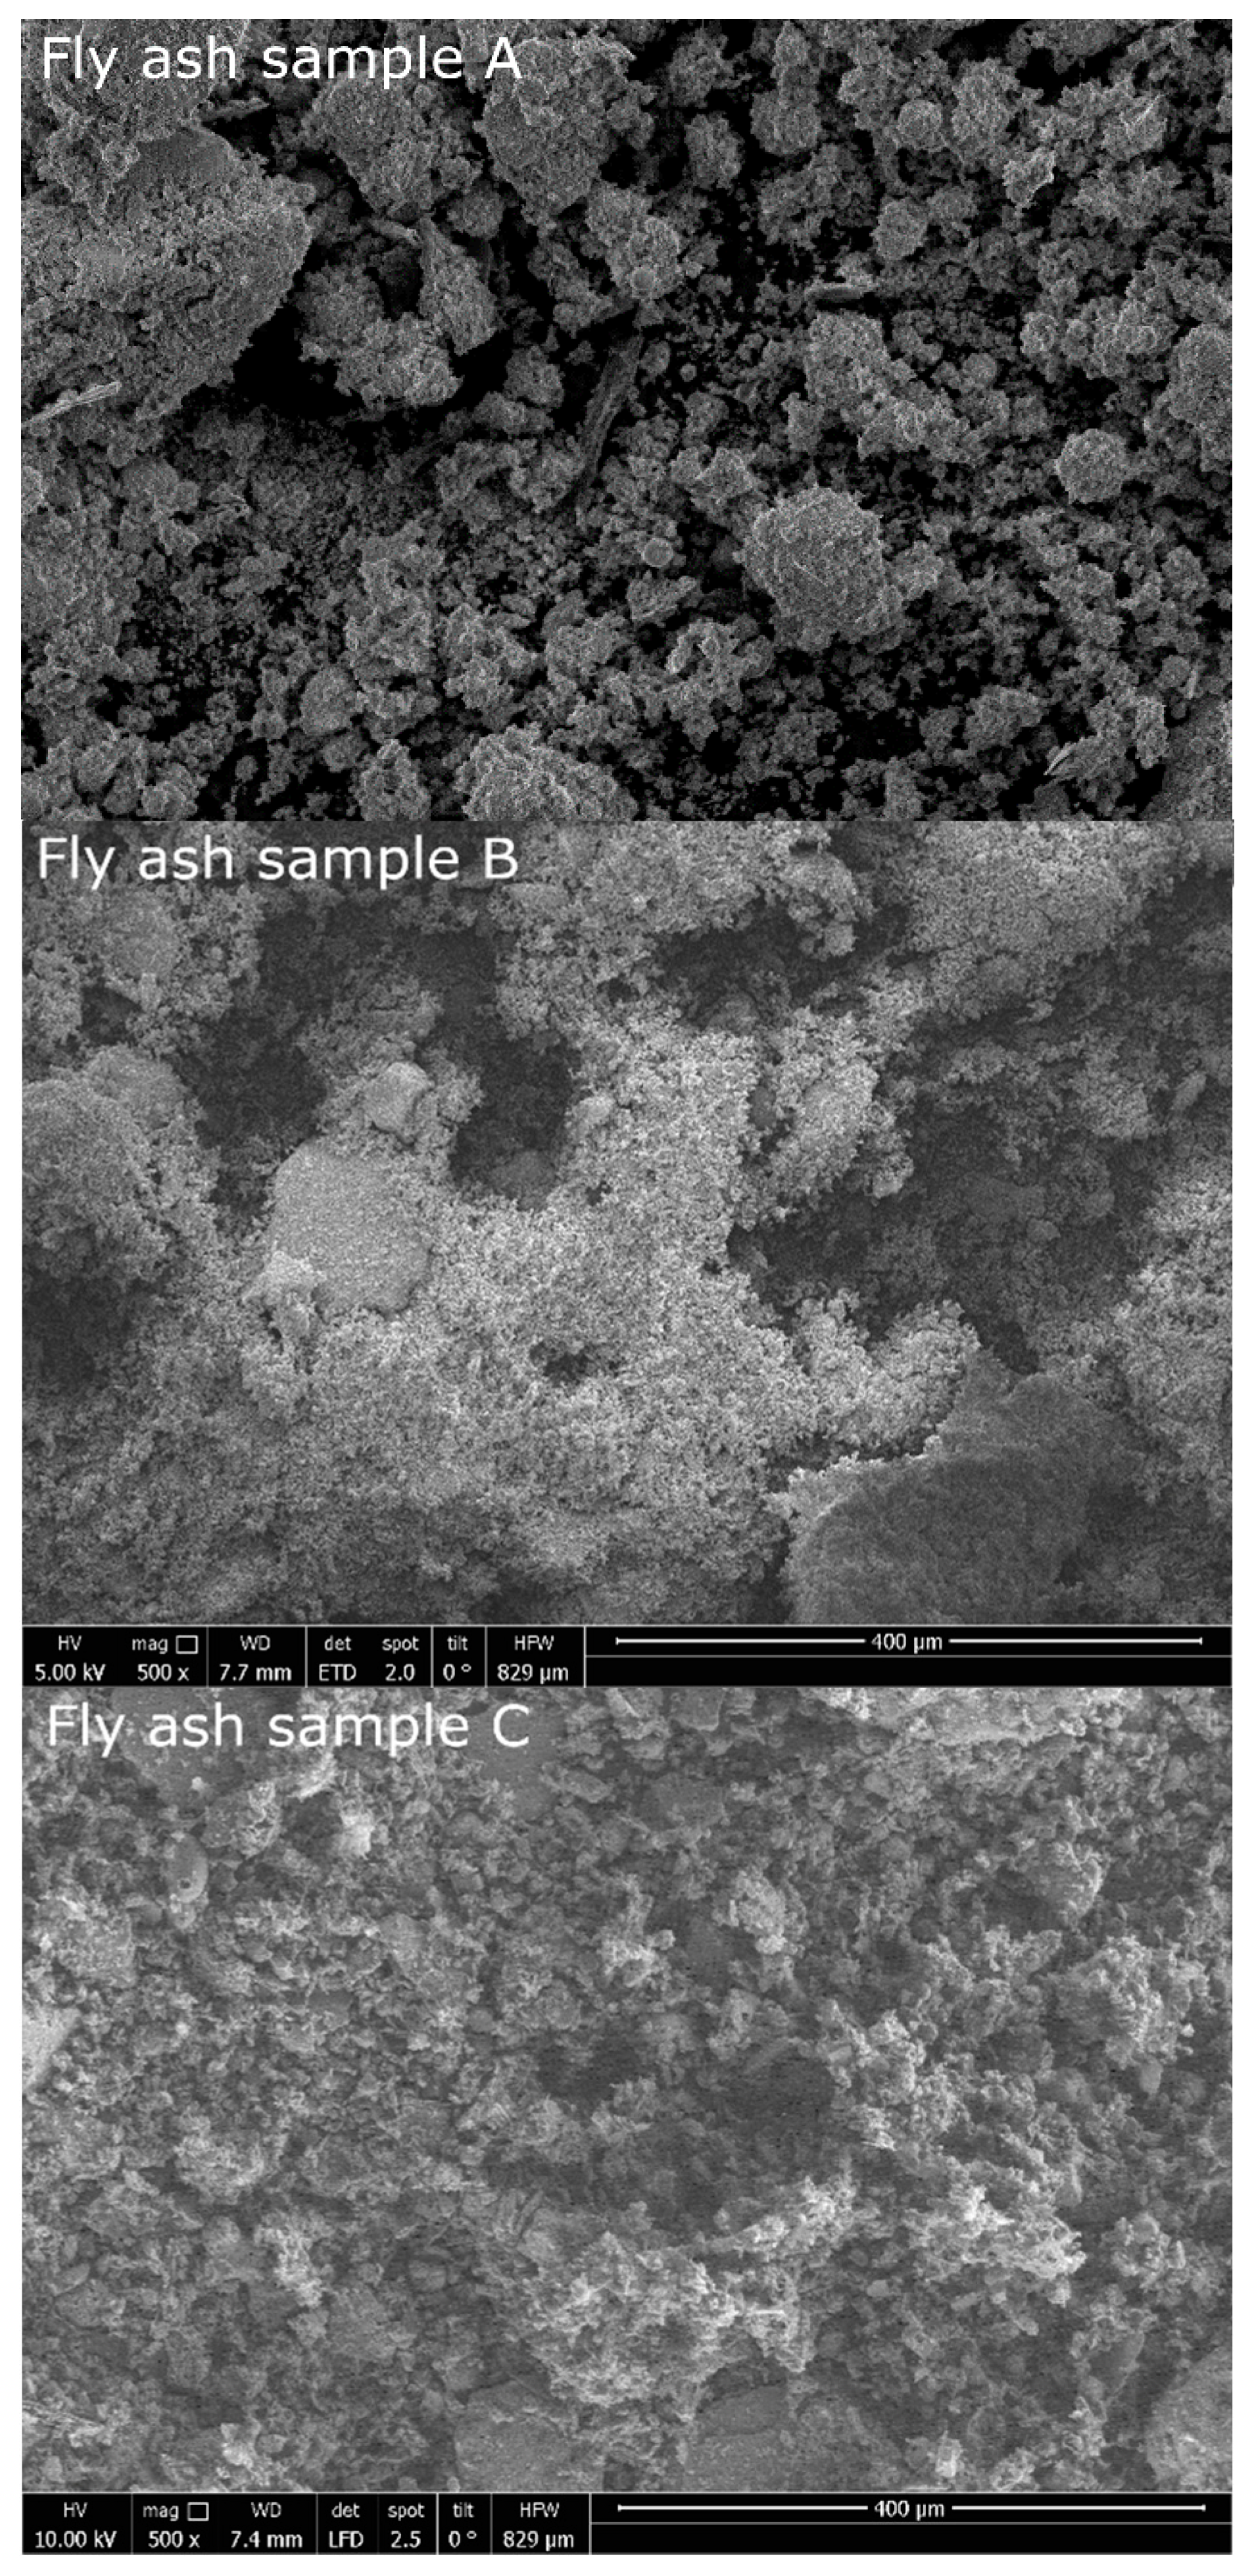
3.7. Scanning Electron Microscopy (SEM)

Figure 9 represents the SEM analysis of Fly Ash Samples A, B and C. All samples show different particle sizes and shapes. The adhering of small particles onto large particles is also viable.

4. Conclusions

This study aimed to exploit the potential use of byproduct and waste material from the pulp and paper industries, particularly the use of fly ash as CO2 and TCES materials. Based on the findings of this investigation, it can be concluded that fly ash meets the criteria for use as a TCES material in terms of charging and discharging. However, cycle stability of the three cycles has indicated a reduction of conversion under the selected experimental condition.
Samples A, B, and C with a CaO content of 62%, 60%, and 25% (XRF results) stored energy of 504 kJ/kg, 225 kJ/kg, and 75 kJ/kg (based on DSC signal), respectively, when subjected to a thermal treatment up to 880 °C in an N2 atmosphere in STA. The stored heat energy in the fly ash samples was released through the carbonation of fly ash (gas–solid reaction) in a CO2 atmosphere in the presence of H2O vapor. Samples A and B released heat of 852 and 1090 kJ/kg, respectively (based on mass signal), in the first cycle of carbonation with water vapor because of the already existing free lime in the samples, whereas Sample C released approximately the same amount of stored heat (158 kJ/kg).
The CO2 storage capacities of Samples, A, B, and C were 110 kg, 100 kg, and 18 kg per ton of fly ash, respectively, based on the obtained results from TG experiments.
Due to the results of the ICP-OES and leaching test, categorization of the examined fly ash samples as non-hazardous materials is possible because the limit values of the total heavy metals and the leachate of the heavy metals set in the Austrian landfill ordinance are not exceeded. This makes their utilization and acceptance as CO2 and TCES materials more feasible.
For the potential of the dual use of fly ash for sensible heat storage and as a TCES material, the potential of sensible heat storage with fly ash samples—because of the pozzolanic properties of fly ash due to the content of such materials as silicates and aluminosilicates—is another interesting issue to be investigated. However, it is a suitable system integration, a life cycle assessment, and the economic impacts that will provide the final answer to the question of whether valorization of byproduct/waste such as fly ash as a sustainable source of CO2 and TCES material from the pulp and paper industries is feasible.

Author Contributions

Conceptualization, S.S.J., C.J. and F.W.; methodology, S.S.J., M.A. and C.J.; software, S.S.J. and C.J.; validation, S.S.J., M.A., C.J., M.H. and F.W.; formal analysis, S.S.J., M.A. and C.J.; investigation, S.S.J., C.J. and F.W.; resources, S.S.J., C.J., M.H. and F.W.; data curation, S.S.J., C.J., M.H. and F.W.; writing—original draft preparation, S.S.J., M.A. and C.J.; writing—review and editing, S.S.J., M.A., C.J., M.H. and F.W.; visualization, S.S.J.; supervision, S.S.J., M.H. and F.W.; project administration, S.S.J., C.J. and F.W.; funding acquisition, S.S.J., C.J., M.H. and F.W. All authors have read and agreed to the published version of the manuscript.

Funding

Austrian Research Promotion Agency (FFG), Waste2Storage (#865100).

Institutional Review Board Statement

Not applicable.

Informed Consent Statement

Not applicable.

Data Availability Statement

Not applicable.

Acknowledgments

Open Access Funding by TU Wien, The authors thank the Austrian Research Promotion Agency (FFG) for its financial support of the projects Waste2Storage (No. #865100), SolidHeat Pressure (No. #853593), IEA-FBC (No. #876737) and the TU Wien Doctoral College CO2 Refinery. The X-ray center (XRC) and Universitäre Service-Einrichtung für Transmissions Elelektronenmikroskopie (USTEM) of TU Wien are acknowledged for providing access to powder X-ray diffractometers and scanning electron microscopy. Many thanks to the research group of mechanical engineering and clean air technology institute for providing the Mastersizer 2000 for measuring the particle size distribution of samples. The laboratory of institute for Water Quality and Resource Management of TU Wien is also acknowledged for performing the ICP-OES analysis and the leaching test of the samples. Last but not least, the authors acknowledge the TU Wien library for financial support through its Open Access Funding Program.

Conflicts of Interest

The authors declare no conflict of interest.

References

  1. Jahromy, S.S. From High-Value to Byproduct and Waste Materials for Thermochemical Energy and CO2 Storage. Ph.D. Thesis, TU Wien, Vienna, Austria, 2019. [Google Scholar]
  2. International Energy Agency (IEA). World Energy Outlook; International Energy Agency (IEA): Paris, France, 2017. [Google Scholar]
  3. Jahromy, S.S.; Birkelbach, F.; Jordan, C.; Huber, C.; Harasek, M.; Werner, A.; Winter, F. Impact of Partial Pressure, Conversion, and Temperature on the Oxidation Reaction Kinetics of Cu2O to CuO in Thermochemical Energy Storage. Energies 2019, 12, 508. [Google Scholar] [CrossRef] [Green Version]
  4. Aydin, D.; Casey, S.P.; Riffat, S. The latest advancements on thermochemical heat storage systems. Renew. Sustain. Energy Rev. 2015, 41, 356–367. [Google Scholar] [CrossRef]
  5. Abedin, A.H.R.; Marc, A. A Critical Review of Thermochemical Energy Storage Systems. Open Renew. Energy J. 2011, 4, 42–46. [Google Scholar] [CrossRef] [Green Version]
  6. Huber, C.; Jahromy, S.S.; Jordan, C.; Schreiner, M.; Harasek, M.; Werner, A.; Winter, F. Boric Acid: A High Potential Candidate for Thermochemical Energy Storage. Energies 2019, 12, 1086. [Google Scholar] [CrossRef] [Green Version]
  7. Ortiz, C.; Chacartegui, R.; Valverde, J.; Carro, A.; Tejada, C. Increasing the solar share in combined cycles through thermochemical energy storage. Energy Convers. Manag. 2021, 229, 113730. [Google Scholar] [CrossRef]
  8. Obermeier, J. Thermodynamische Analyse Thermochemischer Energiespeicher auf Basis Reversibler Gas-Feststoff-Reaktionen. Ph.D. Thesis, Friedrich-Alexander-Universität Erlangen-Nürnberg, Bayern, Germany, 2017. [Google Scholar]
  9. Deutsch, M.; Müller, D.; Aumeyr, C.; Jordan, C.; Gierl-Mayer, C.; Weinberger, P.; Winter, F.; Werner, A. Systematic search algorithm for potential thermochemical energy storage systems. Appl. Energy 2016, 183, 113–120. [Google Scholar] [CrossRef]
  10. André, L.; Abanades, S.; Flamant, G. Screening of thermochemical systems based on solid-gas reversible reactions for high temperature solar thermal energy storage. Renew. Sustain. Energy Rev. 2016, 64, 703–715. [Google Scholar] [CrossRef]
  11. Pardo, P.; Deydier, A.; Anxionnaz-Minvielle, Z.; Rougé, S.; Cabassud, M.; Cognet, P. A review on high temperature thermochemical heat energy storage. Renew. Sustain. Energy Rev. 2014, 32, 591–610. [Google Scholar] [CrossRef] [Green Version]
  12. Müller, D.; Knoll, C.; Gravogl, G.; Artner, W.; Welch, J.M.; Eitenberger, E.; Friedbacher, G.; Schreiner, M.; Harasek, M.; Hradil, K.; et al. Tuning the performance of MgO for thermochemical energy storage by dehydration—From fundamentals to phase impurities. Appl. Energy 2019, 253, 253. [Google Scholar] [CrossRef]
  13. Deutsch, M.; Horvath, F.; Knoll, C.; Lager, D.; Gierl-Mayer, C.; Weinberger, P.; Winter, F. High-Temperature Energy Storage: Kinetic Investigations of the CuO/Cu2O Reaction Cycle. Energy Fuels 2017, 31, 2324–2334. [Google Scholar] [CrossRef]
  14. Chen, X.; Jin, X.; Liu, Z.; Ling, X.; Wang, Y. Experimental investigation on the CaO/CaCO3 thermochemical energy storage with SiO2 doping. Energy 2018, 155, 128–138. [Google Scholar] [CrossRef]
  15. Müller, D.; Knoll, C.; Ruh, T.; Artner, W.; Welch, J.M.; Peterlik, H.; Eitenberger, E.; Friedbacher, G.; Harasek, M.; Blaha, P.; et al. Calcium Doping Facilitates Water Dissociation in Magnesium Oxide. Adv. Sustain. Syst. 2018, 2, 1700096. [Google Scholar] [CrossRef]
  16. Carrillo, A.J.; Moya, J.; Bayón, A.; Jana, P.; O’Shea, V.A.D.L.P.; Romero, M.; Gonzalez-Aguilar, J.; Serrano, D.P.; Pizarro, P.; Coronado, J.M. Thermochemical energy storage at high temperature via redox cycles of Mn and Co oxides: Pure oxides versus mixed ones. Sol. Energy Mater. Sol. Cells 2014, 123, 47–57. [Google Scholar] [CrossRef]
  17. Carrillo, A.J.; Serrano, D.P.; Pizarro, P.; Coronado, J.M. Improving the Thermochemical Energy Storage Performance of the Mn2O3/Mn3O4 Redox Couple by the Incorporation of Iron. ChemSusChem 2015, 8, 1947–1954. [Google Scholar] [CrossRef]
  18. Block, T.; Schmücker, M. Metal oxides for thermochemical energy storage: A comparison of several metal oxide systems. Sol. Energy 2016, 126, 195–207. [Google Scholar] [CrossRef]
  19. Jahromy, S.S.; Jordan, C.; Azam, M.; Werner, A.; Harasek, M.; Winter, F. Fly Ash from Municipal Solid Waste Incineration as a Potential Thermochemical Energy Storage Material. Energy Fuels 2019, 33, 5810–5819. [Google Scholar] [CrossRef]
  20. André, L.; Abanades, S. Recent Advances in Thermochemical Energy Storage via Solid–Gas Reversible Reactions at High Temperature. Energies 2020, 13, 5859. [Google Scholar] [CrossRef]
  21. Yanase, I.; Maeda, T.; Kobayashi, H. The effect of addition of a large amount of CeO2 on the CO2 adsorption properties of CaO powder. Chem. Eng. J. 2017, 327, 548–554. [Google Scholar] [CrossRef]
  22. Jing, J.-Y.; Li, T.-Y.; Zhang, X.-W.; Wang, S.-D.; Feng, J.; Turmel, W.A.; Li, W.-Y. Enhanced CO2 sorption performance of CaO/Ca3Al2O6 sorbents and its sintering-resistance mechanism. Appl. Energy 2017, 199, 225–233. [Google Scholar] [CrossRef]
  23. Khosa, A.A.; Yan, J.; Zhao, C. Investigating the effects of ZnO dopant on the thermodynamic and kinetic properties of CaCO3/CaO TCES system. Energy 2021, 215, 119132. [Google Scholar] [CrossRef]
  24. Wang, Y.; Zhu, Y.; Wu, S. A new nano CaO-based CO2 adsorbent prepared using an adsorption phase technique. Chem. Eng. J. 2013, 218, 39–45. [Google Scholar] [CrossRef]
  25. Chen, H.; Zhang, P.; Duan, Y.; Zhao, C. Reactivity enhancement of calcium based sorbents by doped metal oxides through the sol-gel process. Appl. Energy 2016, 162, 390–400. [Google Scholar] [CrossRef]
  26. Lu, S.; Wu, S. Calcination-carbonation durability of nano CaCO3 doped with Li2SO4. Chem. Eng. J. 2016, 294, 22–29. [Google Scholar] [CrossRef]
  27. Jahromy, S.S.; Azam, M.; Huber, F.; Jordan, C.; Wesenauer, F.; Huber, C.; Naghdi, S.; Schwendtner, K.; Neuwirth, E.; Laminger, T.; et al. Comparing Fly Ash Samples from Different Types of Incinerators for Their Potential as Storage Materials for Thermochemical Energy and CO2. Materials 2019, 12, 3358. [Google Scholar] [CrossRef] [Green Version]
  28. Del Valle-Zermeño, R.; Barreneche, C.; Cabeza, L.F.; Formosa, J.; Fernandez, A.I.; Chimenos, J.M. MSWI bottom ash for thermal energy storage: An innovative and sustainable approach for its reutilization. Renew. Energy 2016, 99, 431–436. [Google Scholar] [CrossRef] [Green Version]
  29. Gutierrez, A.; Miró, L.; Gil, A.; Rodríguez-Aseguinolaza, J.; Barreneche, C.; Calvet, N.; Py, X.; Fernández, A.I.; Grágeda, M.; Ushak, S.; et al. Advances in the valorization of waste and by-product materials as thermal energy storage (TES) materials. Renew. Sustain. Energy Rev. 2016, 59, 763–783. [Google Scholar] [CrossRef] [Green Version]
  30. Lin, W.Y.; Li, T.; Akasyah, L.; Lim, J.W.M.; Xu, H.; Py, X.; Rawat, R.S.; Romagnoli, A. Comparison of sintering condition and radio frequency plasma discharge on the conversion of coal/biomass fly ash into high-temperature thermal energy storage material. Energy Convers. Manag. 2019, 192, 180–187. [Google Scholar] [CrossRef]
  31. Sun, H.; Li, Y.; Bian, Z.; Yan, X.; Wang, Z.; Liu, W. Thermochemical energy storage performances of Ca-based natural and waste materials under high pressure during CaO/CaCO3 cycles. Energy Convers. Manag. 2019, 197. [Google Scholar] [CrossRef]
  32. Maaten, B.; Konist, A.; Siirde, A. Potential of solid residues from power plants as thermochemical energy storage materials. J. Therm. Anal. Calorim. 2020, 142, 1799–1805. [Google Scholar] [CrossRef]
  33. Azam, M.; Jahromy, S.S.; Raza, W.; Wesenauer, F.; Schwendtner, K.; Winter, F. Comparison of the Characteristics of Fly Ash Generated from Bio and Municipal Waste: Fluidized Bed Incinerators. Materials 2019, 12, 2664. [Google Scholar] [CrossRef] [Green Version]
  34. Scheepers, G.P.; du Toit, B. Potential use of wood ash in South African forestry: A review. South. For. J. For. Sci. 2016, 78, 255–266. [Google Scholar] [CrossRef]
  35. Haiying, Z.; Youcai, Z.; Jingyu, Q. Thermal characterization of fly ash from one municipal solid waste incinerator (MSWI) in Shanghai. Process. Saf. Environ. Prot. 2010, 88, 269–275. [Google Scholar] [CrossRef]
  36. Yang, Y.; Xiao, Y.; Wilson, N.; Voncken, J. Thermal behaviour of ESP ash from municipal solid waste incinerators. J. Hazard. Mater. 2009, 166, 567–575. [Google Scholar] [CrossRef]
  37. Viet, D.B.; Chan, W.-P.; Phua, Z.-H.; Ebrahimi, A.; Abbas, A.; Lisak, G. The use of flyashes from waste-to-energy processes as mineral CO2 sequesters and supplementary cementitious materials. J. Hazard. Mater. 2020, 398, 122906. [Google Scholar] [CrossRef] [PubMed]
  38. Dindi, A.; Quang, D.V.; Vega, L.F.; Nashef, E.; Abu-Zahra, M.R. Applications of fly ash for CO2 capture, utilization, and storage. J. CO2 Util. 2019, 29, 82–102. [Google Scholar] [CrossRef]
  39. Li, Z.-S.; Fang, F.; Tang, X.-Y.; Cai, N.-S. Effect of Temperature on the Carbonation Reaction of CaO with CO2. Energy Fuels 2012, 26, 2473–2482. [Google Scholar] [CrossRef]
  40. Khosa, A.A.; Zhao, C. Heat storage and release performance analysis of CaCO3/CaO thermal energy storage system after doping nano silica. Sol. Energy 2019, 188, 619–630. [Google Scholar] [CrossRef]
  41. Ordinance by the Federal Minister for the Environment on Waste Disposal Sites. Wien, Austria. 1996, Volume 164, p. 49. Available online: https://www.ecolex.org/details/legislation/landfill-ordinance-lex-faoc033823/ (accessed on 11 October 2019).
  42. Cherian, C.; Siddiqua, S. Pulp and Paper Mill Fly Ash: A Review. Sustainability 2019, 11, 4394. [Google Scholar] [CrossRef] [Green Version]
  43. Azam, M.; Jahromy, S.S.; Raza, W.; Raza, N.; Lee, S.S.; Kim, K.-H.; Winter, F. Status, characterization, and potential utilization of municipal solid waste as renewable energy source: Lahore case study in Pakistan. Environ. Int. 2020, 134, 105291. [Google Scholar] [CrossRef]
Figure 1. Comparison of thermochemical energy storage (TCES), latent heat storage, and sensible heat storage regarding development stage, material availability, simplicity, long-term storage, and energy density. Thermochemical (TC) energy storage can be classified as sorption or material conversion [8].
Energies 14 03348 g001
Figure 2. State of the art of the research for an optimal TCES material.
Energies 14 03348 g002
Figure 3. Extended method of research for finding an optimal TCES material.
Energies 14 03348 g003
Figure 4. Qualitative phase analysis of Samples (AC). The calculated phase percentage is also given.
Energies 14 03348 g004aEnergies 14 03348 g004b
Figure 5. Charging of fly ash samples up to 880 °C at a heating rate of 30 °C/min in an N2 atmosphere (100 mL/min), and discharging by changing the atmosphere into a CO2 (100 mL/min) and water vapor atmosphere (1 g/h) at 880 °C and cooling to 70 °C. The green line represents the mass signal, the blue line represents the DSC signal, and the dashed red line represents the temperature profile.
Energies 14 03348 g005
Figure 6. Cycling stability test of three cycles for Samples (AC). Charging of fly ash samples up to 880 °C using a heating rate of 30 °C/min in an N2 atmosphere (100 mL/min) and discharging occurred by changing the atmosphere into a CO2 (100 mL/min) and the water vapor atmosphere (1 g/h) at 880 °C and cooling the system to 350 °C, and maintaining this temperature for 30 min before starting the next cycle. The green line represents the mass signal, and the dashed redline represents the temperature profile.
Energies 14 03348 g006aEnergies 14 03348 g006b
Figure 7. Thermal behavior of fly ash samples in a pure CO2 atmosphere (100 mL/min) while heating the system up to 1150 °C at a heating rate of 30 °C/min, maintaining this temperature for 30 min, and cooling it down to 30 °C. The green line represents the mass signal, the blue line represents the DSC signal, and the dashed red line represents the temperature profile.
Energies 14 03348 g007aEnergies 14 03348 g007b
Figure 8. Particle size distributions of Samples, (AC), dQ3 (volume %), and Q (cumulative distribution %).
Energies 14 03348 g008aEnergies 14 03348 g008b
Figure 9. Scanning electron microscopy analysis of Samples (AC).
Energies 14 03348 g009
Table 1. General information about Plants A, B, and C, from which Fly Ash Samples A, B, and C were generated, respectively.
ParameterPlant APlant BPlant C
Fuel typeBark, sludge, biogas, natural gasBark, wood, wood residue, process sludgeBiomass, Biological sludge < 2%
Incinerator typeBFBCCFBCCFBC
Heat Capacity (MW)154891
Ash typeESP/Filter bagsFilter bagsESP
Temperature free zone (°C)800–900 °C800–900 °C810–900 °C
Amount of ash per year (t/y)25,00045,0005000
UtilizationCement industriesCement industriesCement industries
Table 2. XRF results of Samples A, B, and C given in mass percent (% w/w).
ElementsFly Ash Sample AFly Ash Sample BFly Ash Sample C
SnO0.010.02n.d.
ZrO20.040.050.06
SrO0.20.230.18
PbO0.010.030.02
As2O3n.d.0.01n.d.
ZnO0.030.160.31
CuO0.080.120.04
NiO0.010.020.04
Fe2O30.661.175.87
MnO0.10.051.39
Cr2O30.020.030.09
TiO20.280.770.87
CaO61.662.6925.3
K2O0.470.434.38
Cl0.180.360.2
SO31.111.63.14
P2O50.470.874.21
SiO218.1416.134.63
Al2O314.5112.1412.67
MgO1.872.115.29
Na2O0.611.051.32
Table 3. Total content of elements in Samples A, B, and C determined by ICP-OES, given in mg/kg.
ElementsLimit Value
(mg/kg)
Fly Ash Sample A
(mg/kg)
Fly Ash Sample B
(mg/kg)
Fly Ash Sample C
(mg/kg)
Sb 144.7769.83
As50008.56.419.11
Ba 706.13661.67
Pb 628.43464.12
Cd50004.763.1911.63
Cr 46.6939.99
Co 11.059.34
Cu 591.99567.32
Mo 5.464.58
Ni 24.6221.63
Hg200.640.442.1
Zn 3368.42562.8
Sn 111.2652.61
Al 45,39645,396.9
Fe 6520.965913.12
Table 4. Identified mass loss (ML), related temperature range (TR) for each mass loss (ML), and the reactions identified by DSC signals (Endo: endothermic; Exo: exothermic) regarding the decomposition of Samples A (FA A), B (FA B), and C (FA C) of the charging step in the N2 atmosphere.
TR °CML (%) FA ADSC
Endo/Exo
TR °CML
(%)
FA B
DSC
Endo/Exo
TR °C ML (%)
FA C
DSC
Endo/Exo
70–3560.3--70–3350.5--70–3130.1
356–5340.4Endo336–4451.3Endo313–4340.2
534–8807.6Endo445–7347.8Endo434–7162.9Endo
-- --734–8800.5--716–8800.2Endo
Total8.3 10.1 3.4
Table 5. Identified mass gain (MG), related temperature range (TR) for each mass gain, and the reactions identified by DSC signals (Endo: endothermic; Exo: exothermic) regarding the decomposition of Samples A (FA A), B (FA B), and C (FA C) of the discharging step in the CO2 and H2O atmosphere.
TR °CMG (%)
FA A
DSC
Endo/Exo
TR °CMG
(%)
FA B
DSC
Endo/Exo
TR °CMG (%)
FA C
DSC
Endo/Exo
873–7013.1Exo874–7014.2Exo874–702.7Exo
Table 6. Measured energy content for Samples A, B, and C of the charging step (based on the DSC signal) and the discharging step (based on the mass signal).
Fly Ash SampleCharging (kJ/kg)Discharging (kJ/kg)
A225938
B5041011
C75195
Table 7. Energy content of the charging and discharging steps of each cycle for Samples A, B, and C.
Energy Content in kJ/kg1. Cycle2. Cycle3. Cycle
Charging fly ash sample, A (heating to 880 °C, N2 atmosphere)335700570
Discharging fly ash sample, A (cooling from 880 °C to 350 °C, CO2 and H2O atmosphere)852664541
Charging fly ash sample B (heating to 880 °C, N2 atmosphere)5041061996
Discharging fly ash sample B (cooling from 880 °C to 350 °C, CO2 and H2O atmosphere) 10901025924
Charging fly ash sample C (heating to 880 °C, N2 atmosphere)162151115
Discharging fly ash sample C (cooling from 880 °C to 350 °C, CO2 and H2O atmosphere)15811586
Table 8. Leaching content (mg/kg) of heavy metals from Samples A, B, and C.
Element
Components
Limits Value
(mg/kg)
Fly Ash Sample A
(mg/kg)
Fly Ash Sample B
(mg/kg)
Fly Ash Sample C
(mg/kg)
Al 143174.1232.1
Sb0.7 (2.1)<0.02<0.020.11
As20.060.080.21
Ba100 (300)59.768.455.12
Pb10 (30)5.695.97<0.42
Cd1<0.01<0.01<0.01
Cr10 (20)0.090.320.88
Co50.09<0.09<0.09
Fe 0.060.700.69
Cu500.040.03<0.03
Mo <0.200.171.96
Ni100.10.130.03
Hg0.10.010.010.02
Ag10.43<0.03<0.03
Zn50 (100)0.021.340.33
Sn2012.620.050.02
pH 10.2112.5812.69
Publisher’s Note: MDPI stays neutral with regard to jurisdictional claims in published maps and institutional affiliations.

