
Carbon Capture, Utilisation and Storage as a Defense Tool against Climate Change: Current Developments in West Macedonia (Greece)


 ,
,  ,
,  ,
,
Abstract
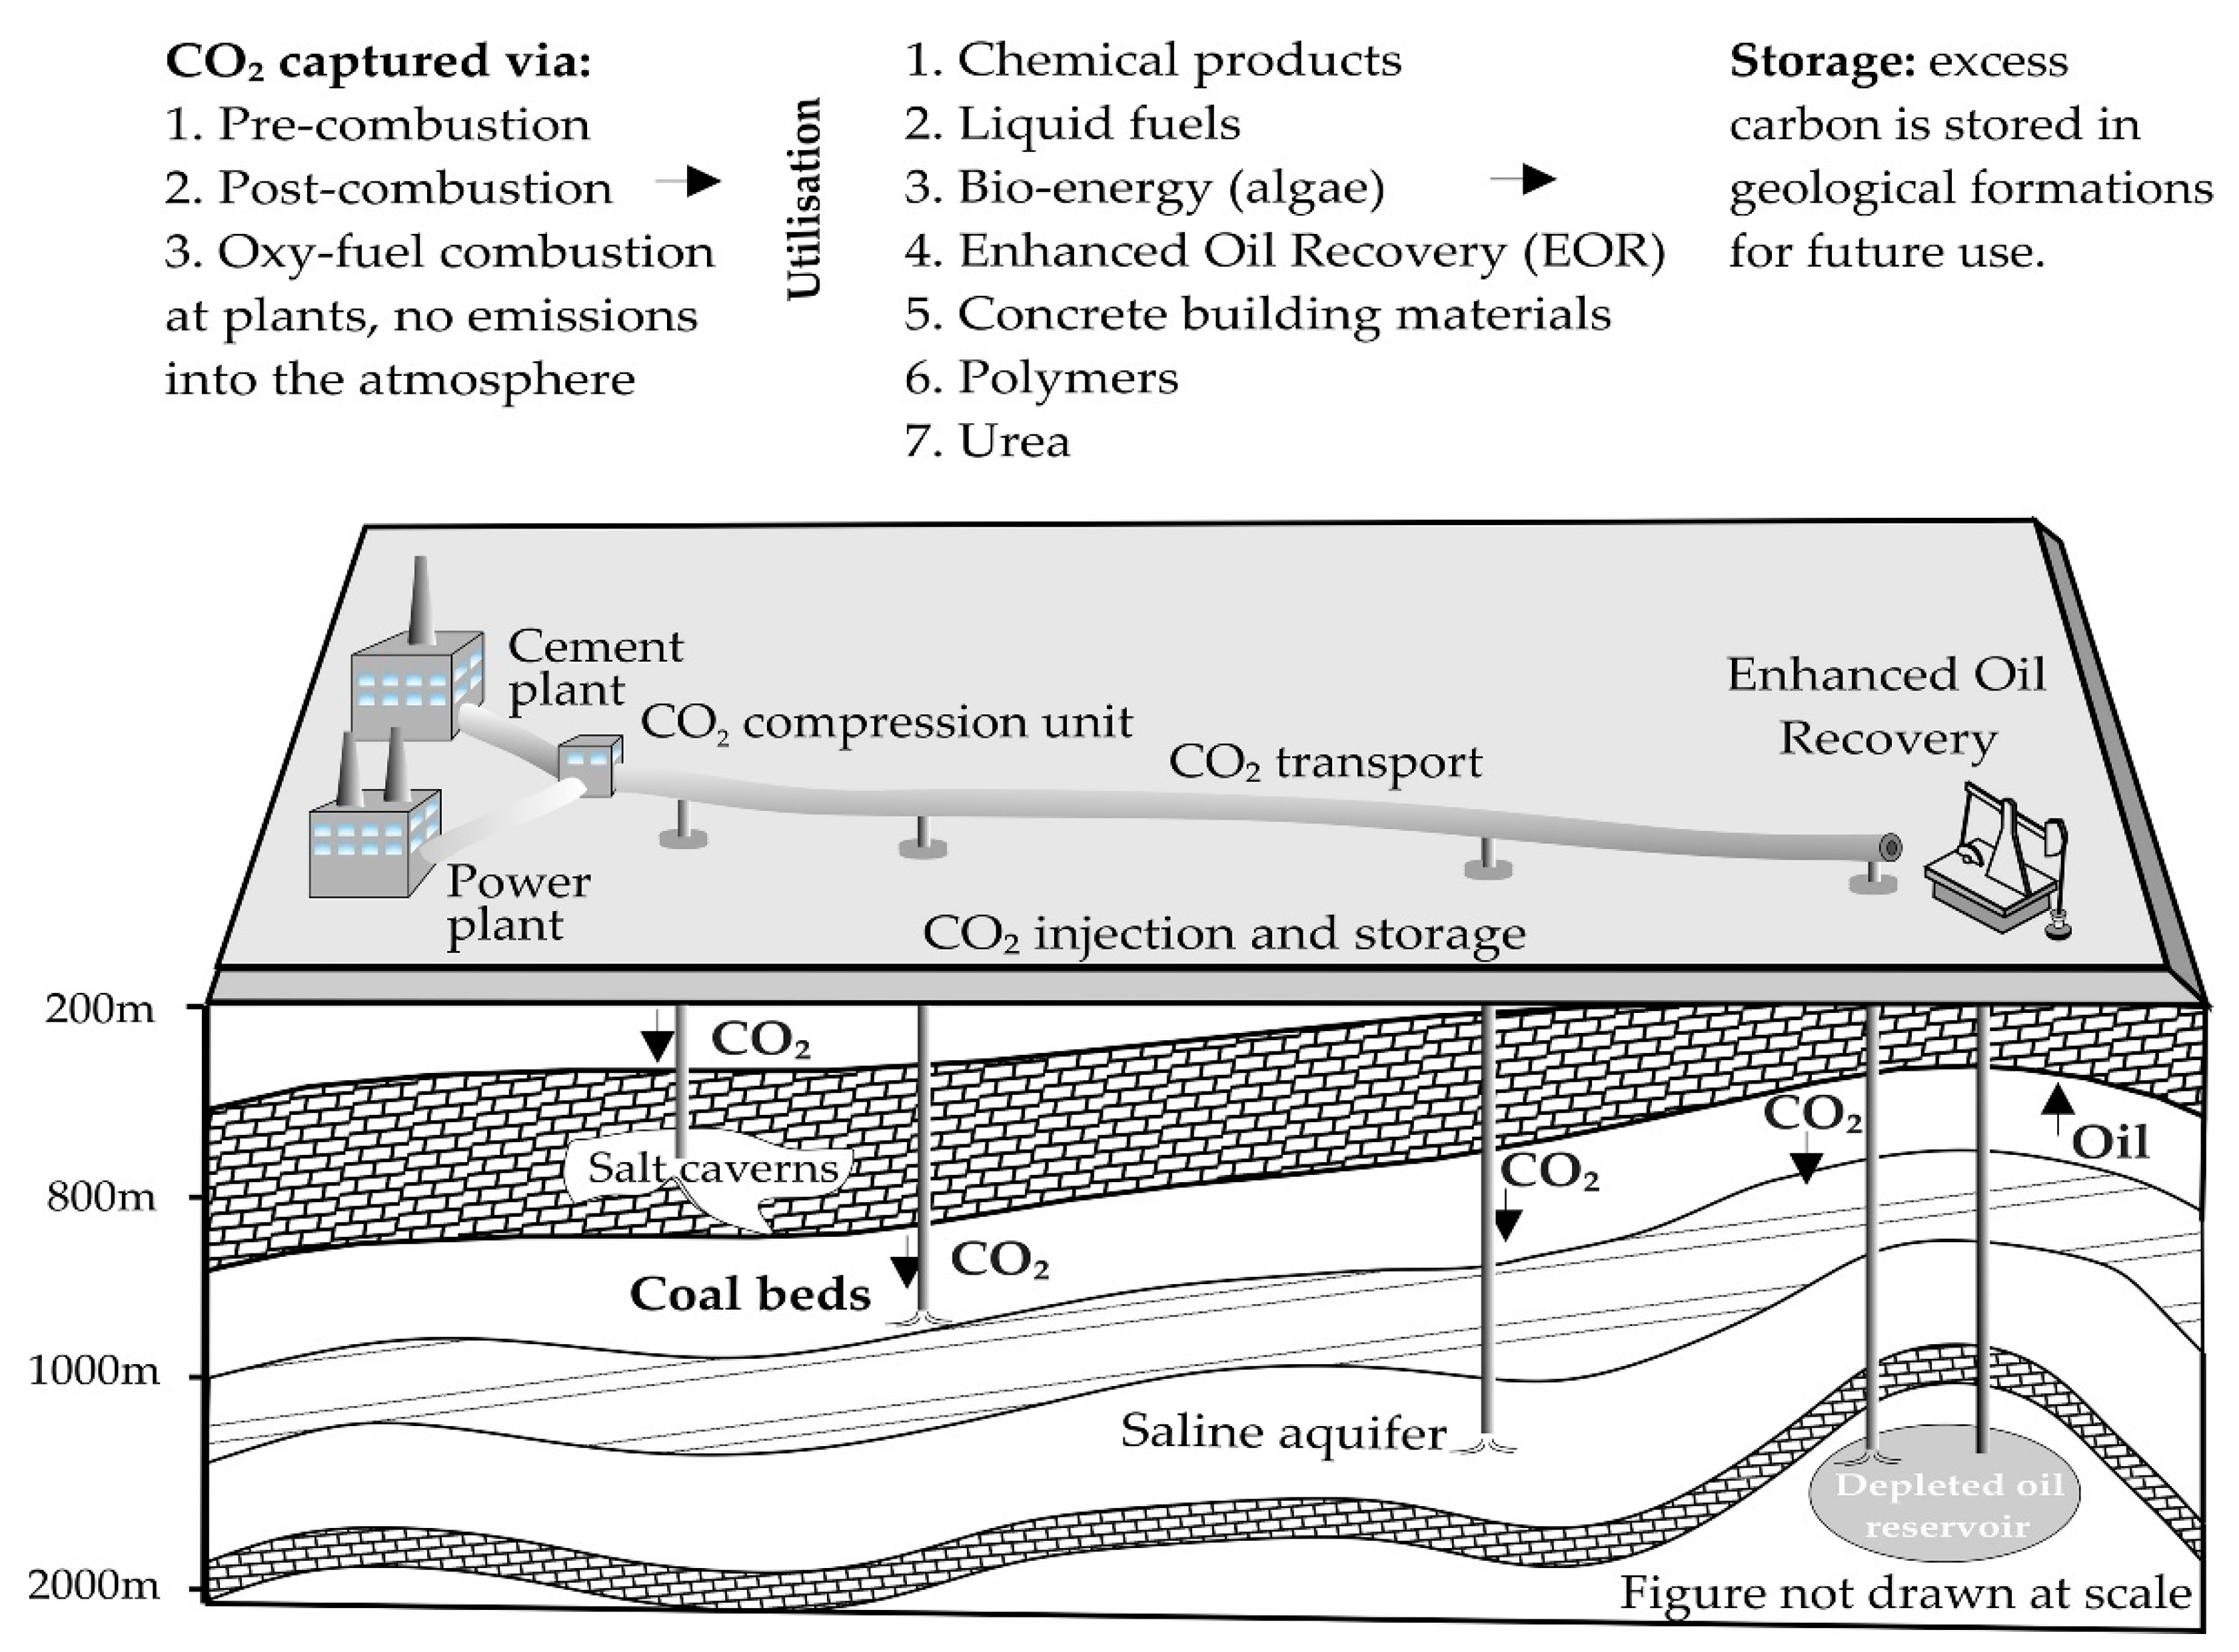
1. Introduction
2. Current State of the Art
2.1. Current Energy Reforms in Greece
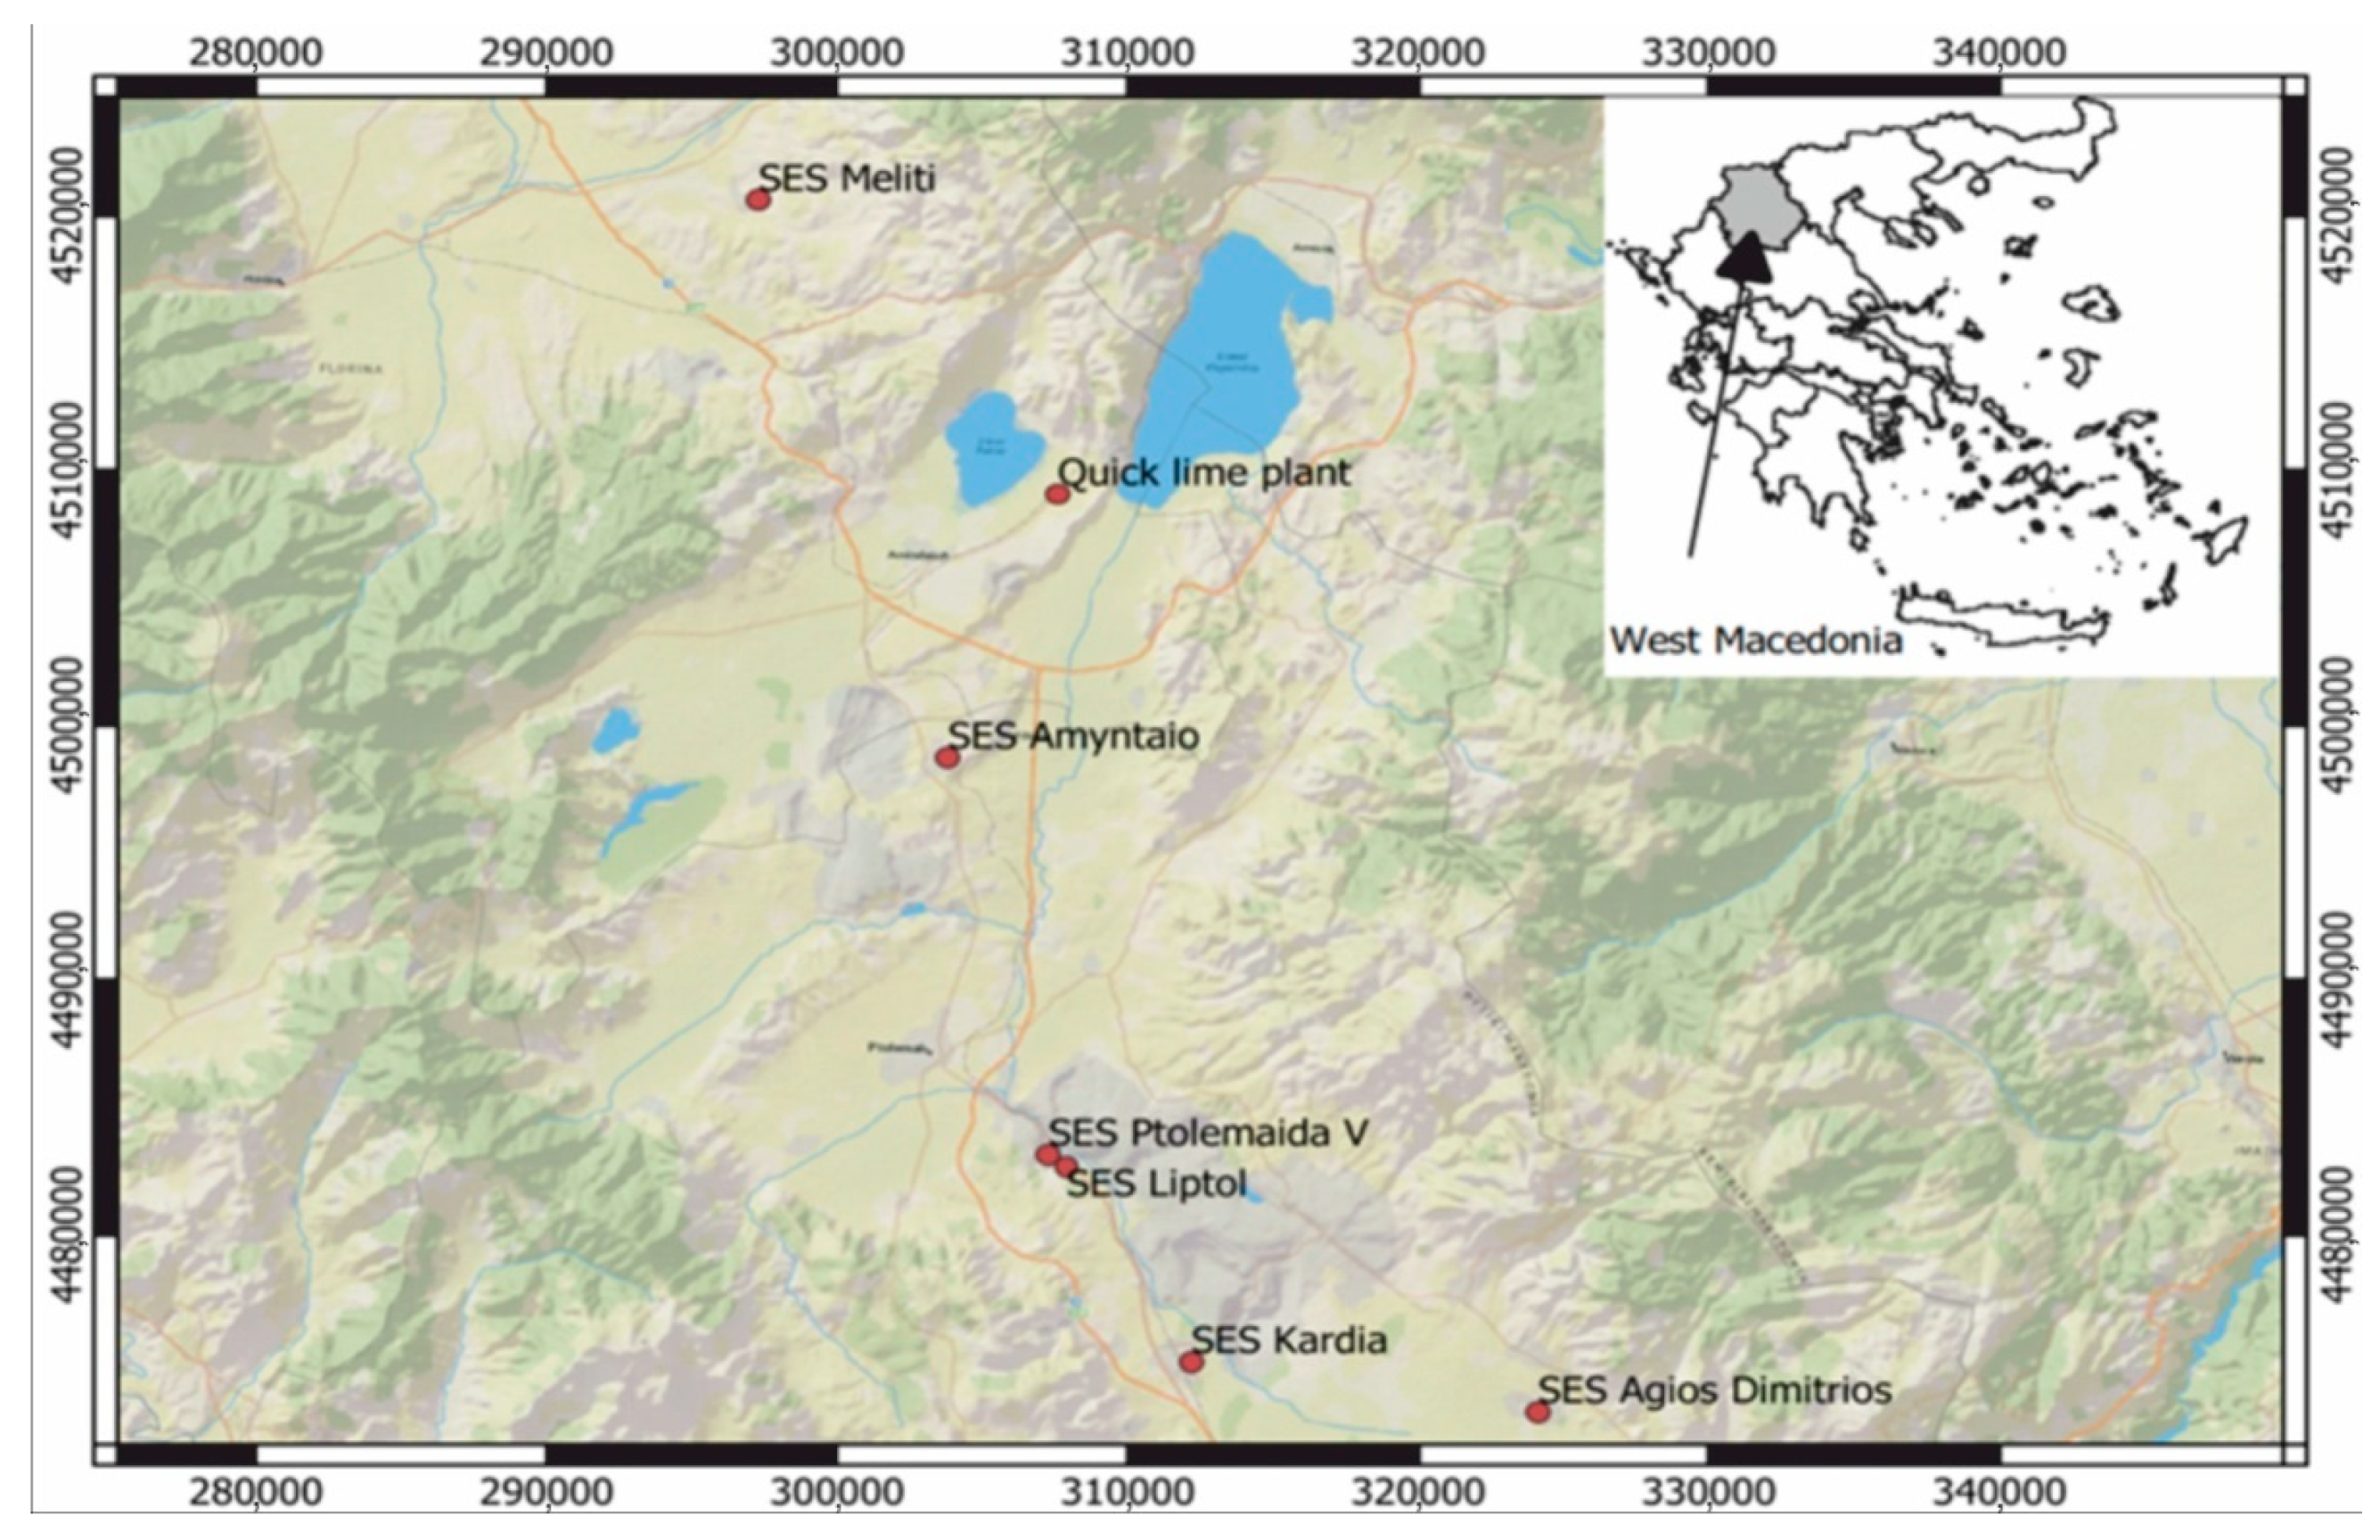
2.2. Industrial Cluster in Western Macedonia for Carbon Emission Capture
2.3. Potential for Carbon Utilisation in the Greek Industry
2.4. CCUS Corridors and Transport Routes
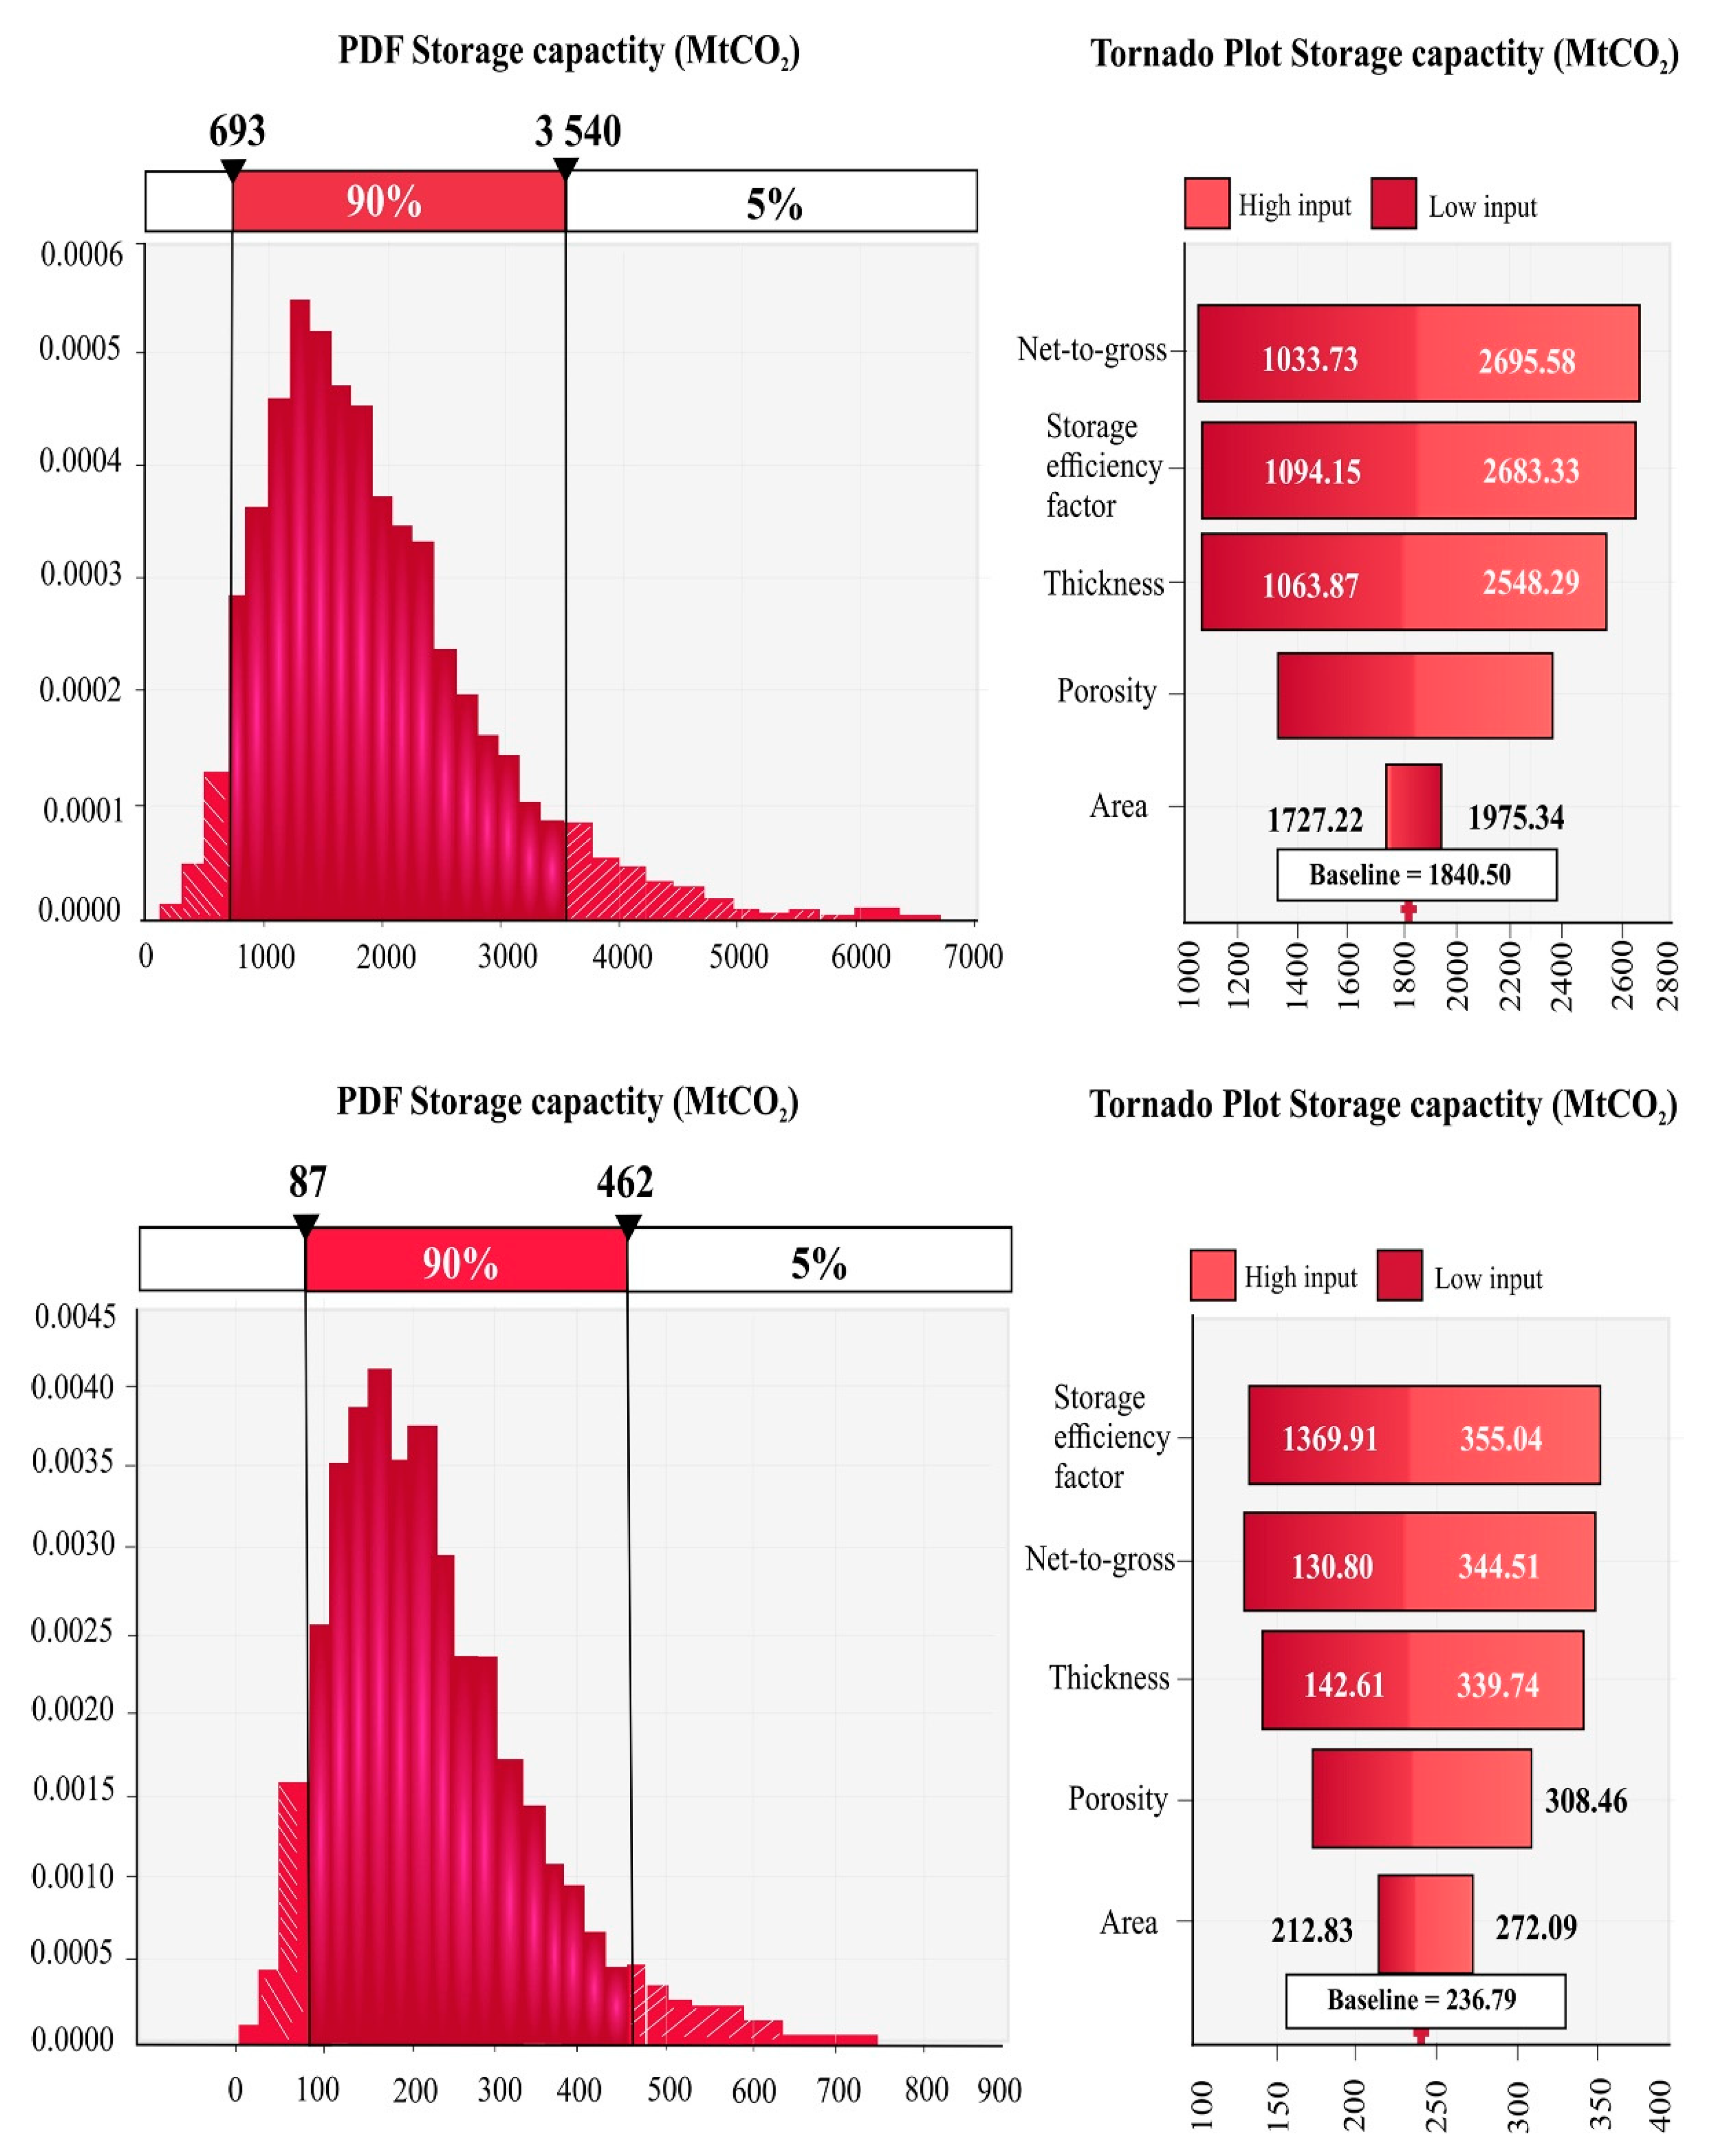
2.5. Estimation of Carbon Geological Storage in Mesohellenic Trough
- 1)
- Ondria Formation (Early-Middle Miocene epoch), partly eroded, consists of sandstones and marls with a maximum estimated thickness of about 350 m [63].
- 2)
- Tsotyli Formation (Lower-Middle Miocene epoch) with a thickness of about 1500 m to 2000 m [64,65]. The Tsotyli Formation consists of ophiolite-derived conglomerates and it has been characterised as an effective cap rock [66]. In the southern part of the basin, the Tsotyli Formation overlies the Pentalofos Formation unconformably.
- 3)
- 4)
- 5)
3. Research Development under Strategy CCUS
4. Summary and Conclusions
Author Contributions
Funding
Institutional Review Board Statement
Informed Consent Statement
Data Availability Statement
Acknowledgments
Conflicts of Interest
Appendix A


References
- Borowski, P. Nexus between water, energy, food and climate change as challenges facing the modern global, European and Polish economy. AIMS Geosci. 2020, 6, 397–421. [Google Scholar] [CrossRef]
- McKinsey & Company. Energy 2050: Insights from the Ground Up; McKinsey & Company. 2016. Available online: https://www.mckinsey.com/industries/oil-and-gas/our-insights/energy-2050-insights-from-the-ground-up (accessed on 3 June 2021).
- Friedmann, J.; Zapantis, A.; Page, B.; Consoli, C.; Fan, Z.; Havercroft, I.; Liu, H.; Ochu Richard, E.; Raji, N.; Rassool, D.; et al. Net-Zero and Geospheric Return: Actions Today for 2030 and Beyond; Center on Global Energy Policy, Columbia University School of International and Public Affairs, Global CCS Institute (Columbia University CGEP): New York, NY, USA, 2020. [Google Scholar]
- Ahmad, T.; Zhang, D. A critical review of comparative global historical energy consumption and future demand: The story told so far. Energy Rep. 2020, 6, 1973–1991. [Google Scholar] [CrossRef]
- IEA. World Energy Balances: Overview; IEA: Paris, France, 2020. [Google Scholar]
- Tapia, J.F.D.; Lee, J.-Y.; Ooi, R.E.H.; Foo, D.C.Y.; Tan, R.R. A review of optimization and decision-making models for the planning of CO2 capture, utilization and storage (CCUS) systems. Sustain. Prod. Consum. 2018, 13, 1–15. [Google Scholar] [CrossRef]
- IEA. World Energy Outlook 2016; IEA: Paris, France, 2016. [Google Scholar]
- European Environmental Agency. Trends and Projections in Europe 2020. Tracking Progress towards Europe’s Climate and Energy Targets; Publications Office of the European Unio: Luxemburg, 2020; p. 62. [Google Scholar]
- Williams, J.; Debenedictis, A.; Ghanadan, R.; Mahone, A.; Moore, J.; Morrow, I.I.I.W.; Price, S.; Torn, M. The Technology Path to Deep Greenhouse Gas Emissions Cuts by 2050: The Pivotal Role of Electricity. Science 2011, 335, 53–59. [Google Scholar] [CrossRef] [PubMed]
- Winter, F.; Avinash Agarwal, R.; Hrdlicka, J.; Varjani, S. CO2 Separation, Purification and Conversion to Chemicals and Fuels; Springer: Berlin/Heidelberg, Germany, 2019. [Google Scholar]
- IPCC. Climate Change 2013: The Physical Science Basis. Contribution of Working Group I to the Fifth Assessment Report of the Intergovernmental Panel on Climate Change; Cambridge University Press: New York, NY, USA, 2013; p. 1535. [Google Scholar]
- Seneviratne, S.; Nicholls, N.; Easterling, D.; Goodess, C.; Kanae, S.; Kossin, J.; Luo, Y.; Marengo, J.; McInnes, K.; Rahimi, M.; et al. Changes in Climate Extremes and Their Impacts on the Natural Physical Environment; Cambridge University Press: Cambridge, UK; New York, NY, USA, 2012. [Google Scholar]
- Programme, U.N.D. Human Development Report 2019; United Nations: New York, NY, USA, 2019; p. 366. [Google Scholar]
- Olesen, J.; Trnka, M.; Kersebaum, K.; Skjelvåg, A.; Seguin, B.; Peltonen-Sainio, P.; Rossi, F.; Jerzy, K.; Micale, F. Impacts and adaptation of European crop production systems to climate change. Eur. J. Agron. 2011, 34, 96–112. [Google Scholar] [CrossRef]
- Obama, B. The irreversible momentum of clean energy. Science 2017, 355, 126. [Google Scholar] [CrossRef]
- UNFCCC. Paris Agreement; United Nations Framework Convention on Climate Change: Paris, France, 2016. [Google Scholar]
- Cuéllar-Franca, R.M.; Azapagic, A. Carbon capture, storage and utilisation technologies: A critical analysis and comparison of their life cycle environmental impacts. J. CO2 Util. 2015, 9, 82–102. [Google Scholar] [CrossRef]
- Faruque Hasan, M.M.; First, E.L.; Boukouvala, F.; Floudas, C.A. A Novel Framework for Carbon Capture, Utilization, and Sequestration, CCUS. In Computer Aided Chemical Engineering; Eden, M.R., Siirola, J.D., Towler, G.P., Eds.; Elsevier: Amsterdam, The Netherlands, 2014; Volume 34, pp. 98–107. [Google Scholar]
- Bouzalakos, S.; Maroto-Valer, M.M. 1-Overview of carbon dioxide (CO2) capture and storage technology. In Developments and Innovation in Carbon Dioxide (CO2) Capture and Storage Technology; Maroto-Valer, M.M., Ed.; Woodhead Publishing: Cambridge, UK, 2010; Volume 2, pp. 1–24. [Google Scholar]
- European Commission. Carbon Capture, Utilisation and Storage. SETIS Magazine, 11 January 2016. [Google Scholar]
- Gibbins, J.; Chalmers, H. Carbon capture and storage. Energy Policy 2008, 36, 4317–4322. [Google Scholar] [CrossRef]
- Røkke, N.; Langørgen, Ø. Enabling pre-combustion plants—The DECARBit project. Energy Procedia 2009, 1, 1435–1442. [Google Scholar] [CrossRef]
- Wall, T.; Stanger, R.; Santos, S. Demonstrations of coal-fired oxy-fuel technology for carbon capture and storage and issues with commercial deployment. Int. J. Greenh. Gas. Control. 2011, 5, S5–S15. [Google Scholar] [CrossRef]
- Shahrestani, M.M.; Rahimi, A. Evolution, Fields of Research, and Future of Chemical-Looping Combustion (CLC) process: A Review. Environ. Eng. Res. 2014, 19, 299–308. [Google Scholar] [CrossRef]
- IEA. Putting CO2 to Use; IEA: Paris, France, 2019. [Google Scholar]
- Davison, J.; Freund, P.; Smith, A. Putting Carbon Back Into the Ground; Climate Technology Centre and Network: Copenhagen, Denmark, 2001. [Google Scholar]
- Celia, M.A.; Bachu, S.; Nordbotten, J.M.; Bandilla, K.W. Status of CO2 storage in deep saline aquifers with emphasis on modeling approaches and practical simulations. Water Resour. Res. 2015, 51, 6846–6892. [Google Scholar] [CrossRef]
- Xie, L.Z.; Zhou, H.; Xie, H. Research advance of CO2 storage in rock salt caverns. Yantu Lixue/Rock Soil Mech. 2009, 30, 3324–3330. [Google Scholar]
- Baran, P.; Zarębska, K.; Krzystolik, P.; Hadro, J.; Nunn, A. CO2-ECBM and CO2 Sequestration in Polish Coal Seam—Experimental Study. J. Sustain. Min. 2014, 13, 22–29. [Google Scholar] [CrossRef]
- Jalili, P.; Saydam, S.; Cinar, Y. CO2 Storage in Abandoned Coal Mines. In Proceedings of the 11th Underground Coal Operators’ Conference, University of Wollongong & the Australasian, Institute of Mining and Metallurgy, Wollogong, Australia, 10–11 February 2011; pp. 355–360. [Google Scholar]
- Raza, A.; Gholami, R.; Rezaee, R.; Bing, C.H.; Nagarajan, R.; Hamid, M.A. Well selection in depleted oil and gas fields for a safe CO2 storage practice: A case study from Malaysia. Petroleum 2017, 3, 167–177. [Google Scholar] [CrossRef]
- Györe, D.; Stuart, F.M.; Gilfillan, S.M.V.; Waldron, S. Tracing injected CO2 in the Cranfield enhanced oil recovery field (MS, USA) using He, Ne and Ar isotopes. Int. J. Greenh. Gas. Control. 2015, 42, 554–561. [Google Scholar] [CrossRef]
- Boschi, C.; Dini, A.; Dallai, L.; Ruggieri, G.; Gianelli, G. Enhanced CO2-mineral sequestration by cyclic hydraulic fracturing and Si-rich fluid infiltration into serpentinites at Malentrata (Tuscany, Italy). Chem. Geol. 2009, 265, 209–226. [Google Scholar] [CrossRef]
- Dichicco, M.C.; Laurita, S.; Paternoster, M.; Rizzo, G.; Sinisi, R.; Mongelli, G. Serpentinite Carbonation for CO2 Sequestration in the Southern Apennines: Preliminary Study. Energy Procedia 2015, 76, 477–486. [Google Scholar] [CrossRef]
- García-Rios, M.; Luquot, L.; Soler, J.M.; Cama, J. Laboratory-Scale Interaction between CO2-Rich Brine and Reservoir Rocks (Limestone and Sandstone). Procedia Earth Planet. Sci. 2013, 7, 109–112. [Google Scholar] [CrossRef]
- Koukouzas, N.; Koutsovitis, P.; Tyrologou, P.; Karkalis, C.; Arvanitis, A. Potential for Mineral Carbonation of CO2 in Pleistocene Basaltic Rocks in Volos Region (Central Greece). Minerals 2019, 9, 627. [Google Scholar] [CrossRef]
- Koukouzas, N.; Kypritidou, Z.; Purser, G.; Rochelle, C.A.; Vasilatos, C.; Tsoukalas, N. Assessment of the impact of CO2 storage in sandstone formations by experimental studies and geochemical modeling: The case of the Mesohellenic Trough, NW Greece. Int. J. Greenh. Gas. Control. 2018, 71, 116–132. [Google Scholar] [CrossRef]
- Ragnheidardottir, E.; Sigurdardottir, H.; Kristjansdottir, H.; Harvey, W. Opportunities and challenges for CarbFix: An evaluation of capacities and costs for the pilot scale mineralization sequestration project at Hellisheidi, Iceland and beyond. Int. J. Greenh. Gas. Control. 2011, 5, 1065–1072. [Google Scholar] [CrossRef]
- Snæbjörnsdóttir, S.Ó.; Wiese, F.; Fridriksson, T.; Ármansson, H.; Einarsson, G.M.; Gislason, S.R. CO2 storage potential of basaltic rocks in Iceland and the oceanic ridges. Energy Procedia 2014, 63, 4585–4600. [Google Scholar] [CrossRef]
- Global CCS Institute. The Global Status of CCS; 2016 Summary Report; Global CCS Institute: Docklands, Australia, 2016. [Google Scholar]
- IPCC. Climate Change 2014: Synthesis Report. Contribution of Working Groups I, II and III to the Fifth Assessment Report of the Intergovernmental Panel on Climate Change; IPCC: Geneva, Switzerland, 2014; p. 151. [Google Scholar]
- Markewitz, P.; Kuckshinrichs, W.; Leitner, W.; Linssen, J.; Zapp, P.; Bongartz, R.; Schreiber, A.; Müller, T. Worldwide innovations in the development of carbon capture technologies and the utilization of CO2. Energy Environ. Sci. 2012, 5, 7281–7305. [Google Scholar] [CrossRef]
- Ember. Daily EU ETS Carbon Market Price (Euros). Available online: https://ember-climate.org/data/carbon-price-viewer/ (accessed on 24 May 2021).
- Wheatley, J.E.; Bala, S.; Barnes, D.C.; Schoolderman, C.; Jakab, G.; Raynel, G.; Rayner, C.M. CO2 Capture using phenoxide salts; alternatives to amine-based capture agents, and comparative speciation studies as components in solvent blends. Int. J. Greenh. Gas. Control. 2019, 88, 353–360. [Google Scholar] [CrossRef]
- World Coal Association. Driving CCUS Deployment. The Pathway to Zero Emissions from Coal; World Coal Association: London, UK, 2018; pp. 149–151. [Google Scholar]
- IOGP. The Potential for CCS and CCU in Europe. Report to the Thirty Second Meeting of the European Gas. Regulatory Forum 5–6 June 2019; International Association of Oil&Gas Producers: Madrid, Spain, 2019. [Google Scholar]
- IPCC. Summary for Policymakers. In Global Warming of 1.5 °C. An IPCC Special Report on the Impacts of Global Warming of 1.5 °C above Pre-Industrial Levels and Related Global Greenhouse Gas Emission Pathways, in the Context of Strengthening the Global Response to the Threat of Climate Change, Sustainable Development, and Efforts to Eradicate Poverty; Masson-Delmotte, V., Zhai, P., Pörtner, H.-O., Roberts, D., Skea, J., Shukla, P.R., Pirani, A., Moufouma-Okia, W., Péan, C., Pidcock, R., et al., Eds.; World Meteorological Organization: Geneva, Switzerland, 2018; 32p. [Google Scholar]
- Russell, S. A Recommended Methodology for Estimating and Reporting the Potential Greenhouse Gas. Emissions from Fossil Fuel Reserves; World Resources Institute: Washington, DC, USA, 2016. [Google Scholar]
- Hellenic Association for Energy Economics. Greek Energy Market Report 2019; Hellenic Association for Energy Economics: Athens, Greece, 2019. [Google Scholar]
- Hellenic Republic; Ministry of the Environment and Energy. National Energy and Climate Plan; Ministry of the Environment and Energy: Athens, Greece, 2019.
- Arvanitis, A.; Koukouzas, N.; Koutsovitis, P.; Karapanos, D.; Manoukian, E. Combined CO2 Geological Storage and Geothermal Energy Utilization in Greece; Bulletin of the Geological Society of Greece: Athens, Greece, 2019; pp. 539–540. [Google Scholar]
- Arvanitis, A.; Koutsovitis, P.; Koukouzas, N.; Tyrologou, P.; Karapanos, D.; Karkalis, C.; Pomonis, P. Potential Sites for Underground Energy and CO2 Storage in Greece: A Geological and Petrological Approach. Energies 2020, 13, 2707. [Google Scholar] [CrossRef]
- Borowski, P. Digitization, Digital Twins, Blockchain, and Industry 4.0 as Elements of Management Process in Enterprises in the Energy Sector. Energies 2021, 14, 1885. [Google Scholar] [CrossRef]
- European Union. Clean Energy for All Europeans; Publications Office of the European Union: Luxembourg, 2019. [Google Scholar]
- Noussan, M.; Raimondi, P.P.; Scita, R.; Hafner, M. The Role of Green and Blue Hydrogen in the Energy Transition—A Technological and Geopolitical Perspective. Sustainability 2021, 13, 298. [Google Scholar] [CrossRef]
- BloombergNEF. Hydrogen Economy Outlook. Available online: https://data.bloomberglp.com/professional/sites/24/BNEF-Hydrogen-Economy-Outlook-Key-Messages-30-Mar-2020.pdf (accessed on 30 March 2021).
- Tugwell, P. Energean Plans $500 Million Carbon Storage and H2 Facility. Available online: https://www.bloomberg.com/news/articles/2021-02-25/energean-plans-500-million-greek-carbon-storage-and-h2-facility (accessed on 25 February 2021).
- Papadopoulou, D.; Tourkolias, C.N.; Mirasgedis, S. Assessing the macroeconomic effect of gas pipeline projects: The case of Trans-Adriatic Pipeline on Greece. SPOUDAI-J. Econ. Bus. 2015, 65, 100–118. [Google Scholar]
- Koukouzas, N.; Kypritidou, Z.; Purser, G.; Rochelle, C.A.; Vasilatos, C. Geochemical Modeling for the Assessment of the CO2 Storage Potential in the Mesohellenic Trough, NW Greece. Bull. Geol. Soc. Greece 2016, 50, 11. [Google Scholar] [CrossRef]
- Liu, C.-T.; Hsieh, B.-Z.; Chen, I.H.; Lin, Z.-S.; Chen, T.-L. Estimation of CO2 Practical Capacity in Saline Formations. Energy Procedia 2014, 63, 5211–5221. [Google Scholar] [CrossRef]
- Tischer, M.; Lamb, J.; Hesse, S.; van Tongeren, M. Evaluation of Tier One Exposure Assessment Models (ETEAM): Project Overview and Methods. Ann. Work Expo. Health 2017, 61, 911–920. [Google Scholar] [CrossRef]
- Schinkel, J.; Fransman, W.; Heussen, H.; Kromhout, H.; Marquart, H.; Tielemans, E. Cross-validation and refinement of the Stoffenmanager as a first tier exposure assessment tool for REACH. Occup. Environ. Med. 2009, 67, 125–132. [Google Scholar] [CrossRef]
- Ferriere, J.; Reynaud, J.Y.; Pavlopoulos, A.; Bonneau, M.; Migiros, G.; Chanier, F.; Proust, J.-N.; Gardin, S. Geologic evolution and Geodyanmic controls on the Tertiary Intramontane Piggyback Meso-Hellenic Basin, Greece. Bull. Soc. Géol. Fr. 2004, 175, 361–381. [Google Scholar] [CrossRef]
- Doutsos, T.; Koukouvelas, J.; Zelilidis, A.; Kontopoulos, N. Intracontinental wedging and post-orogenic collapse in Mesohellenic Trough. Geol. Rundsch. 1994, 83, 257–275. [Google Scholar] [CrossRef]
- Zelilidis, A.; Piper, D.; Kontopoulos, N. Sedimentation and Basin Evolution of the Oligocene-Miocene Mesohellenic Basin, Greece. AAPG Bull. 2002, 86, 161–182. [Google Scholar] [CrossRef]
- Tasianas, A.; Koukouzas, N. CO2 Storage Capacity Estimate in the Lithology of the Mesohellenic Trough, Greece. Energy Procedia 2016, 86, 334–341. [Google Scholar] [CrossRef]
- Vamvaka, A.; Kilias, A.; Mountrakis, D.; Papaoikonomou, J. Geometry and structural evolution of the Mesohellenic Trough (Greece): A new approach. Geol. Soc. Lond. Spec. Publ. 2006, 260, 521–538. [Google Scholar] [CrossRef]
- Pavlides, S.; Zouros, N.; Chatzipetros, A.; Kostopoulos, D.; Mountrakis, D. The 13 May 1995 western Macedonia, Greece (Kozani Grevena) earthquake; preliminary results. Terra Nova 2007, 7, 544–549. [Google Scholar] [CrossRef]
- Styring, P.; Jansen, D. Carbon Capture and Utilisation in the Green Economy. Using CO2 to Manufacture Fuel, Chemicals and Materials; Centre for Low Carbon: Futures, UK, 2011; p. 68. [Google Scholar]
- Goodman, A.; Hakala, A.; Bromhal, G.; Deel, D.; Rodosta, T.; Frailey, S.; Small, M.; Allen, D.; Romanov, V.; Fazio, J.; et al. U.S. DOE methodology for the development of geologic storage potential for carbon dioxide at the national and regional scale. Int. J. Greenh. Gas. Control. 2011, 5, 952–965. [Google Scholar] [CrossRef]
- Cavanagh, A.J.; Wilkinson, M.; Haszeldine, R.S. DELIVERABLE D2.1 REPORT Methodologies for Cluster Development and Best Practices for Data Collection in the Promising Regions. In Bridging the Gap, Storage Resource Assessment Methodologies, EU H2020 STRATEGY CCUS Project 837754, Report, Scottish Carbon Capture & Storage; University of Edinburgh: Edinburgh, Scotland, 2020; p. 67. [Google Scholar]
- Jongsma, D. Heat Flow in the Aegean Sea. Geophys. J. R. Astron. Soc. 1974, 37, 337–346. [Google Scholar] [CrossRef]
- Koukouzas, N.; Krassakis, P.; Koutsovitis, P.; Karkalis, C. An integrated approach to the coal deposits in the Mesohellenic Trough, Greece. Bull. Geol. Soc. Greece 2019, 54, 34–59. [Google Scholar] [CrossRef]
- Zelilidis, A.; Kontopoulos, N.; Avramidis, P.; Bouzos, D. Late Eocene to early Miocene depositional environments of the Mesohellenic basin, North-Central Greece: Implications for hydrocarbon potential. Geol. Balcanina 1997, 27, 45–55. [Google Scholar]
- Ehrenberg, S.; Nadeau, P.H. Sandstone vs. carbonate petroleum reservoirs: A global perspective on porosity-depth and porosity-permeability relationships. AAPG Bull. 2005, 89, 435–445. [Google Scholar] [CrossRef]
- Ajdukiewicz, J.; Lander, R. Sandstone reservoir quality prediction: The state of the art. AAPG Bull. 2010, 94, 1083–1091. [Google Scholar] [CrossRef]
- Wischnewski, B.; Peace Software. Calculation of Thermodynamic State Variables of Carbon Dioxide. Peace Software Limited. 2007. Available online: https://www.peacesoftware.de/einigewerte/co2_e.html (accessed on 3 June 2021).
- Goodman, A.; Sanguinito, S.; Levine, J.S. Prospective CO2 saline resource estimation methodology: Refinement of existing US-DOE-NETL methods based on data availability. Int. J. Greenh. Gas. Control. 2016, 54, 242–249. [Google Scholar] [CrossRef]
- Bachu, S.; Bonijoly, D.; Bradshaw, J.; Burruss, R.; Holloway, S.; Christensen, N.P.; Mathiassen, O.M. CO2 storage capacity estimation: Methodology and gaps. Int. J. Greenh. Gas. Control. 2007, 1, 430–443. [Google Scholar] [CrossRef]
- Bachu, S. Review of CO2 storage efficiency in deep saline aquifers. Int. J. Greenh. Gas. Control. 2015, 40, 188–202. [Google Scholar] [CrossRef]
- IEA. Energy Technology Perspectives 2017; IEA: Paris, France, 2017. [Google Scholar]
- Riis, F.; Halland, E. CO2 Storage Atlas of the Norwegian Continental Shelf: Methods Used to Evaluate Capacity and Maturity of the CO2 Storage Potential. Energy Procedia 2014, 63, 5258–5265. [Google Scholar] [CrossRef]


| 2020 | 2021 | 2022 | 2023 | 2024 | 2025 | 2030 | 2035 | 2040 | |
|---|---|---|---|---|---|---|---|---|---|
| Primary | 1858 | 1852 | 1842 | 1831 | 1818 | 1800 | 1712 | 1658 | 1650 |
| Final | 1354 | 1357 | 1357 | 1354 | 1346 | 1334 | 1261 | 1211 | 1193 |
| Category | Unit | 2020 | 2025 | 2030 | 2035 | 2040 |
|---|---|---|---|---|---|---|
| Demand for electricity consumption | TWh | 3398 | 3528 | 3648 | 3793 | 3985 |
| Total electrical capacity installed | GW | 1331 | 1430 | 1488 | 1556 | 1617 |
| Renewables % in the generation of electricity | % | 39.9 | 45.6 | 49.0 | 51.9 | 53.8 |
| Consumption of natural gas | bcm | 339 | 328 | 292 | 259 | 241 |
| Inputs for natural gas for power plants | Mtoe | 130 | 141 | 142 | 148 | 156 |
| Total emissions of CO2, including industrial processes | MtCO2 | 3959 | 3670 | 3313 | 3075 | 2940 |
| CO2 intensity for electricity generation | gCO2/kWh | 268 | 230 | 198 | 180 | 168 |
| Facility Name | Sector 1 | City | Emissions (tCO2/y) 2 | Main Fuel |
|---|---|---|---|---|
| Agios Dimitrios | Power 1587 MW | Kozani | 8,940,000 | Lignite |
| Amyntaio | Power 600 MW | Amyntaio | 2,760,000 | Lignite |
| Kardia | Power 1200 | Ptolemaida | 6,400,000 | Lignite |
| Meliti | Power 330 MW | Florina | 2,270,000 | Lignite |
| Ptolemaida | Power 620 MW | Ptolemaida | 2540,000 | Lignite |
| Liptol | Power 43 MW | Ptolemaida | 118,000 | Lignite |
| Ptolemaida V | Power 660 MW | Ptolemaida | 4,500,000 (estimated) | Lignite |
| Amyntaio | Quicklime | Amyntaio | 40,150 (estimated) | No Data |
| SES | Emissions (tCO2/y) | CO2 (% v/v) | T (°C) | Flow Rate 1 (Nm3/h) | CO (tn) | SO2 (tn) | NO2 (tn) |
|---|---|---|---|---|---|---|---|
| A. Dimitrios | 6,840,000 | 12 | 151 | 571,8311.00 | 2180 | 11,400 | 4140 |
| Kardia | 2,870,000 | 10,375 | 147.52 | 756,324.67 | 2000 | 2960 | 2260 |
| Meliti | 1,410,000 | 12–14 | 65–69 | 786,133.61 | 54.5 | 1120 | 893 |
| Industrial Sector for CO2 Utilisation | Number of Industries in Greece | |||
|---|---|---|---|---|
| North | Central | South | Total | |
| Building materials | 7 | 7 | - | 14 |
| Refineries (synthetic fuels) | 1 | 3 | - | 4 |
| Yield boosting (greenhouses, urea, fertilisers) | 1 | - | 1 | 2 |
| Chemicals industry (plastic, resins, foams) | 5 | - | 1 | 6 |
| Other (e.g., ink, aluminum) | 1 | 2 | - | 3 |
| Formations | Geological Properties | ||||||
|---|---|---|---|---|---|---|---|
| Lithology | Average Depth (m) | A (m2) | hg (m) | ftot | ρres (kg/m3) | Esaline | |
| Pentalofos | Conglomerates, turbiditic sandstones and shales | 1500 | 1147 | 2500 | 0.15 | 594 | 1 |
| Eptachori | Conglomerates, sandstones, marine turbiditic shales with lignitic horizon, marine sandstones and some pebbly conglomerates | 2000 | 400 | 1100 | 0.12 | 603 | 1 |
| Parameter | Units | Min | Most likely | Max | Mean | Std | Distribution |
|---|---|---|---|---|---|---|---|
| Reservoir Area (A) | km2 | - | 1147 | - | 1147 | 50 | normal |
| Reservoir Thickness (h) | m | 800 | 2500 | 4000 | - | - | pert |
| ftot Porosity (Ø) | - | 0.1 | 0.15 | 0.24 | - | - | pert |
| Net-to-gross (NG) | - | - | 0.4 | - | 0.4 | 0.1 | normal |
| CO2 density | kg/m3 | - | 594 | - | - | - | constant |
| Storage Efficiency Factor | - | 0.0075 | 0.015 | 0.03 | triangular |
| Parameter | Units | Min | Most Likely | Max | Mean | Std | Distribution |
|---|---|---|---|---|---|---|---|
| Reservoir Area (A) | km2 | - | 400 | - | 400 | 50 | normal |
| Reservoir Thickness (h) | m | 500 | 1100 | 2000 | - | - | pert |
| ftot Porosity (Ø) | - | 0.07 | 0.12 | 0.18 | - | - | pert |
| Net-to-gross (NG) | - | - | 0.4 | - | 0.4 | 0.1 | normal |
| CO2 density | kg/m3 | - | 603 | - | - | - | constant |
| Storage Efficiency Factor | - | 0.0075 | 0.015 | 0.03 | - | - | triangular |
| Storage Capacity (Mt) | Tier 1 | |
|---|---|---|
| Pentalofos | Eptachori | |
| P90 | 854 | 125 |
| P50 | 1680 | 215 |
| P10 | 3051 | 394 |
Publisher’s Note: MDPI stays neutral with regard to jurisdictional claims in published maps and institutional affiliations. |
© 2021 by the authors. Licensee MDPI, Basel, Switzerland. This article is an open access article distributed under the terms and conditions of the Creative Commons Attribution (CC BY) license (https://creativecommons.org/licenses/by/4.0/).
Share and Cite
Koukouzas, N.; Tyrologou, P.; Karapanos, D.; Carneiro, J.; Pereira, P.; de Mesquita Lobo Veloso, F.; Koutsovitis, P.; Karkalis, C.; Manoukian, E.; Karametou, R. Carbon Capture, Utilisation and Storage as a Defense Tool against Climate Change: Current Developments in West Macedonia (Greece). Energies 2021, 14, 3321. https://doi.org/10.3390/en14113321
Koukouzas N, Tyrologou P, Karapanos D, Carneiro J, Pereira P, de Mesquita Lobo Veloso F, Koutsovitis P, Karkalis C, Manoukian E, Karametou R. Carbon Capture, Utilisation and Storage as a Defense Tool against Climate Change: Current Developments in West Macedonia (Greece). Energies. 2021; 14(11):3321. https://doi.org/10.3390/en14113321
Chicago/Turabian StyleKoukouzas, Nikolaos, Pavlos Tyrologou, Dimitris Karapanos, Júlio Carneiro, Pedro Pereira, Fernanda de Mesquita Lobo Veloso, Petros Koutsovitis, Christos Karkalis, Eleonora Manoukian, and Rania Karametou. 2021. "Carbon Capture, Utilisation and Storage as a Defense Tool against Climate Change: Current Developments in West Macedonia (Greece)" Energies 14, no. 11: 3321. https://doi.org/10.3390/en14113321
APA StyleKoukouzas, N., Tyrologou, P., Karapanos, D., Carneiro, J., Pereira, P., de Mesquita Lobo Veloso, F., Koutsovitis, P., Karkalis, C., Manoukian, E., & Karametou, R. (2021). Carbon Capture, Utilisation and Storage as a Defense Tool against Climate Change: Current Developments in West Macedonia (Greece). Energies, 14(11), 3321. https://doi.org/10.3390/en14113321