Article

Environmental Assessment of the Impacts and Benefits of a Salinity Gradient Energy Pilot Plant

1
Instituto de Ingeniería, Universidad Nacional Autónoma de México, Ciudad Universitaria, Circuito Exterior S/N, Coyoacán, Mexico City 04510, Mexico
2
Campus Yucatan, Universidad Nacional Autónoma de México (UNAM), Mexico City 04510, Mexico
3
Instituto de Ecología, A.C. (INECOL), Xalapa, Veracruz 91073, Mexico
*
Authors to whom correspondence should be addressed.
Energies 2021, 14(11), 3252; https://doi.org/10.3390/en14113252
Submission received: 24 April 2021 / Revised: 24 May 2021 / Accepted: 28 May 2021 / Published: 3 June 2021
(This article belongs to the Topic Marine Renewable Energy)

Abstract

:
Although the technologies involved in converting saline gradient energy (SGE) are rapidly developing, few studies have focused on evaluating possible environmental impacts. In this work, the environmental impacts of a hypothetical 50 kW RED plant installed in La Carbonera Lagoon, Yucatan, Mexico, are addressed. The theoretical support was taken from a literature review and analysis of the components involved in the pressure retarded osmosis (PRO) and reverse electrodialysis (RED) technologies. The study was performed under a three-stage scheme (construction, operation, and dismantling) for which the stress-inducing factors that can drive changes in environmental elements (receptors) were determined. In turn, the possible modifications to the dynamics of the ecosystem (responses) were assessed. Since it is a small-scale energy plant, only local impacts are expected. This study shows that a well-designed SGE plant can have a low environmental impact and also be of benefit to local ecotourism and ecosystem conservation while contributing to a clean, renewable energy supply. Moreover, the same plant in another location in the same system could lead to huge modifications to the flows and resident times of the coastal lagoon water, causing great damage to the biotic and abiotic environment.

1. Introduction

As the supply of fossil fuels diminishes, the opportunity of switching to renewable sources of energy will put an end to some of the negative environmental impacts seen since the first industrial revolution [1,2]. The oceans are a major source of renewable energies, such as marine and tidal currents, wave energy, thermal, and salinity gradients, which can all be harnessed [3,4].
Chemical energy known as salinity gradients (SGE) or saline gradient potential (SGP) is available in coastal zones where two water flows of different saline content coincide, e.g., where a river meets the sea [5,6]. By controlling this mixture and capturing the energy before it is released, electricity can be produced without greenhouse gas emissions. It is possible to use only naturally occurring water flows, but it is also possible to employ hybrid systems, which use effluents of anthropic origin, such as residual waters from desalination plants [7,8,9]. Similarly, the effluent from wastewater treatment plants, of low salinity, could be used as input for an SGP system [10,11].
The methods for producing energy from a saline gradient are varied, but the most advanced methods are reverse electrodialysis (RED) and pressure retarded osmosis (PRO), both of which have already been tested outside the laboratory. Regarding RED, the companies WETSUS and REDstack have developed a 50 kW device in the Netherlands [12,13], while for PRO, the company Statkraft developed a 10 kW plant in Norway [14].
The International Energy Agency has reported that 15,102 TWh of electricity could be produced through salinity gradient in river mouths worldwide; that is 74% of global electricity consumption [15]. However, various physical and environmental limitations were not included in this estimation. Today, taking some of these restrictions into account, and counting only river mouths where this type of energy plant would be feasible, the estimation is 625 TWh, 3% of world consumption [5].
There have been many technological advances in PRO and RED around the world, but there is little information on the impacts the operation and maintenance of SGE plants could have on the functions of nearby ecosystems. The scientific literature surrounding the implementation of SGE at a given study site is scarce. Early works addressing environmental conditions to be monitored mention the amount of water to be extracted (defined as environmental flow, maximum extraction factor, extraction flow, design flow, the annual variation of flow, etc.), the physicochemical characteristics of the water, the physical and chemical characteristics of the input solutions (fresh, marine, treated) and other characteristics, such as salinity structure and temperature (temporal and annual variations) at the extraction and discharge sites [5,12,16,17,18,19]. Few works address the very important effects that the SGE implementation could cause on the sediment balance, care in the use of cleaning products (which when accidentally released pollute), and care and disposal of final effluents and membranes [16]. Other studies mention the importance of hydrodynamic studies and environmental forcings that may affect the thermohaline structure and therefore the amount of energy generated from the saline gradient [16]. Even so, there are very few case studies that mention potential environmental impacts. A study proposing a potential site for SGE at Lake Urmia, in Iran, (a Ramsar wetland with a Biosphere Reserve status with endemic species) only assessed in detail the economic implications of implementation [17]. One reason for this is that no operational devices exist.
Some papers mention that the impacts are similar to those of water treatment, desalination, or other renewable energy plants [1,18,20,21,22]. These works give an overview of potential impacts to habitat, local vegetation and associated fauna, water quality, sediment properties, and social issues related to fisheries and navigation rights and hydrodynamic modifications (changes in flows and their directions and mixing zones). All these impacts are caused by the location of the devices or their interactions with the environment. Specific work on the impact of saline gradient technology highlights potential impacts regarding water intake, final effluent disposal, and impacts associated with infrastructure [23]. However, the study in [22] summarises the overall potential impacts of SGE implementation using a three-phase scheme (construction, operation, and decommissioning).
This paper aims to present a scheme for an environmental impact assessment (EIA) that allows the identification of possible environmental impacts from the implementation of SGE in a coastal lagoon within an environmentally protected area. Through the description of stressors, receptors, and responses, an EIA is developed for the coastal system of La Carbonera, in the state of Yucatan, Mexico.

2. Materials and Methods
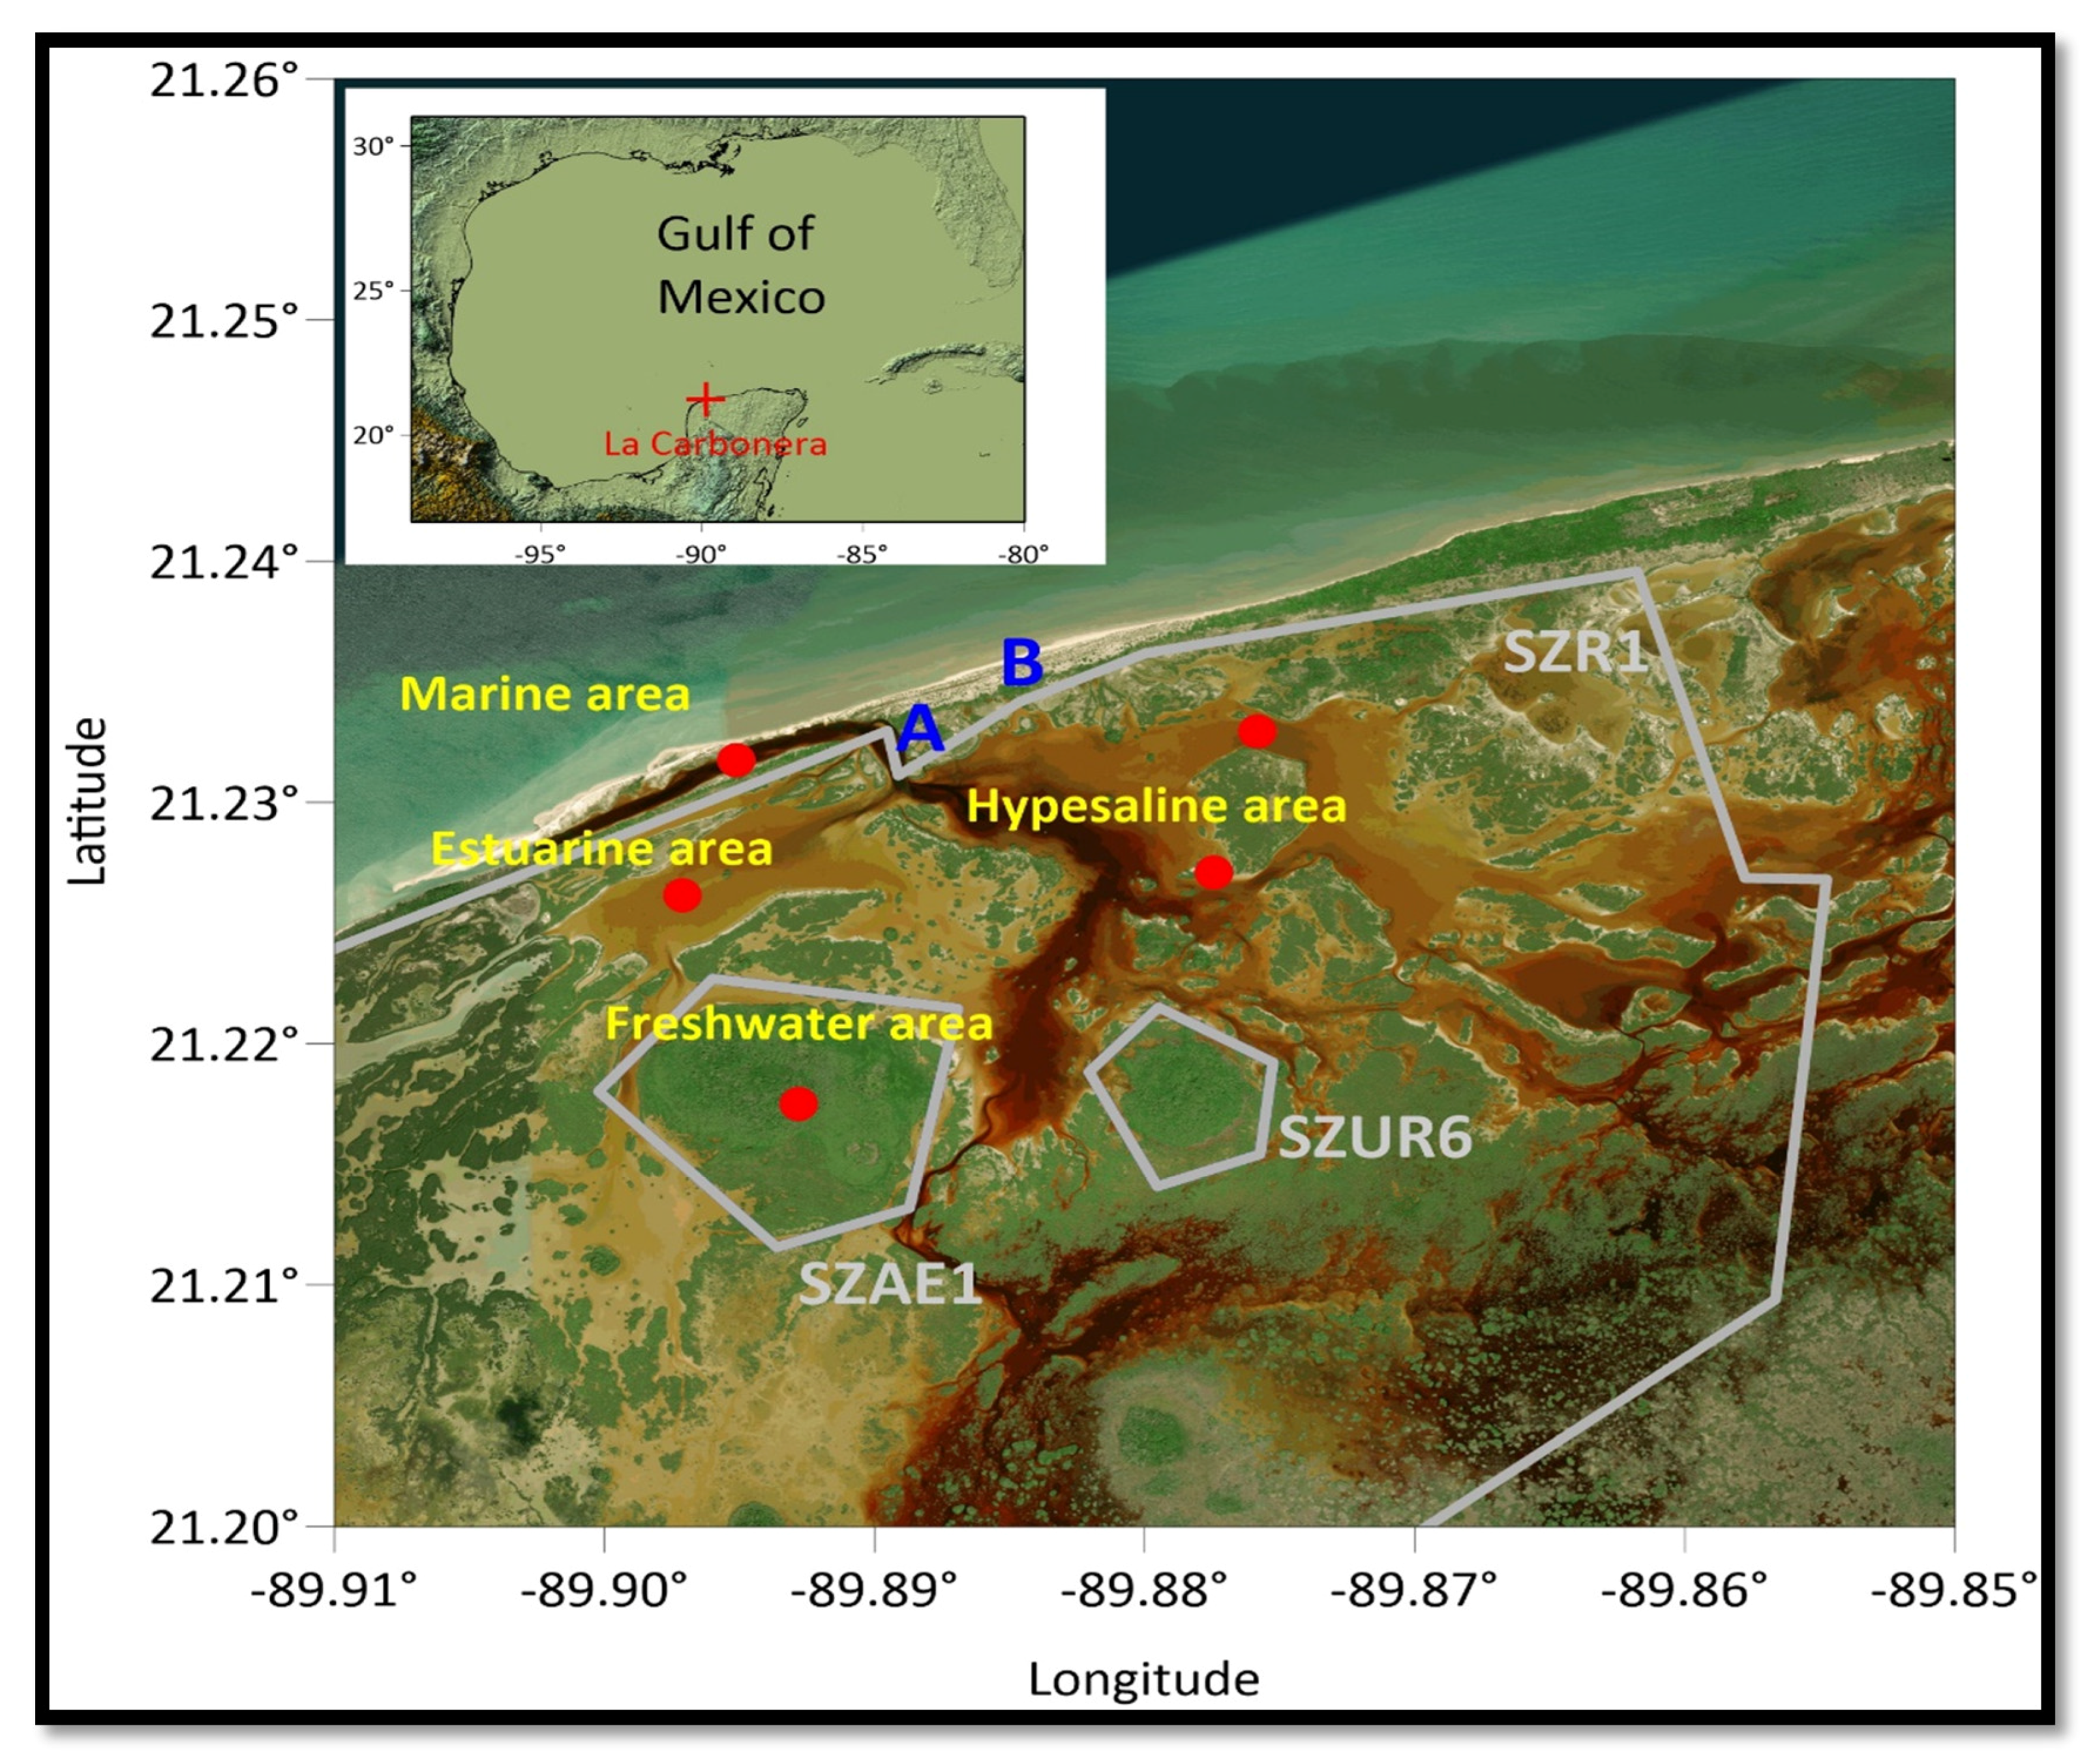
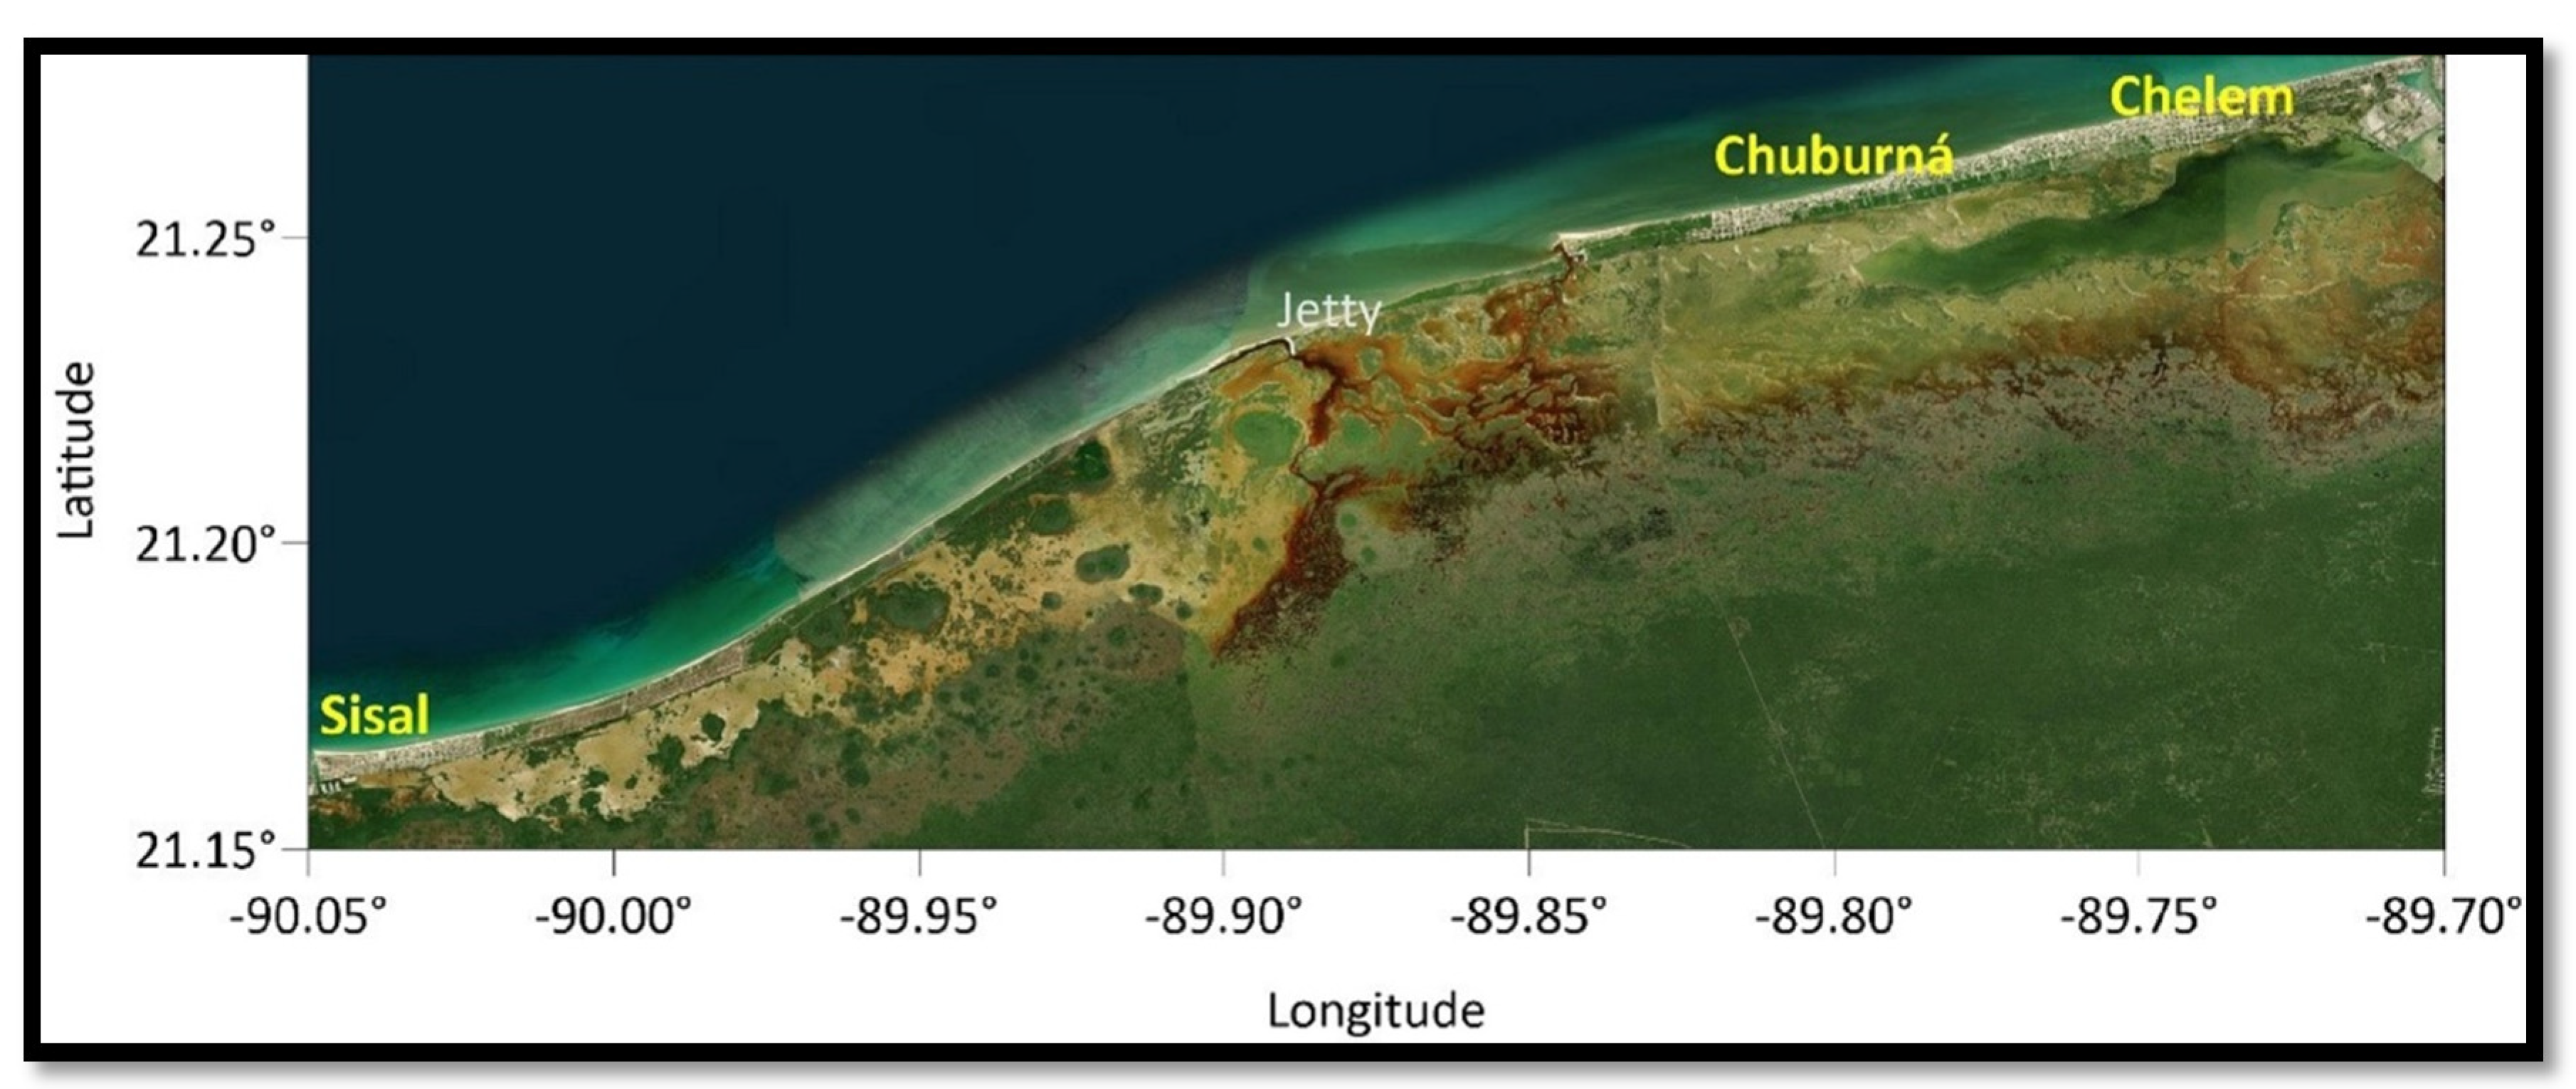
2.1. Study Area

The area considered in this work is La Carbonera lagoon, in the northeast of the Yucatan Peninsula, Mexico (21°13′41.80″–21°14′4.79″ N, 89°53′21.66″–89°54′0.45″ W) (Figure 1) [24]. This coastal lagoon lies in a region of karst characteristics and is approximately 16.5 km2 in area. More detailed information concerning the geology of the region can be found in Appendix A. The channel connecting it to the sea, the Gulf of Mexico, is quite recent, a result of the passage of Hurricane Gilbert, in 1988. The fresh water of the system comes from submarine groundwater discharges, or springs, carrying continental water, which is the result of regional precipitation. The main inlet of fresh water, locally called a ‘peten’, is located southwest of the system. ‘Peten’ is a colloquial Mayan name that refers to islands of vegetation which are associated with freshwater springs that allow the development of perennial rainforests, frequently exposed to flooding [25]. It is a shallow lagoon, 0.30–2.0 m, and as such is very much influenced by the local atmospheric climate. The bathymetry of the lagoon and the coastal zone are presented in Appendix A. The mean annual rainfall is 1025 mm and there are three seasons: dry (March to June), rainy (July to October), and ‘Nortes’, characterised by a decrease in temperature, storm clouds, and heavy rains (November to February) [26,27,28]. The region is influenced by the transit of tropical storms during the summer months, which commonly intensify into hurricanes. Appendix A contains more detailed information on the climate of the study area.
La Carbonera is part of a system of wetlands along the coast of Yucatan. It has a sand bar of 1.5 km in length, a sandy beach, and coastal dunes of medium height. Mangroves lie behind the dunes, around the lagoon, and sometimes further inland. There are springs and an area of swampland around the lagoon [29]. Geological data on the lagoon are given in Appendix A.4.
On the coast, the waves have low energy, except in the Nortes season or tropical storm or hurricane conditions, when the waves, currents, wind, and precipitation are extreme. The tidal regime is mixed, predominantly diurnal, with tides ranging from 0.40 m spring tides to 0.08 m neap tides. Appendix A has more information on the hydrodynamics, currents, and tides. The mean air temperature is between 24 °C and 26 °C, with variations of up to 10 °C throughout the day, minimums in December and January and maximums in July and August [30].

2.2. Legal Framework

This lagoon system is part of a Natural Protected Area (NPA) in the region known as the Cienegas and Manglares State Reserve of the North Coast of Yucatan (RECMY), which has a total surface area of 55,000 ha and covers several municipalities of the State of Yucatan. The aim of officially recognising the ecological importance of the region was to protect the coastal ecosystems there, which are mainly well-conserved mangroves. La Carbonera is in the west of the reserve, and within it, several polygons have been assigned categories according to their uses. The lagoon is within polygon SZR1, which has the category of Buffer Zone/Public Use. In this zone, current or future actions are given permits if they lead to sustainable development and, at the same time, create conditions to conserve the reserve′s ecosystems in the long term. Recreation, leisure activities, group or individual tours are allowed in designated sites, approved for this purpose. Overnight stays and camping are permitted, as well as the development of low-impact infrastructure, in accordance with the Ecological Use Plan for the Coastal Territory of Yucatan. Such infrastructure must be subject to the corresponding authorisations and permits in terms of land and environmental use; including lodging infrastructure, walkways, trails, conditioning of water crossings, signage, and surveillance, which are aimed at sustainable use and the inspection and surveillance of such sites. The construction of new infrastructure, as well as actions that have an effect on hydrological flows, must comply with the relevant environmental impact requirements (Figure 1, polygon SZR1).
Within polygon SRZ1, there is a smaller polygon of category Core/Subzone Restricted Use Zone, SZUR6. This is a peten zone within the lagoon. It is better conserved, or little altered; an area that contains ecosystems, natural phenomena, and geohydrological processes of special interest, as well as species of flora and fauna that have special protection. In this polygon, only exceptional activities that do not modify the ecosystems and that are subject to strict control and supervision measures are allowed, subject to having a permit from the Reserve’s authorities [31].
There is also another polygon with the category of Buffer Zone/Subzone of Special Use, SZAE1. This is where the main groundwater discharge to the lagoon is located. It is an area composed of vegetation mosaics with a certain degree of conservation. It contains natural resources which are essential for the social development of the inhabitants of the area. The exploitation of these resources must be carried out without damaging the ecosystem and without substantially modifying the landscape or causing irreversible environmental impacts, in appropriate ways, subject to limited, supervised load capacities. Ecotourism is therefore allowed if it is sustainable and compatible with the environment. For this, operators must have the corresponding permits and management plans, from the Reserve’s authorities. The promotion of environmental management units for the intensive and extensive use of wild flora and fauna is also allowed, with the corresponding registers and authorised management plans. Similarly, artisanal and subsistence fishing activities are permitted, subject to surveillance and supervision, with fishing gear that has been authorised, for each case, in the specific sites of these subzones [31].

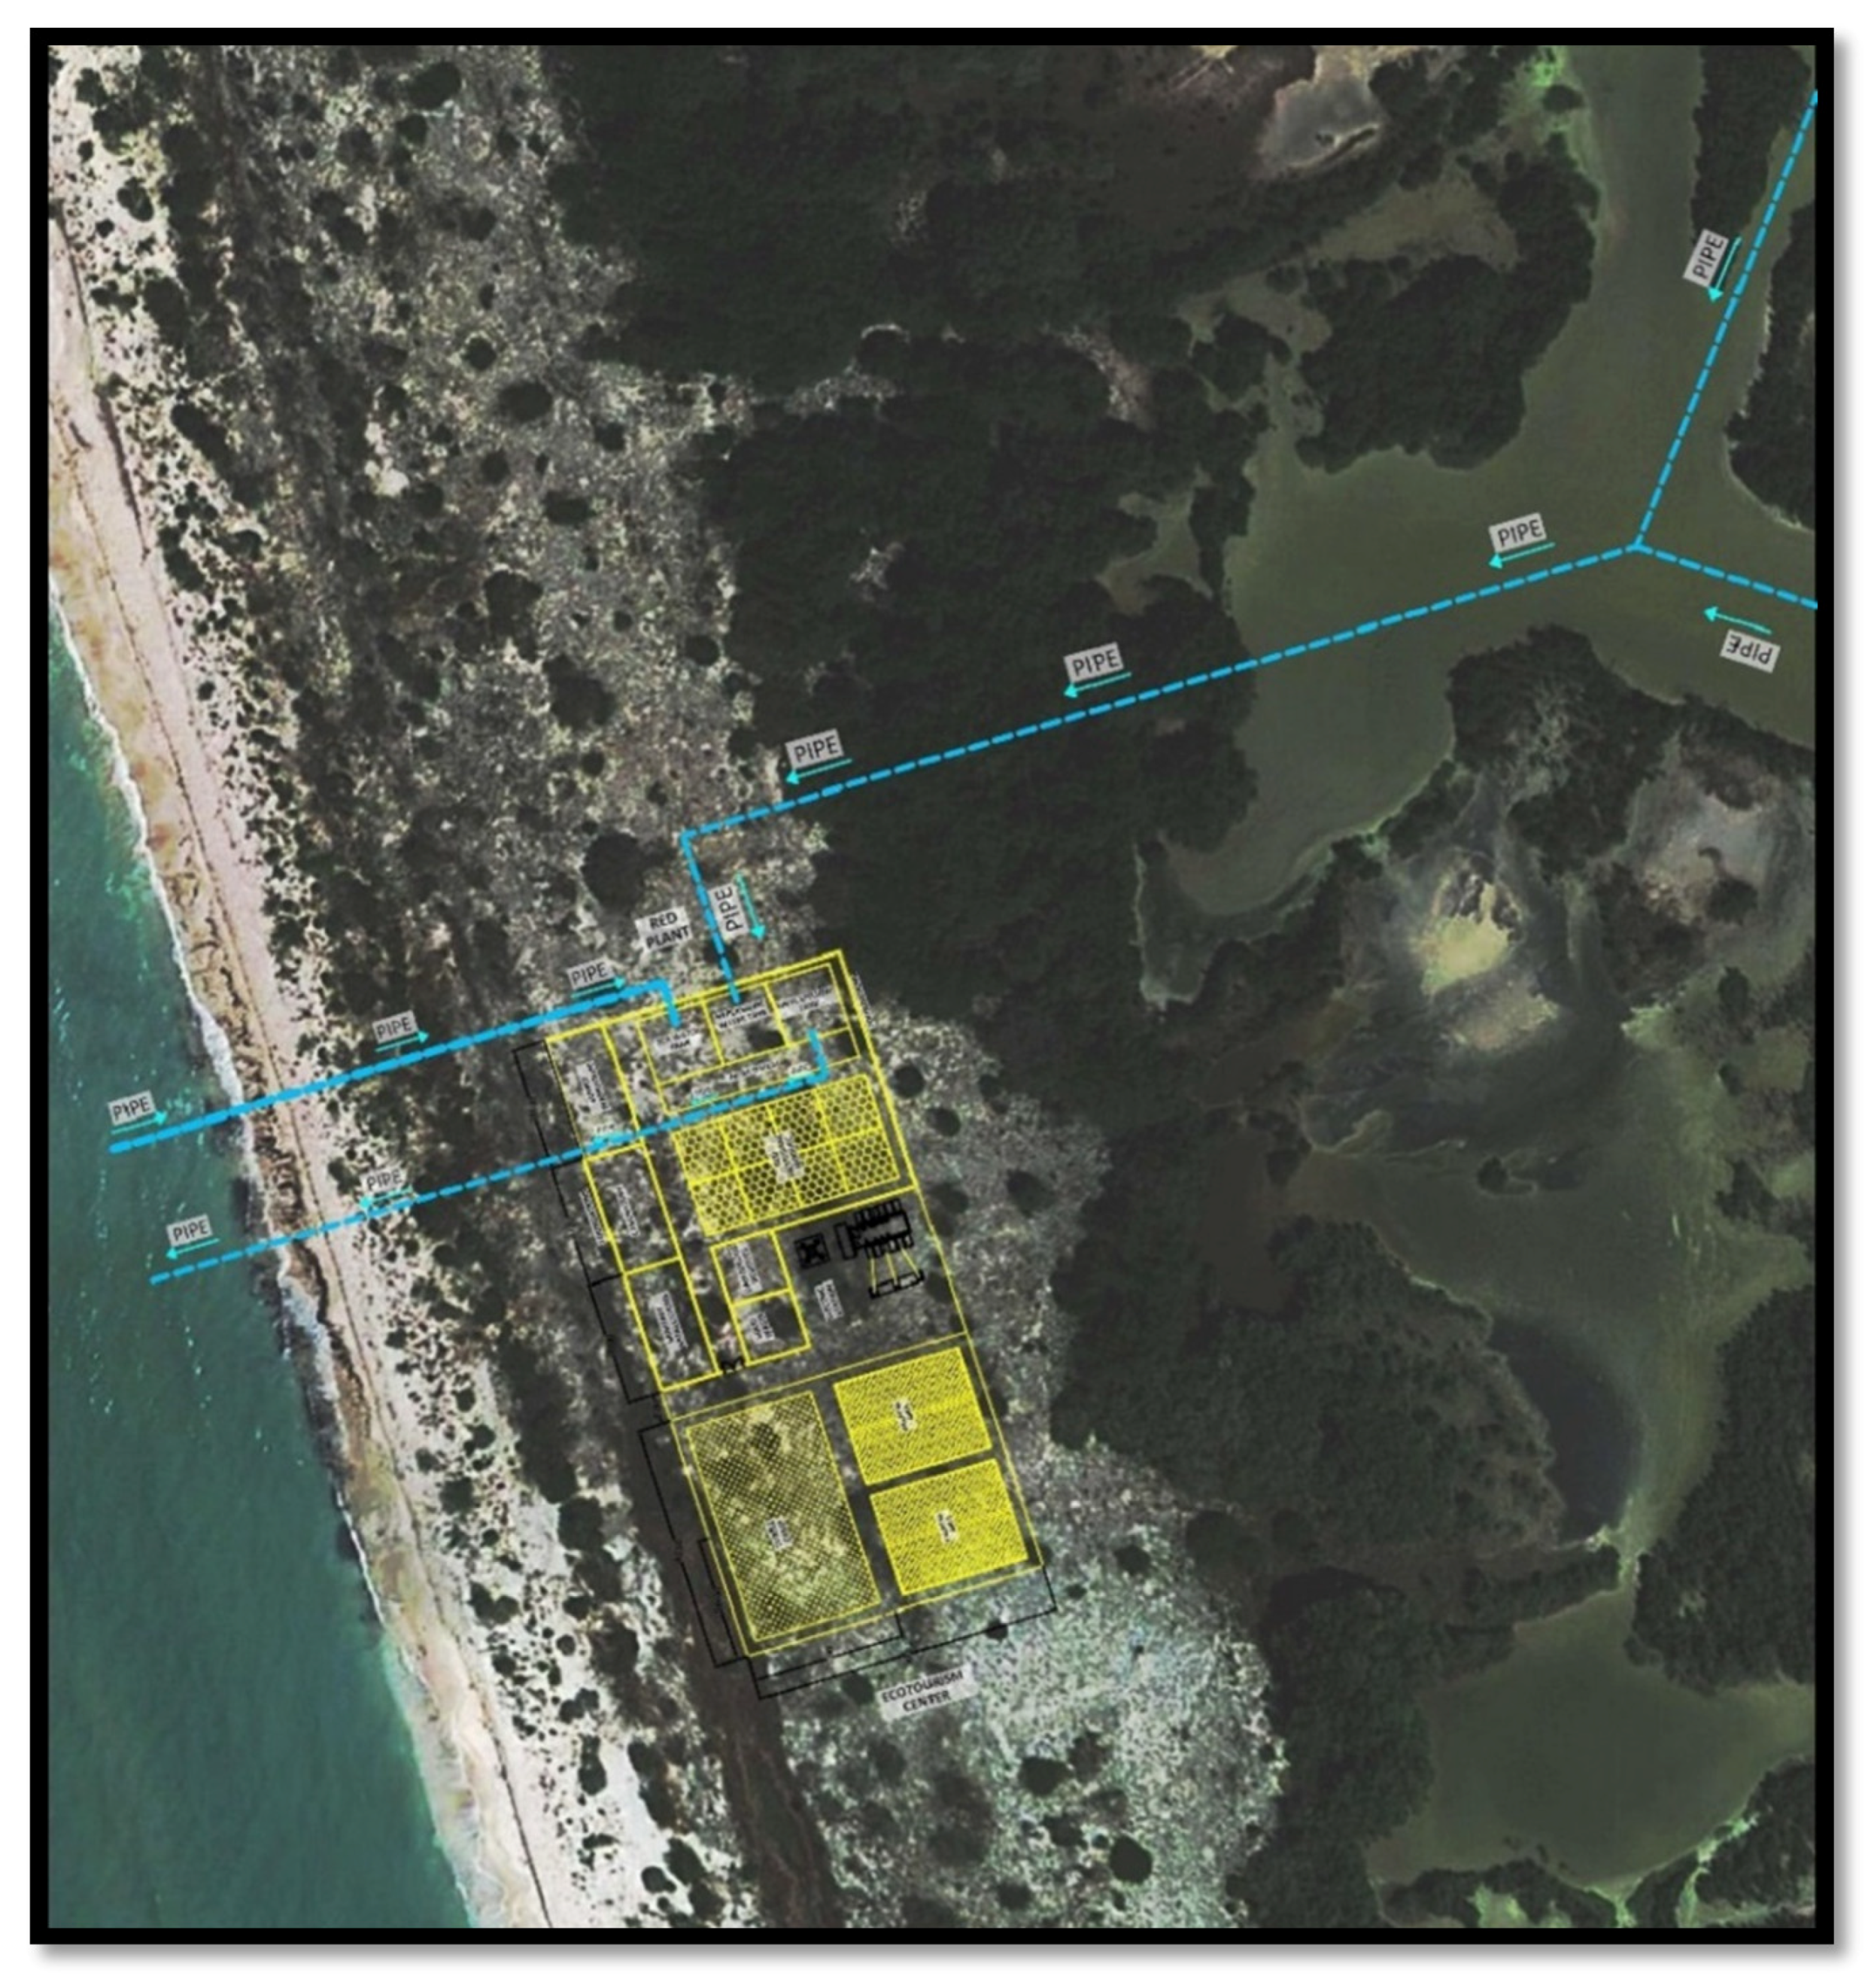
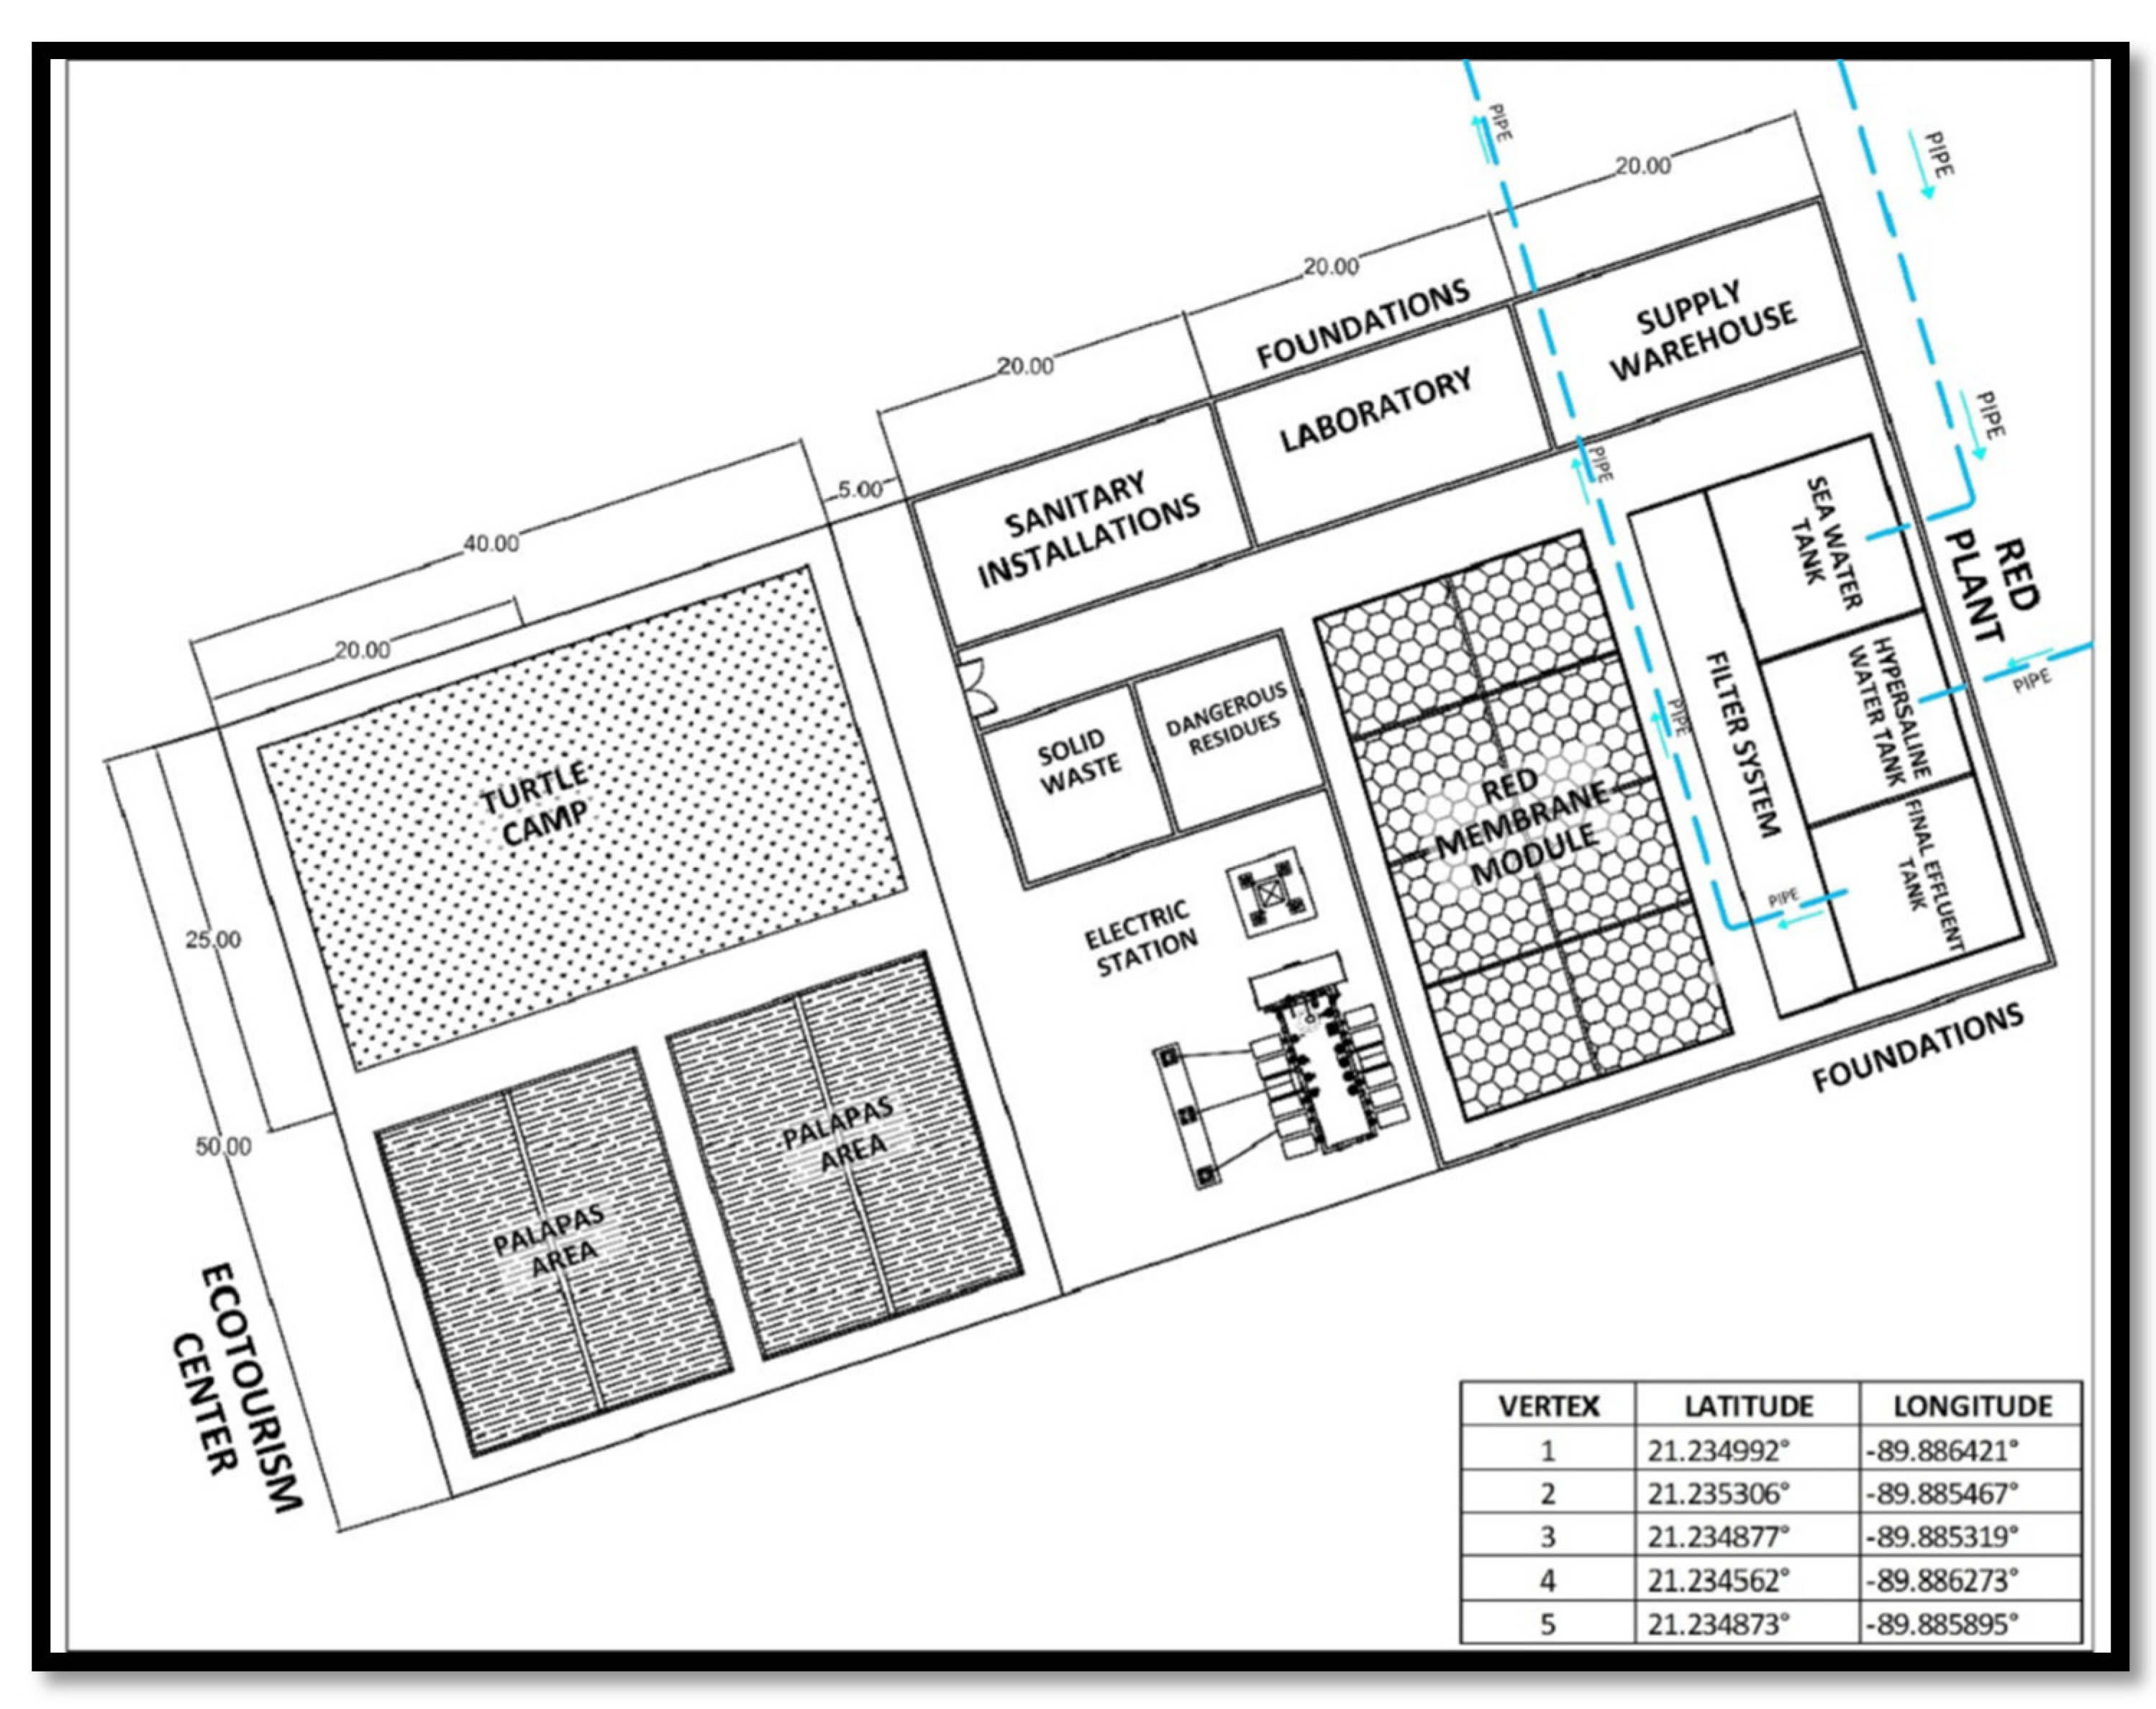
2.3. Geographical Boundaries and Current Uses

Within its geographic margins, La Carbonera lagoon has no human settlements or infrastructure around it, although it is located between two towns, to the west, Sisal, and to the east, Chuburna. The current anthropic activities in the lagoon are local fishing, small-scale tourism promoted in the surrounding localities, and scientific research by various local and national institutions.
In the scientific literature, some characteristics are mentioned which imply that monitoring is necessary before and after the implementation of SGE exploitation: a very marked saline structure (a horizontal gradient, in this case), low tidal amplitude, and substantial control of hydrodynamics with atmospheric forcings [16]. More specific biophysical details of La Carbonera are presented in the following sections.

2.4. Thermohaline Structure

The thermohaline structure of this lagoon, similar to many coastal systems, has important variations at different temporal scales throughout the year, giving variations in the potential energy obtained from SGE. According to the salinity and temperature characteristics, La Carbonera has four defined zones [32,33,34,35] (Figure 1) as follows:
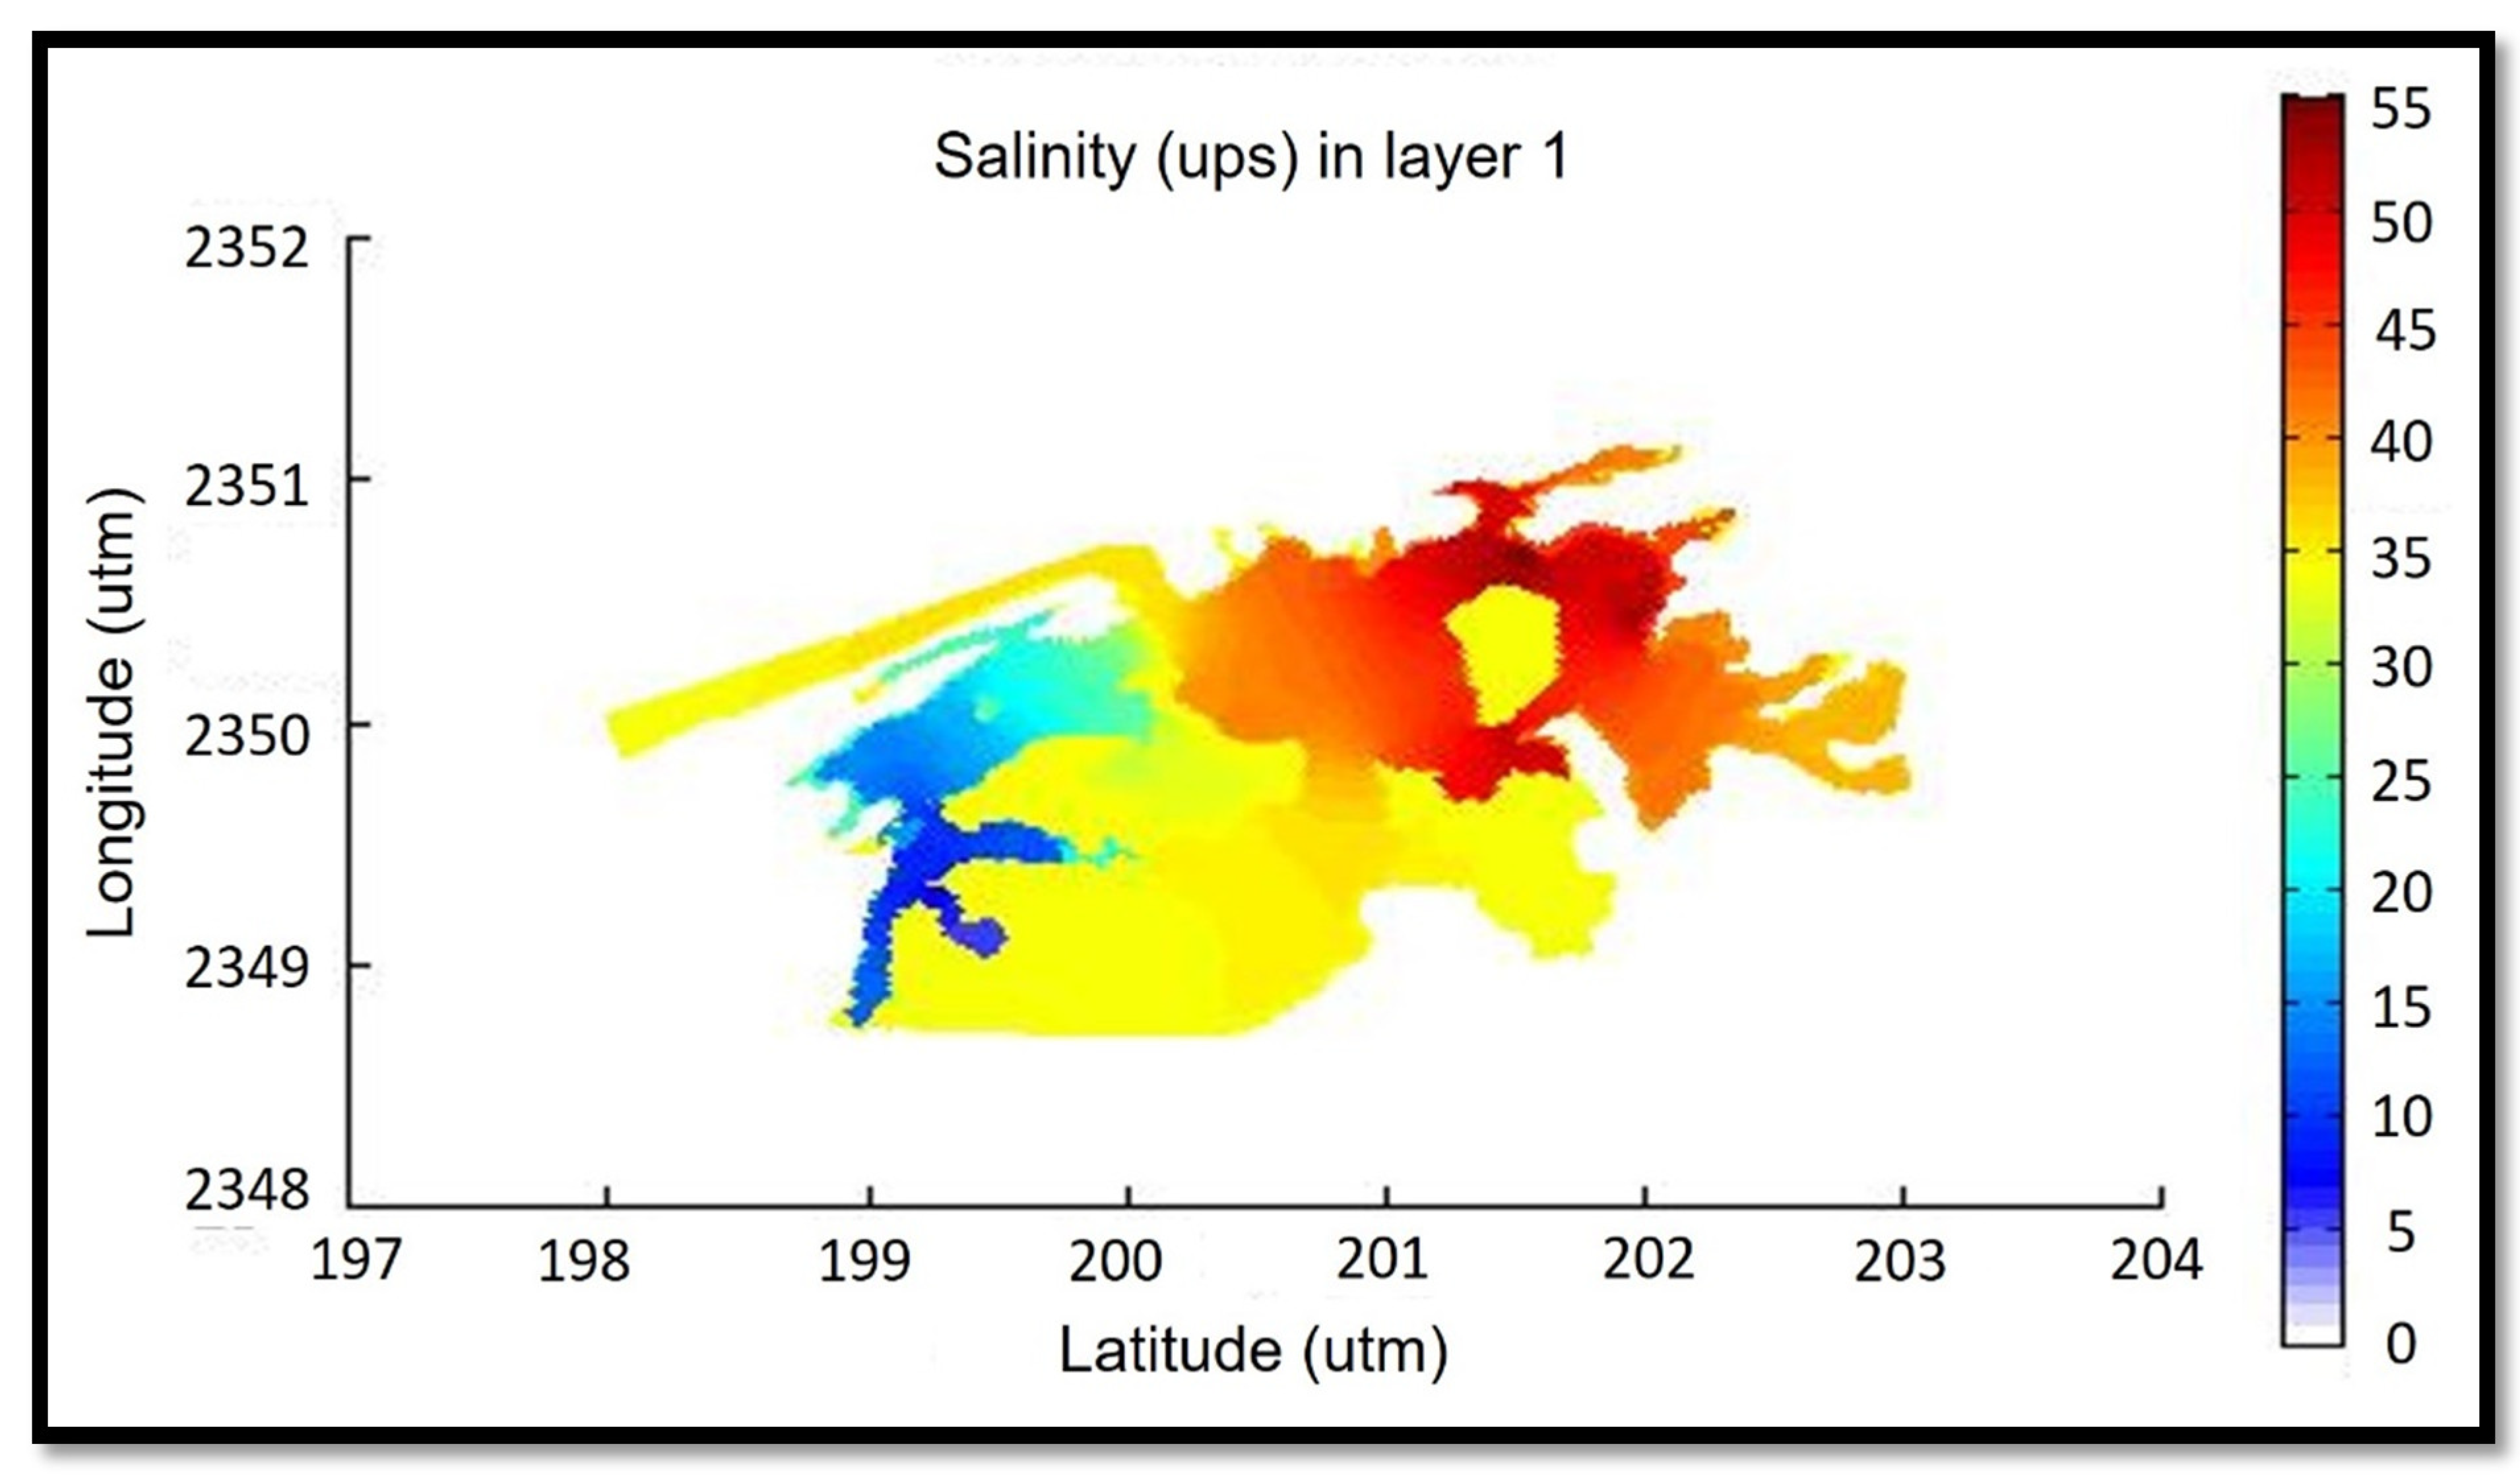
  • A permanent fresh water effluent in the southwest of the lagoon (<5 psu (practical salinity units) with an almost constant temperature (27 °C));
  • An estuarine zone in the central west of the system (where the salinity concentration varies with tides between 5 and 35 psu);
  • A marine zone in the mouth of the sea inlet (around 35 psu);
  • A hypersaline zone in the east of the system (60–100 psu).
The temperatures in zones 2, 3, and 4 show seasonal (15–37 °C) and daily variations of up to 10 °C and 20 psu or more in salinity. This lagoon has a strong horizontal salinity gradient, with hypersaline characteristics in the east, marine in the centre, estuarine in the west, and a freshwater zone in the southwest. In Appendix A, the salinity patterns of the lagoon are shown.

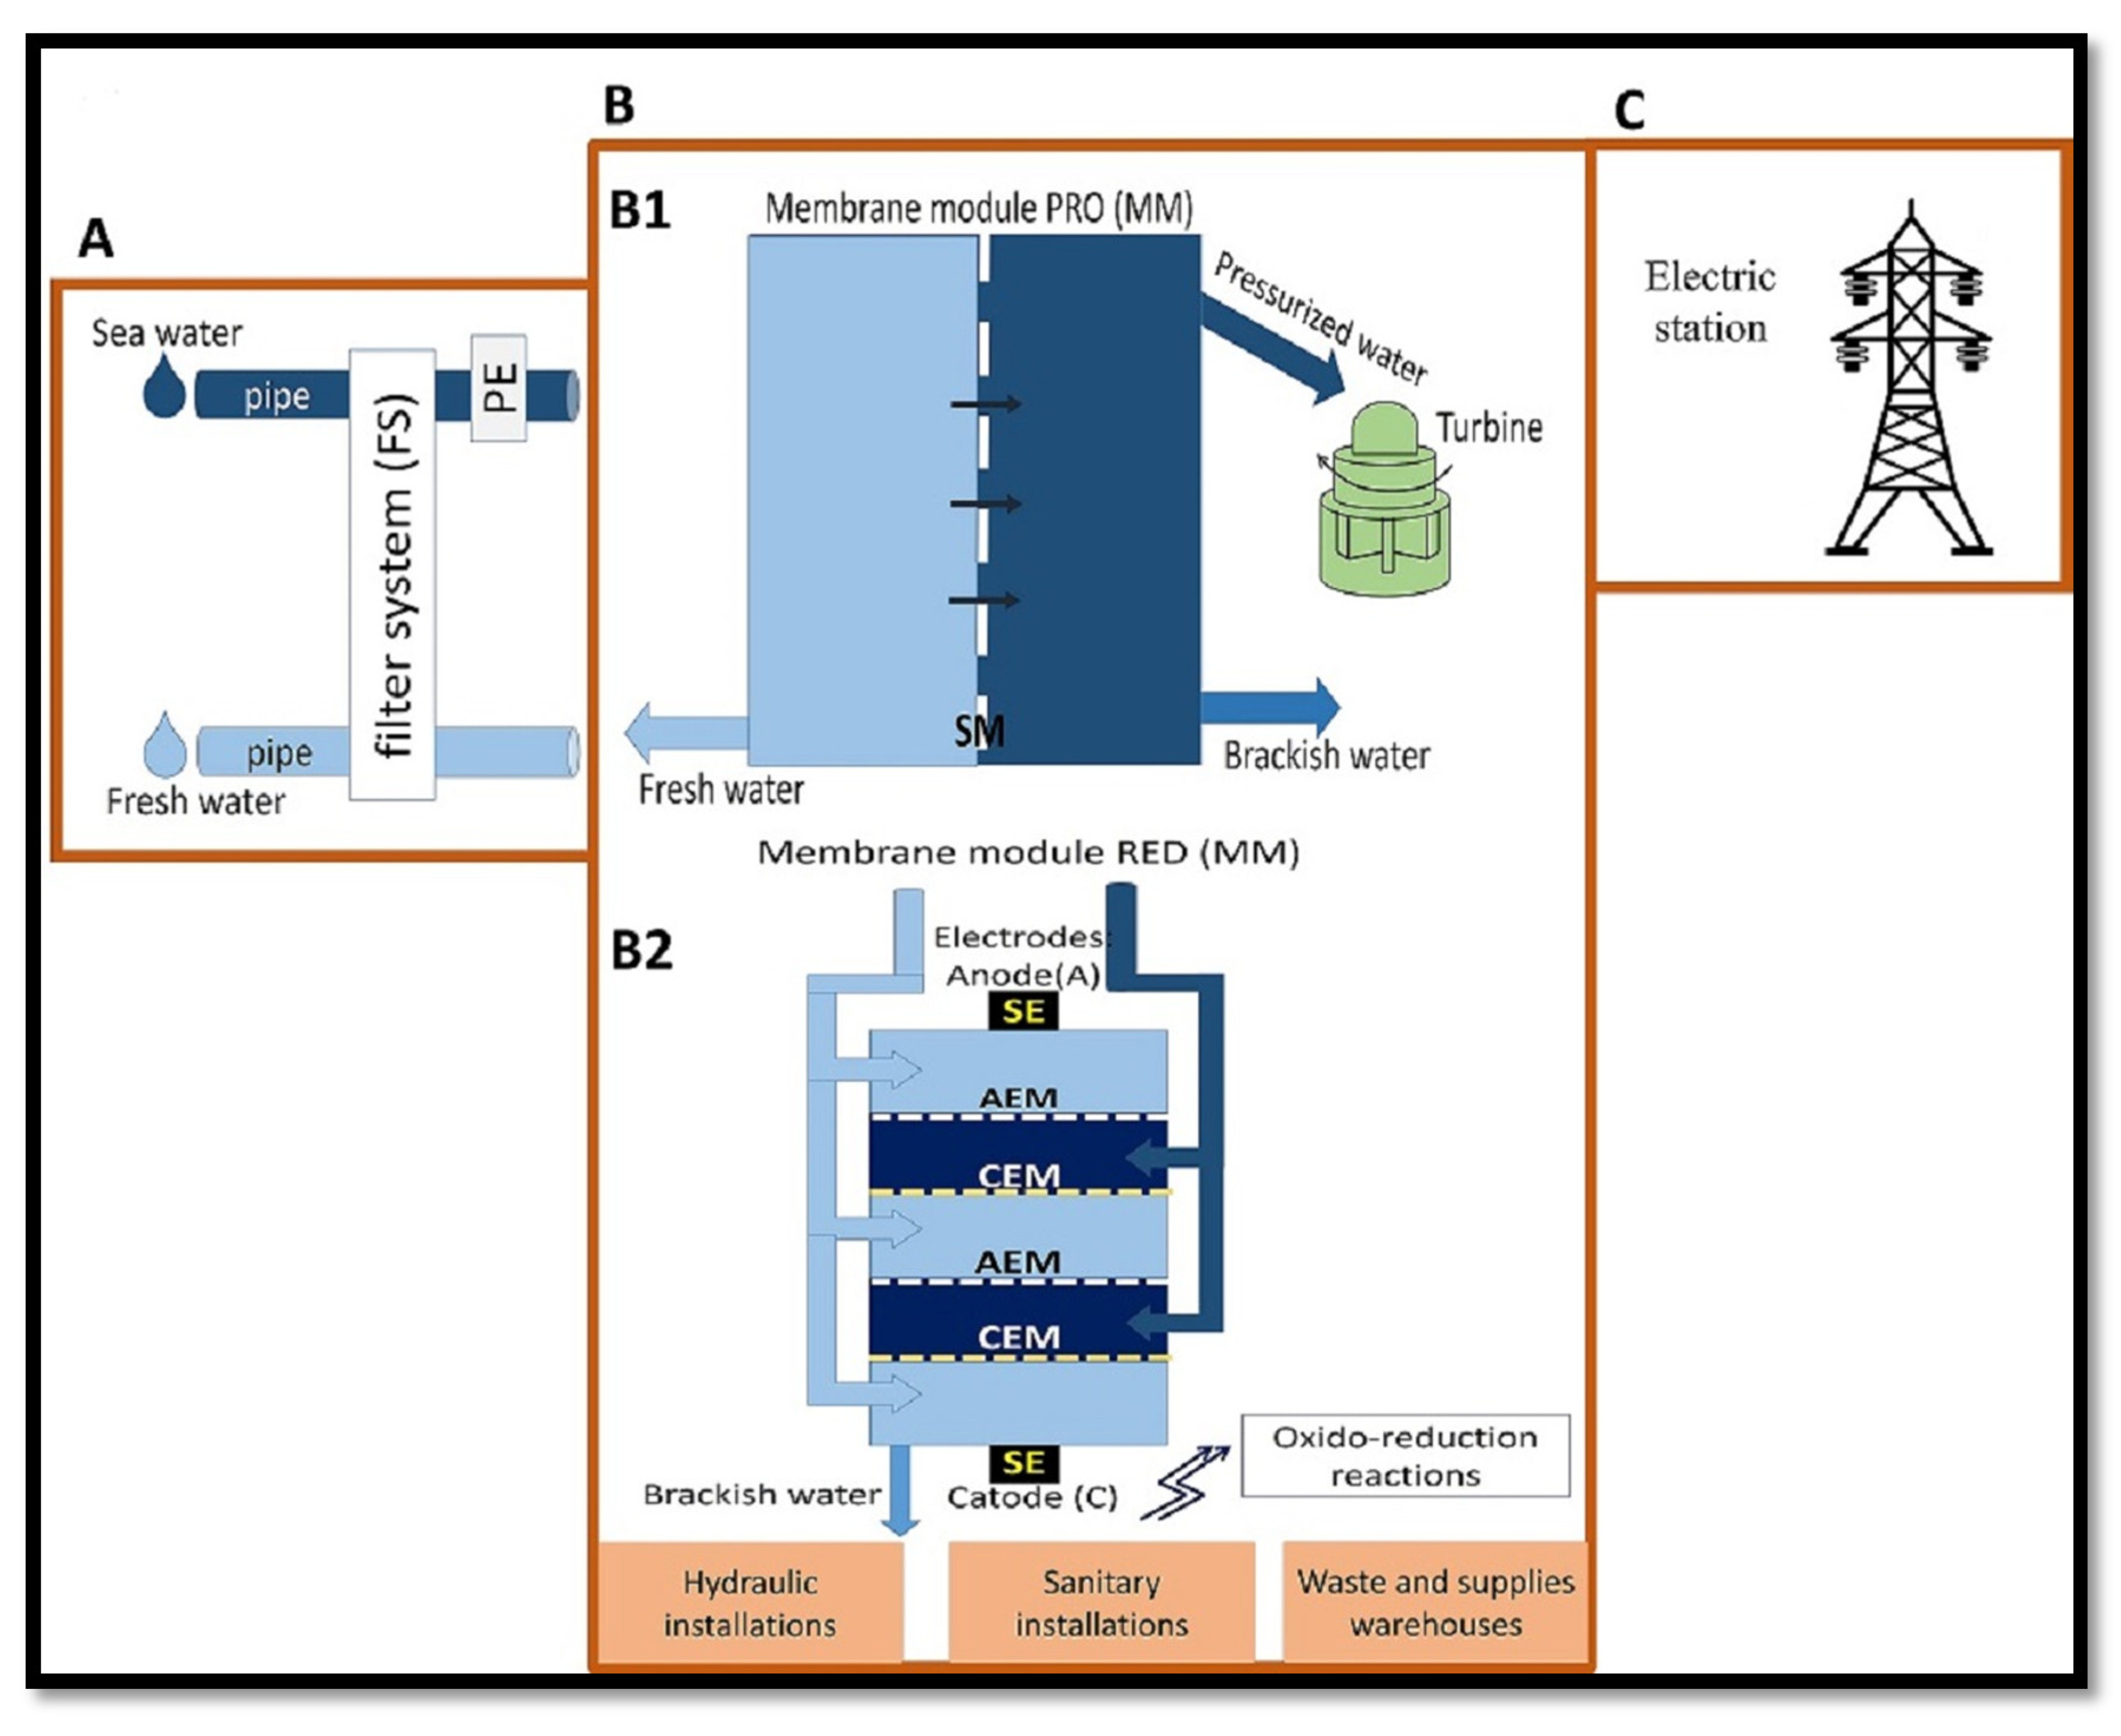
2.5. Theoretical Potential for Generating SGE

Reyes-Mendoza et al. [35] have reported the theoretical potential of SGE available in La Carbonera lagoon, based on the thermohaline structure and environmental factors (evaporation, air temperature, etc.). There are three possible plant configurations to harness the saline gradient of the lagoon: freshwater/seawater (FW/SW), freshwater/hypersaline water (FW/HW), and seawater/hypersaline water (SW/HW). The energy available from these are the following:
  • FW/SW: 0.244 ± 0.0889 kW, with a maximum of 0.527 kW in May, in the dry season;
  • FW/HW: 1.111 ± 0.277 kW, which is the maximum average of the three plants’ configurations;
  • SW/HW: 0.413 ± 0.194 kW, with a maximum of 0.916 in December, in the Nortes season.
On the other hand, the great variations in the thermohaline structure determine the variability of the power potential throughout the year. For a capacity factor of 90%, the installed capacity for the FW/SW configuration should be 0.133 kWh, for the SW/HW configuration 0.25 kWh, and for the FW/HW configuration, 0.527 kWh [35]. These figures were obtained considering the mixing of 1 m3/s of saline and fresh water.

2.6. Biological Characteristics

In this region, there are several species of economic importance (regional and local fisheries), ecosystemic and anthropogenic applications (medicinal, construction, tourism), or areas with some category of risk, according to the 059-Semarnat-2010 [36] or the International Union for Conservation of Nature (IUCN) (Table 1). Although many more species are reported, only those with anthropic importance and/or uses, or a protection category were assessed.

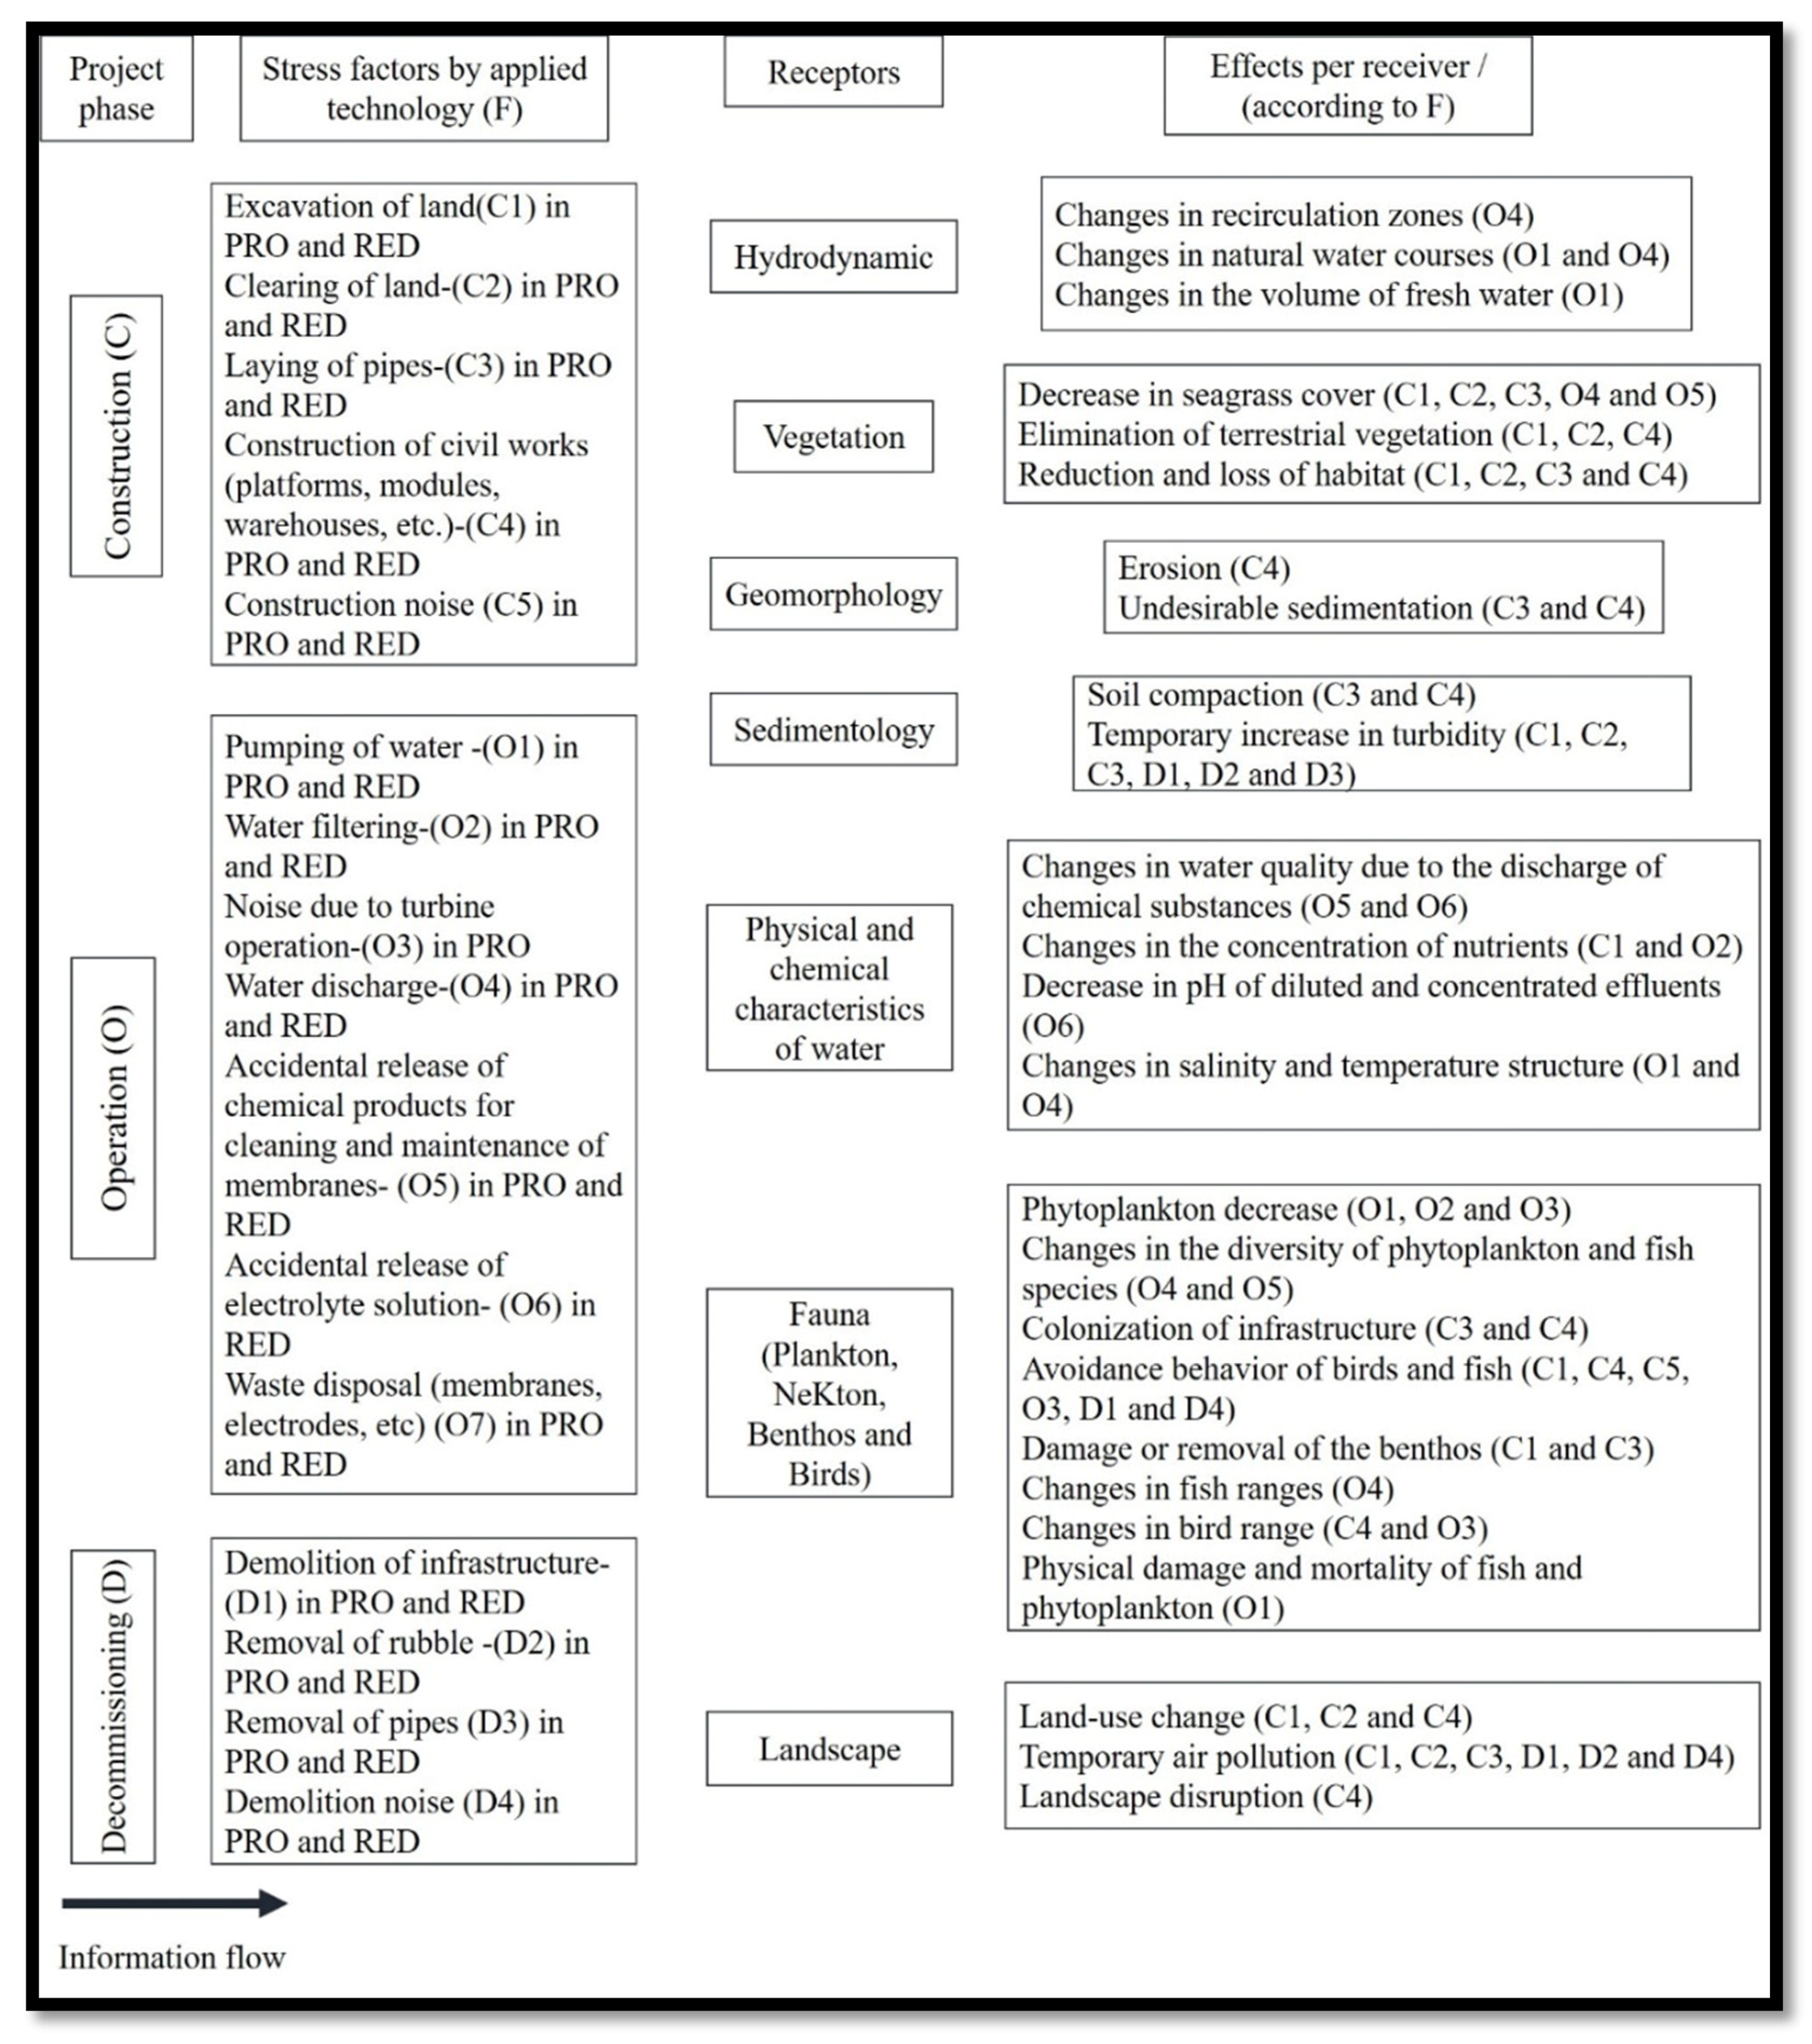
2.7. Environmental Impact Assessment

To ascertain the potential impacts of SGE implementation at La Carbonera, an Environmental Impact Assessment (IEA) was conducted [44,45,46,47]. The selection of the environmental impacts was based on the available scientific literature, such as [1,21,22,23].
The impact analysis used the [48] classification framework proposed for the impact assessment of other ocean renewable energies. The analysis was conducted for three phases: construction, operation, and decommissioning. This EIA considered stressors, receptors, and environmental responses and impacts. Stressors are those characteristics of the environment that may change due to the implementation of SGE in construction, operation, and decommissioning. Receptors are elements of the ecosystem with the potential for some form of response to the stressor, including the various biotic and abiotic components of the ecosystem with the potential to be affected. Effects, or responses, are how these receptors change, without indicating magnitude or significance. Finally, impacts address the severity, intensity, or duration of the effects and cover the direction of the effect, which can generate positive or negative outcomes.
The impacts of this technology are similar in the construction phase to those of seawater desalination plants, wastewater treatment plants, or other renewable energy plants. Since there is currently insufficient on-site experience on the impacts, the stressors considered were based on the analysis of the components of the PRO and RED technologies (Figure 2). This figure gives a general view of the main components of both technologies. In section A, the pipes and the filtering system are shown. In section B, depending on the technology used, and the expected production, the site will require several, repeated PRO or RED modules (membranes in both cases, in RED also electrolyte solutions), as well as hydraulic installations (turbines in PRO), sanitary installations and storage facilities for inputs and waste. Section C shows the electrical installations for power distribution/storage (should include cabling, towers, etc.). In both PRO and RED, a final by-product is a brackish water or seawater, depending on the scheme used (SW/FW, SW/HW, or FW/HW).
For the determination of receptors, shown in Figure 2 (A–C), general impacts, similar to other engineering projects in coastal systems, are expected, including the following:
  • changes to land use (excavation, land newly used, etc.);
  • emission of pollutants (atmosphere, water, land, solid waste, etc.);
  • storage of waste (in situ, transport, waste sites, etc.);
  • overexploitation of resources (raw materials, energy consumption, water, flora, and fauna, etc.);
  • alterations in species composition and abundance (emigration, reduction in numbers, extinction, etc);
  • deterioration of the landscape (topography, vegetation, watercourses, surroundings, etc.);
Finally, from the revision of biotic and abiotic features of the system shown in the case study, an analysis of Stressors, Receptors, and general Responses to the implementation of SGE in potential systems was presented.
It is hoped that this work can serve as a guide for other cases elsewhere.

3. Results and Discussion

A general analysis of the environmental impacts of PRO and RED technologies in three phases (construction, operation, and decommissioning) is presented. These impacts can also be applied to other potential systems that use salinity gradients for energy production (river mouths, estuaries, coastal lagoons). The receptors highlight those characteristics of coastal environments that may be susceptible to change due to the SGE (Figure 3). The responses were analysed for each receptor, revealing the potential impacts of this technology (Figure 3).
In this overview of possible impacts on potential systems, it is important to mention that these may be minor or major impacts, depending on several factors, such as the size of the plant, the characteristics of each system (biotic and abiotic), and scheme used for energy harvesting (natural solutions or anthropic effluents). In the case of La Carbonera, the exploitation scheme proposed is in line with the regulations in force and adapted to the specific characteristics of the site.
The scheme for La Carbonera is the hypothetical implementation of net output of 50 kW RED power plant of the size and production of the RED prototype located in Afsluitdijk, in the Netherlands. This plant included three water storage tanks, two pretreatment systems (concentrated and dilute solution), and eight membrane stacks. The proposed infrastructure is therefore low impact.
For the size and energy production of this hypothetical plant, it is important to consider first that many of the environmental impacts in each phase will depend on the characteristics of the site where the plant is built. Therefore, some aspects taken into account to select a location, with consideration to possible responses, are reported in Figure 3 and include the following:
  • Consider the proximity of the resource (freshwater, marine, hypersaline);
  • Choose building sites on land with sparse vegetation;
  • Consider smaller areas for excavation and the introduction of pipelines;
  • Consider that permanent effects (such as changes to hydrodynamics) have greater effects on receptors than temporary effects (such as construction noise or increased turbidity) in resilient systems, such as coastal lagoons [41];
  • Consider final effluent discharge area;
  • Consider areas accessible to tourism;
  • Consider species conservation.
From these considerations, installing the RED plant behind a small jetty in the lagoon, A in Figure 1, would induce significantly greater environmental impacts than with option B of Figure 1. First, this result is because the excavation for the pipelines would be greater, as the hypersaline water must come further, and all the impacts associated with the various stressors (C1, C2, and C3, Figure 3) must be considered. Second, the pipeline would pass through several mangrove patches, and therefore, the vegetation here and its associated fauna would be severely affected. Thirdly, although the availability of seawater at this location (at the mouth of the lagoon) would be close to the RED plant, the interruption to the tidal flow entering the lagoon, due to the constant intake of this solution, would generate various negative impacts. One of the main impacts possible is that large areas of the hypersaline zone that depend on this sea–lake exchange could dry out. Exposed sediments would therefore be salinised, and large areas of mangroves would dry out. In addition, the interruption of this flow would change the hydrodynamic conditions that favour the distribution and abundance of the various fish species reported in Table 1. Likewise, this would affect the sedimentation processes at the lagoon mouth. On the other hand, the discharge of effluent from this location into the sea would also imply greater excavation and the laying of pipes and damage to the mangrove and associated fauna (Figure 3).
Although the proposed infrastructure is small, the correct location of a plant and especially of the collecting and discharging zones may result in huge differences in terms of impacts: in this example, locating the plant at site A may generate several negative impacts that can be avoided with the location and design of plant at B (Figure 1). The design process, including location selection and analyses to be considered, are presented next.

3.1. Construction Phase

The proposed location for the RED plant is on the coastline between La Carbonera lagoon and the coastal dune, outside the main SRZ1 polygon, and under the jurisdiction of the Federal Maritime Terrestrial Zone (ZOFEMAT) (A, Figure 1 and Figure 4). At this location, several elements need to be constructed (roads and other infrastructure related to basic services). In the literature, as an example, the design of a PRO plant with a production capacity of 50 kW net output covers approximately 7000 m2 (the approximate size of a football field) [49], while the area of the Afsluitdijk RED plant covers approximately 2750 m2 (measured from Google maps). The total area proposed at La Carbonera is 5250 m2, the RED plant elements will be distributed in 3000 m2 (Figure 4 and Figure 5), which includes three tanks for the concentrated (hypersaline), diluted water (marine or fresh), and the resulting effluent (brackish marine). There will also be space for the membrane modules and for a test laboratory. Finally, spaces for storage, waste storage, sanitary facilities, and an electrical station will be added (Figure 5).
La Carbonera, in spite of being a natural protected area, is becoming increasingly popular with tourists. This is encouraged since tourism is more profitable than fishing and agriculture. In line with regulations that allow minor infrastructure in the area, it is proposed that alongside the SGE plant a small ecotourism centre is built (with a total area of 2000 m2), with cabins, viewpoints, rest areas, and a section for supplies, such as kayaks and boats. (Figure 4 and Figure 5). This centre could include a turtle camp, as the area receives three protected species (E. imbricata, C. mydas and C. caretta, Table 1), arriving to lay their eggs. The incubation of the eggs, laid on the beach, would improve hatching success. The huts and nesting pens could be made using local palms (Sabal yapa, Table 1), widely used for this type of construction [50].
The ecotourism centre would benefit from the electricity generated at the RED plant. This energy could be used to charge mobile phones, cameras, or torches, in addition to the electricity needed for the turtle camp (mainly the nurseries), and in the future, could also supply energy for electric boats. The energy generated would be sufficient to make the plant self-sufficient in electricity. An ecotourism centre would provide well-paid jobs and also limit the pressures associated with the present mode of tourism; visitors coming into the area on day trips from other towns and villages which has brought various environmental problems to this area. The biological richness of the region is accessible in only a few places, and many features of the tourism model are misguided. Excessive growth in some of these areas has led to the infilling of swamp areas to build homes, damage to the coastal dunes due to road construction, and poor management of solid waste and residual water, in particular [42] (Figure 6). Using this site solely for ecotourism, scientific development, and species conservation could help to curb such chaotic, harmful growth around La Carbonera. In addition, the mangroves, swamps, and dune vegetation would be preserved because the ecotourism centre would not be built in these ecosystems. It would also promote environmental awareness among the local population.
The stressors examined (Figure 3) include excavation, site preparation, placing pipelines, and the construction of platforms and modules. The impacts are similar to those of any other engineering project: removal of vegetation, habitat loss, erosion, unwanted sedimentation, soil compaction, temporary increase in turbidity, avoidance behaviour of birds and fish (due to construction noise), damage or removal of benthos, change of land use, temporary air pollution, and landscape disruption. Nevertheless, all of these will depend on the construction techniques and on the precautionary measures taken. The plant would be located on the seashore (Figure 2, section B), and as it would be affected by the tides, it is proposed that the RED plant be built on pillar-supported infrastructure (palafitte) that will allow water to flow beneath. These low-impact structures do not require extensive excavation [51] and would minimise some impacts on geomorphology and vegetation. They would also permit the free passage of wildlife, particularly useful in storm surge events. In terms of landscape disruption and land use change, as it is a small project, the impacts are expected to be minimal. Given that the site proposed for the plant will not modify the hydrodynamics of the lagoon, natural sediment transport changes are not expected. Additionally, any increase in turbidity, damage or elimination of benthos, erosion or soil compaction, and air pollution will only be temporary. In the case of vegetation and habitat loss, this location was chosen (Figure 4) precisely because there are no large patches of vegetation, except for some coastal dune species in the vicinity (Table 1).
During construction, in order to lay pipes, excavation work is required, which can lead to temporary increases in turbidity (due to sediment movement), loss of vegetation cover (terrestrial and aquatic) and associated habitat loss, removal of benthic organisms, and the release of nutrients and pollutants from the bottom of the lagoon (Figure 3).
The pumping system should be low cost and easy to maintain (to avoid algal blooms, oxygenation, and suspended particles). Three schemes are possible for the water intake in the lagoon: Marine Zone and Freshwater Zone (MW/FW); Marine Zone and Hypersaline Zone (MW/HW); or Freshwater Zone and Hypersaline Zone (FW/HW) (Figure 1). Water intakes should be close to the plant, both to minimise the impact of pumping losses on net power production and to avoid environmental impacts associated with some stressors (excavation) [52]. One option to avoid impacts from the excavation is to lay pipes on the surface and thus avoid the impacts associated with this stress factor. In the MW/FW and FW/HW schemes, the first problem is that the area where the fresh water emerges is within polygon SZAE1, and although ecotourism activities and the exploitation of flora and fauna can occur in this area with a permit, laying pipelines may not be compatible with the conservation laws of this polygon [31]. On the coasts of Yucatan, groundwater is used to supply fresh water to nearby settlements. Thus, the MW/FW and FW/HW schemes could be a possibility using wells or pumping to extract fresh or brackish water [53] in order to avoid negative effects on other processes and activities.
In the MW/HW scheme, which the plant is designed to use (Figure 4), hypersaline water would be taken from the hypersaline zone to the plant, and the pipeline would pass through parts of the SRZ1 polygon; however, low impact sustainable infrastructure would be used (Figure 4). Seawater would be brought to the plant directly from the sea, under the jurisdiction of the ZOFEMAT (Figure 4). Although another possibility for this region, where there is high radiation and evaporation, generating hypersaline conditions, would be to use seawater evaporation ponds. The volume of hypersaline water needed would therefore not be an impediment.
For the energy production expected, an inflow of 200 m3/h of both solutions is required [52]. These inflows will pass through a hydraulic network, which includes the set of pipes, pumps, and other accessories (elbows, valves, etc.) that will allow the entry and exit of the solutions. For a flow of this volume, 10-inch diameter pipes are required; hence, the impacts associated with excavation will be less. The hypersaline water must be piped to the plant; options to avoid the mangrove patches in its path exist, and special attention must be paid to the protected mangrove species (C. erectus, A. germinans, R. mangle and L. racemosa) [36]. For the discharge pipe, the same factors apply. These species are important because they provide shelter and protection areas for birds and various species of fish, and they deliver ecosystem services such as filtering water discharges from the mainland to the sea [54] and protection from wind and waves that prevents coastal erosion in an area that is also affected by hurricanes [55].
In the construction phase of the proposed design, no large-scale pipes would be installed within the lagoon; therefore, the loss of seagrasses, the release of pollutants and nutrients from the bottom of the lagoon, and the removal of organisms from the benthos would be practically nil, and the increase in turbidity due to the movement of sediments would be only temporary (weeks). Regarding the seagrass ecosystem, in areas with high salinity, seagrasses are not found; therefore, in the water intake in the hypersaline zone, there will be no damage to seagrasses [56,57]. In the hypersaline zone, the depths are 50 cm or less (Figure 2), and therefore, the hydraulic network here should be able to pump hypersaline water from different points to prevent it from drying out.
On the other hand, regarding the avoidance behaviour of birds due to construction noise (Table 1), emblematic species such as the flamingo (Phoenicopterus ruber, Table 1) would probably modify their distribution in the area only temporarily (weeks). In addition, with RED technology, no turbines will be used in the operation phase; hence, noise pollution would only occur during construction.

3.2. Operation Phase

In this phase, the impacts associated with water pumping and water pretreatment (Figure 3) are the first that should be considered. Pretreatment of the water intake is crucial for the operation of a RED system [58]. Such a system must ensure low-cost performance and effective sediment filtration [52]. In the RED plant of Afsluitdijk, the filtration system is of the drum and gravity type, and even with small intakes of very good quality water cartridges, filters can be used [52]. The impacts associated with water pumping and pretreatment are related to the amount of fresh water and hypersaline water that will be taken from the system and pass through it. These impacts include changes to natural watercourses, as well as changes in the nutrients and salinity of the water. Possibly, and depending on the intensity, these alterations may affect native species and natural ecosystems. For instance, it is known that changes in salinity alter the reproductive and feeding behaviour of flamingos and horseshoe crabs (Limulus polyphemus) [59].
Another impact is the possible decrease in phytoplankton biomass retained in the filtration system. The latter is a concern at the Afsluitdijk pilot plant because large quantities of plankton, fish, and larvae must be filtered, which has ecological implications and may also have economic implications [60]. Since the biomass of microorganisms at the base of food chains is affected by this, it can lead to imbalances in the food chain and local fisheries [23,48].
Detailed hydrological studies are therefore needed to determine the amount of water that can be extracted from the lagoon and how much it can be altered without generating the above-mentioned impacts. In the case of the Afsluitdijk pilot plant, the intakes in the sea and in the lagoon area of 200 m3/h, assuming a technical potential of 1 MJ/m3 of seawater and freshwater, can produce up to 50 kW net power output [52]. In La Carbonera, taking the concentrated solution from the lagoon (hypersaline water) counteracts the effects on the biomass of microorganisms to a certain extent, since the biomass is reduced due to the hypersalinity of the area [59]. The diluted solution could be taken from wells on the coast, in which case there would be no phytoplankton, due to the lack of light. On the other hand, it could be taken directly from the sea, and this would have fewer microorganisms than that of the estuarine and marine zones of the lagoon [61].
Another stress factor is the disposal of the final by-product of the RED process—the brackish water. Even if the intended scheme is MW/HW, the water mix would have a similar or higher salinity than seawater. The change in salinity of the effluent must be calculated in the laboratory. The effluent must be discharged in an appropriate area, at the appropriate time, and the dispersion of this effluent by the hydrodynamic actions of the system should not alter the natural salinity patterns in that ecosystem [32,33].
Depending on the volume of the water, pump diffusers may be needed (alternating or slanted) in the hydraulic network, to distribute the flows in different directions within the lagoon, or into the sea [62]. The discharge of water used may not induce negative impacts at sites where the hydrodynamic performance and salinity concentrations are known prior to the design for the effluent flow. This is so at sites where there has been salinity deterioration as a result of previous anthropogenic activities.
The change in salinity is only one of the environmental conditions responsible for the variety and abundance of fish reported for this lagoon (Table 1) [39]. In addition, salinity indirectly affects the distribution of species through its role in water density and the resulting hydrodynamics [63].
The spatial/temporal variation of water masses and their salinity is important for the distribution of organisms, especially of fish, which only live under certain salinity ranges, according to their tolerance to this parameter [64,65,66]. This is important for the distribution of various marine species of commercial interest (Table 1). Discharging a saline effluent into the lagoon, of marine salinity or slightly higher, in the hypersaline zone, will lower the salinity in this zone and thus limit the amount of hypersaline water available for power generation. In consequence, the impact on different species may be significant.
It is important to mention that there are many characteristics that make this an environment that harbours great diversity in fishes, but high salinities have been associated with a lower richness and diversity of fish [67]. Thus, for species distributed in marine/estuarine environments, such as S. testudineus, S. notata, H. clupeola, T. falcatus, L. griseus, L. synagris, F. polyommus, A. probatocephalus, E. gula, E. argenteus, M. curema, M. trichodon, H. unifasciatus, C. atherinoides and A. narinari, (Table 1) [39], a potential decrease in salinity in the hypersaline zone would alter the extent of their distribution areas.
However, to avoid changes in salinity and resulting limitations in resources, it is better to discharge this effluent into the sea since, being saline and of a small volume, it will not have the same effects as if it were brine [68]. On the other hand, stressors such as the accidental release of cleaning and maintenance chemicals and electrolyte solutions must be regulated against any facility handling hazardous chemicals.
Both in the pretreatment of solutions and in the cleaning of membranes and facilities, products such as chlorine are used, which can be toxic to the environment [23,48]. Usually, chlorine is used to avoid degradation of the membranes caused by biological growth in them. There is evidence that even small amounts of chlorine (e.g., 0.1 ppm) can have ecological impacts which induce a significant reduction in the productivity of dragged phytoplankton and species diversity [23]. Similarly, electrolyte solutions should be handled with caution [69]. The electrolyte solutions are stored in the electrode compartment which also contains the electrodes and is sealed with membranes that generally have special properties to ensure the confinement of the electrolyte, recirculating it in a closed circuit [70]. There are reports of the toxicity of this type of element [23], but there is not much information on the toxic gases or compounds that are generated in the redox process within such a compartment (depending on the redox couple and the electrolyte used). Furthermore, in these compartments, some instability in pH control sometimes occurs since anion exchange membranes have a non-negligible proton transport number. This may allow an increase in the pH of the electrode solution, accompanied by a decrease in the pH of the effluent, and this may not be environmentally acceptable if it is too high [70]. Although the pH of the effluent would only change in the event of an accidental release, it is important to note that this parameter is an indicator of water quality. It affects the toxicity of certain compounds, such as ammonia, by controlling their ionisation, as well as the bioavailability of certain pollutants, such as heavy metals. For example, water with a pH range of 6.5 to 8.5 is suitable for many biological systems. Values of over 9.0 and lower than 5.8 limit the development and physiology of aquatic organisms [71].
Finally, it is worth noting the positive impacts that an SGE plant could have on La Carbonera. In the operational phase, the pipes will provide new spaces for colonization (bioincrustation) by sessile species [1]. These structures offer heterogeneity to the habitat and appropriate surfaces for algae and sessile organisms to colonise, especially on the muddy bottom. Fish and other invertebrates will be attracted by the hard surface, the shade, the changes in turbulence, the small spaces, and eventually, by the availability of food sources [48,72]. However, this type of infrastructure can also encourage the establishment of non-native species, invasive species, and blooms of harmful algae; therefore, the extent and composition of the colonisation are difficult to predict [73,74]. In the case of La Carbonera, pipes in the hypersaline zones would be easily colonised in the short term by barnacles, which live in the carbonated structures which stick to the surfaces and may cause deterioration. For this reason, their colonisation should be treated cautiously since they also damage RED membranes, encouraging the proliferation of microorganisms which impede the free passage of water or ions and thereby reduce the functionality of the system [75]. Although the production of 50 kW of electric energy from renewable sources is by no means a technological challenge, this work aims to provide electric power using the best technologies available, producing the smallest possible footprint, in harmony with the land use of this area (i.e., [76]).
With the present technological maturity of SGE techniques, these objectives do not yet yield low costs. Firstly, because the cost of the energy depends on the establishment of the market and industry; if the technological development is successful, the manufacturing of the parts will become cheaper. In the meantime, support from public funding is to be expected [77]. On the other hand, when environmental and social aspects are prioritised, a cost–benefit analysis based only on economic variables is not sufficient [78,79]. If the community face expensive-energy versus no-energy, their decision will be controversial.
For this specific case, the goal is not to urbanise the area or provide services that will promote urbanisation. The goal is to offer services that may assist environmental protection and conservation activities held in La Carbonera Lagoon and its surroundings where only low-density ecotourism is allowed. In this sense, a pilot plant using emergent technology is both suitable and affordable. Other technologies may not be feasible at this site. For example, although an established solar energy industry exists, the installation of solar panels may increase the air temperature around them, which is undesirable in environmentally sensitive areas. Additionally, a strategy for energy storage would be needed, thus increasing the final cost. There are similar disadvantages for wind energy, with additional construction difficulties [21]. Thus, an SGE plant, with the proposed additional facilities, seems to be a good strategy for promoting education, environmental conservation, and technology development.

3.3. Decommissioning Phase

In this phase, few impacts are expected. A RED plant built on palafittes should not require large-scale activity using heavy machinery. In the case of the pipes that have been colonised by algae and sessile organisms, their removal will eliminate this artificial habitat and also the organisms that installed themselves there. The soil is not expected to be severely impacted by the type of foundations used. On the other hand, the noise associated with demolition may temporarily affect the behaviour of birds and fish. Finally, the infrastructure of the proposed ecotourism centre should not be demolished since these facilities offer attractive spaces for tourism and assist in the conservation of species in the area.

4. Conclusions

A preliminary environmental assessment of the potential impacts of a 50 kW net output RED power plant using SGE on the coastal lagoon of La Carbonera was carried out. Many impacts depend on the size and location of the SGE plant and the water intake or on the technology to be implemented. In this case, a small-scale SGE power plant, using the RED technology, combined with an ecotourism centre, would provide renewable energy and protection of resources for the lagoon system and the nearby area around it, as well as providing well-paid jobs for local people that may eventually encourage an improvement in the care of coastal ecosystems.
Although several water schemes can be used in this ecosystem (FW/MW, FW/HW, and MW/HW), everything will depend on the availability of saline water. In both cases, there are alternatives; for instance, to use the dilute solution (FW) through wells on the coast, and the concentrated solution (HW) directly from the lagoon (according to hydrological studies) or through marine water evaporation ponds.
In terms of the potential impacts, the most concerning are the change in the volume of water in the lagoon and the disposal of the final effluent. While many negative potential responses could be expected, if the EIA covers information on the biotic and abiotic characteristics of the ecosystem at a given point in time, in addition to the site characteristics, many of these impacts could be minimised or avoided.
While the study in [22] suggested that most of the impacts due to the implementation of SGE occur in the construction phase, this study shows that although the impacts then may be very evident, even with mitigation measures, the ecosystems in La Carbonera could recover from these temporary effects. More damaging to the ecosystems would be the permanent and constant changes in characteristics which an SGE plant would induce, such as in the hydrodynamics (changes in water flows or volume) and salinity gradients. Therefore, it must be taken into account that since they are highly variable ecosystems that have close hydrological connectivity with the surrounding systems, any modification can have implications for neighbouring systems.
From the results of the Receptors and Responses analysis, the importance of monitoring these features during and after the construction phase must be underlined [79]. Many of the Receptors analysed are also present in other systems with potential for SGE. Even though methodologies for their characterisation already exist for most of them, it is still difficult to find quantitative criteria which demonstrate how positive or negative these Receptors are when SGE technology is applied.
Even so, this work offers the first attempt to evaluate the potential changes induced by SGE plants. This analysis for La Carbonera is important at the present time even though the technology discussed is as yet untested at a large scale, and there are no plants using it in Mexico. Small pilot plants, such as that suggested here, could offer insights for successful larger developments in the future.
Finally, although this system is healthy at present, an EIA would serve to minimise negative impacts. In this way, the benefits of SGE, zero greenhouse gas emissions, and the use of renewable sources could be successfully harnessed at La Carbonera.

Author Contributions

Conceptualisation, E.M.-C. and R.S.; methodology, E.M.-C. and M.L.M.; software, E.M.-C.; validation, R.S., C.E., M.L.M., and E.M.; formal analysis, E.M.-C. and R.S.; investigation, E.M.-C.; writing—original draft preparation, E.M.-C. and R.S.; writing—review and editing, E.M.-C., R.S., C.E., M.L.M., and E.M.; visualisation, E.M.-C. and R.S.; supervision, C.E., M.L.M., and E.M.; project administration, R.S.; All authors have read and agreed to the published version of the manuscript.

Funding

This research was funded by the CONACYT-SENER-Sustentabilidad Energética project: FSE-2014-06-249795 Centro Mexicano de Innovación en Energía del Océano (CEMIE-Océano).

Informed Consent Statement

Not applicable.

Data Availability Statement

Data sharing not applicable. No new data were created or analysed in this study. Data sharing is not applicable to this article.

Acknowledgments

We are grateful to Jill Taylor for the English revision, and to Roberto Rivera for support in managing Autocad. The authors thank the Centro Mexicano de Innovación en Energía del Océano (CEMIEOcéano) for providing support in the research in the CONACYT-SENER-Sustentabilidad Energética project: FSE-2014-06-249795 Centro Mexicano de Innovación en Energía del Océano (CEMIE-Océano). Finally, thanks to the Civil Engineering Postgraduate of the UNAM and CONACYT for the grant awarded for the development of this project.

Conflicts of Interest

The authors declare no conflict of interest.

Appendix A

Appendix A.1. Precipitation, Evaporation, and Atmospheric Temperature

The heaviest rains, associated with tropical systems in the peninsula, occur between June and October. In the winter, from November to February, it is also common for rain associated with the passing of cold fronts, or ‘Nortes’. The annual precipitation varies between 444 mm and 1290 mm and is greater north to south, and east to west, in the state of Yucatan. The dry season, March to June, has very little rain, with high levels of solar radiation which generate extremely high temperatures [80].
As is typical in tropical areas, the evaporation exceeds the precipitation (approximately 1800 and 1290 mm/year, respectively). The atmospheric temperature has a defined annual oscillation, with maximums in summer. The annual average temperature is 26 °C, the maximum monthly average is around 36 °C, in May, and the minimum monthly average is 16 °C, in January [35,81].

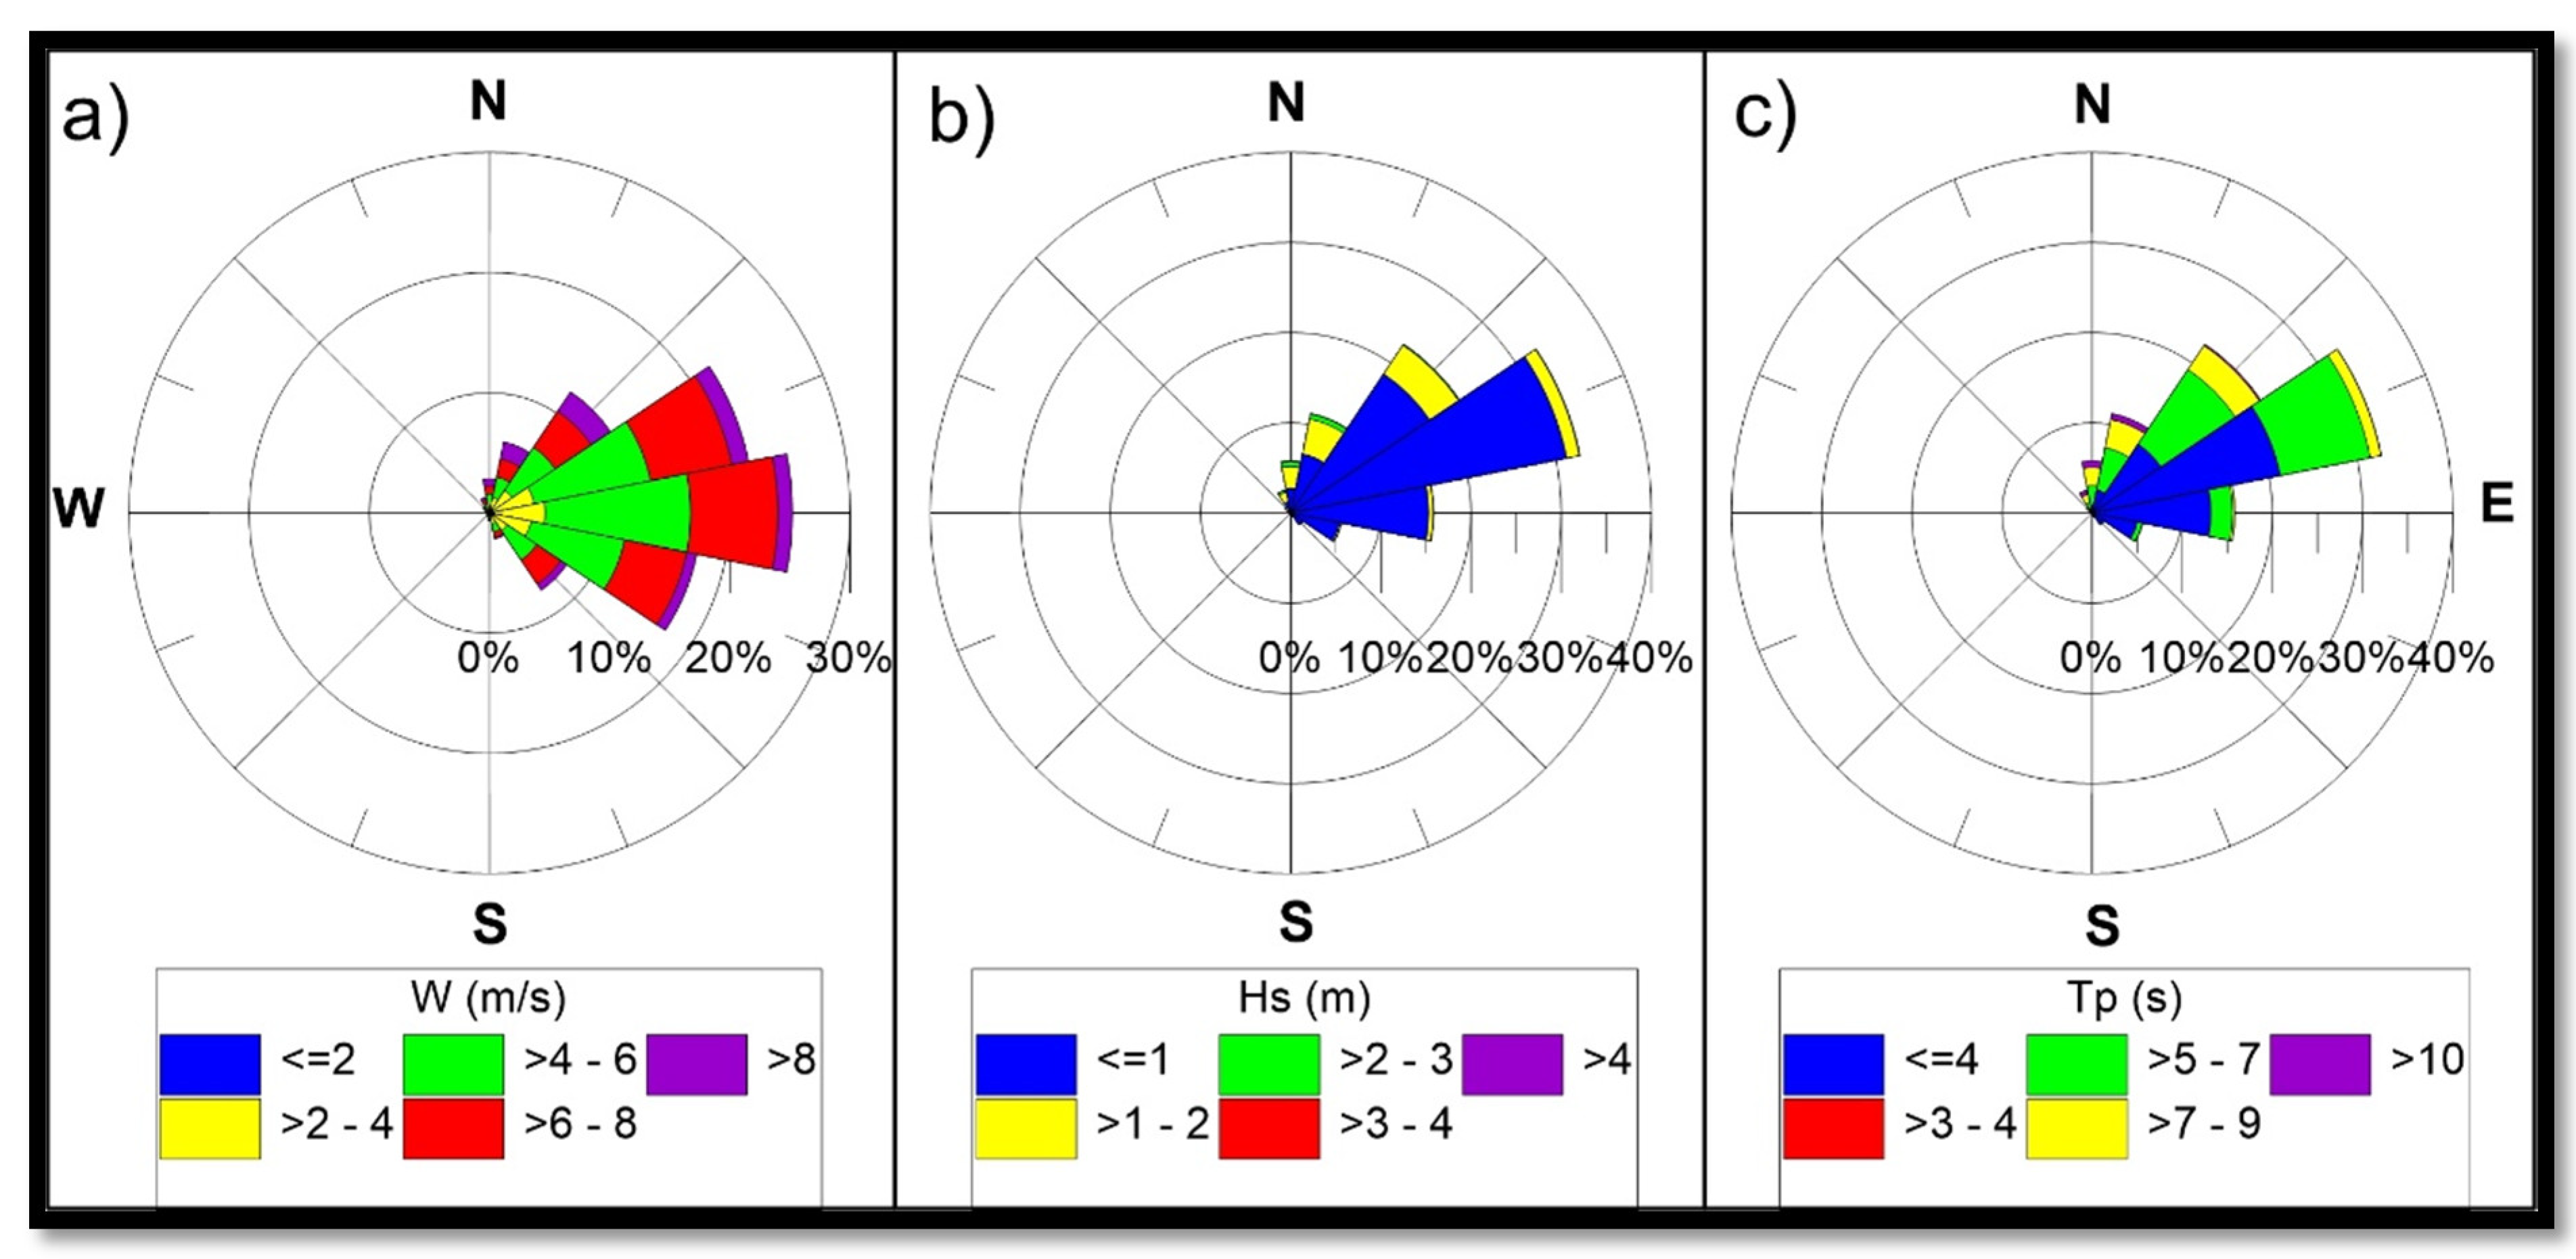
Appendix A.2. Tides, Winds, and Waves

According to [82], the tides are diurnal, with higher high water = 0.590 m; mean high water = 0.461 m; mean water level = 0.326 m; mean low water = 0.238 m, and mean lower low water = 0.000 m.
As explained by [83], winds in the Yucatan Peninsula are mostly Trade winds, from the east and northeast, locally modified by a marked system of coastal breezes, with sustained averages of 5.5 m/s. The waves are of low energy, with a mean annual significant wave height of Hs = 0.78 m, mean peak period Tp = 4.6 s, and a predominant northeast direction (see Figure A1).
Figure A1. Roses showing the direction and magnitude of (a) wind velocity, (b) wave height, and (c) peak period. Reanalysis data from [83].
Energies 14 03252 g0a1
In addition, the region has atmospheric systems of short duration which modify these patterns: in summer there are tropical cyclones, which can become hurricanes, with sustained winds of up to 44 m/s, Hs > 10 m, and Tp > 12 s, and in winter, strong ‘Nortes’ can have winds of up to 15 m/s, Hs = 4.5 m, and Tp = 8.7 s [83].

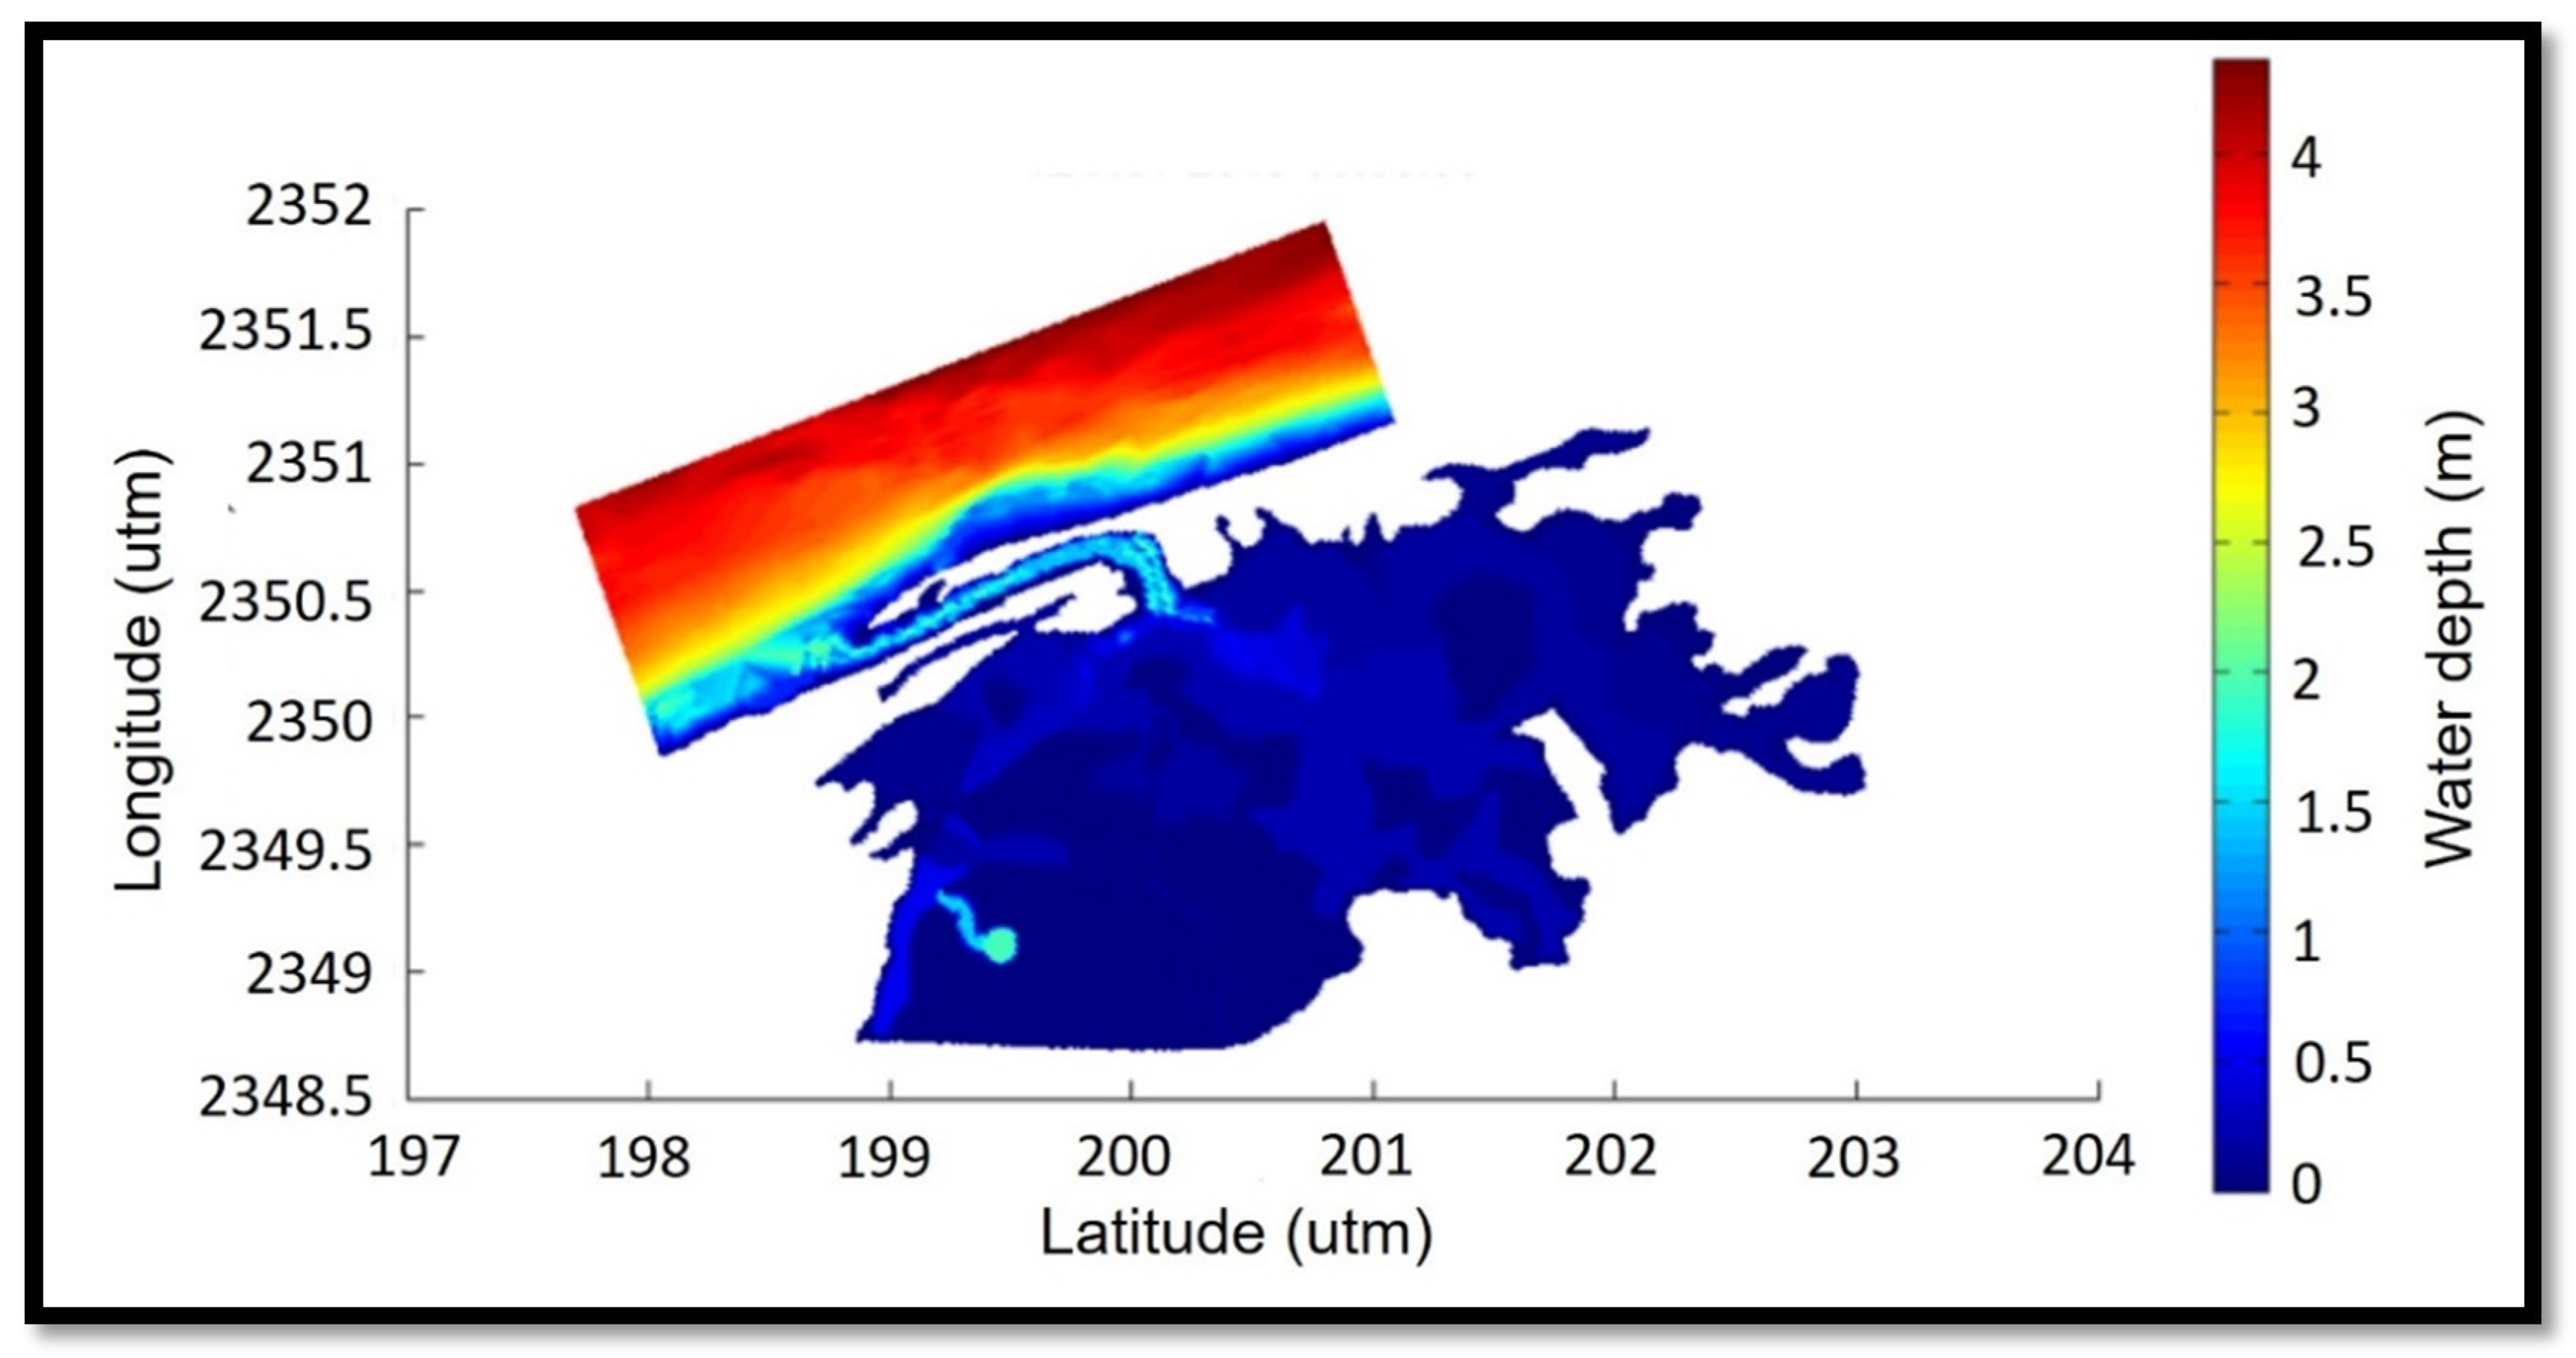
Appendix A.3. Bathymetry

The inlet linking the lagoon with the sea has depths of 1.5–2 m, the shallow interior is only 0.5 m deep, with the exception of the channel that links the freshwater inflow area with the lagoon (southwest), where depths are 2 m close to the inflow, and 0.5 m towards the lagoon interior (Figure A2). The depths in the marine area show the shallow, extensive nature of the continental shelf off Yucatan.
Figure A2. Bathymetry of the lagoon of La Carbonera and nearby marine area [33].
Energies 14 03252 g0a2

Appendix A.4. Hydrogeological Characteristics

La Carbonera is part of the karst system of the Peninsula of Yucatan (Batllori-Sampedro et al., 2006). In the lagoon, three types of sediment lie on top of the karst strata: sand, rocky sediment, and mud [24]. The orientation of the sandy beaches on the coast is predominantly north–northwest. The mean grain diameter is 0.2–0.5 mm [84,85].
The main hydrological feature of the coastal systems of the peninsula es that freshwater emerges from underground springs or seeps into lagoons and wetlands [86]. Once in the lagoon systems, it begins to mix and patterns of salinity and temperature develop between the fresh water and the water of the lagoon, producing a complex thermohaline circulation system [27]. Such is the case with the inflow in the southwest of the lagoon, where an estuarine gradient is produced.

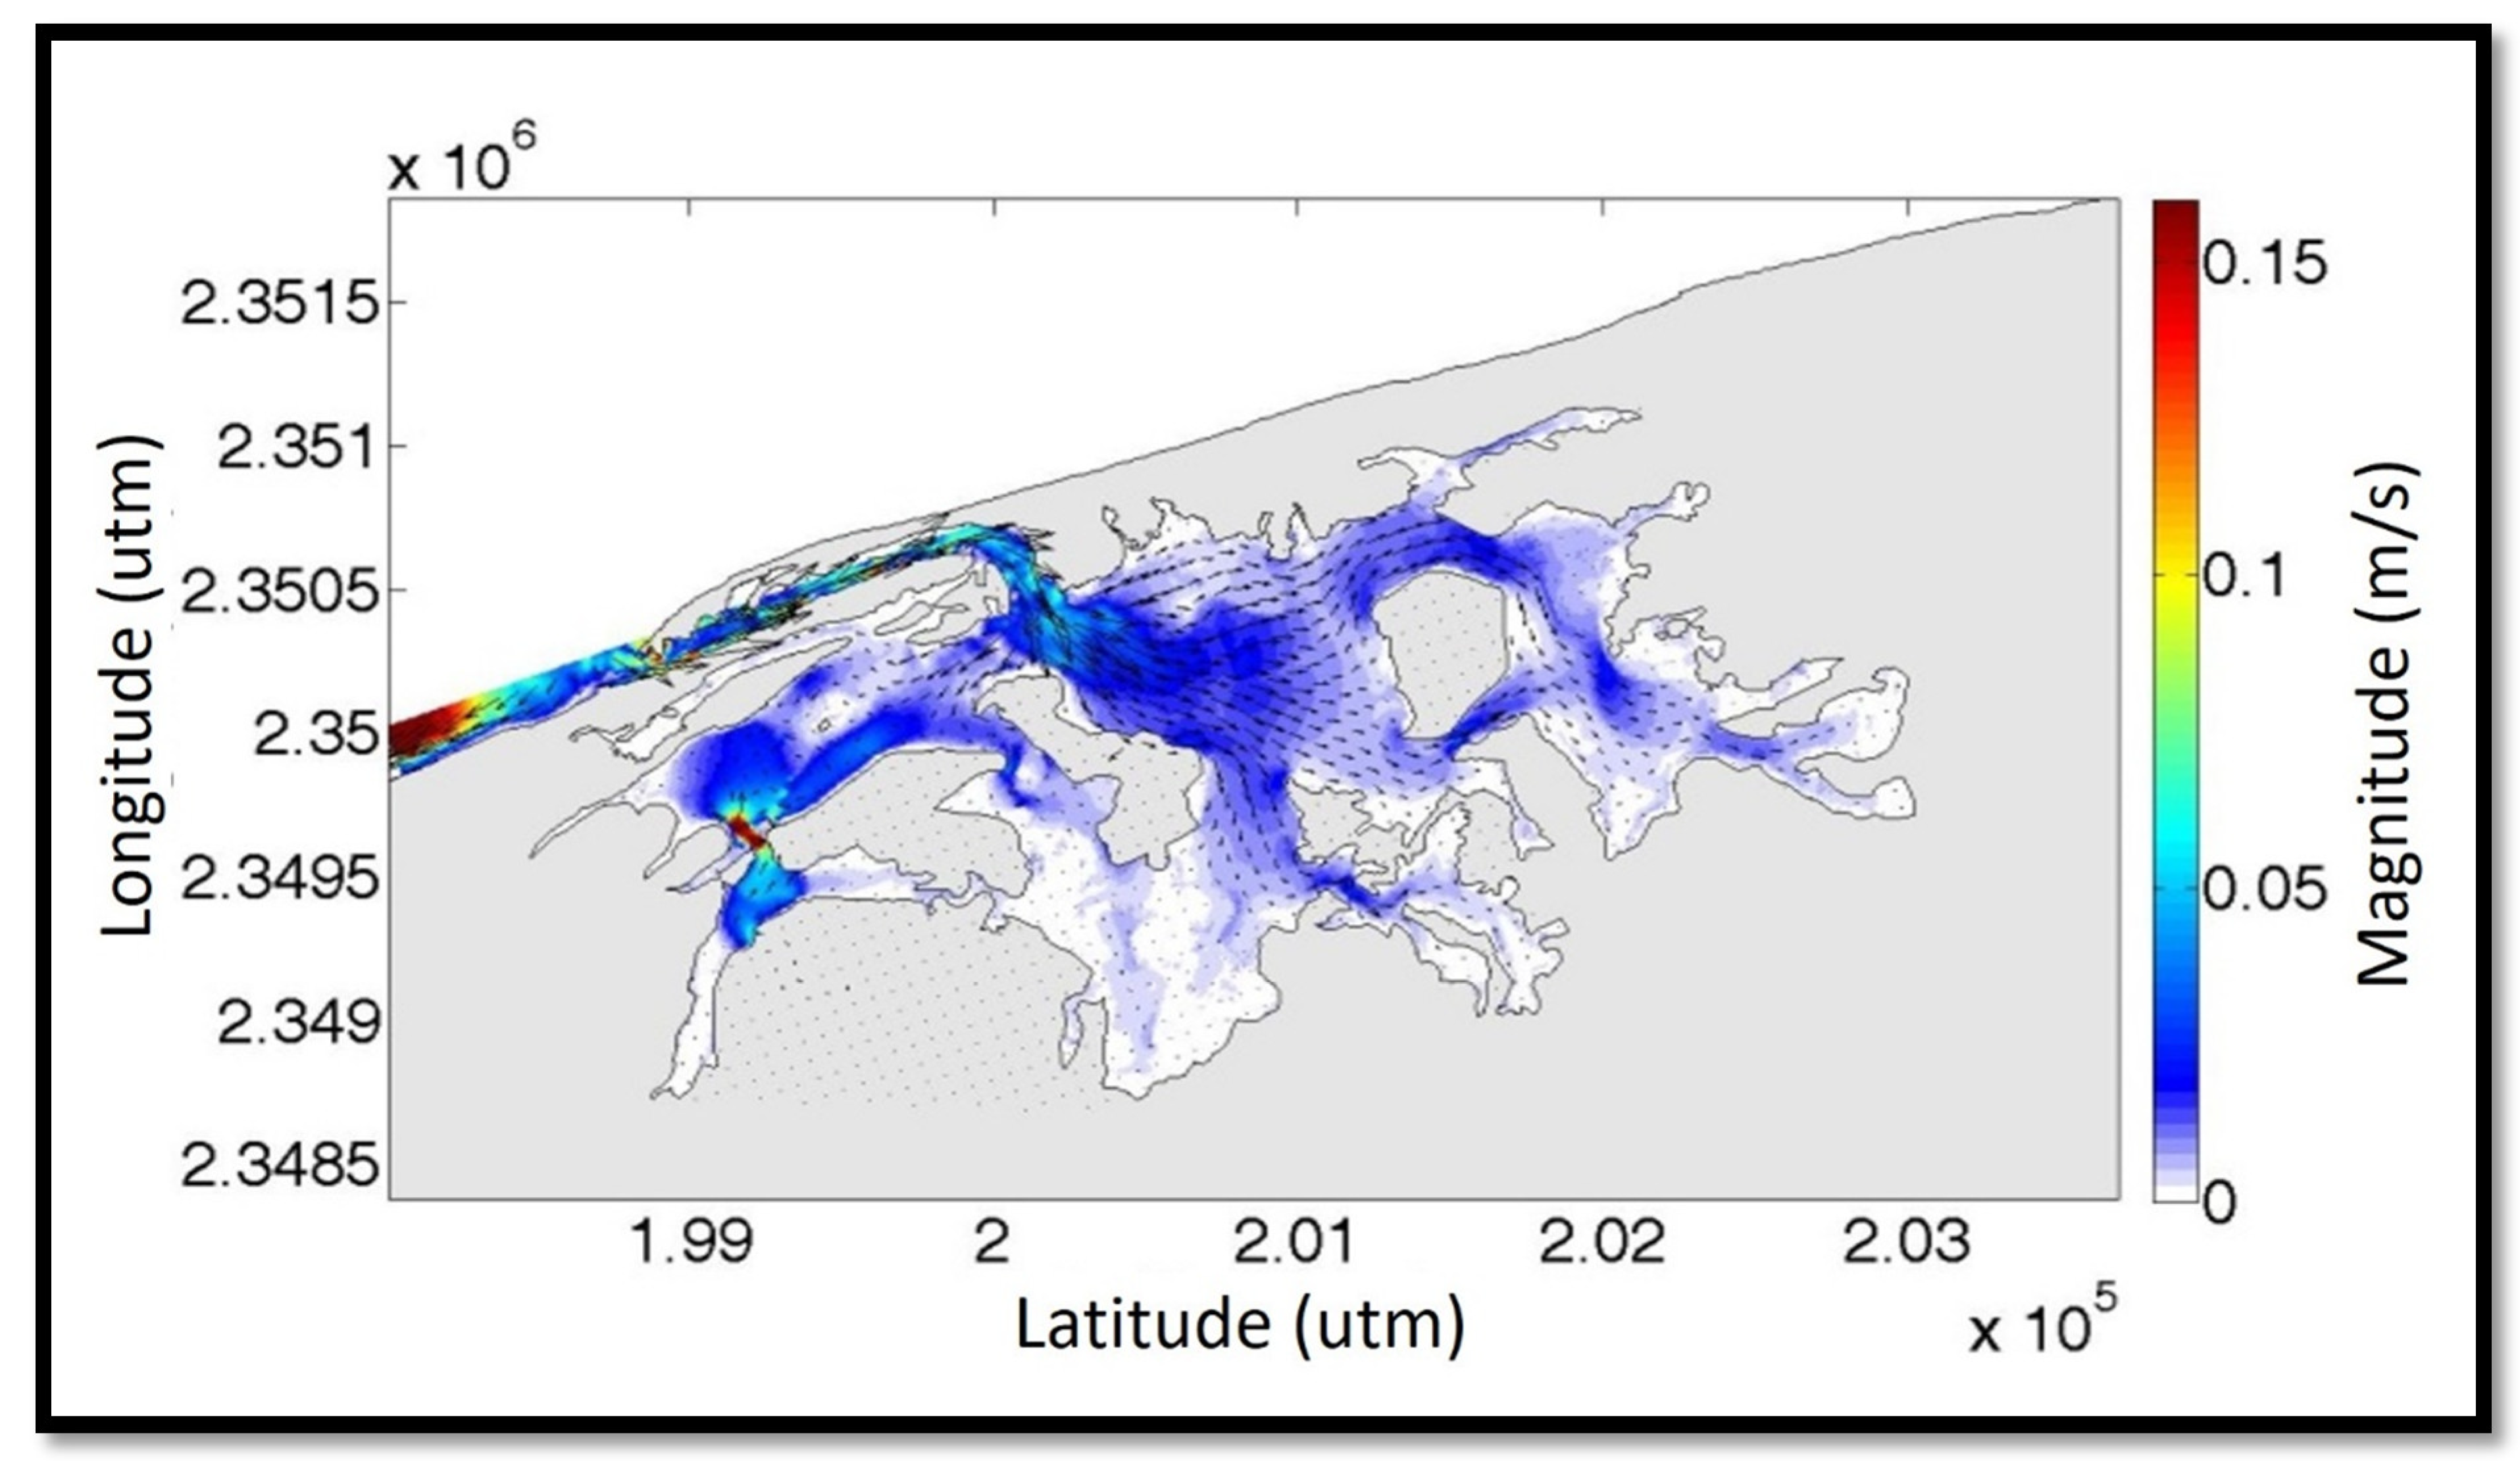
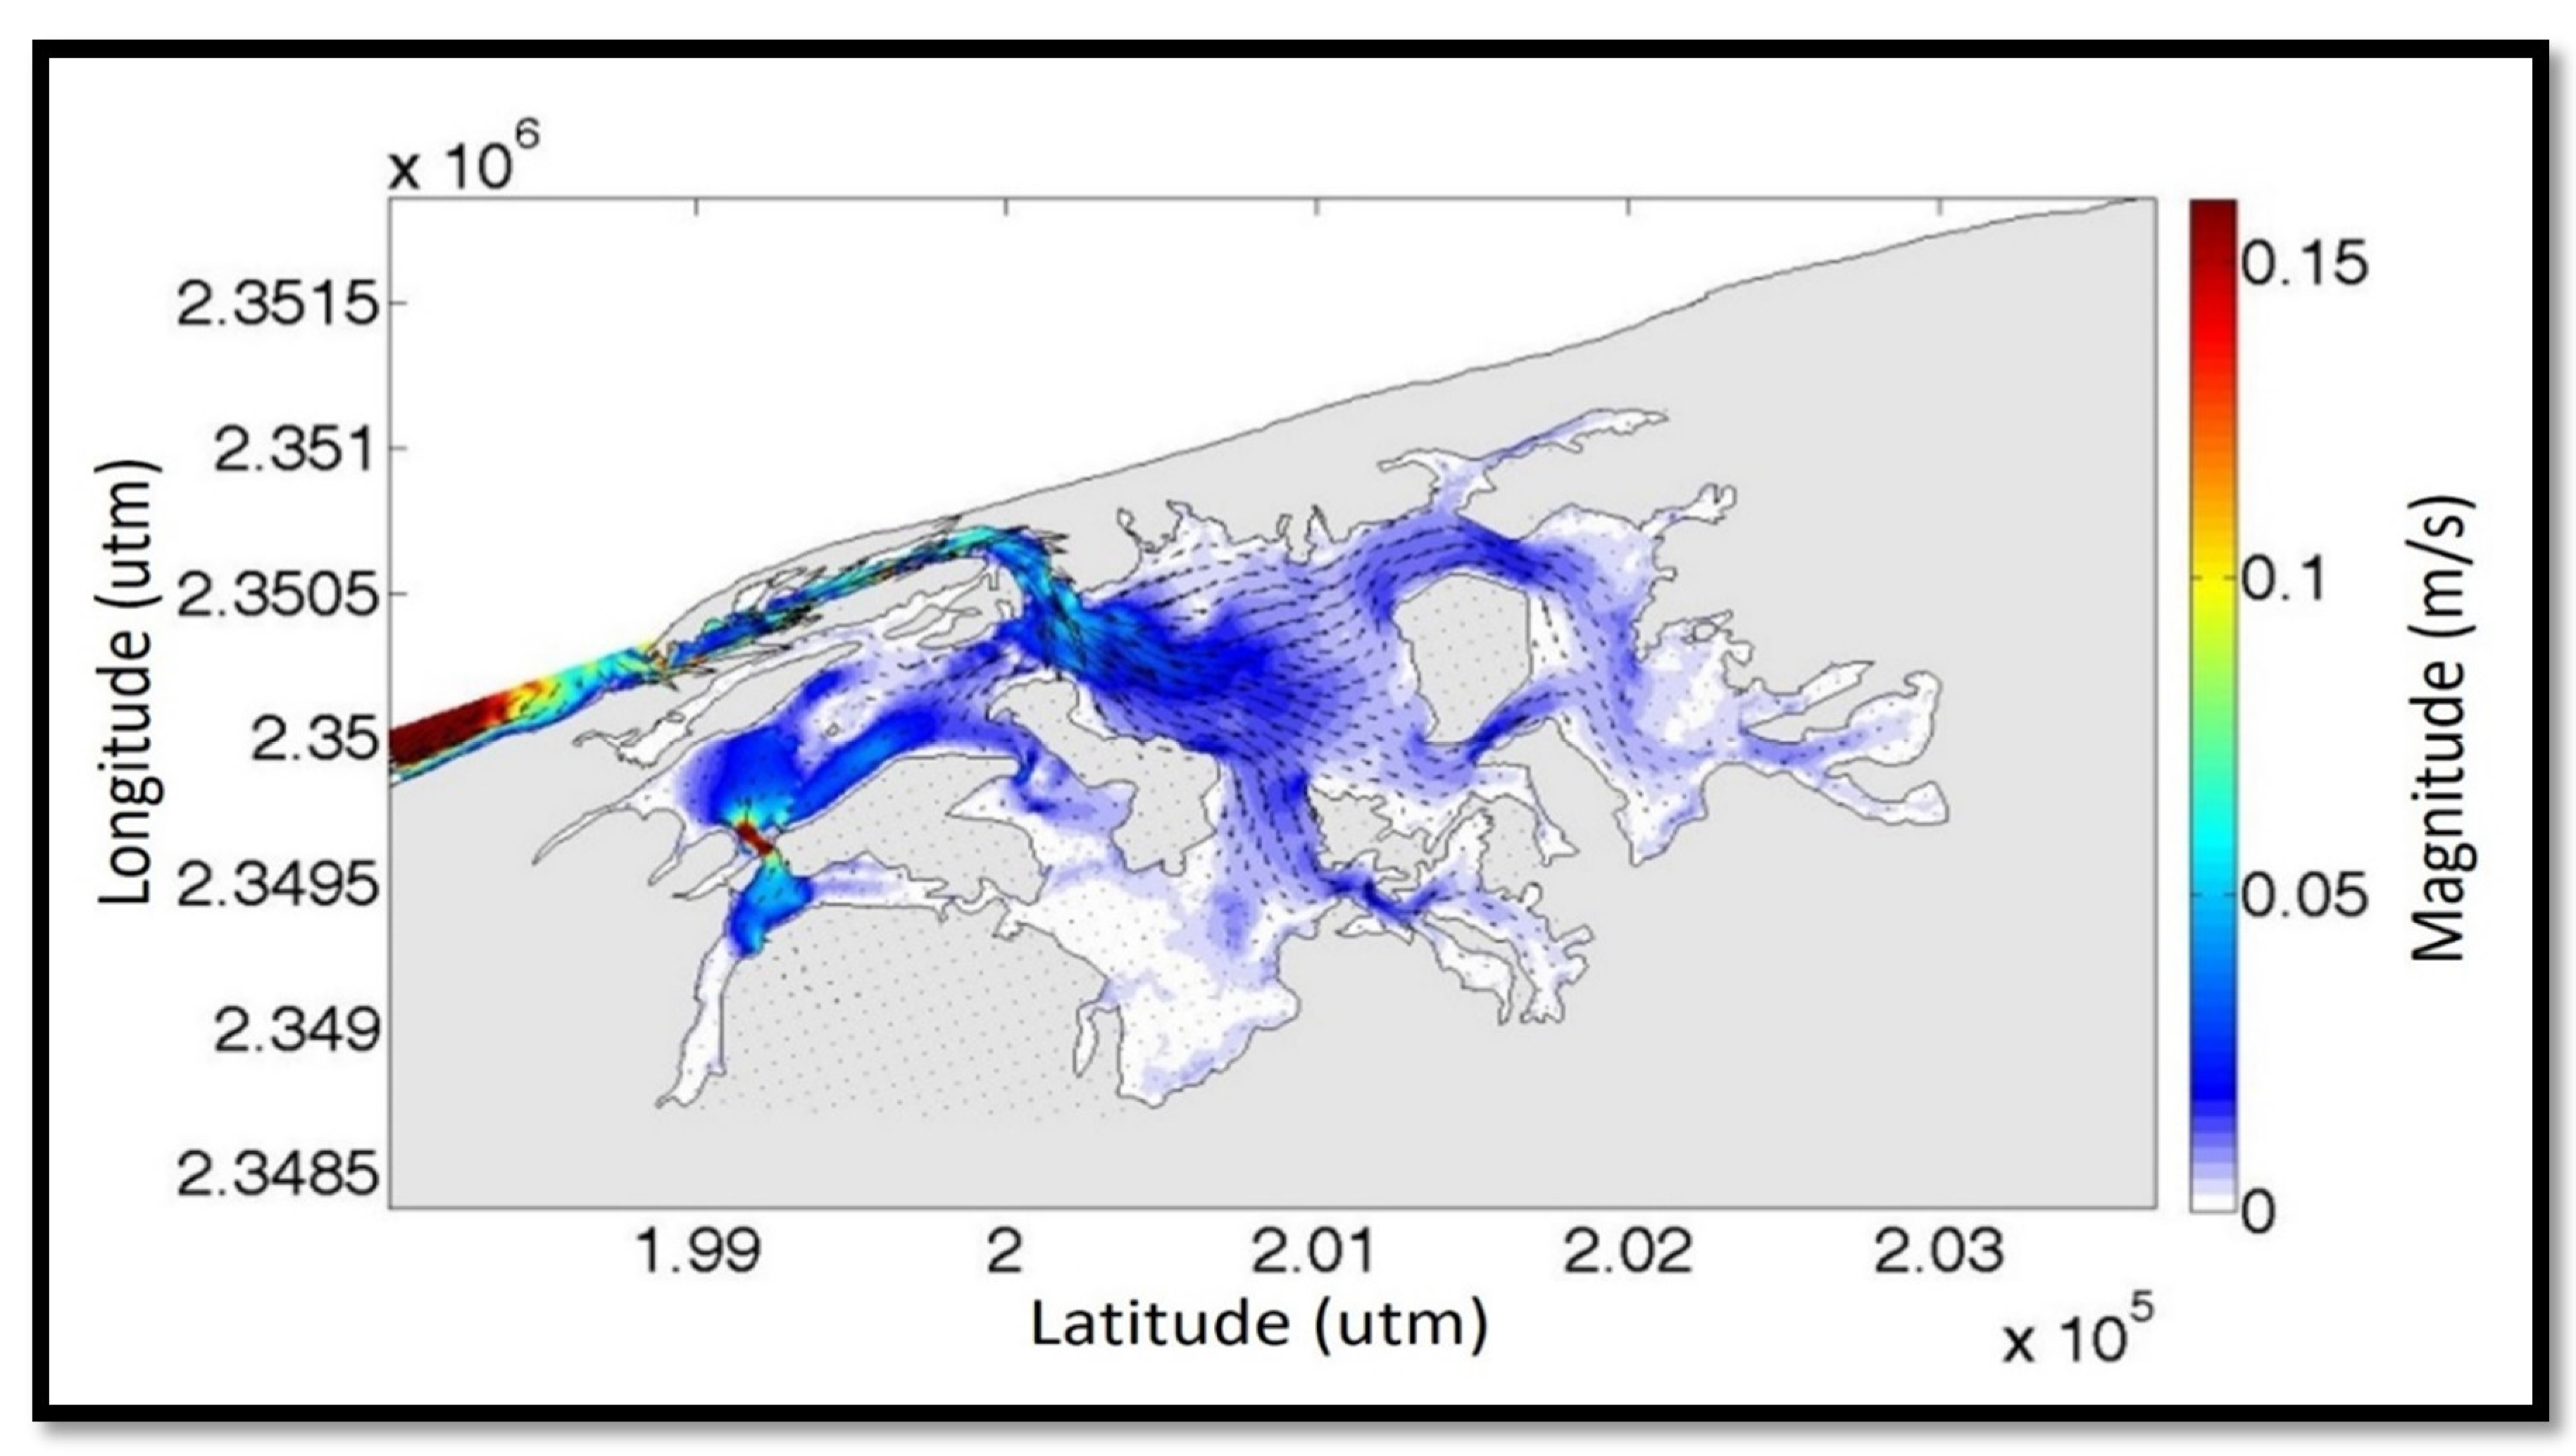
Appendix A.5. Hydrodynamics

The main hydrodynamic drivers are the tides, the predominant winds of the region (Trade Winds, sea breezes, and Nortes). The study in [33] reported that inside the system, the residual currents are around 0.05 m/s, both when influenced by the local breezes as well as the winds (Figure A3 and Figure A4). As can be seen, the tides entering through the inlet spread east, west, and southwards in the lagoon system (Figure A3). In the centre, south, and east of the lagoon, there are mixing zones, with higher values (close to 0.2 m/s) which are greater during ‘Nortes’ (Figure A4).
Figure A3. Example of the residual circulation pattern (m/s) during a spring tide with sea breeze forcing [33].
Energies 14 03252 g0a3
Figure A4. Example of the residual circulation pattern (m/s) during a spring tide with forcing from NE winds [33].
Energies 14 03252 g0a4

Appendix A.6. Salinity Patterns

The general patterns of salinity in the lagoon of La Carbonera are seen in Figure A5. During a tidal cycle, these patterns are very dynamic [33]. At high and low tides the estuarine, marine, and hiperhaline zones move, due to the influence of the tides and dominant winds, as well as the inflow from the underground spring, which can increase or decrease the salinity in the lagoon. At the highest tide level, and under the effects of strong winds, the seawater can move further into the hiperhaline zone. At low tide, brackish water can reach the mouth of the lagoon [33].
Figure A5. Example of salinity patterns in the La Carbonera lagoon. The hiperhaline zone can reach levels of over 80 ups [33].
Energies 14 03252 g0a5

References

  1. Mendoza, E.; Lithgow, D.; Flores, P.; Felix, A.; Simas, T.; Silva, R. A framework to evaluate the environmental impact of OCEAN energy devices. Renew. Sustain. Energy Rev. 2019, 112, 440–449. [Google Scholar] [CrossRef]
  2. Zhao, S.; Zou, L.; Tang, C.Y.; Mulcahy, D. Recent developments in forward osmosis: Opportunities and challenges. J. Membr. Sci. 2012, 396, 1–21. [Google Scholar] [CrossRef]
  3. Copping, A.; Sather, N.; Hanna, L.; Whiting, J.; Zydlewski, G.; Staines, G.; Gill, A.; Hutchison, I.; O’Hagan, A.; Simas, T.; et al. Annex IV State of the Science Report: Environmental Effects of Marine Renewable Energy Development Around the World; TETHYS: Richland, WA, USA, 2016; Available online: https://tethys.pnnl.gov/publications/state-of-the-science-2016 (accessed on 25 March 2017).
  4. Edenhofer, O.; Seyboth, K.; Creutzig, F.; Schlömer, S. On the Sustainability of Renewable Energy Sources. Ann. Rev. Environ. Resour. 2013, 38, 169–200. [Google Scholar] [CrossRef] [Green Version]
  5. Alvarez-Silva, O.A.; Osorio, A.F.; Winter, C. Practical global salinity gradient energy potential. Renew. Sustain. Energy Rev. 2016, 60, 1387–1395. [Google Scholar] [CrossRef]
  6. Jia, Z.; Wang, B.; Song, S.; Fan, Y. Blue energy: Current technologies for sustainable power generation from water salinity gradient. Renew. Sustain. Energy Rev. 2014, 31, 91–100. [Google Scholar] [CrossRef]
  7. Ahmad, M.; Williams, P. Application of salinity gradient power for brines disposal and energy utilisation. Desalin. Water Treat. 2009, 10, 220–228. [Google Scholar] [CrossRef] [Green Version]
  8. Tedesco, M.; Cipollina, A.; Tamburini, A.; van Baak, W.; Micale, G. Modelling the Reverse ElectroDialysis process with seawater and concentrated brines. Desalin. Water Treat. 2012, 49, 404–424. [Google Scholar] [CrossRef] [Green Version]
  9. Zhu, Y.; Wang, W.; Cai, B.; Hao, J.; Xia, R. The salinity gradient power generating system integrated into the seawater desalination system. IOP Conf. Ser. Earth Environ. Sci. 2017, 52, 012067. [Google Scholar] [CrossRef]
  10. Ye, M.; Pasta, M.; Xie, X.; Cui, Y.; Criddle, C.S. Performance of a mixing entropy battery alternately flushed with wastewater effluent and seawater for recovery of salinity-gradient energy. Energy Environ. Sci. 2014, 7, 2295–2300. [Google Scholar] [CrossRef]
  11. Yip, N.Y.; Brogioli, D.; Hamelers, H.V.M.; Nijmeijer, K. Salinity Gradients for Sustainable Energy: Primer, Progress, and Prospects. Environ. Sci. Technol. 2016, 50, 12072–12094. [Google Scholar] [CrossRef] [PubMed]
  12. Berrouche, Y.; Pillay, P. Determination of salinity gradient power potential in Québec, Canada. J. Renew. Sustain. Energy 2012, 4, 053113. [Google Scholar] [CrossRef]
  13. Micale, G.; Cipollina, A.; Tamburini, A. 1—Salinity gradient energy. In Sustainability Energy from Salinity Gradients; Cipollina, A., Micale, G., Eds.; Woodhead Publishing: Sawston, UK, 2016; pp. 1–17. [Google Scholar] [CrossRef]
  14. Sanvik, S.O.; Skihagen, S.E. Status of Technologies for Harnessing Salinity Power and the Current Osmotic Power Activities. Article to the 2008 Annual Report of the International Energy Agency Implementing Agreement on Ocean Energy Systems Annex I: Review, Exchange and Dissemination of Information on Ocean Energy Systems. 2008. Available online: http://www.iea-oceans.org/publications.asp?id=1 (accessed on 28 May 2017).
  15. IEA. Key World Energy Statitics; International Energy Agency: Paris, France, 2013; p. 82. [Google Scholar]
  16. Alvarez-Silva, O.; Osorio, A.F. Salinity gradient energy potential in Colombia considering site specific constraints. Renew. Energy 2015, 74, 737–748. [Google Scholar] [CrossRef]
  17. Emdadi, A.; Gikas, P.; Farazaki, M.; Emami, Y. Salinity gradient energy potential at the hyper saline Urmia Lake—ZarrinehRud River system in Iran. Renew. Energy 2016, 86, 154–162. [Google Scholar] [CrossRef]
  18. Karunarathne, H.D.S.S.; Walpalage, S. Applicability of Pressure Retarded Osmosis Power Generation Technology in Sri Lanka. Energy Procedia 2013, 34, 211–217. [Google Scholar] [CrossRef] [Green Version]
  19. Ortega, S.; Stenzel, P.; Alvarez-Silva, O.; Osorio, A.F. Site-specific potential analysis for pressure retarded osmosis (PRO) power plants—The León River example. Renew. Energy 2014, 68, 466–474. [Google Scholar] [CrossRef]
  20. HydroQuebec. A Renewable Energy Option: Osmotic Power; HydroQuebec: Montreal, QC, Canada, 2015; ISBN 978-2-550-72233-5. [Google Scholar]
  21. Martínez, M.L.; Vázquez, G.; Pérez-Maqueo, O.; Silva, R.; Moreno-Casasasola, P.; Lopez-Portillo, J.; Mcgregor, I.; Hecke, L.G.; Hernández-Santana, J.; García-Franco, J.; et al. A systemic view of potential environmental impacts of ocean energy production. Renew. Sustain. Energy Rev. 2021, Subbmitted. [Google Scholar]
  22. Seyfried, C.; Palko, H.; Dubbs, L. Potential local environmental impacts of salinity gradient energy: A review. Renew. Sustain. Energy Rev. 2019, 102, 111–120. [Google Scholar] [CrossRef]
  23. Papapetrou, M.; Kumpavat, K. 10—Environmental aspects and economics of salinity gradient power (SGP) processes. In Sustainability Energy from Salinity Gradients; Cipollina, A., Micale, G., Eds.; Woodhead Publishing: Sawston, UK, 2016; pp. 315–335. [Google Scholar] [CrossRef]
  24. Bonilla-Gómez, J.L.; Badillo-Alemán, M.; Gallardo-Torres, A.; Chiappa-Carrara, X. Temporal variation, growth and natural mortality of two species of mojarras (Perciformes Gerreidae) from a tropical coastal lagoon: La Carbonera, Yucatan, Mexico. Rev. Cienc. Mar. Costeras 2013, 5, 57–67. [Google Scholar] [CrossRef]
  25. Carmona-Escalante, A.; Guadarrama, P.; Ramos-Zapata, J.; Castillo-Argüero, S.; Montaño, N.M. Arbuscular mycorrhizal fungi associated with coastal vegetation in Chuburna, Yucatan, Mexico. Trop. Subtrop. Agroecosyst. 2013, 16, 431–443. [Google Scholar]
  26. Carbajal, N. Hidrodinámica y Transporte de Contaminantes y Sedimentos en el Sistema Lagunar Nichupté-Bojórquez, Quintana Roo; Informe final SNIB-CONABIO Proyecto No. CQ063; Instituto Potosino de Investigación Científica y Tecnológica: Mexico City, Mexico, 2009. [Google Scholar]
  27. Sánchez-Santillán, N.; Lanza-Espino, G.; Sánchez-Trejo, R. Analysis of the dynamic climatology of the Yucatan Peninsula, Mexico. In Recursos Acuáticos Costeros del Sureste Vol. II. Fondo Mixto—CONACYT—Gobierno del Estado de Yucatán; Consejo de Ciencia, Innovación y Tecnología del Estado de Yucatán: Mérida, Yucatán, Mexico, 2012; pp. 353–374. ISBN 978-607-9060-08-4. [Google Scholar]
  28. Vidal, R. Climatic Regions of Mexico; Institute of Geography, National Autonomous University of Mexico: Mexico City, Mexico, 2005; 216p. [Google Scholar]
  29. Palacios-Sánchez, S.E.; Vega-Cendejas, M.E. Cambios alimenticios en tres especies de Sphoeroides (Tetraodontiformes: Tetraodontidae) posterior al huracán Isidoro en Bocana de la Carbonera, Sureste del Golfo de México. Rev. Biol. Trop. 2010, 58, 1223–1235. [Google Scholar] [CrossRef]
  30. Mariño, I.; Enriquez, C. Estudios batimétricos, Hidrodinámicos y de Calidad de Agua en Lagunas Costeras de Yucatán; Reporte Técnico, Fondo mixto—CONACYT—Gobierno del Estado de Yucatán, Clave: 66254; Centro de Investigación y Estudios Avanzados del Instituto Politécnico Nacional Unidad Mérida: Mérida, Yucatán, México, 2011; 121p. [Google Scholar]
  31. DOEY. Diario Oficial del Estado de Yucatán; Decreto Número 285, 19 de Marzo de 2010; Gobierno del Estado: Mérida, Mexico, 2010. [Google Scholar]
  32. Jerónimo, G.; Gómez-Valdés, J.; Badillo, M.; López-Aguilar, K.; Galindo, C.; Gallardo, A.; Loera, J.; Arrollo-Pedraza, L.; Chiappa-Carrara, X. Variación Estacional de Temperatura y Salinidad en la Laguna la Carbonera, Yucatán, 2009–2010. In En Recursos Acuáticos Costeros del Sureste; Vol. II. Fondo Mixto—CONACYT—Gobierno del Estado de Yucatán; Consejo Nacional de Ciencia y Tecnología: Mexico City, Mexico, 2012; pp. 71–88. ISBN 978-607-9060-08-4. [Google Scholar]
  33. Marin, E. Modelación de la Hidrodinámica de un Sistema Lagunar en Humedal Costero con Descargas de Agua Subterránea (DAS); Universidad Nacional Autónoma de México: Mexico City, Mexico, 2016. [Google Scholar]
  34. Marin-Coria, E.; Enriquez, C. Variaciones de temperatura y salinidad en el sistema lagunar La Carbonera, Yucatán, México. Rev. Digit. E-BIOS 2016, 4, 35–45. [Google Scholar]
  35. Reyes-Mendoza, O.; Alvarez-Silva, O.; Chiappa-Carrara, X.; Enriquez, C. Variability of the thermohaline structure of a coastal hypersaline lagoon and the implications for salinity gradient energy harvesting. Sustain. Energy Technol. Assess. 2020, 38, 100645. [Google Scholar] [CrossRef]
  36. SEMARNAT. Norma Oficial Mexicana NOM-059-Semarnat-2001. Protección Ambiental-Especies Nativas de México de Flora y Fauna Silvestres-Categorías de Riesgo y Especificaciones para su Inclusión, Exclusión o Cambio-Lista de Especies en Riesgo; Diario Oficial de la Federación, 6 de Marzo del 2002, Segunda Sección; Secretaría de Medio Ambiente y Recursos Naturales: Ciudad de México, México, 2002. [Google Scholar]
  37. Guadarrama, P.; Salinas-Peba, L.; Chiappa-Carrara, X.; Ramos-Zapata, J.A. Florística, composición y estructura de las comunidades vegetales de la porción occidental de la Reserva Estatal Ciénegas y Manglares de la Costa Norte de Yucatán. Rev. Mex. Biodivers. 2018, 89, 784–805. [Google Scholar] [CrossRef]
  38. Torres, W.; Méndez, M.; Dorantes, A.; Durán, R. Estructura, composición y diversidad del matorral de duna costera en el litoral yucateco. Bol. Soc. Bot. Méx. 2010, 86, 37–51. [Google Scholar] [CrossRef]
  39. Gallardo-Torres, A.; Badillo-Alemán, M.; Galindo-de Santiago, C.; Loera-Pérez, J.; Rioja-Nieto, R.; Chiappa-Carrara, X. Listado Taxonómico de los Peces de la Laguna Boca de la Carbonera, Yucatán: Un Primer paso para el Manejo y Evaluación de los Recursos Costeros del Norte de Yucatán. In En Recursos Acuáticos Costeros del Sureste; Vol. II. Fondo Mixto—CONACYT—Gobierno del estado de Yucatán; Consejo Nacional de Ciencia y Tecnología: Mexico City, Mexico, 2012; pp. 270–288. ISBN 978-607-9060-08-4. [Google Scholar]
  40. Poot-López, G.R.; López-Rocha, J.A.; González-Salas, C.; Guillen-Hernández, S.; Villegas-Hernández, H. Sex related differences in density, selectivity and vulnerability of the Atlantic blue crab, Callinectes sapidus (Rathbun, 1896), in the southern Gulf of Mexico. Reg. Stud. Mar. Sci. 2019, 32, 100846. [Google Scholar] [CrossRef]
  41. Chiappa-Carrara, X.; Enríquez, C.; Mariño, I.; Badillo, M.; Gallardo, A.; Yáñez, C.; Marin-Coria, E.; Arena, L.; Guadarrama, P.; López, K.; et al. Monitoreo ambiental de largo Plazo, herramienta para evaluar la Resiliencia de sistemas costeros. In Caracterización Multidisciplinaria de la Zona Costera de Sisal; Garza-Pérez, J.R., Ize Lema, I., Eds.; El Laboratorio Nacional de Resiliencia Costera: Yucatán, México, 2017. [Google Scholar]
  42. Santoyo, A. Esbozo Monográfico de Sisal, Yucatán; Reporte Técnico; Laboratorio Nacional de Resiliencia Costera: Yucatán, México, 2017; 119p. [Google Scholar]
  43. Sandoval-Gio, J.J.; Zamora-Bustillos, R.; Avilés-Ramírez, G.A.; Ortiz-León, H.J.; Rosas-Correa, C.O. First report of a spawning site of Limulus polyhemus at Ría Lagartos Biosphere Reserve, Yucatan, Mexico. Rev. Bio Cienc. 2016, 5, e354. [Google Scholar]
  44. Coria, I.D. El estudio de impacto ambiental: Características y metodologías. Invenio 2008, 11, 125–135. [Google Scholar]
  45. Dellavedova, M. Guía Metodológica para la Elaboración de una Evaluación de Impacto Ambiental. Universidad de la Plata. 2011. Available online: http://blogs.unlp.edu.ar/planeamientofau/files/2013/05/Ficha-N%C2%BA-17-Gu%C3%ADa-metodol%C3%B3gica-para-la-elaboraci%C3%B3n-de-una-EIA.pdf (accessed on 13 January 2021).
  46. Fernández-Vitora, V. Guía Metodológica para la Evaluación del Impacto Ambiental; Editorial Mundi-Prensa: Madrid, Spain, 2010. [Google Scholar]
  47. Hyman, E.L. Combining Facts and Values. In Environmental Impact Assessment: Theories and Techniques, 1st ed.; Routledge: New York, NY, USA, 1988; p. 322. [Google Scholar] [CrossRef]
  48. Boehlertm, G.; Gill, A. Environmental and Ecological Effects of Ocean Renewable Energy Development: A Current Synthesis. Oceanography 2010, 23, 68–81. [Google Scholar] [CrossRef] [Green Version]
  49. Andrade Soriano, E.N. Desarrollo de una Metodología para Diseñar una Planta de Energía Osmótica; Universidad Distrital Francisco José de Caldas: Bogotá, Colombia, 2015. [Google Scholar]
  50. Caballero, J.; Pulido, M.; Martínez-Ballesté, A. The Use of the Guano Palm (Sabal Yapa) in the Tourism Industry in Quintana Roo, Mexico; Forest Products, Livelihoods and Conservation. Case Studies on Non-Timber Forest Products Management Systems; Alexiades, M., Shanley, P., Eds.; CIFOR-CGIAR: Bogor, Indonesia, 2004; Volume 3. [Google Scholar]
  51. Bahamón, A.; Álvarez, A.M. Palafito: De Arquitectura Vernácula a Contemporánea; Parramón: Lleida, Spain, 2009; p. 144. [Google Scholar]
  52. Cipollina, A.; Micale, G.; Tamburini, A.; Tedesco, M.; Gurreri, L.; Veerman, J.; Grasman, S. 5—Reverse electrodialysis: Applications. In Sustainability Energy from Salinity Gradients; Cipollina, A., Micale, G., Eds.; Woodhead Publishing: Sawston, UK, 2016; pp. 135–180. [Google Scholar] [CrossRef]
  53. Graniel, E.; Vera, I.; González, L. Dinámica de la interfase salina y calidad del agua en la costa nororiental de Yucatán. Ingeniería 2004, 8, 15–25. [Google Scholar]
  54. Osland, M.J.; Feher, L.C.; López-Portillo, J.; Day, R.H.; Suman, D.O.; Guzmán Menéndez, J.M.; Rivera-Monroy, V.H. Mangrove forests in a rapidly changing world: Global change impacts and conservation opportunities along the Gulf of Mexico coast. Estuar. Coast. Shelf Sci. 2018, 214, 120–140. [Google Scholar] [CrossRef]
  55. Capurro, L. A large coastal ecosystem: The Yucatán Península. Adv. Perspect. 2002, 22, 69–75. [Google Scholar]
  56. Palko, H. Exploring Potential Sites for Salinity Gradient Renewable Energy on the North Carolina Coast and Evaluating the Potential Effects of Local Salinity Regime Variation on SAV Communities due to Reverse Electrodialysis Effluent; University of North Carolina: Chapel Hill, NC, USA, 2017. [Google Scholar]
  57. Salas, M.; Gómez-López, D.; Duque, G. Estructura de las praderas de Thalassia testudinum en un gradiente de profundidad en la Guajira, Caribe colombiano. Bol. Investig. Mar. Costeras 2010, 39, 381–395. [Google Scholar]
  58. Vermaas, D.A.; Kunteng, D.; Saakes, M.; Nijmeijer, K. Fouling in reverse electrodialysis under natural conditions. Water Res. 2013, 47, 1289–1298. [Google Scholar] [CrossRef] [PubMed]
  59. Wojtarowski, A.; Martínez, M.L.; Silva, R.; Vázquez, G.; Enriquez, C.; López-Portillo, J.; García-Franco, J.G.; MacGregor-Fors, I.; Lara-Domínguez, A.L.; Lithgow, D. Renewable energy production in a Mexican biosphere reserve: Assessing the potential using a multidisciplinary approach. Sci. Total Environ. 2021, 776, 145823. [Google Scholar] [CrossRef]
  60. Didde, R. Pilot Plant Brings “Blue Energy” Closer. 2014. Available online: https://resource.wur.nl/en/show/Pilot-plant-brings-blue-energy-closer.htm (accessed on 23 February 2021).
  61. Gómez, L. Aspectos ecológicos y biotecnológicos. Rev. Cub. Quím. 2013, 19, 3–20. [Google Scholar]
  62. CONAGUA. Manual de Agua Potable, Alcantarillado y Saneamiento. Guía para el Diseño de Emisores Submarinos; CONAGUA: México City, México, 2007. [Google Scholar]
  63. Enriquez, C.; Mariño-Tapia, I.; Jeronimo, G.; Capurro-Filograsso, L. Thermohaline processes in a tropical coastal zone. Cont. Shelf Res. 2013, 69, 101–109. [Google Scholar] [CrossRef]
  64. Blaber, S. Fish and Fisheries of Tropical Estuaries; Chapman & Hall: London, UK, 1997. [Google Scholar]
  65. Telesh, I.V.; Khlebovich, V.V. Principal processes within the estuarine salinity gradient: A review. Mar. Pollut. Bull. 2010, 61, 149–155. [Google Scholar] [CrossRef]
  66. Vega-Cendejas, M.E.; Hernández de Santillana, M. Fish community structure and dynamics in a coastal hypersaline lagoon: Rio Lagartos, Yucatan, Mexico. Estuar. Coast. Shelf Sci. 2004, 60, 285–299. [Google Scholar] [CrossRef]
  67. Arceo-Carranza, D.; Chávez-López, R. Cambio Climático, Estuarios e Hipersalinidad. In Tópicos de Agenda para la Sostenibilidad de Costas y Mares Mexicanos; Rivera-Arriaga, E., Sánchez-Gil, P., Gutiérrez, J., Eds.; Universidad Autónoma de Campeche: Campeche, Mexico, 2019; pp. 275–290. [Google Scholar]
  68. Dawoud, M.A. Environmental Impacts of Seawater Desalination: Arabian Gulf Case Study. Int. J. Environ. Sustain. 2012, 1, 22–37. [Google Scholar] [CrossRef]
  69. Aaberg, R.J. Osmotic power: A new and powerful renewable energy source? Refocus 2003, 4, 48–50. [Google Scholar] [CrossRef]
  70. Scialdone, O.; Guarisco, C.; Grispo, S.; Angelo, A.D.; Galia, A. Investigation of electrode material—Redox couple systems for reverse electrodialysis processes. Part I: Iron redox couples. J. Electroanal. Chem. 2012, 681, 66–75. [Google Scholar] [CrossRef]
  71. Pérez-Castillo, A.G.; Rodríguez, A. Indice fisicoquímico de la calidad de agua para el manejo de lagunas tropicales de inundación. Rev. Biol. Trop. 2008, 56, 1905–1918. [Google Scholar] [PubMed]
  72. Garner, S.B.; Boswell, K.M.; Lewis, J.P.; Tarnecki, J.H.; Patterson, W.F. Effect of reef morphology and depth on fish community and trophic structure in the northcentral Gulf of Mexico. Estuar. Coast. Shelf Sci. 2019, 230, 106423. [Google Scholar] [CrossRef]
  73. Chen, Q.; Yuan, H.; Chen, P. Short-term effects of artificial reef construction on the taxonomic diversity and eco-exergy of the macrobenthic faunal community in the Pearl River Estuary, China. Ecol. Indic. 2019, 98, 772–782. [Google Scholar] [CrossRef]
  74. Yang, X.; Lin, C.; Song, X.; Xu, M.; Yang, H. Effects of artificial reefs on the meiofaunal community and benthic environment—A case study in Bohai Sea, China. Mar. Pollut. Bull. 2019, 140, 179–187. [Google Scholar] [CrossRef]
  75. Vaselbehagh, M.; Karkhanechi, H.; Takagi, R.; Matsuyama, H. Biofouling phenomena on anion exchange membranes under the reverse electrodialysis process. J. Membr. Sci. 2017, 530, 232–239. [Google Scholar] [CrossRef]
  76. Hernández-Fontes, J.V.; Martínez, M.L.; Wojtarowski, A.; González-Mendoza, J.L.; Landgrave, R.; Silva, R. Is ocean energy an alternative in developing regions? A case study in Michoacan, Mexico. J. Clean. Prod. 2020, 266, 121984. [Google Scholar] [CrossRef]
  77. Ciarreta, A.; Espinosa, M.P.; Pizarro-Irizar, C. Is green energy expensive? Empirical evidence from the Spanish electricity market. Energy Policy 2014, 69, 205–215. [Google Scholar] [CrossRef]
  78. Silva, R.; Chávez, V.; Bouma, T.J.; van Tussenbroek, B.I.; Arkema, K.K.; Martínez, M.L.; Oumeraci, H.; Heymans, J.J.; Osorio, A.F.; Mendoza, E.; et al. The Incorporation of Biophysical and Social Components in Coastal Management. Estuaries Coasts 2019, 42, 1695–1708. [Google Scholar] [CrossRef] [Green Version]
  79. Silva, R.; Oumeraci, H.; Martínez, M.L.; Chávez, V.; Lithgow, D.; van Tussenbroek, B.I.; van Rijswick, H.F.M.W.; Bouma, T.J. Ten Commandments for Sustainable, Safe, and W/Healthy Sandy Coasts Facing Global Change. Front. Mar. Sci. 2021, 8. [Google Scholar] [CrossRef]
  80. Herrera-Silveira, J.A. Lagunas Costeras de Yucatan (SE, México) Investigación, Diagnóstico y Manejo. Ecotropicos 2006, 19, 94–108. [Google Scholar]
  81. INEGI. Estudio Hidrológico de la Península de Yucatán, 1st ed.; Instituto Nacional de Estadística, Geografía e Informática y Gobierno del Estado de Yucatán: Yucatán, México, 2012. [Google Scholar]
  82. SEMAR. Available online: https://oceanografia.semar.gob.mx/Templates/grafnum_progreso.html (accessed on 20 May 2021).
  83. Silva, R.; Ruiz, G.; Posada, G.; Pérez, D.; Rivillas, G.; Espinal, J.; Mendoza, E. Atlas de Clima Marítimo de la Vertiente Atlántica Mexicana; Instituto de Ingeniería, Universidad Nacional Autónoma de México: Mexico City, Mexico, 2008. [Google Scholar]
  84. Alcerreca, J.C.; Silva, R.; Mendoza, E. Simple settling velocity formula for calcareous sand. J. Hydraul. Res. 2013, 51, 215–219. [Google Scholar] [CrossRef]
  85. Cuevas Jiménez, A.; Euán Ávila, J.I.; Villatoro Lacouture, M.M.; Silva Casarín, R. Classification of Beach Erosion Vulnerability on the Yucatan Coast. Coast. Manag. 2016, 44, 333–349. [Google Scholar] [CrossRef]
  86. Kachadourian-Marras, A.; Alconada-Magliano, M.M.; Carrillo-Rivera, J.J.; Mendoza, E.; Herrerías-Azcue, F.; Silva, R. Characterization of Surface Evidence of Groundwater Flow Systems in Continental Mexico. Water 2020, 12, 2495. [Google Scholar] [CrossRef]
Figure 1. Location of La Carbonera lagoon, Yucatan, Mexico, showing areas with significant saline properties, the location of the CTD sensors (red dots), and sites proposed for the RED power plant (A and B). The polygons SZR1, SZAE1, and SZUR6 are areas with protection categories within the Cienegas and Manglares State Reserve of the North Coast of Yucatán (RECMY).
Energies 14 03252 g001
Figure 2. Components and processes involved in RED and PRO technologies that may produce environmental impacts in coastal systems. Abbreviations: PE (pressure exchanger), SE (electrolyte solution), AEM (anion exchange membrane), CEM (cation exchange membrane). The components by sections are shown (A, B and C).
Energies 14 03252 g002
Figure 3. Stressors, receptors, and possible effects due to the implementation of SGE in La Carbonera lagoon in a three-stage scheme (construction, operation, and decommissioning) for the main components of the PRO and RED technologies. The letters indicate the number of stressors according to the phase of the project.
Energies 14 03252 g003
Figure 4. Potential location of the RED pilot power plant; the dotted lines indicate the pipelines.
Energies 14 03252 g004
Figure 5. Distribution of space for the proposed RED plant and ecotourism centre at La Carbonera site, 5250 m2.
Energies 14 03252 g005
Figure 6. Aerial view of the villages around La Carbonera lagoon (the jetty is shown as a reference).
Energies 14 03252 g006
Table 1. Species reported in the north of Yucatan, detailing their ecological and commercial importance, anthropic uses, and protection category.
Scheme 37Category of ProtectionImportance and/or Uses
VEGETATION [37,38]
Mangrove
Conocarpus erectus
Avicennia germinans
Rhizophora mangle
Laguncularia racemosa
ThreatenedErosion control and soil conservation/construction. Key in the life cycle of various organisms (fish and crustaceans). Carbon reservoirs, natural filter for water quality.
Coastal dune
Cordia sebestena
Jacquinia macrocarpa
UncategorisedOrnamental, medicinal, substrate fixation
Bravaisia berlandierianaUncategorisedConstruction, medicinal, substrate fixation
Metopium browneiUncategorisedToxic, substrate fixation
Capparis incana
Gomphrena serrata
Rivina humilis
Capparis flexuosa
UncategorisedMedicinal, substrate fixation
Acanthocereus tetragonus
Sideroxylon americanum
UncategorisedEdible, substrate fixation
Pithecellobium keyenseUncategorisedSubstrate fixation
Peten
Ficus cotinifoliaUncategorisedReclamation of degraded land
Manilkara zapota
Sabal yapa
UncategorisedMedicinal, construction, and handicrafts
Lowland flooded forest
Sporobolus pyramidatusUncategorisedPrimary cover resistant to saline soils
Solanum nigrumUncategorisedEdible
Haematoxylum campechianumUncategorisedTextile
Ipomoea carneaUncategorisedMedicinal, ornamental
Seagrasses
Thalassia testudinumMinor concernKey in the life cycle of various organisms (fish and crustaceans). Carbon reservoirs.
FISHES [39]
Fundulus persimilis
Fundulus grandissimus
Subject to special protectionEndemic
Gambusia yucatanaUncategorisedEndemic
Sphoeroides testudineus
Strongylura notata
Harengula clupeola
UncategorisedTraded for bait, resident, abundant species (vital in the food chain)
Trachinotus falcatus
Lutjanus griseus
Lutjanus synagris
Floridichthys polyommus
Archosargus probatocephalus
Eucinostomus gula
Eucinostomu argenteusMugil curema
Mugil trichodon
Hyporhamphus unifasciatus
Chriodorus atherinoides
UncategorisedMarketed for local and regional consumption
Poecilia veliferaSubject to special protection-
Aetobatus narinariAlmost threatenedCommercial importance in the region
CRUSTACEANS [40]
Callinectes sapidusUncategorisedMarketed for local and regional consumption
BIRDS [41]
Phoenicopterus ruber
Phalacrocorax brasilianus
Cochlearius cochlearius
Platalea ajaja
Ardea alba
Minor concernFor tourism (birdwatching)
Campylorhiynchus yucatanicusNear threatenedEndemic
Egretta rufescensSubject to special protectionFor tourism (birdwatching)
REPTILES [42]
Crocodylus moreletiiSubject to special protectionFor tourism (sighting)
Eretmochelys imbricateCritically endangeredTourism (controlled releases at turtle camps)
Chelonia mydasEndangeredTourism (controlled releases at turtle camps)
Caretta carettaEndangeredTourism (controlled releases at turtle camps)
ARTHROPODS [43]
Limulus polyphemusNear threatenedMedicinal
Publisher’s Note: MDPI stays neutral with regard to jurisdictional claims in published maps and institutional affiliations.

