Article

A Comparative Study of Machine Learning-Based Methods for Global Horizontal Irradiance Forecasting

1
Physical and Engineering Sciences Department, University of Perpignan Via Domitia, 52 Avenue Paul Alduy, 66860 Perpignan, France
2
PROMES-CNRS (UPR 8521), Rambla de la Thermodynamique, Tecnosud, 66100 Perpignan, France
3
PROMES-CNRS (UPR 8521), 7 Rue du Four Solaire, 66120 Font-Romeu-Odeillo-Via, France
*
Author to whom correspondence should be addressed.
Energies 2021, 14(11), 3192; https://doi.org/10.3390/en14113192
Submission received: 27 April 2021 / Revised: 24 May 2021 / Accepted: 25 May 2021 / Published: 29 May 2021
(This article belongs to the Special Issue Solar Forecasting and the Integration of Solar Generation to the Grid)

Abstract

:
The proliferation of photovoltaic (PV) power generation in power distribution grids induces increasing safety and service quality concerns for grid operators. The inherent variability, essentially due to meteorological conditions, of PV power generation affects the power grid reliability. In order to develop efficient monitoring and control schemes for distribution grids, reliable forecasting of the solar resource at several time horizons that are related to regulation, scheduling, dispatching, and unit commitment, is necessary. PV power generation forecasting can result from forecasting global horizontal irradiance (GHI), which is the total amount of shortwave radiation received from above by a surface horizontal to the ground. A comparative study of machine learning methods is given in this paper, with a focus on the most widely used: Gaussian process regression (GPR), support vector regression (SVR), and artificial neural networks (ANN). Two years of GHI data with a time step of 10 min are used to train the models and forecast GHI at varying time horizons, ranging from 10 min to 4 h . Persistence on the clear-sky index, also known as scaled persistence model, is included in this paper as a reference model. Three criteria are used for in-depth performance estimation: normalized root mean square error (nRMSE), dynamic mean absolute error (DMAE) and coverage width-based criterion (CWC). Results confirm that machine learning-based methods outperform the scaled persistence model. The best-performing machine learning-based methods included in this comparative study are the long short-term memory (LSTM) neural network and the GPR model using a rational quadratic kernel with automatic relevance determination.

1. Introduction

In the past few years, the higher penetration of renewable energy sources, in particular solar photovoltaics, into power grids, has brought new challenges for grid operators [1,2,3,4,5]. As electricity is not easy to store, supply and demand have to be balanced at all times by grid operators. Nonetheless, due to the intermittent nature of the solar resource, the deployment of photovoltaic (PV) power generation makes the power grid balance more complex to ensure using standard tools [6]. Indeed, the proliferation of PV power generation in power distribution grids brings out constraints, in particular voltage constraints, mainly observed on the medium-voltage power distribution grid, on the low-voltage one. Ergo, evolution of the power distribution grid and smart management tools are necessary to alleviate these constraints. It seems necessary to develop new tools that must help to improve the grid observability and management to go along with the grid’s evolution. As a result, the development of predictive management strategies is a stepping stone to more efficient real-time monitoring and optimization of grid operation [6,7,8]. Therefore, tools that allow accurate forecasting of PV power generation at several time horizons are needed to achieve the power grid stability and reliability. Towards this same objective, in the context of the Smart Occitania project, PROMES-CNRS laboratory and ENEDIS (the French distribution grid operator) have been developing tools to improve the observability and regulation of the low-voltage distribution grid in the presence of PV power generation in Occitania (southern France). Intrahour, intraday and day-ahead PV power generation forecasts allow grid operators to make decisions related to real-time grid regulation, unit commitment, and control of electricity demand [9]. To reach the goals of the Smart Occitania project, this work will focus on short-term forecasting horizons, ranging from 10 min to 4 h . Indeed, in order to perform a predictive management of power grids, which usually have fast dynamics, very short forecast horizons are needed.
The generated PV power can be deduced from forecasts of global horizontal irradiance (GHI), which is the total amount of shortwave radiation received from above by a horizontal surface on Earth. Hence, accurate forecasts of GHI at various time horizons are required for efficient development of grid-connected PV power systems. Reviewing the scientific literature, various solar irradiance forecasting methods have been developed (see e.g., [9,10,11,12,13,14,15]). These models are used to forecast GHI depending on the input data and forecast horizon. For the intrahour range, GHI forecasts with higher spatial and temporal resolution derived from cloud information from ground-based sky imagers are more accurate than the satellite-based forecasts [10,16,17]. For short-term horizons ranging from few minutes to 6 h , statistical models with on-site GHI measurements are appropriate [10,11,12,13]. Satellite images, which provide information about cloud motion that can be extrapolated to the upcoming few hours, allow to have good forecasts for time horizons up to 6 h ahead [10,18]. However, the spatial extension of the monitored cloud scenes and corresponding cloud velocities limit the forecast horizons. Numerical weather prediction (NWP) models deliver more precise forecasts for time horizons from about 6 h onwards [9,10,19]. There are also combined or hybrid methods that integrate different kinds of input data and/or approaches to elaborate a high-performance forecasting model [20,21,22].
One drawback of statistical models is that they cannot account for dynamic phenomena like motion and formation of clouds that create sudden changes in the GHI signal [10]. Based on these effects, one might desire to use models to describe cloud motion and to derive irradiance from images provided by satellites or sky imagers. However, these models are complex and exhibit an inherent uncertainty related to limits in spatial and temporal resolution, uncertainty in input parameters, and simplifying assumptions within the models [10]. As a result, for short-term horizons, although dynamic phenomena may not be anticipated, statistical models developed are nonetheless used to provide forecasts. A simple way of using statistical approaches to forecast solar irradiance is to develop models that deliver forecasts based only on endogenous data (only GHI measurements). Statistical models can also be fed with exogenous input data such as NWP forecasts [20] or other data (direct horizontal irradiance, direct normal irradiance, dew point, temperature, humidity, wind direction) [23]. However, the development of statistical models using endogenous data is prevalent in the solar irradiance forecasting literature in a real-time operational context because they can provide accurate forecasts with limited investment and computational effort.
As the current paper deals with short-term GHI forecasting based on historical GHI data, the focus is put on statistical models. These models include classical time-series approaches such as the persistence model and autoregressive models, and artificial intelligence-based techniques such as regression trees, k-nearest neighbours (kNN), artificial neural networks (ANNs), support vector regression (SVR) and Gaussian process regression (GPR) [12,13,24,25,26,27,28]. Note that as most of classical time-series models need stationarity, the solar irradiance data, which are non-stationary, can be preprocessed using the clearness index [11] or the clear-sky index [29]. However, machine learning-based techniques can model non-stationary signals and are capable of capturing both the periodic component and the stochastic part of the GHI time-series. Additionally, in [30], it is argued that artificial intelligence-based techniques without any specific preprocessing of data outperform classical approaches with preprocessed data. Finally, the development of models free from using clear-sky models or other preprocessing steps implies that all errors come solely from the forecasting method. As a result, in this paper, GHI data without any specific preprocessing step will be used.
Machine learning methods have been increasingly used in recent years. In [31], the authors applied deep recurrent neural networks for solar irradiance forecasting and showed that these networks outperform SVR models and feedforward neural networks. In [23], long short-term memory (LSTM) neural networks were used for multi-step ahead forecasting of GHI. In [32], the authors developed a hybrid model using an autoregressive model and an ANN model for forecasting hourly solar radiation in the Mediterranean area. One-hour ahead solar irradiance were predicted using support vector machines (SVMs) in [33]. In [34], a deep convolutional neural network (CNN) model has been developed for hourly GHI forecasting based only on sky images without numerical measurements and extra feature engineering. A hybrid CNN with a LSTM neural network for forecasting half-hourly solar radiation has been proposed in [35]. This hybrid model has been compared to other deep learning models and results show that the hybrid model outperformed its counterparts. The potential of GPR for GHI forecasting has been investigated in [24,25]. In [24], the authors have made a comparative study of online GPR and online sparse GPR models based on simple kernels or combined kernels defined as sums or products of simple kernels and the results have shown the superiority of quasiperiodic kernels-based GPR models over the classic persistence model as well as simple kernels-based GPR models.
Based on their proven good performance, popularity and potential in providing accurate forecasts, it yields that machine learning methods such as ANN, SVR and GPR are well-suited for GHI forecasting. The present paper focuses on the development and comparison of intrahour and intraday machine learning-based GHI forecasting models. Even though several such comparative analyses exist in the literature (Table 1 offers a comparison between the work presented in this paper and recent comparative studies), several questions still remain to be answered.
  • Most studies use databases having at least a 1-hour time step, which leads to the impossibility of intrahour forecasting and to significant simplification of GHI dynamics, as illustrated in Figure 1.
  • The methods themselves are not always optimized and used to their fullest extent. For example, when using GPR, the default kernel (i.e., the squared exponential) is usually used [13,36]; however, a kernel tailored to the application at hand has a significant influence on results [24].
  • Regarding input data: some studies use only endogenous data, while others use additional data, which prevents from making fair comparisons between methods.
  • Some authors forecast GHI directly, others the clear-sky index (using clear-sky models as pre- and postprocessing steps) or even PV power generation.
As a result, despite the extent of research on GHI forecasting in the scientific literature, a thorough comparative study of machine learning-based methods using endogenous data only, without any preprocessing step, for intrahour GHI forecasting is, to the best of the authors’ knowledge, inexistent.
The main contributions of the present paper are threefold.
  • The models are developed using a two-year GHI database with a 10 min time step. As can be seen in Table 1, in previous machine learning studies the time step is usually 1 h . However, such a time step leads to significant simplification of GHI dynamics: as can be noticed in Figure 1, GHI data sampled with 10 min time step exhibit more fluctuations and are thus more difficult to forecast.
  • Contrary to developing a specific model for each forecast horizon, as shown in some studies in the literature [13,28], we made the choice of multi-horizon forecasting models. Developing a specific model for each forecast horizon can be computationally demanding when many horizons are considered and it would be more practical to use a multi-horizon forecasting model when trying to run the algorithms in situ to produce real-time forecasts at various horizons, especially when intrahour forecasts are needed. Therefore, in this paper, the models are developed for multi-step ahead GHI forecasting and once the training phase is over, the models are used to forecast GHI for all horizons.
  • Besides, many authors generally choose classical performance criteria (nRMSE, MAE, MBE, MAPE) for their models’ evaluation. In the present paper, two criteria are used in addition to the nRMSE: DMAE, that accounts for temporal distortion error and absolute magnitude error simultaneously; and CWC, that assesses the quality of prediction intervals. These criteria provide more detailed and comprehensive information about the models’ performance, and allow an in-depth analysis of their forecasts.
In this paper, the same data are used for each model training and tests are performed on the same dataset to make a fair comparison and a thorough analysis of the results. When using GPR, kernels with automatic relevance determination (ARD), such as the squared exponential kernel with ARD ( k SE - ARD ) and the rational quadratic kernel with ARD ( k RQ - ARD ), are chosen to account for the relevance of each input dimension in the underlying function modelling. It is a good option, when using GPR for GHI forecasting, as the underlying function has a multi-dimensional input variable, to use ARD kernels that implicitly determine the relevance of each input dimension [37]. That is why we have decided for such kernels. Nonetheless, the flexibility of ARD kernels means that they can be relatively slow to learn and, as a result, authors generally choose simple kernels with isotropic correlation length parameter [13]. The ANN models developed in this paper are based on MLP (multilayer perceptron) and LSTM neural networks. These artificial neural networks are widely used for time series forecasting.
The rest of the paper is organized as follows: in Section 2, the data used to develop and validate the models included in the comparative study are described. Section 3 provides a description of the scaled persistence model and the machine learning methods (GPR, SVR and ANN) used to forecast GHI and presents the models’ structure. The forecasting results as well as the criteria used to assess the models’ performance (i.e., forecasting accuracy) are presented and discussed in Section 4. The paper ends with a conclusion.

2. Data Description

The dataset is derived from measurements taken at PROMES-CNRS laboratory, located in Font-Romeu-Odeillo-Via (southern France) in the Occitania region. Located at high altitude, the site is characterized by a relatively dry mountain climate, with hot summers and icy winters. Besides, there is also occasional severe thunderstorms that fall on the region. GHI data are collected using a pyranometer KIPP and ZONEN CM5.
The dataset used in this paper covered the years 2018 and 2019. The data were sampled with a time step Δ t = 10 min , resulting in around 26,600 points per year (after nights were removed). Data of year 2018 were used for training the models and 2019’s data were used for the test phase. The aim behind such a partition was to train the models with data providing exhaustive information (this enabled the models to learn all possible patterns in one-year GHI data) and to assess their ability to provide GHI forecasts in all atmospheric conditions, whatever the season. The min-max normalization was used for data preprocessing to facilitate the learning process of the models. Figure 2 depicts a map of data covering the two years. Additionally, it can be noted that there were some missing values in the database, amounting to 0.64% of the whole database. As the missing values represented an insignificant part of the data, there was no need for a sophisticated way to handle them. They were removed from the dataset. Moreover, the models trained with data after the removal of missing values were often robust.

3. Forecasting Methods Included in the Comparative Study

This section presents the scaled persistence model and the three different machine learning-based methods included in the comparative study: Gaussian process regression (GPR), support vector regression (SVR) and artificial neural networks (ANNs). For the machine learning-based methods’ description, we considered a training set D = { ( x i , y i ) , 1 i n } , where x i R D is a vector of past GHI values, y i R is the corresponding one-step ahead GHI forecasting value and n is the number of training samples. Let us aggregate all input vectors x i in a matrix X R n × D and note y R n the vector of corresponding outputs y i . The models were implemented on a machine having Intel® Xeon® CPU E7-4890 [email protected] as the CPU. The GPR models were implemented using the Gaussian Processes for Machine Learning Matlab Toolbox [38], the LS-SVR model was implemented using the LS-SVM Matlab Toolbox [39] and the ANN models were implemented using the Deep Leaning Matlab Toolbox.
This paper focuses on the multi-step ahead forecasting of GHI, which was achieved by iterating one-step ahead forecasting: this strategy involved using the estimate of the output of the current forecasting as well as previous outputs (up to the lag D) as the input to forecast GHI at the next time step and repeating this procedure until the forecast at the desired forecast horizon was obtained. During the training phase, each sample was used. Throughout the testing phase, the models’ parameters were updated each time step to forecast the one-step ahead GHI and successive one-step ahead forecasts were performed to reach the desired forecast horizon.

3.1. Scaled Persistence Model

The scaled persistence model, used in this study as a reference model, is given by:
GHI ( t + k Δ t ) = GHI ( t ) GHI clsk ( t ) · GHI clsk ( t + k Δ t )
where GHI is the measured global horizontal irradiance, GHI clsk is the clear-sky model’s output, Δ t refers to the time step (10 min ) and k Δ t is the forecast horizon.
Clear-sky models estimate ground level irradiance under a clear sky as a function of the solar elevation angle, site altitude, aerosol concentration, water vapour and various atmospheric parameters. The scientific literature exhibits a wide variety of clear-sky models that are reviewed in [40]. The approach proposed in [41] for clear-sky DNI models, which combines Ineichen and Perez’s clear-sky model [42] with a persistence of atmospheric turbidity, is modified to obtain a clear-sky GHI model. The clear-sky global horizontal irradiance is given by:
GHI clsk = c g 1 · I 0 · cos ( z ) · exp c g 2 · AM · f h 1 + f h 2 ( T L 1 ) · exp ( 0.01 · AM 1.8 )
where I 0 is the extraterrestrial irradiance, z is the solar zenith angle, AM is the optical air mass, T L is the Linke turbidity coefficient and f h 1 , f h 2 , c g 1 , and c g 2 are parameters.
The Linke turbidity coefficient is defined as the number of dry atmospheres necessary to produce the attenuation of the extraterrestrial irradiance produced by the atmosphere.
The parameters f h 1 , f h 2 , c g 1 and c g 2 are respectively given by:
f h 1 = exp h 8000
f h 2 = exp h 1250
c g 1 = 5.09 × 10 5 h + 0.868
c g 2 = 3.92 × 10 5 h + 0.0387
where h is the elevation.
The optical air mass (AM) is calculated by Kasten and Young’s formula [43]:
AM = 1 cos ( z ) + 0.50572 ( 96.07995 z ) 1.6364

3.2. Gaussian Processes

A Gaussian process (GP) is a collection of random variables, any finite number of which have a joint Gaussian distribution [38]. As a Gaussian distribution is determined by a mean vector and a covariance matrix, in a similar manner a GP is also fully defined by a mean function and a covariance function. A function f distributed as a Gaussian process is denoted as f ( x ) GP ( μ ( x ) , k ( x , x ) ) , where x and x are arbitrary input variables, μ ( x ) = E [ f ( x ) ] is the mean function and k ( x , x ) = E ( f ( x ) μ ( x ) ) ( f ( x ) μ ( x ) ) T is the covariance function, also called kernel.

3.2.1. Kernels Used in This Study

Kernels contain the assumptions about the underlying function to be learned and define the similarity between the function values at different input variables x and x [38,44]. It yields that the choice of kernel has a crucial impact on the performance of a GPR model [24]. Any function can be a covariance function as long as the covariance matrix obtained is positive semi-definite.
The kernel is a crucial part of GPR models and should be carefully chosen. For GHI forecasting by GPR, many authors have chosen kernels with isotropic correlation length parameter [13,36]. However, as the underlying function has a multi-dimensional input variable and doesn’t have the same variation level along each input dimension, it would be better to use kernels that define a specific and suitable length-scale for each input dimension. That is why Automatic Relevance Determination (ARD) kernels, which implicitly determine the relevance of each input dimension, are used to model functions that have multi-dimensional input [37].
Furthermore, additive structures can be developed for ARD kernels to capture the correlations between the input dimensions in order to improve the generalization ability of models for long-term horizons [45]. ARD kernels used in this work are described below. It is worth noting that several ARD kernels have been tested to identify the best-performing ones.
  • The SE-ARD kernel k SE - ARD , expressed as a product of squared exponential (SE) kernels over input dimensions each having a different length-scale, is given by:
    k SE - ARD ( x , x ) = σ 2 exp 1 2 d = 1 D ( x d x d ) 2 d 2
    where σ > 0 is the amplitude and 1 , 2 , , D > 0 are the length-scales which control the function’s variation along each input dimension. This kernel is a covariance function commonly chosen as default in Gaussian processes applications, because it has relatively few and easy-interpretable parameters to estimate. Moreover, it can be seen as an universal kernel, capable of learning any continuous function given enough data, under some conditions that are investigated in [46].
  • The RQ-ARD (rational quadratic) kernel k RQ - ARD is given by:
    k RQ - ARD ( x , x ) = σ 2 1 + 1 2 α d = 1 D ( x d x d ) 2 d 2 α
    where α > 0 characterizes the relative weighting of large-scale and small-scale variations. The RQ kernel can be seen as an infinite sum of SE kernels with different characteristic length-scales [38] and models functions that vary smoothly across many length-scales. Analogously, the RQ-ARD kernel, which allows the modelling of functions that exhibit multi-scale variations along each input dimension, can be seen as an infinite sum of SE-ARD kernels.

3.2.2. Gaussian Process Regression

Consider the standard regression model:
y = f ( X ) + ε
where f is the regression function and ε N ( 0 , σ ε 2 ) is an independent identically distributed Gaussian noise.
GPR is a Bayesian non-parametric approach [38] towards regression problems, which consists in approximating f ( x ) GP ( μ ( x ) , k ( x , x ) ) using a training set of n observations D . Consider X * a matrix of test input vectors. Assuming f ( x ) GP ( μ ( x ) , k ( x , x ) ) and ε N ( 0 , σ ε 2 ) , the training observations y and the function values f * for the test inputs X * follow a joint Gaussian distribution. Thus, the posterior predictive density is also Gaussian [38]:
f * | X , y , X * N ( μ * , σ * 2 )
where the mean prediction μ * and the predictive variance σ * 2 are respectively given by:
μ * = μ ( X * ) + K * T ( K + σ ε 2 I ) 1 ( y μ ( X ) )
and:
σ * 2 = K * * K * T ( K + σ ε 2 I ) 1 K *
with f * = f ( X * ) , K * = k ( X , X * ) , K * * = k ( X * , X * ) , and K = k ( X , X ) .
In the event of a single test input vector x * , the mean prediction (Equation (12)) becomes:
μ * = μ ( x * ) + k * T ( K + σ ε 2 I ) 1 ( y μ ( X ) )
where k * = k ( x 1 , x * ) k ( x 2 , x * ) k ( x n , x * ) T .
Thus the mean prediction μ * (Equation (14)) can be written as a linear combination of kernel functions, each one centred on a training point:
μ * = μ ( x * ) + i = 1 n α i k ( x i , x * )
where α = ( K + σ ε 2 I ) 1 ( y μ ( X ) ) .
The coefficients α i , also called parameters, are updated each time a new observation is added to the observation set contrary to the parameters of the kernel, referred to as hyperparameters, which do not change once training is over. Graphical views of GHI forecasting by the k SE - ARD -based and k RQ - ARD -based GPR models are depicted by Figure 3 and Figure 4.

3.2.3. Training a GPR Model

The hyperparameters θ of a GPR model, which group the parameters involved in the kernel and the noise variance, have to be inferred from the training data. In practice, they are commonly estimated by maximizing the log marginal likelihood given by:
L ( θ ) = 1 2 y T K + σ ε 2 I 1 y + log det K + σ ε 2 I + n log ( 2 π )
Unfortunately, the log marginal likelihood function L ( θ ) is usually non-convex with respect to the hyperparameters. The problem space can have many local optima and the optimized hyperparameters, which depend on their initialization, may not be the global optimum [37,47]. A classical approach to overcome this drawback is to use various starting points randomly selected from a suitable prior distribution. A study on the impact of prior distributions of the initial hyperparameters in GPR models has been conducted in [48] and the authors have arrived at the conclusion that simple priors such as the uniform distribution in an appropriate range may be sufficient in GPR modelling in terms of predictability.
For the initialization of the hyperparameters θ , the following choices have been made: the hyperparameter σ 2 was chosen to be equal to the variance of the training data and the remaining hyperparameters are randomly drawn from an uniform distribution θ i Uniform ( 0 , 1 ) .

3.3. Support Vector Machines

Support vector machines (SVM), which have been developed in the past few decades [49,50,51,52,53], are learning systems that map inputs into a high dimensional feature space where linear separation or regression becomes much easier. The SVM algorithm, which is a nonlinear generalization of the method developed in [54], is based on a learning algorithm from optimization theory grounded in the statistical learning theory framework [49,55]. Firstly, SVM were developed for pattern recognition [52], but they also exhibit good performance in time series modelling and have been successfully applied to regression problems and time series forecasting [51,53].

3.3.1. Support Vector Regression

Support vector regression (SVR) maps the input X into a high dimensional feature space F through a nonlinear mapping function ϕ in order to do a linear regression in the feature space. We construct a linear regression function f in the feature space F:
f ( X ) = w T ϕ ( X ) + b
where w and b are obtained by solving a convex optimization problem.
In [49], SVR is first described as ε -SV regression, which aims to find function f that is as flat as possible and concomitantly has at most ε error from the targets y i for all training data. This problem can be formulated as a convex optimization problem [53]. Furthermore, slack variables ξ i , ξ i * are introduced to deal with unfeasible constraints of the optimization problem [49].
Equations (18) and (19) describe the convex optimization problem as follows:
min 1 2 w T w + C i = 1 n ( ξ i + ξ i * )
subject to, i :
y i ( w T ϕ ( x i ) + b ) ε + ξ i ( w T ϕ ( x i ) + b ) y i ε + ξ i * ξ i , ξ i * 0
where C > 0 determines the trade-off between the flatness of f and the amount up to which deviations larger than ε are tolerated.
It is shown in [53] that the optimization problem can be solved more easily in its dual formulation using Lagrange multipliers. The dual form of this problem is:
min 1 2 i = 1 n j = 1 n ( α i α i * ) ( α j α j * ) k ( x i , x j ) + ε i = 1 n ( α i + α i * ) i = 1 n y i ( α i α i * )
subject to, i :
0 α i , α i * C i = 1 n ( α i α i * ) = 0
where α i , α i * are Lagrange multipliers and k is a kernel function, defined as:
k ( x , x ) = ϕ T ( x ) ϕ ( x )
The weight w can be written as:
w = i = 1 n ( α i α i * ) ϕ ( x i )
Thus the regression function is given by:
f ( X ) = i = 1 n ( α i α i * ) k ( x i , X ) + b
The learning algorithms of support vector regression need to solve the optimization problem (Equations (18) and (19)), which becomes more complex and requires much computing time when a large dataset is considered. In order to reduce the algorithmic complexity, an equivalent least squares support vector regression (LS-SVR) is introduced [56]. In LS-SVR, the inequality constrains are replaced by equality ones, significantly reducing computation time.

3.3.2. Least Squares Support Vector Regression

The optimization problem for LS-SVR can be described as:
min w , b , e J ( w , e ) = 1 2 w T w + 1 2 γ i = 1 n e i 2
where J is the loss function and γ is the adjustable constant, subject to, i :
y i = w T ϕ ( x i ) + b + e i
where ϕ is the nonlinear mapping function in kernel space, b is the bias term and e i is the error variable.
The Lagrangian function of the optimization problem is:
L = J ( w , e ) i = 1 n α i [ w T ϕ ( x i ) + b + e i y i ]
where α i is Lagrange multiplier. The partial derivatives of L are:
L w = 0 w = i = 1 n α i ϕ ( x i ) L b = 0 i = 1 n α i = 0 L e i = 0 α i = γ e i L α i = 0 w T ϕ ( x i ) + b + e i y i = 0
After eliminating w and e i from Equation (28), we can write the problem in matrix form:
0 𝟙 n T 𝟙 n K + 1 γ I b α = 0 y
where:
K ( i , j ) = k ( x i , x j ) = ϕ ( x i ) T ϕ ( x j )
Then the function estimation of LS-SVR is:
y = f ( X ) = i = 1 n α i k ( X , x i ) + b
Among the kernels that can be used in support vector regression (linear, polynomial and radial basis function kernels), we have decided for the radial basis function (RBF) kernel to model and forecast GHI (Figure 5). This kernel, which is more flexible than the linear and polynomial kernels, is capable of representing complex relationship between data and is well-suited for nonlinear modelling. The RBF kernel is given by:
k ( x i , x j ) = exp x i x j 2 2 δ 2
where δ is the length-scale. Herein, δ and γ are estimated using the gridsearch method.

3.4. Artificial Neural Networks

Artificial neural networks are nonlinear data-driven self-adaptive approaches widely used for time series forecasting [57], in particular for solar resource forecasting [13,26,58,59]. Indeed, ANN, which are inspired by the neural structure of the human brain, are powerful tools for regression. They can process problems involving nonlinear and complex data even if these data are imprecise and noisy. An artificial neural network is fully defined by its architecture (or topology), its parameters (named weights, or synaptic weights, and biases) and the algorithm used for training.
While feedforward neural networks are the most widely used for time series forecasting tasks, recurrent neural networks are also extensively used now due to their ability to learn dependencies between time steps of data [60]. Convolutional neural networks, often used for image classification and computer vision problems, have the ability to learn and automatically extract features from raw input data [60]. Thus, they can also be applied to time-series forecasting tasks. The capabilities of these ANN types can be combined to build hybrid models, such as CNN associated with long short-term memory neural networks that seek to harness the ability of each model type [35].
In the present work, a multilayer perceptron, i.e., a feedforward neural network, and a LSTM neural network will be used to forecast GHI. Both networks are described in the sequel. MLP and LSTM neural network have been broadly used for time-series forecasting and have proven good performances [57,61]. Despite their enhanced feature learning ability, convolutional neural networks cannot learn temporal dependencies in data. Nevertheless, the use of CNN and hybrid models seems to be promising in the application of ANN to time-series forecasting. As this paper doesn’t aim to provide an exhaustive study about ANN, CNN and hybrid models are not considered for GHI forecasting.

3.4.1. Multilayer Perceptron

The multilayer perceptron is a feedforward artificial neural network historically used for time series forecasting. In a MLP with hidden layers, there is no feedback and the information flows through connecting pathways, in only one direction, from the input layer to the output layer. For the input layer, h 0 ( x ) = x , where x is an input vector. For the network’s hidden layers, with L = 1 , , :
a L ( x ) = b L + W L h L 1 ( x )
and:
h L ( x ) = ϕ ( a L ( x ) )
where b L is the bias vector of layer L, W L is the weight matrix of layer L and ϕ is the hidden neurons’ activation function.
The sigmoid function was historically the most widely used activation function in hidden layers since it is differentiable and enables to keep values in the interval 0 , 1 . However, using this function is problematic since its gradient is very close to 0 when | x | is not close to 0. Because this can cause trouble during training, in particular with deep architectures, the sigmoid function was supplanted by the rectified linear unit (or ReLU). As an interesting feature, the ReLU function, which is not differentiable in 0, has a sparsification effect. It is used in our network. So:
ϕ ( a L ( x ) ) = max ( 0 , a L ( x ) )
For the network’s output layer, with L = + 1 :
a + 1 ( x ) = b + 1 + W + 1 h ( x )
and:
h + 1 ( x ) = ψ ( a + 1 ( x ) )
where b + 1 is the bias vector of layer + 1 , W + 1 is the weight matrix of layer + 1 and ψ is the output neurons’ activation function (which is linear).
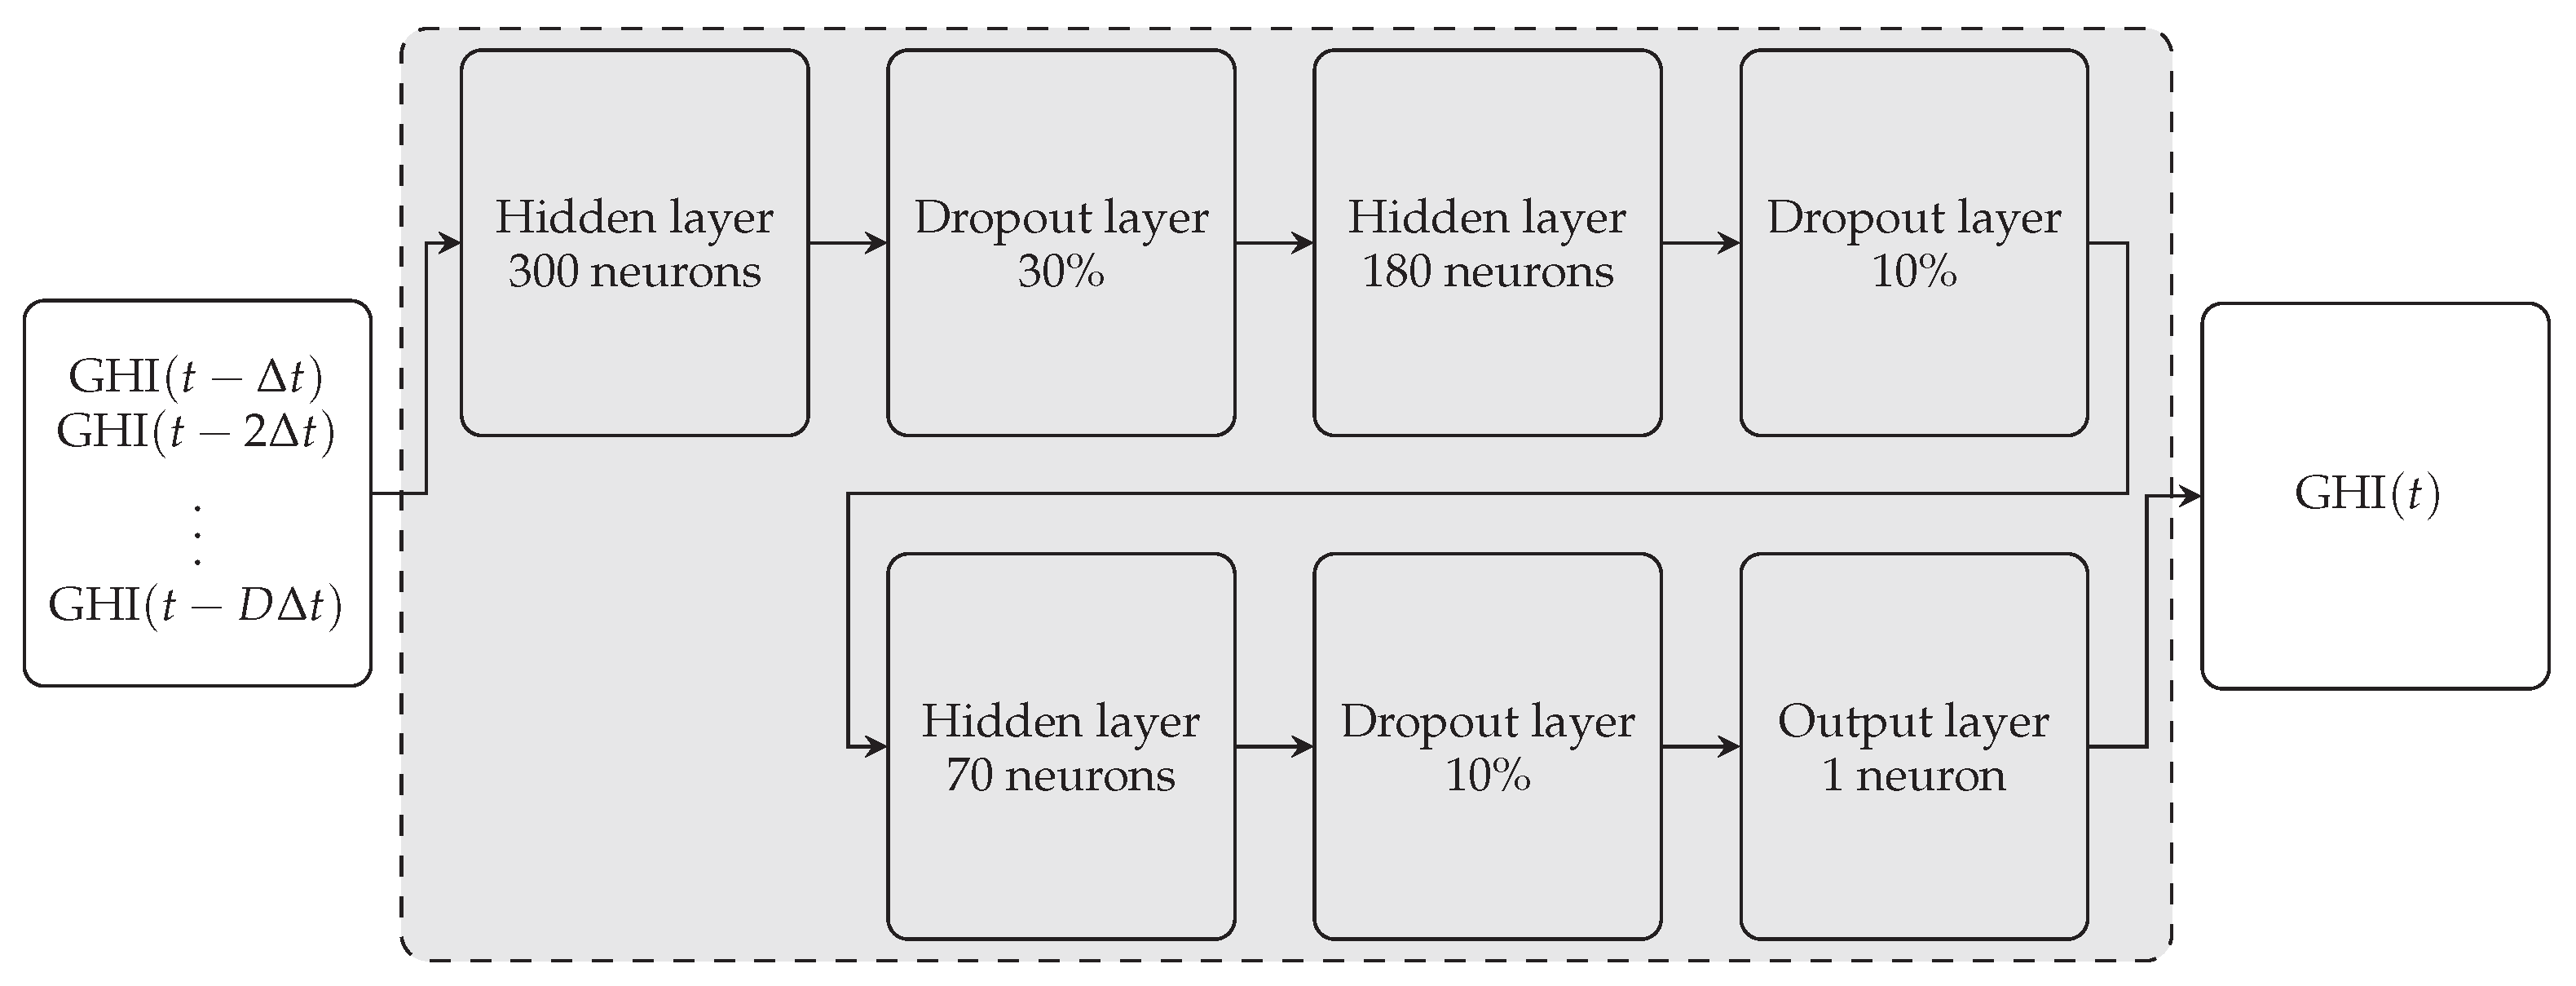
Figure 6 shows a graphical view of the MLP model’s architecture for GHI forecasting.

3.4.2. Long Short-Term Memory

LSTM networks, introduced by [62], are recurrent neural networks developed to overcome the gradient vanishing problem that occurs when training traditional recurrent neural networks [63,64]. LSTM networks are capable of learning sequences of observations. This may make them neural networks well suited for forecasting. Initially, an LSTM unit was composed of a cell, an input gate, and an output gate. Later on, the forget gate has been introduced to allow the LSTM to reset its own state [65]. Let us denote by i, f, g, o the input gate, forget gate, input node, and output gate respectively. These gates and nodes are shortly described below. The input node, the input gate and the forget gate are respectively defined as follows:
g k = ϕ ( W g x x k + W g h h k 1 + b g )
i k = σ ( W i x x k + W i h h k 1 + b i )
f k = σ ( W f x x k + W f h h k 1 + b f )
where x k is the current input vector, h k 1 is the hidden state at the previous time step, W g x , W i x , W f x are input weights, W g h , W i h , W f h are recurrent weights, b g , b i , b f are biases, σ is the sigmoid function, and ϕ is the hyperbolic tangent function.
At the heart of each memory cell, there is a node with linear activation. This internal state has a self-connected recurrent edge, often called the constant error carousel, with the following unit weight:
s k = g k i k + s k 1 f k
where ⊙ is the Hadamard product.
The output gate is described by:
o k = σ ( W o x x k + W o h h k 1 + b o )
and:
h k = ϕ ( s k ) o k
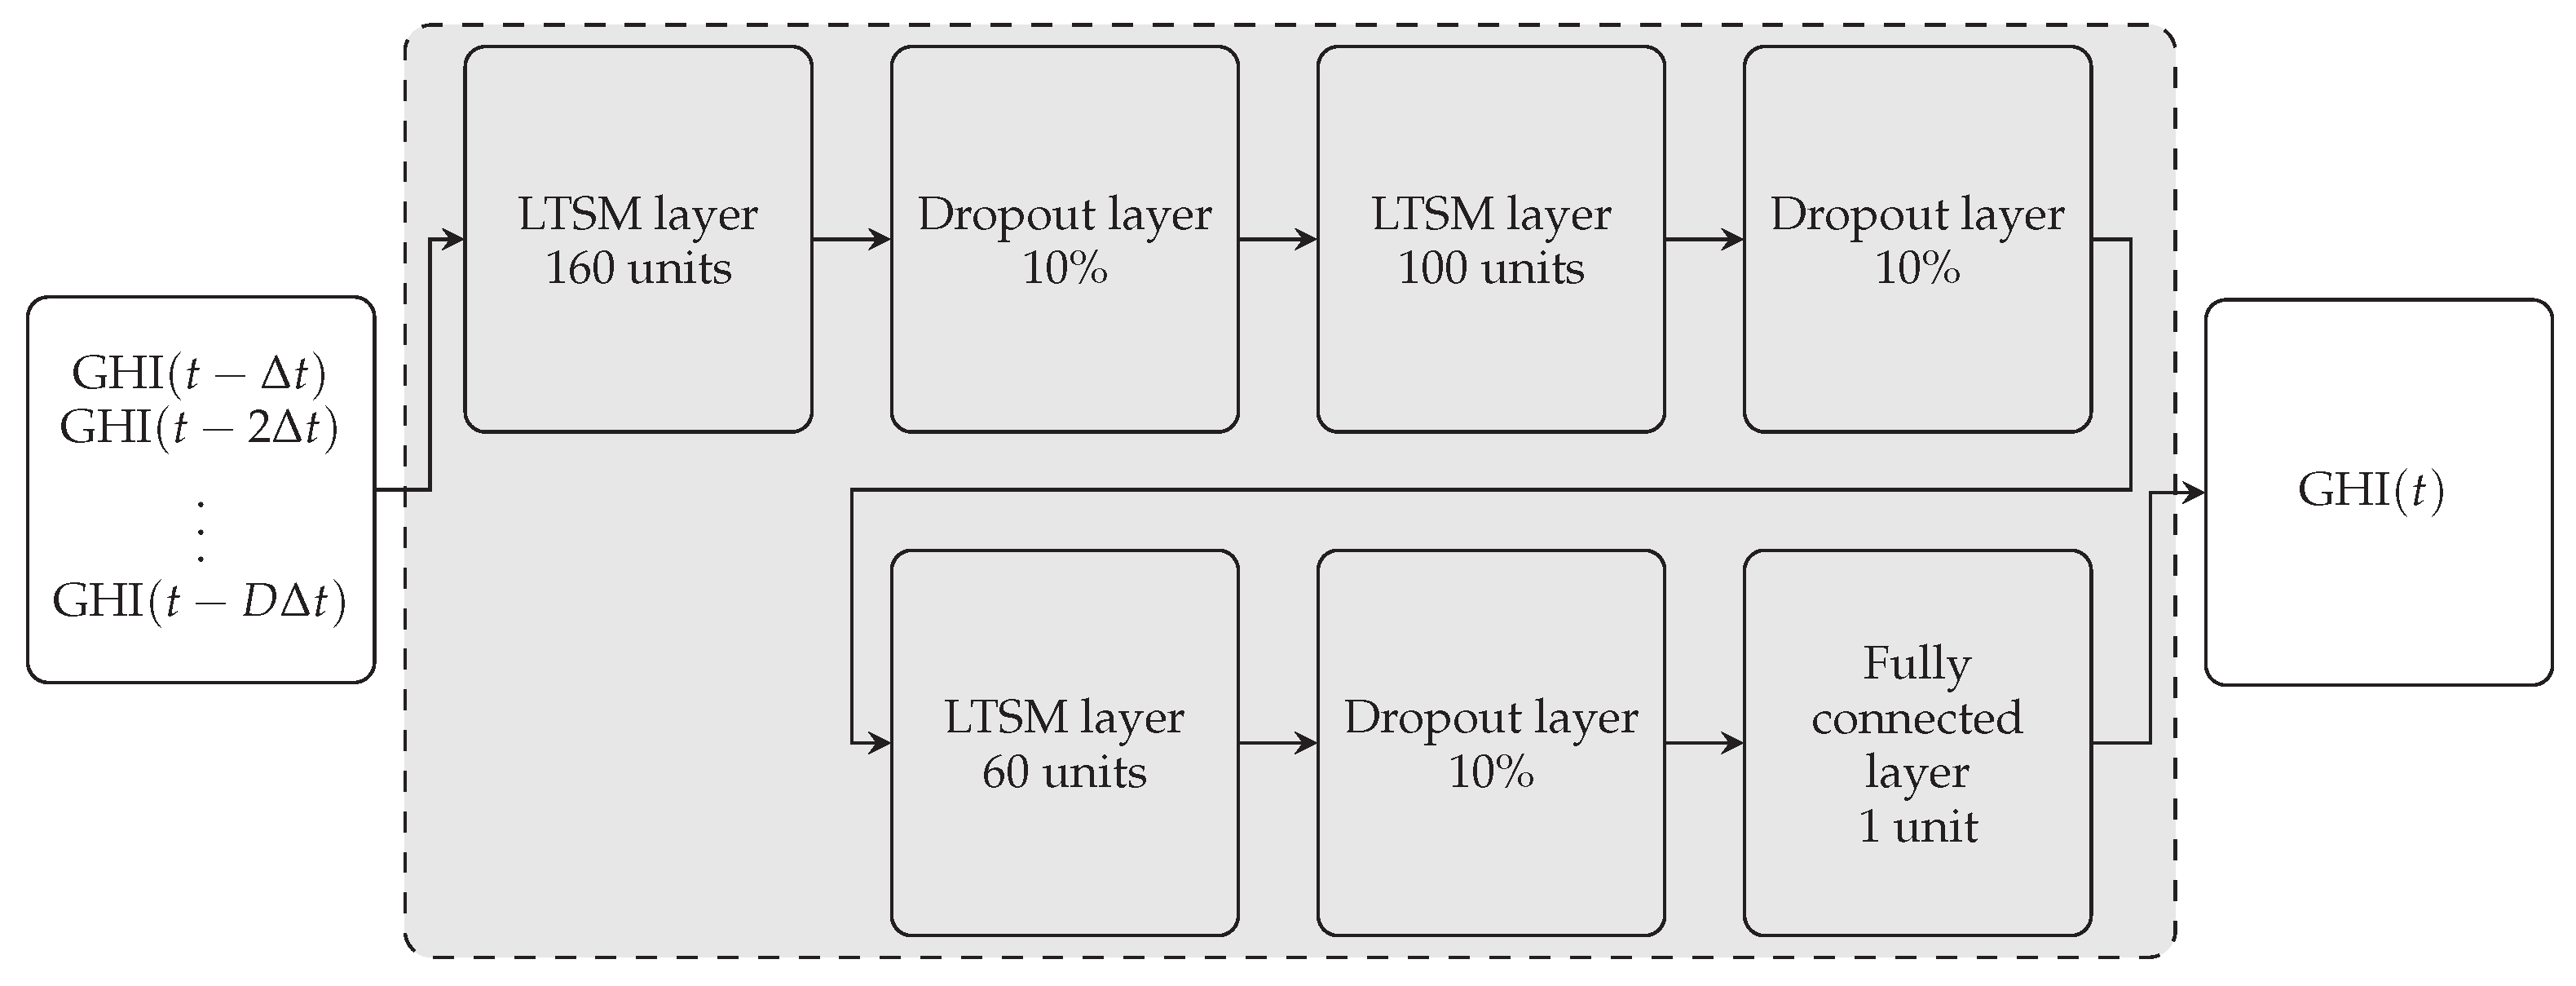
Figure 7 shows a graphical view of the LSTM model’s architecture for GHI forecasting.

3.4.3. Training Algorithm

Adam (for adaptive moment estimation), a well-known adaptive learning rate optimization algorithm [66], has been used to train both the MLP and LSTM neural networks. Adam performs first-order gradient-based optimization of stochastic objective functions, based on adaptive estimates of lower-order moments. It is computationally efficient, has very little memory requirements and is well suited for large problems in terms of data or parameters. It is also well suited for problems with very noisy or sparse gradients. Finally, the hyperparameters have intuitive interpretations and tuning is rather simple [66].
Dropout [67] works by probabilistically removing, or “dropping out”, inputs to a layer, which may be input variables in the data sample or activations from a previous layer. It has the effect of simulating a large number of networks with different topologies and, in turn, making neurons generally more robust to the inputs. Such a mechanism improves the generalization ability of deep artificial neural networks significantly, even though its computational cost is low, and reduces overfitting (which leads to improved generalization ability). That is why dropout is nowadays the most popular regularization method. Its main drawback is that training is slowed down and, usually, the number of epochs is increased.
For the MLP and LSTM models, we tried our best to optimize the results, and after testing many architectures we obtained the topologies depicted in Figure 6 and Figure 7.

4. Results

This section presents the results and is divided into two parts. The first part presents the criteria used to assess the models’ performance: the normalized root mean square error, the dynamic mean absolute error and the coverage width-based criterion. A discussion about the results based on the obtained criteria values and examples of forecasts shown in Figure 8, Figure 9 and Figure 10 is conducted in the second part.

4.1. Performance Criteria

The different models developed in this paper were compared using the popular root mean square error normalized by the mean of data (nRMSE):
nRMSE = 1 n * i = 1 n * y * i y ^ * i 2 1 n * i = 1 n * y * i
where y * R n * × 1 is the test data and y ^ * R n * × 1 is the forecast.
The nRMSE is a well-known criterion in the scientific literature and assesses the error between the forecasts and test data without giving an adequate quantification of the failures due to mismatches in the time index. Indeed, this temporal error can lead to the misestimation of some events, such as the production peak or ramps. That is why the dynamic mean absolute error (DMAE) [68], which accounts for temporal error (misalignments) and absolute magnitude error simultaneously, is also used to evaluate the models’ performance. The DMAE error is a trade-off between the temporal distorsion index and the mean absolute error. It involves two parameters: λ that determines the weight of the MAE for the considered temporal distortion and c that controls the allowed temporal distorsion. Herein, λ = 0.1 and c = 5%. For more details, the interested reader is referred to [68].
As the confidence intervals are calculated and displayed for all models, the quality of prediction intervals is assessed. Criteria such as the prediction interval coverage probability (PICP) or the prediction interval normalized average width (PINAW) can be used for the assessment of prediction intervals [69]. The PICP evaluates whether the target values lie within the constructed prediction intervals limits and is defined by [69]:
PICP = 1 n * i = 1 n * ϵ i
where n * is the number of test data and ϵ i is a Boolean variable, which is equal to 1 if the target value y * i lie within the prediction interval limits and 0 otherwise.
Mathematically, ϵ i is defined as follows:
ϵ i = 1 if y * i [ L i , U i ] , 0 if y * i [ L i , U i ] .
where y * i is a test datum and L i and U i are respectively the lower and upper bounds of the prediction interval.
The PINAW assesses the width of prediction intervals and is defined by [69]:
PINAW = 1 n * R i = 1 n * ( U i L i )
where R used for normalization is the difference between the maximum and minimum of the test data.
The assessment of prediction intervals based only on PICP criterion or PINAW index is inaccurate, as forecast with a large prediction interval can lead to a high PICP. However, such a forecast is not as well as another one that has a narrow prediction interval (small PINAW value) and a high PICP. That is why the combinational index of these two criteria proposed in [70], named coverage width-based criterion (CWC) that carries out information about the width and coverage probability of prediction intervals is interesting to evaluate the sharpness of the forecast. This index is defined by:
CWC = PINAW 1 + γ ( PICP ) · exp η · ( PICP μ )
where μ is the nominal confidence level associated with the prediction intervals, and η is a parameter that magnifies the difference between PICP and μ . Herein, η = 10 and μ = 0.95 . The function γ is defined by:
γ = 1 if PICP < μ 0 if PICP μ .
In this paper, besides the nRMSE and DMAE used to evaluate the models’ forecasting performance, the CWC was used to assess the quality of models’ prediction intervals. GPR naturally provides a predictive distribution, from which confidence intervals are obtained. However, the other considered methods—LS-SVR and ANN—do not. For LS-SVR, the method developed in [71] for construction of confidence intervals based on the central limit theorem for linear smoothers combined with bias correction and variance estimation is used to obtain the confidence intervals. Concerning the ANN models, the bootstrap method [72,73] that allows training neural networks with different parameter initializations in order to estimate the model uncertainty is used to quantify the uncertainty associated with the forecasts (here 30 repetitions were used for both the MLP and LSTM models).

4.2. Forecasting Results

The models’ forecasting skill was assessed by comparing the forecasts over different time horizons ranging from 10 min to 4 h . The aforementioned criteria were calculated for each horizon and for each model. Numerical results for the considered forecast horizons are stored in Table 2, Table 3 and Table 4.
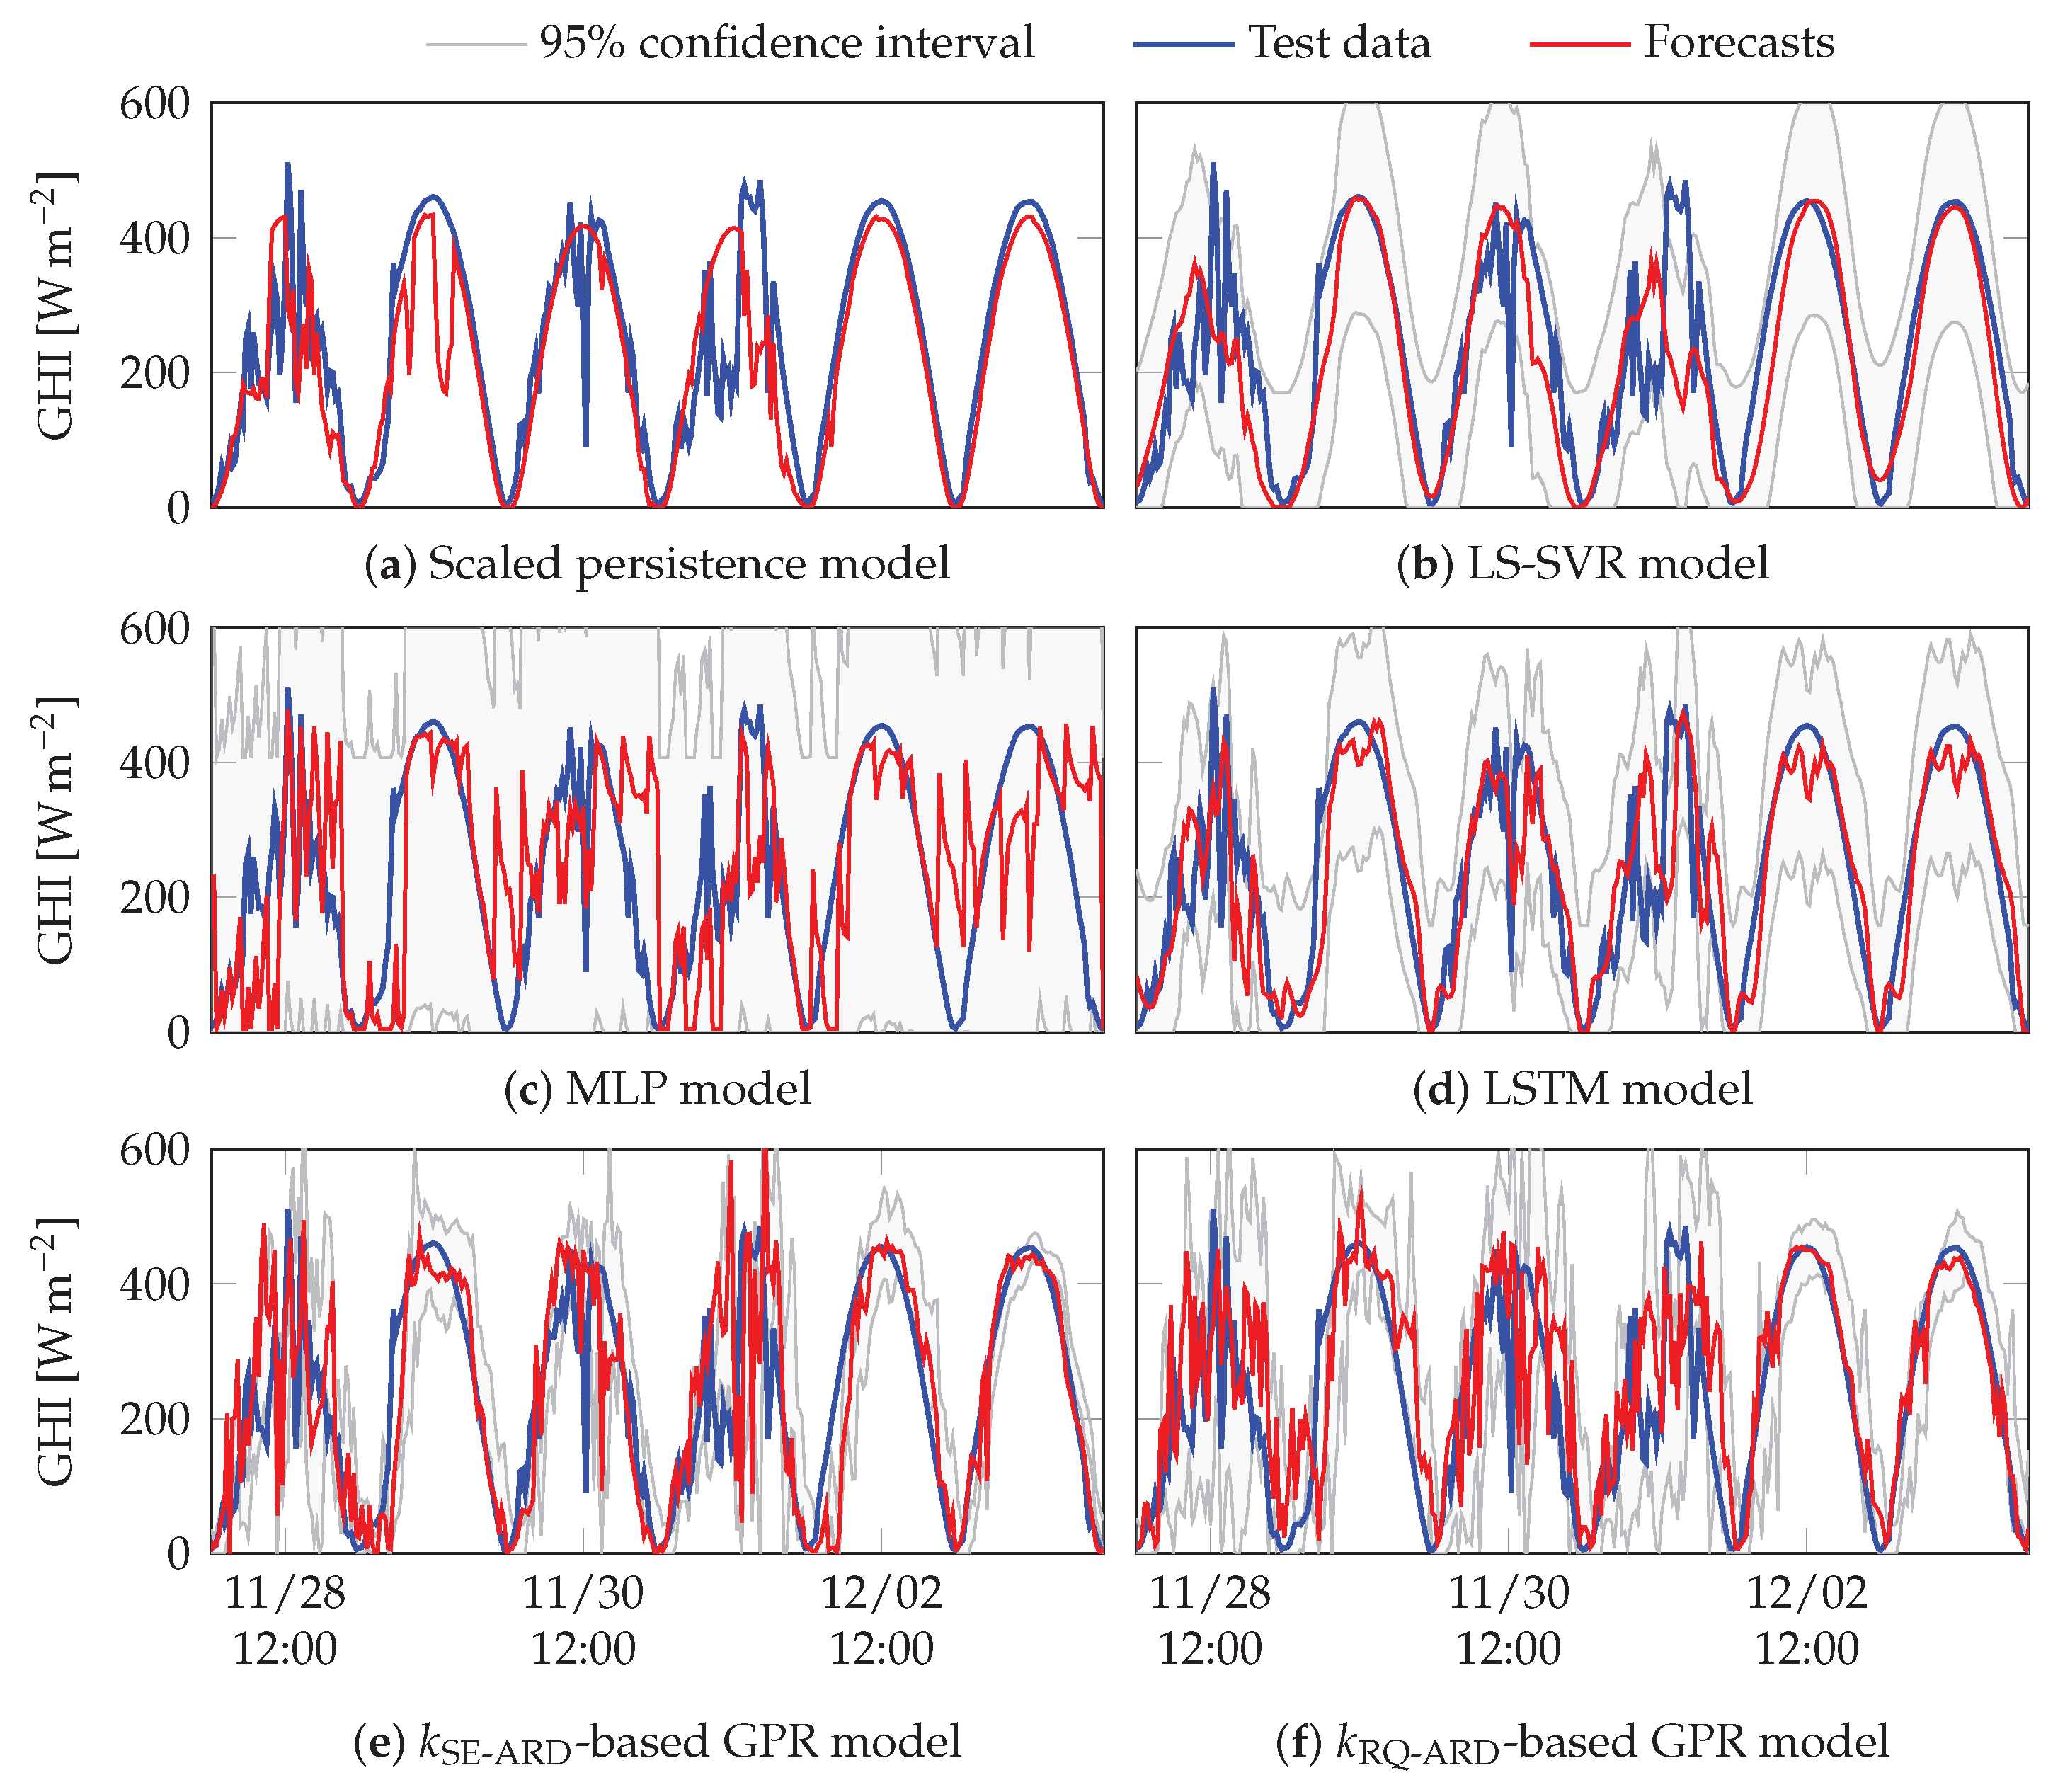
As can be seen in Table 2, at the lowest forecast horizon (10 min ), all the models developed in this study gave good and similar results, with a slight advantage to the ANN models, except the LS-SVR model which gave the worst result. As the forecast horizon increased, the superiority of the machine learning models became clear. They surpassed the scaled persistence model, whose performance degraded quickly as the forecast horizon increased. When looking at the nRMSE values of the machine learning models for all horizons, it can be noticed that the performances of these models were very similar, but the LSTM model and the GPR model based on k RQ - ARD kernel outperformed the others as the forecast horizon increased. Table 2 also shows that, at the lowest horizon (10 min ), the MLP model gave the best results but gave the worse results at the highest horizon (4 h ).
The values of DMAE for all models are stored in Table 3. Based on this criterion, the LS-SVR model and the scaled persistence model gave the worst results for all horizons compared to the other models. This criterion combined the temporal distorsion between the forecasts and test data with the absolute magnitude error. For lower horizons, the scaled persistence model gave good results according to its nRMSE values (Table 2) and its performance at the lowest horizon ( 10 min ) was practically similar to the performance of ANN models ( nRMSE = 20.20 % ) and slightly better than the performance of GPR models. However, there were some time lags between the forecasts given by the scaled persistence model and the test data (Figure 8, Figure 9 and Figure 10), which are reflected in its DMAE values. Table 3 shows that, at the lowest horizon, the MLP model gave the best results, but for all horizons, the best performing models were the LSTM model and k RQ - ARD -based GPR model.
Table 4 stores the CWC values for the LS-SVR, ANN, and GPR models. All these models gave high coverage probability at the lowest horizon (10 min ), with an advantage to the GPR model based on k RQ - ARD kernel which, besides, had narrow confidence intervals as demonstrated by its CWC value. When the forecast horizon increased, the quality and accuracy of forecasts degraded for each model. The rapid augmentation of the CWC values indicated these effects. At the highest forecast horizon (4 h ), the ANN models gave high PICP values, that is why they had small CWC values, but in terms of quality and accuracy of forecasts, when looking at the nRMSE values, the GPR model based on k RQ - ARD kernel ( nRMSE 0.40 ) was better than the MLP model ( nRMSE 0.44 ). The ANN models also had large confidence intervals at the highest horizon, which were reflected by their forecasts displayed in Figure 10. For each forecast horizon, the LS-SVR model gave the worst CWC value compared to the other models. As a result, by examining its confidence intervals combined with its nRMSE values, we can conclude that it was difficult for this model to follow its counterparts’ performances.
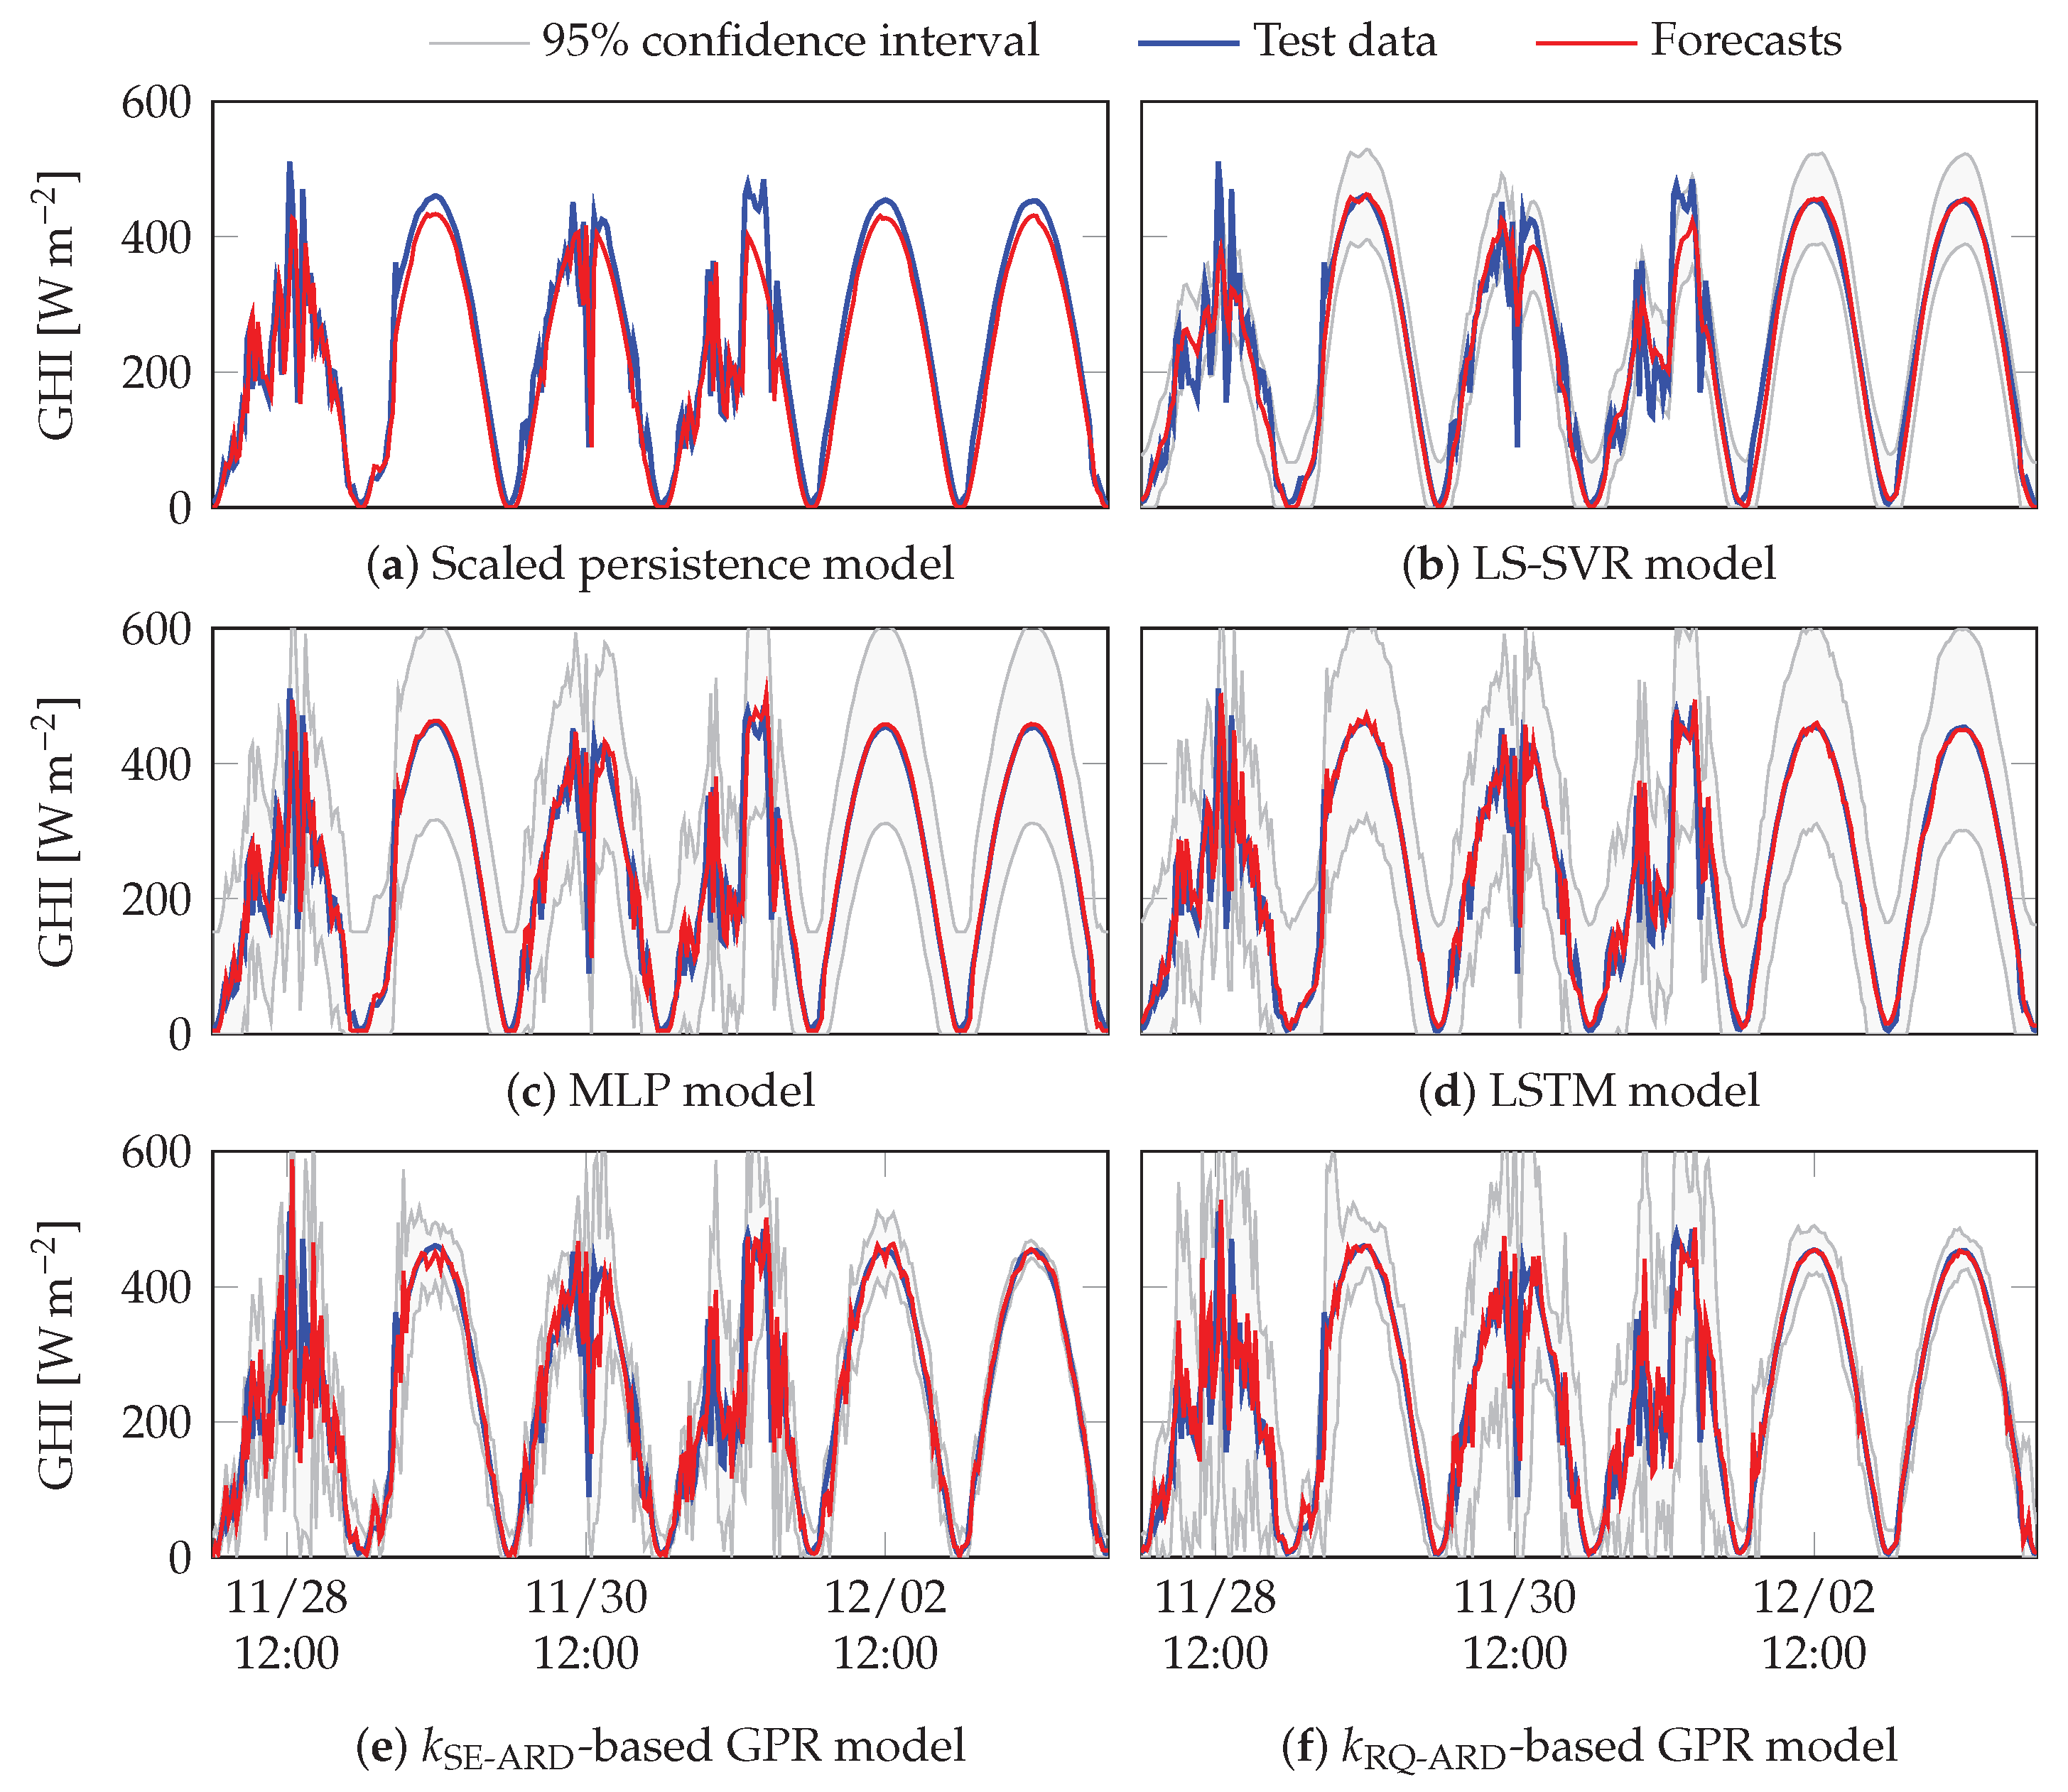
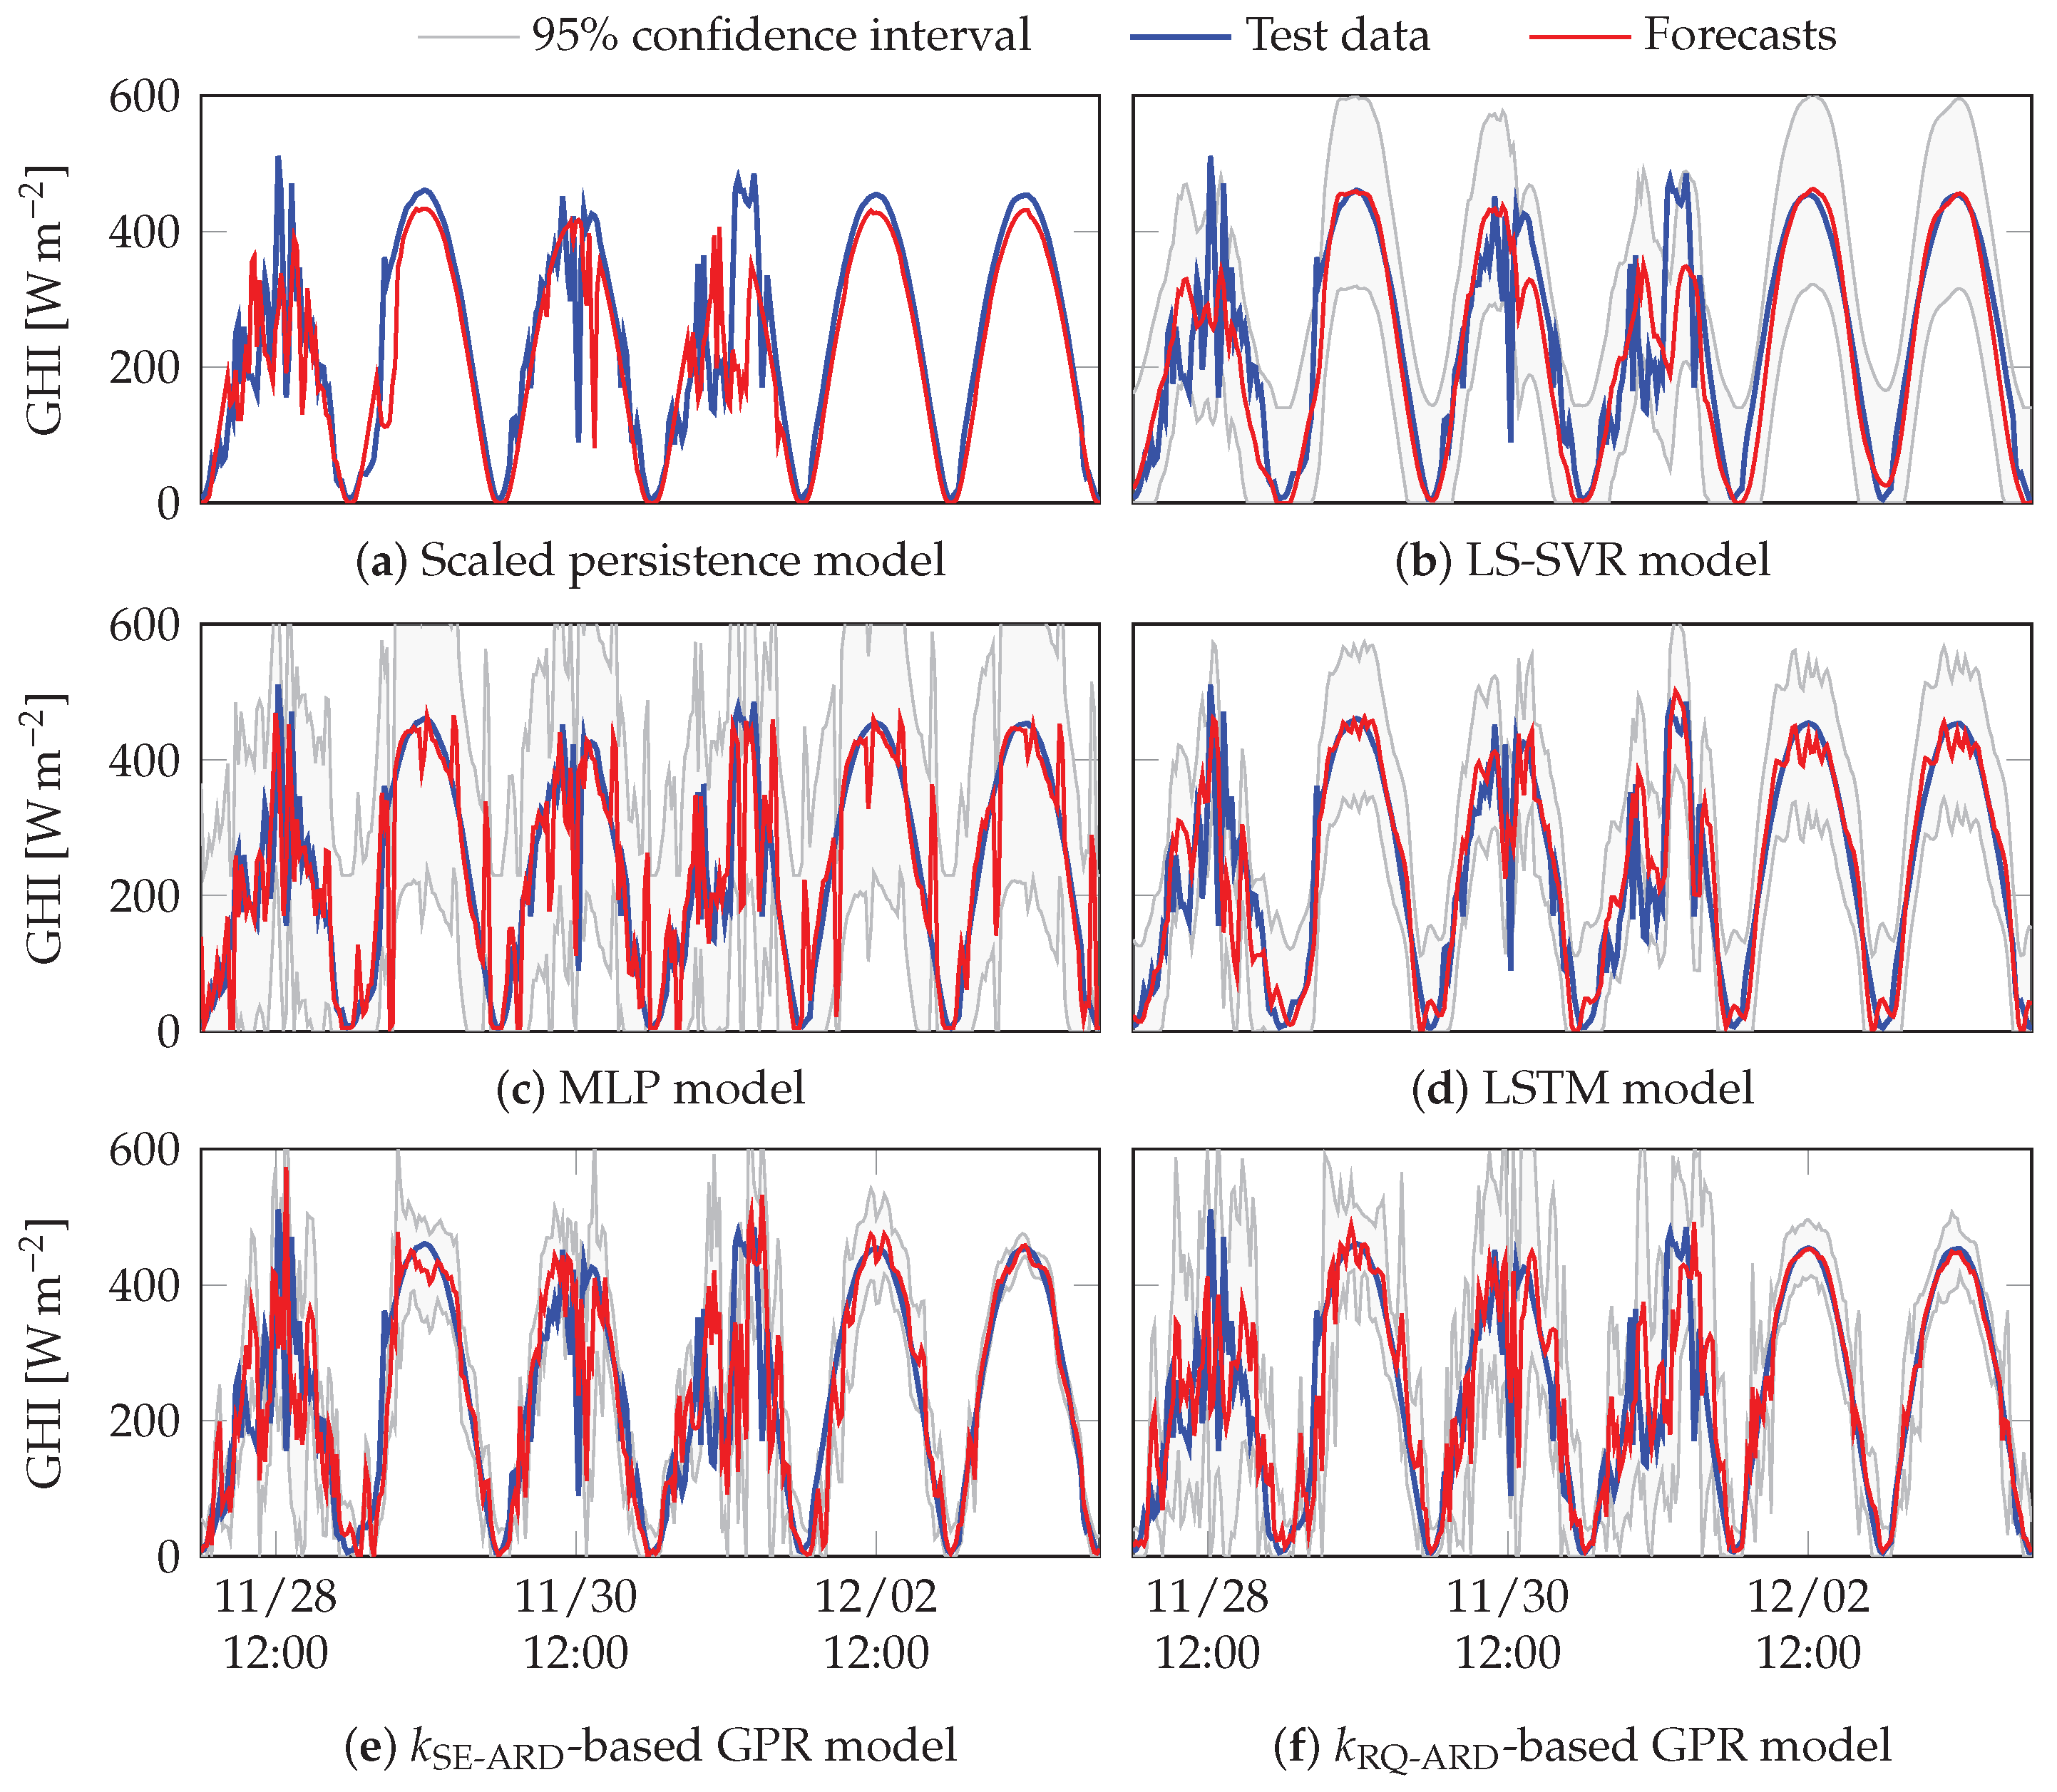
Some examples of 10 min , 1 h and 4 h forecasts are displayed in Figure 8, Figure 9 and Figure 10. A period of 6 days in the whole test database (from 28 November 2019 to 3 December 2019), having both clear and cloudy days, was chosen. At the lowest forecast horizon, the scaled persistence model was excellent, but when the horizon increased, its performance degraded quickly. Looking at Figure 8 for the lowest forecast horizon, all the models followed the trends in the test data quite well, except the LS-SVR model that did not predict well the patterns in overcast days. When the horizon increased, the performances of all forecasting models degraded. However, the figures show that the LSTM model and the GPR model based on k RQ - ARD kernel outperformed the other models. That is especially evident in Figure 10, at the highest forecast horizon, where despite the deterioration of their performances, these two models followed pretty well the trends in test data.
Figure 10 also shows that while the LSTM model gave better results than others during cloudy days, during clear days the GPR model based on k RQ - ARD kernel prevailed. The MLP model and the GPR model based on k SE - ARD did not follow well the trend of days when the forecast horizon increased. The LS-SVR model converged to a smooth signal at the highest forecast horizon. This was not surprising because its kernel was suitable for smooth functions’ representation and could not correctly model both large-scale and small-scale variations in the GHI signal. Among the ANN models, the LSTM model, which could learn long-term dependencies in the data, outperformed the MLP model. The large confidence intervals, when the forecast horizon got longer, demonstrated the models’ performance degradation.
When examining the models’ performances based on the obtained criteria values and examples of forecasts shown in Figure 8, Figure 9 and Figure 10, it yielded that the two best models for GHI forecasting were the GPR model based on k RQ - ARD kernel and the LSTM model. Indeed, these two models outperformed their counterparts considered in this study. However, as the LSTM model and the k RQ - ARD -based GPR model gave similar results, it was hardly easy to distinguish between them through this work. As the GHI data used in this paper exhibited more clear days than overcast days, one would tend to choose the GPR model based on k RQ - ARD kernel, which outperformed the LSTM model during clear days and gave less good results than the LSTM model during cloudy days, for GHI forecasting for our location (i.e., Font-Romeu-Odeillo-Via, in the Occitania region (southern France)).
Table 5 stores the models’ training time, the number of parameters involved in each model, and the time needed to perform one forecast for each model. Although many parameters were involved in ANN models, they were fast to train and their forecasts were almost instantaneous. Concerning GPR models, they were very time-consuming in the training phase and needed more time to provide forecasts. Indeed, the generation of a forecast by a GPR model required an inversion of a matrix as big as the training dataset is large. However, there are many sparse approaches in the literature [74] that can be used to reduce time complexity and memory requirement while keeping the same performances for an in situ implementation.

5. Conclusions

This paper aims to shed light on the use of machine learning to forecast global horizontal irradiance (from which photovoltaic power generation can be inferred) using endogenous data. To do so, a comparative study of popular machine learning methods (artificial neural networks, support vector regression and Gaussian process regression) for GHI forecasting is conducted at different time horizons, covering intrahour and intraday cases. The models are developed using a 2-year GHI database with a 10 min time step. Usually, in machine learning studies, the time step is 1 h , which leads to significant simplification of GHI dynamics. In addition, contrary to developing a specific model for each forecast horizon, as shown in many studies in the literature and which can be computationally demanding when many horizons are considered, we made the choice of multi-horizon forecasting models. The scaled persistence model is also included in the comparative study as a reference model. Two criteria, the dynamic mean absolute error (DMAE) and the coverage width-based criterion (CWC), are used in addition to the popular root mean square error normalized by the mean of data (nRMSE) in order to conduct an in-depth analysis of the models’ performance.
The results show that all the machine learning-based models outperform the scaled persistence model and among these models, the long short-term memory (LSTM) model and the k RQ - ARD -based GPR model outperform their counterparts. However, it is difficult to distinguish between these two models because their performances are very similar. The conclusion arising from the examination of the forecasts’ temporal evolution is that the LSTM model provides good forecasts for cloudy days, contrary to the case of clear-sky days where the k RQ - ARD -based GPR model outperforms the LSTM model.

Author Contributions

Methodology, S.G. (Shab Gbémou), S.T. and S.G. (Stéphane Grieu); formal analysis, S.G. (Shab Gbémou), S.T. and S.G. (Stéphane Grieu); investigation, S.G. (Shab Gbémou); resources, E.G.; writing—original draft preparation, S.G. (Shab Gbémou); writing—review and editing, S.T. and S.G. (Stéphane Grieu); supervision, J.E., S.T. and S.G. (Stéphane Grieu); project administration, S.G. (Stéphane Grieu); funding acquisition, S.G. (Stéphane Grieu). All authors have read and agreed to the published version of the manuscript.

Funding

This research was funded by the French agency for ecological transition (ADEME) and the Occitania Region (France).

Institutional Review Board Statement

Not applicable.

Informed Consent Statement

Not applicable.

Data Availability Statement

The data presented in this study are available on request from the corresponding author.

Acknowledgments

The authors would like to thank the French agency for ecological transition and the Occitania Region for their financial support. They also thank ENEDIS, the French distribution grid operator, and all the academic and industrial entities involved in the Smart Occitania project for their contribution to this work.

Conflicts of Interest

The authors declare no conflict of interest.

Abbreviations

The following abbreviations are used in this manuscript:
AMOptical air mass
ANNArtificial neural networks
ARAutoregressive model
ARDAutomatic relevance determination
CNNConvolutional neural networks
CWCCoverage width-based criterion
DMAEDynamic mean absolute error
DHIDiffuse horizontal irradiance
DNIDirect normal irradiance
GHIGlobal horizontal irradiance
GPGaussian process
GPRGaussian process regression
kNNk-nearest neighbours
LSTMLong short-term memory
(n)MAE(Normalized) mean absolute error
MAPEMean absolute prediction error
(n)MBE(Normalized) mean bias error
MLPMultilayer perceptron
MSEMean squared error
NWPNumerical weather prediction
PVPhotovoltaic
RBFRadial basis function
ReLURectified linear unit
(n)RMSE(Normalized) root mean square error
RQRational quadratic
SESquared exponential
SVMSupport vector machine
SVRSupport vector regression
(LS-)SVR(Least-squares) support vector regression

References

  1. Eltawil, M.A.; Zhao, Z. Grid-connected photovoltaic power systems: Technical and potential problems—A review. Renew. Sustain. Energy Rev. 2010, 14, 112–129. [Google Scholar] [CrossRef]
  2. Zahedi, A. A review of drivers, benefits, and challenges in integrating renewable energy sources into electricity grid. Renew. Sustain. Energy Rev. 2011, 15, 4775–4779. [Google Scholar] [CrossRef]
  3. Olowu, T.O.; Sundararajan, A.; Moghaddami, M.; Sarwat, A.I. Future Challenges and Mitigation Methods for High Photovoltaic Penetration: A Survey. Energies 2018, 11, 1782. [Google Scholar] [CrossRef] [Green Version]
  4. Nwaigwe, K.N.; Mutabilwa, P.; Dintwa, E. An overview of solar power (PV systems) integration into electricity grids. Mater. Sci. Energy Technol. 2019, 2, 629–633. [Google Scholar] [CrossRef]
  5. Sinsel, S.R.; Riemke, R.L.; Hoffmann, V.H. Challenges and solution technologies for the integration of variable renewable energy sources—a review. Renew. Energy 2020, 145, 2271–2285. [Google Scholar] [CrossRef]
  6. Dkhili, N.; Eynard, J.; Thil, S.; Grieu, S. A survey of modelling and smart management tools for power grids with prolific distributed generation. Sustain. Energy Grids Netw. 2020, 21, 100284. [Google Scholar] [CrossRef]
  7. Manjarres, D.; Alonso, R.; Gil-Lopez, S.; Landa-Torres, I. Solar Energy Forecasting and Optimization System for Efficient Renewable Energy Integration. In Data Analytics for Renewable Energy Integration: Informing the Generation and Distribution of Renewable Energy; Woon, W.L., Aung, Z., Kramer, O., Madnick, S., Eds.; Springer International Publishing: Cham, Switzerland, 2017; pp. 1–12. [Google Scholar]
  8. Kroposki, B. Integrating high levels of variable renewable energy into electric power systems. J. Mod. Power Syst. Clean Energy 2017, 5, 831–837. [Google Scholar] [CrossRef] [Green Version]
  9. Ahmed, R.; Sreeram, V.; Mishra, Y.; Arif, M.D. A review and evaluation of the state-of-the-art in PV solar power forecasting: Techniques and optimization. Renew. Sustain. Energy Rev. 2020, 124, 109792. [Google Scholar] [CrossRef]
  10. Lorenz, E.; Heinemann, D. Prediction of solar irradiance and photovoltaic power. In Comprehensive Renewable Energy; Sayigh, A., Ed.; Elsevier: Oxford, UK, 2012; pp. 239–292. [Google Scholar] [CrossRef]
  11. Inman, R.H.; Pedro, H.T.C.; Coimbra, C.F.M. Solar forecasting methods for renewable energy integration. Prog. Energy Combust. Sci. 2013, 39, 535–576. [Google Scholar] [CrossRef]
  12. Diagne, M.; David, M.; Lauret, P.; Boland, J.; Schmutz, N. Review of solar irradiance forecasting methods and a proposition for small-scale insular grids. Renew. Sustain. Energy Rev. 2013, 27, 65–76. [Google Scholar] [CrossRef] [Green Version]
  13. Lauret, P.; Voyant, C.; Soubdhan, T.; David, M.; Poggi, P. A benchmarking of machine learning techniques for solar radiation forecasting in an insular context. Sol. Energy 2015, 112, 446–457. [Google Scholar] [CrossRef] [Green Version]
  14. Antonanzas, J.; Osorio, N.; Escobar, R.; Urraca, R.; de Pison, F.J.M.; Antonanzas-Torres, F. Review of photovoltaic power forecasting. Sol. Energy 2016, 136, 78–111. [Google Scholar] [CrossRef]
  15. Ahmed, A.; Khalid, M. A review on the selected applications of forecasting models in renewable power systems. Renew. Sustain. Energy Rev. 2019, 100, 9–21. [Google Scholar] [CrossRef]
  16. Yang, H.; Kurtz, B.; Nguyen, D.; Urquhart, B.; Chow, C.W.; Ghonima, M.; Kleissl, J. Solar irradiance forecasting using a ground-based sky imager developed at UC San Diego. Sol. Energy 2014, 103, 502–524. [Google Scholar] [CrossRef]
  17. Nou, J.; Chauvin, R.; Eynard, J.; Thil, S.; Grieu, S. Towards the intrahour forecasting of direct normal irradiance using sky-imaging data. Heliyon 2018, 4, e00598. [Google Scholar] [CrossRef] [Green Version]
  18. Wang, P.; van Westrhenen, R.; Meirink, J.F.; van der Veen, S.; Knap, W. Surface solar radiation forecasts by advecting cloud physical properties derived from Meteosat Second Generation observations. Sol. Energy 2019, 177, 47–58. [Google Scholar] [CrossRef]
  19. Mathiesen, P.; Collier, C.; Kleissl, J. A high-resolution, cloud-assimilating numerical weather prediction model for solar irradiance forecasting. Sol. Energy 2013, 92, 47–61. [Google Scholar] [CrossRef] [Green Version]
  20. Gala, Y.; Fernández, A.; Díaz, J.; Dorronsoro, J.R. Hybrid machine learning forecasting of solar radiation values. Neurocomputing 2016, 176, 48–59. [Google Scholar] [CrossRef]
  21. Hocaoglu, F.O.; Serttas, F. A novel hybrid (Mycielski-Markov) model for hourly solar radiation forecasting. Renew. Energy 2017, 108, 635–643. [Google Scholar] [CrossRef]
  22. Guermoui, M.; Melgani, F.; Gairaa, K.; Mekhalfi, M.L. A comprehensive review of hybrid models for solar radiation forecasting. J. Clean. Prod. 2020, 258, 120357. [Google Scholar] [CrossRef]
  23. Chandola, D.; Gupta, H.; Tikkiwal, V.A.; Bohra, M.K. Multi-step ahead forecasting of global solar radiation for arid zones using deep learning. Procedia Comput. Sci. 2020, 167, 626–635. [Google Scholar] [CrossRef]
  24. Tolba, H.; Dkhili, N.; Nou, J.; Eynard, J.; Thil, S.; Grieu, S. Multi-Horizon Forecasting of Global Horizontal Irradiance Using Online Gaussian Process Regression: A Kernel Study. Energies 2020, 13, 4184. [Google Scholar] [CrossRef]
  25. Gbémou, S.; Tolba, H.; Thil, S.; Grieu, S. Global horizontal irradiance forecasting using online sparse Gaussian process regression based on quasiperiodic kernels. In Proceedings of the 2019 IEEE International Conference on Environment and Electrical Engineering and 2019 IEEE Industrial and Commercial Power Systems Europe (EEEIC/ICPS Europe), Genova, Italy, 11–14 June 2019; pp. 1–6. [Google Scholar]
  26. Benali, L.; Notton, G.; Fouilloy, A.; Voyant, C.; Dizene, R. Solar radiation forecasting using artificial neural network and random forest methods: Application to normal beam, horizontal diffuse and global components. Renew. Energy 2019, 132, 871–884. [Google Scholar] [CrossRef]
  27. Inanlouganji, A.; Reddy, A.T.; Katipamula, S. Evaluation of regression and neural network models for solar forecasting over different short-term horizons. Sci. Technol. Built Environ. 2018, 24, 1004–1013. [Google Scholar] [CrossRef]
  28. Sharifzadeh, M.; Sikinioti-Lock, A.; Shah, N. Machine-learning methods for integrated renewable power generation: A comparative study of artificial neural networks, support vector regression, and Gaussian process regression. Renew. Sustain. Energy Rev. 2019, 108, 513–538. [Google Scholar] [CrossRef]
  29. Nou, J.; Chauvin, R.; Thil, S.; Grieu, S. A new approach to the real-time assessment of the clear-sky direct normal irradiance. Appl. Math. Model. 2016, 40, 7245–7264. [Google Scholar] [CrossRef] [Green Version]
  30. Sfetsos, A.; Coonick, A.H. Univariate and multivariate forecasting of hourly solar radiation with artificial intelligence techniques. Sol. Energy 2000, 68, 169–178. [Google Scholar] [CrossRef]
  31. Alzahrani, A.; Shamsi, P.; Dagli, C.; Ferdowsi, M. Solar Irradiance Forecasting Using Deep Neural Networks. Procedia Comput. Sci. 2017, 114, 304–313. [Google Scholar] [CrossRef]
  32. Voyant, C.; Muselli, M.; Paoli, C.; Nivet, M.L. Numerical weather prediction (NWP) and hybrid ARMA/ANN model to predict global radiation. Energy 2012, 39, 341–355. [Google Scholar] [CrossRef] [Green Version]
  33. Bae, K.Y.; Jang, H.S.; Sung, D.K. Hourly Solar Irradiance Prediction Based on Support Vector Machine and Its Error Analysis. IEEE Trans. Power Syst. 2017, 32, 935–945. [Google Scholar] [CrossRef]
  34. Feng, C.; Zhang, J. SolarNet: A sky image-based deep convolutional neural network for intra-hour solar forecasting. Sol. Energy 2020, 204, 71–78. [Google Scholar] [CrossRef]
  35. Ghimire, S.; Deo, R.C.; Raj, N.; Mi, J. Deep solar radiation forecasting with convolutional neural network and long short-term memory network algorithms. Appl. Energy 2019, 253, 113541. [Google Scholar] [CrossRef]
  36. Voyant, C.; Notton, G.; Kalogirou, S.; Nivet, M.L.; Paoli, C.; Motte, F.; Fouilloy, A. Machine learning methods for solar radiation forecasting: A review. Renew. Energy 2017, 105, 569–582. [Google Scholar] [CrossRef]
  37. Duvenaud, D.; Lloyd, J.; Grosse, R.; Tenenbaum, J.; Zoubin, G. Structure Discovery in Nonparametric Regression through Compositional Kernel Search. In Proceedings of the 30th International Conference on Machine Learning, 16–21 June 2013; Dasgupta, S., McAllester, D., Eds.; PMLR: Atlanta, GA, USA, 2013; Volume 28, pp. 1166–1174. [Google Scholar]
  38. Rasmussen, C.E.; Williams, C.K.I. Gaussian Processes for Machine Learning; MIT Press: Cambridge, MA, USA, 2006. [Google Scholar]
  39. Suykens, J.A.K.; Van Gestel, T.; De Brabanter, J.; De Moor, B.; Vandewalle, J. Least Squares Support Vector Machines; World Scientific: Singapore, 2002. [Google Scholar] [CrossRef]
  40. Antonanzas-Torres, F.; Urraca, R.; Polo, J.; Perpiñán-Lamigueiro, O.; Escobar, R. Clear sky solar irradiance models: A review of seventy models. Renew. Sustain. Energy Rev. 2019, 107, 374–387. [Google Scholar] [CrossRef]
  41. Chauvin, R.; Nou, J.; Eynard, J.; Thil, S.; Grieu, S. A new approach to the real-time assessment and intraday forecasting of clear-sky direct normal irradiance. Sol. Energy 2018, 167, 35–51. [Google Scholar] [CrossRef]
  42. Ineichen, P.; Perez, R. A new airmass independent formulation for the Linke turbidity coefficient. Sol. Energy 2002, 73, 151–157. [Google Scholar] [CrossRef] [Green Version]
  43. Kasten, F.; Young, A.T. Revised optical air mass tables and approximation formula. Appl. Opt. 1989, 28, 4735–4738. [Google Scholar] [CrossRef] [PubMed]
  44. Roberts, S.; Osborne, M.; Ebden, M.; Reece, S.; Gibson, N.; Aigrain, S. Gaussian processes for time-series modelling. Philos. Trans. R. Soc. A Math. Phys. Eng. Sci. 2013, 371, 20110550. [Google Scholar] [CrossRef]
  45. Duvenaud, D.K.; Nickisch, H.; Rasmussen, C.E. Additive Gaussian Processes. In Advances in Neural Information Processing Systems 24; Shawe-Taylor, J., Zemel, R.S., Bartlett, P.L., Pereira, F., Weinberger, K.Q., Eds.; Curran Associates, Inc.: Red Hook, NY, USA, 2011; pp. 226–234. [Google Scholar]
  46. Micchelli, C.; Xu, Y.; Zhang, H. Universal Kernels. Mathematics 2006, 7, 2651–2667. [Google Scholar]
  47. MacKay, D.J.C. Introduction to Gaussian processes. In Neural Networks and Machine Learning; Bishop, C.M., Ed.; Springer: Berlin/Heidenberg, Germany, 1998; Chapter 11; pp. 133–165. [Google Scholar]
  48. Chen, Z.; Wang, B. How priors of initial hyperparameters affect Gaussian process regression models. Neurocomputing 2018, 275, 1702–1710. [Google Scholar] [CrossRef] [Green Version]
  49. Vapnik, V.N. The Nature of Statistical Learning Theory; Springer: Berlin/Heidelberg, Germany, 1995. [Google Scholar]
  50. Vapnik, V.N.; Golowich, S.E.; Smola, A.J. Support Vector Method for Function Approximation, Regression Estimation and Signal Processing. In Advances in Neural Information Processing Systems 9; Mozer, M.C., Jordan, M.I., Petsche, T., Eds.; MIT Press: Cambridge, MA, USA, 1997; pp. 281–287. [Google Scholar]
  51. Drucker, H.; Burges, C.J.C.; Kaufman, L.; Smola, A.J.; Vapnik, V.N. Support Vector Regression Machines. In Advances in Neural Information Processing Systems 9; Mozer, M.C., Jordan, M.I., Petsche, T., Eds.; MIT Press: Cambridge, MA, USA, 1997; pp. 155–161. [Google Scholar]
  52. Burges, C.J.C. A Tutorial on Support Vector Machines for Pattern Recognition. Data Min. Knowl. Discov. 1998, 2, 121–167. [Google Scholar] [CrossRef]
  53. Smola, A.J.; Schölkopf, B. A tutorial on support vector regression. Stat. Comput. 2004, 14, 199–222. [Google Scholar] [CrossRef] [Green Version]
  54. Vapnik, V.N.; Lerner, A. Pattern Recognition using Generalized Portrait Method. Autom. Remote Control 1963, 24, 774–780. [Google Scholar]
  55. Cristianini, N.; Shawe-Taylor, J. An Introduction to Support Vector Machines and Other Kernel-based Learning Methods; Cambridge University Press: Cambridge, UK, 2000. [Google Scholar] [CrossRef]
  56. Suykens, J.; Horváth, G.; Basu, S.; Micchelli, C.; Vandewalle, J. Advances in Learning Theory: Methods, Models and Applications; IOS Press: Amsterdam, The Netherlands, 2003; Volume 190. [Google Scholar]
  57. Zhang, G.P. Neural Networks for Time-Series Forecasting. In Handbook of Natural Computing; Rozenberg, G., Bäck, T., Kok, J.N., Eds.; Springer: Berlin/Heidelberg, Germany, 2012; pp. 461–477. [Google Scholar] [CrossRef]
  58. Reddy, K.S.; Ranjan, M. Solar resource estimation using artificial neural networks and comparison with other correlation models. Energy Convers. Manag. 2003, 44, 2519–2530. [Google Scholar] [CrossRef]
  59. Amrouche, B.; Pivert, X.L. Artificial neural network based daily local forecasting for global solar radiation. Appl. Energy 2014, 130, 333–341. [Google Scholar] [CrossRef]
  60. Brownlee, J. Deep Learning for Time Series Forecasting: Predict the Future with MLPs, CNNs and LSTMs in Python; Machine Learning Mastery, 2018; Available online: https://machinelearningmastery.com/deep-learning-for-time-series-forecasting/ (accessed on 2 June 2012).
  61. Siami-Namini, S.; Tavakoli, N.; Siami Namin, A. A Comparison of ARIMA and LSTM in Forecasting Time Series. In Proceedings of the 2018 17th IEEE International Conference on Machine Learning and Applications (ICMLA), Orlando, FL, USA, 17–20 December 2018; pp. 1394–1401. [Google Scholar] [CrossRef]
  62. Hochreiter, S.; Schmidhuber, J. Long Short-Term Memory. Neural Comput. 1997, 9, 1735–1780. [Google Scholar] [CrossRef] [PubMed]
  63. Pascanu, R.; Mikolov, T.; Bengio, Y. On the difficulty of training recurrent neural networks. In Proceedings of the 30th International Conference on Machine Learning Research, 16–21 June 2013; Dasgupta, S., McAllester, D., Eds.; PMLR: Atlanta, GA, USA, 2013; Volume 28, pp. 1310–1318. [Google Scholar]
  64. Hochreiter, S. The Vanishing Gradient Problem during Learning Recurrent Neural Nets and Problem Solutions. Int. J. Uncertain. Fuzziness Knowl. Based Syst. 1998, 6, 107–116. [Google Scholar] [CrossRef] [Green Version]
  65. Gers, F.A.; Schmidhuber, J.; Cummins, F. Learning to Forget: Continual Prediction with LSTM. Neural Comput. 2000, 12, 2451–2471. [Google Scholar] [CrossRef] [PubMed]
  66. Kingma, D.P.; Ba, J. Adam: A Method for Stochastic Optimization. In Proceedings of the 3rd International Conference on Learning Representations, ICLR 2015, San Diego, CA, USA, 7–9 May 2015. [Google Scholar]
  67. Hinton, G.E.; Srivastava, N.; Krizhevsky, A.; Sutskever, I.; Salakhutdinov, R. Improving neural networks by preventing co-adaptation of feature detectors. Comput. Res. Repos. (CoRR) 2012, arXiv:1207.0580v1. [Google Scholar]
  68. Frías-Paredes, L.; Mallor, F.; Gastón-Romeo, M.; León, T. Dynamic mean absolute error as new measure for assessing forecasting errors. Energy Convers. Manag. 2018, 162, 176–188. [Google Scholar] [CrossRef]
  69. Quan, H.; Srinivasan, D.; Khosravi, A. Short-Term Load and Wind Power Forecasting Using Neural Network-Based Prediction Intervals. IEEE Trans. Neural Netw. Learn. Syst. 2014, 25, 303–315. [Google Scholar] [CrossRef] [PubMed]
  70. Khosravi, A.; Nahavandi, S.; Creighton, D.; Atiya, A.F. Lower Upper Bound Estimation Method for Construction of Neural Network-Based Prediction Intervals. IEEE Trans. Neural Netw. 2011, 22, 337–346. [Google Scholar] [CrossRef] [PubMed]
  71. De Brabanter, K.; De Brabanter, J.; Suykens, J.A.K.; De Moor, B. Approximate Confidence and Prediction Intervals for Least Squares Support Vector Regression. IEEE Trans. Neural Netw. 2011, 22, 110–120. [Google Scholar] [CrossRef] [PubMed]
  72. Khosravi, A.; Nahavandi, S.; Creighton, D.C.; Atiya, A.F. Comprehensive Review of Neural Network-Based Prediction Intervals and New Advances. IEEE Trans. Neural Netw. 2011, 22, 1341–1356. [Google Scholar] [CrossRef] [PubMed]
  73. Pearce, T.; Brintrup, A.; Zaki, M.; Neely, A. High-Quality Prediction Intervals for Deep Learning: A Distribution-Free, Ensembled Approach. In Proceedings of the 35th International Conference on Machine Learning Research, Stockholm Sweden, 10–15 July 2018; Dy, J., Krause, A., Eds.; PMLR Stockholmsmässan: Stockholm, Sweden, 2018; Volume 80, pp. 4075–4084. [Google Scholar]
  74. Quiñonero-Candela, J.; Rasmussen, C.E. A Unifying View of Sparse Approximate Gaussian Process Regression. J. Mach. Learn. Res. 2005, 6, 1939–1959. [Google Scholar]
Figure 1. Difference in GHI dynamics between 10 min and 1 h time steps. Measurements are taken at PROMES-CNRS laboratory, located in Odeillo-Font-Romeu (Occitania region, southern France).
Energies 14 03192 g001
Figure 2. GHI data covering the years 2018 and 2019. Measurements are taken at PROMES-CNRS laboratory, located in Font-Romeu-Odeillo-Via (Occitania region, southern France).
Energies 14 03192 g002
Figure 3. GPR forecasting model based on the SE-ARD kernel k SE - ARD . GHI ( t Δ t ) , GHI ( t 2 Δ t ) , ⋯, GHI ( t D Δ t ) is the observation set and Δ t = 10 min is the time step.
Energies 14 03192 g003
Figure 4. GPR forecasting model based on the RQ-ARD kernel k RQ - ARD . GHI ( t Δ t ) , GHI ( t 2 Δ t ) , ⋯, GHI ( t D Δ t ) is the observation set and Δ t = 10 min is the time step.
Energies 14 03192 g004
Figure 5. LS-SVR forecasting model based on the RBF kernel. GHI ( t Δ t ) , GHI ( t 2 Δ t ) , ⋯, GHI ( t D Δ t ) is the observation set and Δ t = 10 min is the time step.
Energies 14 03192 g005
Figure 6. MLP forecasting model: the network’s topology is defined as a combination of hidden and dropout layers. The output layer provides the forecast. GHI ( t Δ t ) , GHI ( t 2 Δ t ) , ⋯, GHI ( t D Δ t ) is the observation set and Δ t = 10 min is the time step.
Energies 14 03192 g006
Figure 7. LSTM forecasting model: the network’s topology is defined as a combination of LSTM and dropout layers. The fully connected layer provides the forecast. GHI ( t Δ t ) , GHI ( t 2 Δ t ) , ⋯, GHI ( t D Δ t ) is the observation set and Δ t = 10 min is the time step.
Energies 14 03192 g007
Figure 8. Examples of 10 min forecasts of GHI given by the models included in the comparative study.
Energies 14 03192 g008
Figure 9. Examples of 1 h forecasts of GHI given by the models included in the comparative study.
Energies 14 03192 g009
Figure 10. Examples of 4 h forecasts of GHI given by the models included in the comparative study.
Energies 14 03192 g010
Table 1. Main recent comparative studies using machine learning methods. For the meaning of abbreviations, see at the end of the paper.
  AuthorsForecast HorizonsForecasting MethodsData Time StepPerformance Criteria Input VariablesOutput Variables Database
Sharifzadeh et al. [28] 1   h to 6   h ANN, SVR, GPR 1   h MSEPV power, temperature, DHI, DNIPV powerFrom 1985 to 2014
Benali et al. [26] 1   h to 6   h Scaled persistence, MLP, Random forest 1   h RMSE, nRMSE, MAE, nMAEGHI, DNI, DHIGHI, DNI, DHIData covering three years
Chandola et al. [23] 3   h to 24   h LSTM 3   h RMSE, MAPEDHI, DNI, dew point, temperature, pressure, relative humidity, wind direction, wind speedGHIFrom 2010 to 2014
Lauret et al. [13] 1   h to 6   h Persistence, scaled persistence, AR, MLP, SVR, GPR 1   h nRMSE, nMAE, nMBE, s-skill scoreClear sky indexClear sky indexThree sites; for each site, one-year data for training and one-year data for test
Tolba et al. [24] 30   min to 48   h Persistence, GPR 30   min nRMSETimeGHITwo datasets, each covering a period of 45 days; 30 days for training and 15 days for test
Gbémou et al. (present paper) 10   min to 4   h Scaled persistence, MLP, LSTM, LS-SVR, GPR 10   min nRMSE, DMAE, CWCGHIGHIOne-year data for training and one-year data for test
Table 2. nRMSE values for all the models included in the comparative study.
Forecast Horizon10 min 1 h 4 h
Scaled persistence0.20200.34350.4628
LS-SVR0.21970.33050.4317
LSTM0.20160.30890.3995
MLP0.19850.32100.4449
k RQ - ARD -based GPR0.20570.31400.4020
k SE - ARD -based GPR0.20790.32870.4285
Table 3. DMAE values for all the models included in the comparative study.
Forecast Horizon10 min 1 h 4 h
Scaled persistence0.049510.082010.13481
LS-SVR0.055820.084630.14753
LSTM0.033170.055870.08956
MLP0.029480.072480.15173
k RQ - ARD -based GPR0.034190.056770.08912
k SE - ARD -based GPR0.044160.067180.09816
Table 4. CWC values (lower is better) for all the models included in the comparative study.
Forecast Horizon10 min 1 h 4 h
LS-SVR0.56601.11369.8391
LSTM0.47340.82832.1642
MLP0.46090.70312.2884
k RQ - ARD -based GPR0.45740.60262.8651
k SE - ARD -based GPR0.49660.76108.8394
Table 5. Comparison of models’ computation time and complexity (number of parameters).
ModelTraining Time ( min )Number of ParametersExecution Time for One Forecast ( s )
LS-SVR13326,4574.12
LSTM20127,4590.05
MLP1058,6350.02
k RQ - ARD -based GPR20926,45712.59
k SE - ARD -based GPR20026,45712.59
Publisher’s Note: MDPI stays neutral with regard to jurisdictional claims in published maps and institutional affiliations.