Article

Factors for Bioeconomy Development in EU Countries with Different Overall Levels of Economic Development

by
Andrzej Czyżewski
1,
Andrzej Grzyb
2,
Anna Matuszczak
3,* and
Mariola Michałowska
1
1
Faculty of Economics and Management, University of Zielona Góra, ul. Podgórna 50, 65-246 Zielona Góra, Poland
2
The Polish Parliament, Kancelaria Sejmu, ul. Wiejska 4/6/8, 00-902 Warszawa, Poland
3
Department of Macroeconomics and Agricultural Economics, Institute of Economics, Poznań University of Economics and Business, al. Niepodległości 10, 61-875 Poznań, Poland
*
Author to whom correspondence should be addressed.
Energies 2021, 14(11), 3182; https://doi.org/10.3390/en14113182
Submission received: 11 May 2021 / Revised: 25 May 2021 / Accepted: 26 May 2021 / Published: 29 May 2021
(This article belongs to the Special Issue Economic Aspects of Low Carbon Development)

Abstract

:
The aim of this article is to indicate the rationale for the development of the bioeconomy in selected EU countries depending on their overall level of economic development. The research was based on four highly developed countries, i.e., Germany, France, Finland and Denmark, and four medium-developed countries, i.e., Poland, Hungary, Czech Republic, and Slovakia for the period 2001–2018. Renewable energy consumption, biomass and agricultural production were analysed as determinants of the bioeconomy development. The question was also answered whether differences in terms of measures determining the level of bioeconomy development between countries with different levels of economic development during the studied period are decreasing or increasing, using sigma (σ)-convergence coefficients. It is shown that the development of the bioeconomy of the studied countries is related to their level of economic development. In the middle economically developed countries, real opportunities for the development of the bioeconomy are noted, through a high share of agriculture in national income; and in highly developed countries—high spending on research and development and the growth of eco-innovation, which contributes to maintaining a development advantage between these groups of countries.

Graphical Abstract

1. Introduction

The implementation of the bioeconomy concept is a response to the challenges of today’s world in particular in terms of food security and safety, sustainability of resource management, reducing dependence on renewable resources, reducing the impact of climate change, and creating sustainable jobs and progress in maintaining economic competitiveness. Global challenges also include [1] increasing global production, declining biodiversity and climate change, price volatility in agricultural markets and product price speculation, increasing competition for biomass, and rural urbanisation and growing demand for public goods. Therefore, for several years now, a number of community documents have been giving clear priority to the bioeconomy, which includes primary production potential, that is, agriculture and forestry, fisheries with aquaculture, and coastal management, as well as pulp and paper production, the management of biomass, including from waste, or renewable energy production based on biomass and biotechnology.
This is an important area of the EU economy, which is becoming the foundation of intelligent and sustainable economic growth. In EU Member States, bioeconomy sectors employed 17.5 million workers in 2017, accounting for 8.9% of the total workforce. At the same time, this allowed the generation of more than €614 billion in added value, representing 4.7% of the value of EU GDP (Gross Domestic Product) [2]. It should be recognised that the development of this area is promising for employment growth especially in rural, coastal, or industrial areas and that the effectiveness of bioeconomy development may be even higher, the higher the degree of innovation implemented in agriculture, energy, biofuel production, and biotechnology. At the same time, there is a relatively high level of support for activities in this area from community funds, but the experience of EU countries with bioeconomy development varies.
The concept of bioeconomy is defined in different ways. It ranges from defining the bioeconomy as a way to achieve the vision of a society that is completely independent of fossil fuels for energy production and industrial raw materials to the concept of a sustainable and efficient transformation of renewable biological resources through innovation and the conversion of these resources into products that meet both private and public expectations [3]. The biggest challenges for Europe in the bioeconomy area are to minimise the environmental impact of the products created by selecting ingredients that allow their reuse [4]. Among the aspects that determine the development of a bioeconomy, there is a wide range of endogenous and exogenous factors, divided into three categories: environmental, economic, and social. Undoubtedly, the determinant of bioeconomy development is natural capital including renewable resources. In addition to natural capital, human capital, innovation, and a financial support system for bioeconomy-related activities are also important.
The bioeconomy is closely related to sustainable development, providing opportunities to achieve and sustain economic growth. The European bioeconomy offers a new perspective on traditional and high-value regional production and creates new opportunities and jobs for agriculture, forestry, fisheries, aquaculture, and industry [5]. It can be an alternative for post-mining areas [6] and other shrinking rural or peripheral areas in Europe, especially in Central and Eastern Europe.
Therefore, the aim of this article is to identify the rationale for the development of the bioeconomy using the example of selected EU countries with different economic levels. The main objective formulated in this way is linked to specific objectives, which include:
(1)
to present ways of defining the notion of a bioeconomy,
(2)
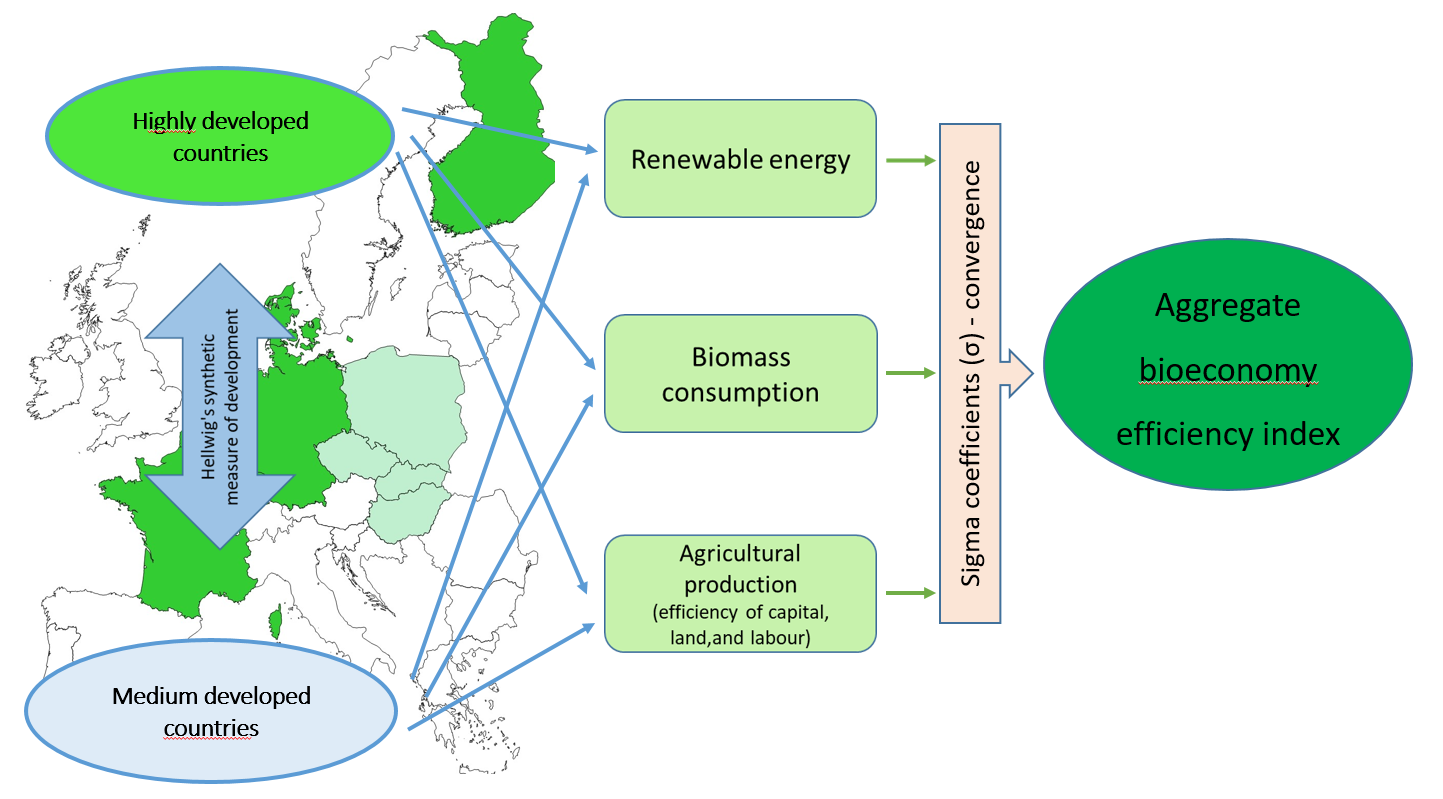
to assess bioeconomy effectiveness in light of stimulants and constraints to its development in selected EU countries, by identifying bioeconomy effectiveness measures, supported by sigma-convergence indicators.
Furthermore, the paper presents different aspects of the bioeconomy, highlighting its importance for the development of countries with different economic development in terms of geographical location, their historical path to the EU, economic development and potential, and basic macroeconomic indicators.
The authors hypothesise that the diversity of bioeconomy development is determined by the level of economic development of the country, which they intend to verify.
The problems presented in the article are reflected both in Polish and foreign literature on the subject. However, so far, there is no comprehensive approach to the issues raised in this paper, which reduces its importance both for economic practice and the field of economic knowledge. In light of the above, the question was posed whether there is a similarity or even an increase in differences in the scope of measures determining the effectiveness of bioeconomy between countries with different levels of economic development, which became the basis for undertaking research in this area, constituting an interesting source of cognitive values. The study uses Hellwig’s synthetic measure of development, which allows one to order the analysed EU countries according to the level of economic development.

2. Materials and Methods

Eight EU countries were selected for the study—four countries with a relatively high level of development, i.e., Denmark, Finland, France and Germany, and four countries with a medium level of development from Group V-4, i.e., the Czech Republic, Slovakia, Hungary, and Poland. The selected countries are diverse in terms of their geographical location, historical path to the EU, economic development and potential, and basic macroeconomic indicators. In addition, they are differentiated by the period of their EU membership (EU-15 and EU-12). Thus, spatial differentiation, advancement in the development of primary production, and in industrial production based on primary production raw materials and biotechnology can be presented. In addition to the main objective of the study, specific objectives can be indicated, which include: to systematise the concept of bioeconomy in the nomenclature of integration groupings and selected EU countries, to determine the level of economic development of the countries selected for the study using a synthetic indicator, to identify consumption and production of raw materials as measures of bioeconomy development in the studied countries, to determine sigma convergence coefficients in EU countries with similar and different levels of development in the field of bioeconomy, and to establish a ranking of the studied EU countries according to bioeconomy effectiveness.
The time scope of the study covered the period 2001–2018 regarding bioeconomy resources, and in some areas, it covered the period 2009–2018, given the introduction of new policies and regulations such as on bioenergy and biofuels. In order to achieve the aim of the study and to test the hypothesis, the dissertation uses various statistical and econometric methods, such as the fact that it was based on various statistical and econometric methods, including: chain and single-basis dynamics indices, which were used to assess the development of values of the phenomena in time; Pearson correlation analysis and linear and multiple regression models; trend models, which were used to identify statistically significant trends; panel analysis, which was used to assess the relationships between macroeconomic aggregates and indicators of bioeconomy development in temporal and spatial terms; cluster analysis using Ward’s method, which was used to group countries and indicate similarities between them in terms of the level of economic development; and performance measures, supported by sigma-convergence indicators, which were used to assess the effectiveness of the bioeconomy in light of its stimulants and limitations. Calculations were carried out using the econometric package Statistica. The data used in the study were secondary and came from: European Statistical Office (EUROSTAT), Food and Agriculture Organization of the United Nations (FAOSTAT), World Bank, and Organisation for Economic Co-operation and Development (OECD). As a source base, the statistics included in the PhD thesis of A. Grzyb [7] were used.
Various methods were used in the article. Hellwig’s synthetic measure of development was used to classify countries according to their level of economic development [8,9,10,11]. Objects of research, which in the discussed case are countries described by the indicators below, can be compared if a measure of similarity between them is defined. As a result of the analysis, a group of factors indicating the level of economic development was distinguished, i.e., GDP per capita according to PPS (Purchasing Power Standard, in euros); share of agriculture in gross value added (%); share of employed in agriculture and hunting to total employed (%); share of expenditure on R&D (as % of GDP); unemployment rate (%); productivity of resources per (euro/kg); share of people with higher education (%),; and emission of pollutants to air (carbon dioxide and methane in kg/per capita). This synthetic measure was assumed to be the Euclidean distance between the objects. When using this distance measure, all variables must be measured in the same units, or feature values must be normalised [12]. Classification of multidimensional objects is possible if features describing these objects are replaced by one synthetic variable. Classification then comes down to dividing a set of objects into classes according to only one feature. In this paper, we used Hellwig’s synthetic measure of development, which is the most frequently used synthetic variable in practical research. The process of constructing the measure of development started with establishing the elements of the observation matrix, i.e., the values of characteristics Xj (j = 1, 2, …, m), in the analysed case describing the level of economic development, corresponding to particular objects Oi (i = 1, 2, …, n), in the analysed case—selected EU countries. Then, the coefficient of variation was calculated, which is a measure of the relative dispersion according to the formula:
V j = S j x ¯ j
where Vj is the coefficient of variation for variable j; Sj is the standard deviation for variable j; and x is the arithmetic mean of variable j.
Standardisation was then carried out according to the following formula:
t i j = x i j x ¯ j S j
where tij is the country normalised value of the jth trait; xij are the country empirical values; x ¯ j is the arithmetic mean of the jth trait; and Sj is the standard deviation of the jth trait.
In order, the analysed characteristics were divided into stimulants and destimulants. Variables that were qualified as destimulants of economic development (share of agriculture in gross value added (%), share of employed in agriculture and hunting to total employed (%), unemployment rate (%), and air pollution emissions (carbon dioxide and methane in kg/per capita)) were transformed into stimulants according to the formula:
x i j = 1 x i j
Finally, the pattern of economic development was established, i.e., the matrix of variables was standardised, which is the basis for determining the so-called pattern of economic development, i.e., an abstract object (country) with standard coordinates z01, z02, …, zoj, where zoj = max {zij}, where zj is a stimulant; zoj = min {zij}, and where zj is a destimulant and calculated the synthetic Hellwig index—as the distance of each Pi object (country) from the benchmark according to the formula:
d i = 1 D i 0 D 0 ( i = 1 , 2 , , n )
where Di0 is a distance from the object P0
D i 0 = j = 1 m ( z i j z o j ) 2 ;   D ¯ 0 = n 1 i = 1 n D i 0 S 0 = n 1 i = 1 n ( D i 0 D ¯ 0 ) 2 ;   D 0 = D ¯ 0 + 2 S 0
The next method concerned the use of the sigma convergence index to test whether differences in measures of the level of bioeconomy development between countries with different levels of economic development are increasing or decreasing over the period studied. In the most general terms, convergence means “coming together”, “converging”, or “becoming more similar” in various dimensions of the socioeconomic life of the countries being compared. The concept of economic convergence was introduced to economic literature by R. Barro and X. Sala-Martin in the context of the macroeconomic theory of economic growth. Convergence of sigma (σ) type means a decrease in the differentiation of given variables between particular regions (countries). The idea of sigma convergence is connected with an attempt to answer the question about long-term trends in the degree of wealth differentiation in a given group of countries. The determination of convergence/divergence in the bioeconomy sector efficiency between countries with different levels of economic development was also applied in the analyses, replacing measures of wealth with measures of bioeconomy sector efficiency. A commonly accepted measure of dispersion within a group of countries is the standard deviation of the natural logarithms of, e.g., measures of wealth (most commonly GDP per capita) at a given time t, calculated according to the following formula.
σ t = t = 1 ( l n y i t l n y ¯ t ) 2
where
  • σt—standard deviation of the natural logarithms at time t,
  • i—country index,
  • y i t —the level of the adopted measure (e.g., GDP per capita) in the i-th country in year t,
  • y ¯ t —the average level of the adopted measure (e.g., GDP per capita) in the considered group of countries in year t.
We speak of σ-convergence, when, over time, the standard deviation of natural logarithms of the adopted measure in a given group of countries shows a decreasing tendency. Otherwise, we deal with divergence. Convergence always leads to the disappearance of inequalities between initially different entities. When the entities are countries or regions, the differences between them disappear as a result of convergence [13]. In the study conducted, which consisted in indicating the similarity or the increase in disparities in bioeconomy efficiency between selected countries with different levels of economic development, the decrease, over time, of the standard deviation of the natural logarithms of the adopted efficiency indicators in a given group of countries indicated the similarity of bioeconomy efficiency between them. Otherwise, it indicated increasing differences in bioeconomy performance between the countries in the group. Trends towards convergence/divergence of the following measures of bioeconomy efficiency were considered, which were analysed in Section 3.2.2 (renewable energy consumption per 1000 inhabitants and per GDP per capita in USD, biomass consumption per 1000 inhabitants and per GDP per capita in USD, agricultural production in euro per man-hour (rh), hectare of agricultural land (UAA), and one euro of consumption (depreciation) of fixed assets).

3. Results

3.1. The Concept of Bioeconomy in the Nomenclature of Integration Groupings and Selected EU Countries

N. Georgescu-Roegen in 1977 pointed out the biological limitations of growth in the study of economic phenomena and stated that it is essential in the analyses of economic processes to understand the biophysical and social context of the processes of production, exchange, and consumption, which he closed with the name bioeconomics [14]. The term bioeconomy was defined in 1997 by J. Enriquez and R. Martinez, at a seminar on genomics at the American Association for the Advancement of Science, explained in [15]. According to them, the concept of bioeconomy is understood as an economy that relies on materials, chemical products and energy that are produced from biological resources. Terminological differences between bioeconomy, biobased economy, and bio-based economy are often due to the definitional context [16]. In brief, the term bioeconomy is understood as an economic sector, while biobased economy or bio-based economy refers to the transformation of the economy as a whole from a fossil-based economy to a biobased economy (Table 1) [17]. In its definition of bioeconomy, the OECD assumed that it is the activity of applying biotechnology, bioprocesses, and bioproducts to produce specific goods and services. According to the OECD, the bioeconomy can be understood as a space where biotechnology provides a significant impact on economic growth. In the EU Strategy, the bioeconomy, or organic materials economy, refers to the production of renewable raw materials that primary production provides and their conversion. The bioeconomy includes agriculture and forestry, inland fisheries, marine and coastal fisheries, food production, wood, pulp and paper processing, as well as parts of the chemical, biotechnological, and bioenergy industries [18]. In contrast, bioeconomy in the USA, understood as global, industrial processing with sustainable use of renewable aquatic and terrestrial resources for energy, as well as intermediate and final products produced with environmental, social, and national security benefits [19], has been prioritised by the government administration as it presents a high growth potential as well as offering high social benefits. By contrast, the French National Institute for Agricultural Research (INRA) identified bioeconomy as a key concept for building sustainable development and defined it as a strategy based on science, technology, and economics, directed towards a transition from a fossil resource-based economy to a biomass-based economy (for food, bioenergy, chemical products, and raw materials), respecting ecosystem services. In Germany, the bioeconomy includes the agricultural sector and all manufacturing sectors and accompanying service areas that develop, produce, process, and use any form of biological resources. It should be added that bio-based innovation also provides a growth boost to traditional sectors such as the commodity and food trade, IT, machinery and engineering, automotive, environmental technologies, construction, and many industrial services. In Finland, on the other hand, a bioeconomy is defined as an economy based on natural renewable resources for the production of food, energy, products, and services that seek to: reduce dependence on natural fossil resources, prevent the loss of biodiversity, and create new economic growth and employment, in line with the principles of sustainable development. It uses the most important renewable resources in Finland, namely biomass or organic matter from forests, the country’s primary biological resource. The group of V4 countries analysed does not have a national definition of bioeconomy or specific bioeconomy strategies, although bioeconomy-related objectives can be found in other national strategic documents.
It is important to note that different definitions of the bioeconomy are predominantly used in different strategies and policies, incorporating measurable objectives and priority areas in documents and implementation plans for bioeconomy strategies and individual policies (Table 1). We need to see strategies and policies for a biobased economy in the context of a strong focus on reducing dependence on fossil fuels [17]. As J. von Braun [32] notes, the bioeconomy is understood as the ‘biologisation’ of the economy, which is a social and economic strategy involving producers and consumers. It should therefore be considered in the broader context of social and technological change and economic transformation towards a green growth strategy.

3.2. Raw-Material Resources as a Determinant of Bioeconomy Development in Selected Countries with Different Levels of Economic Development

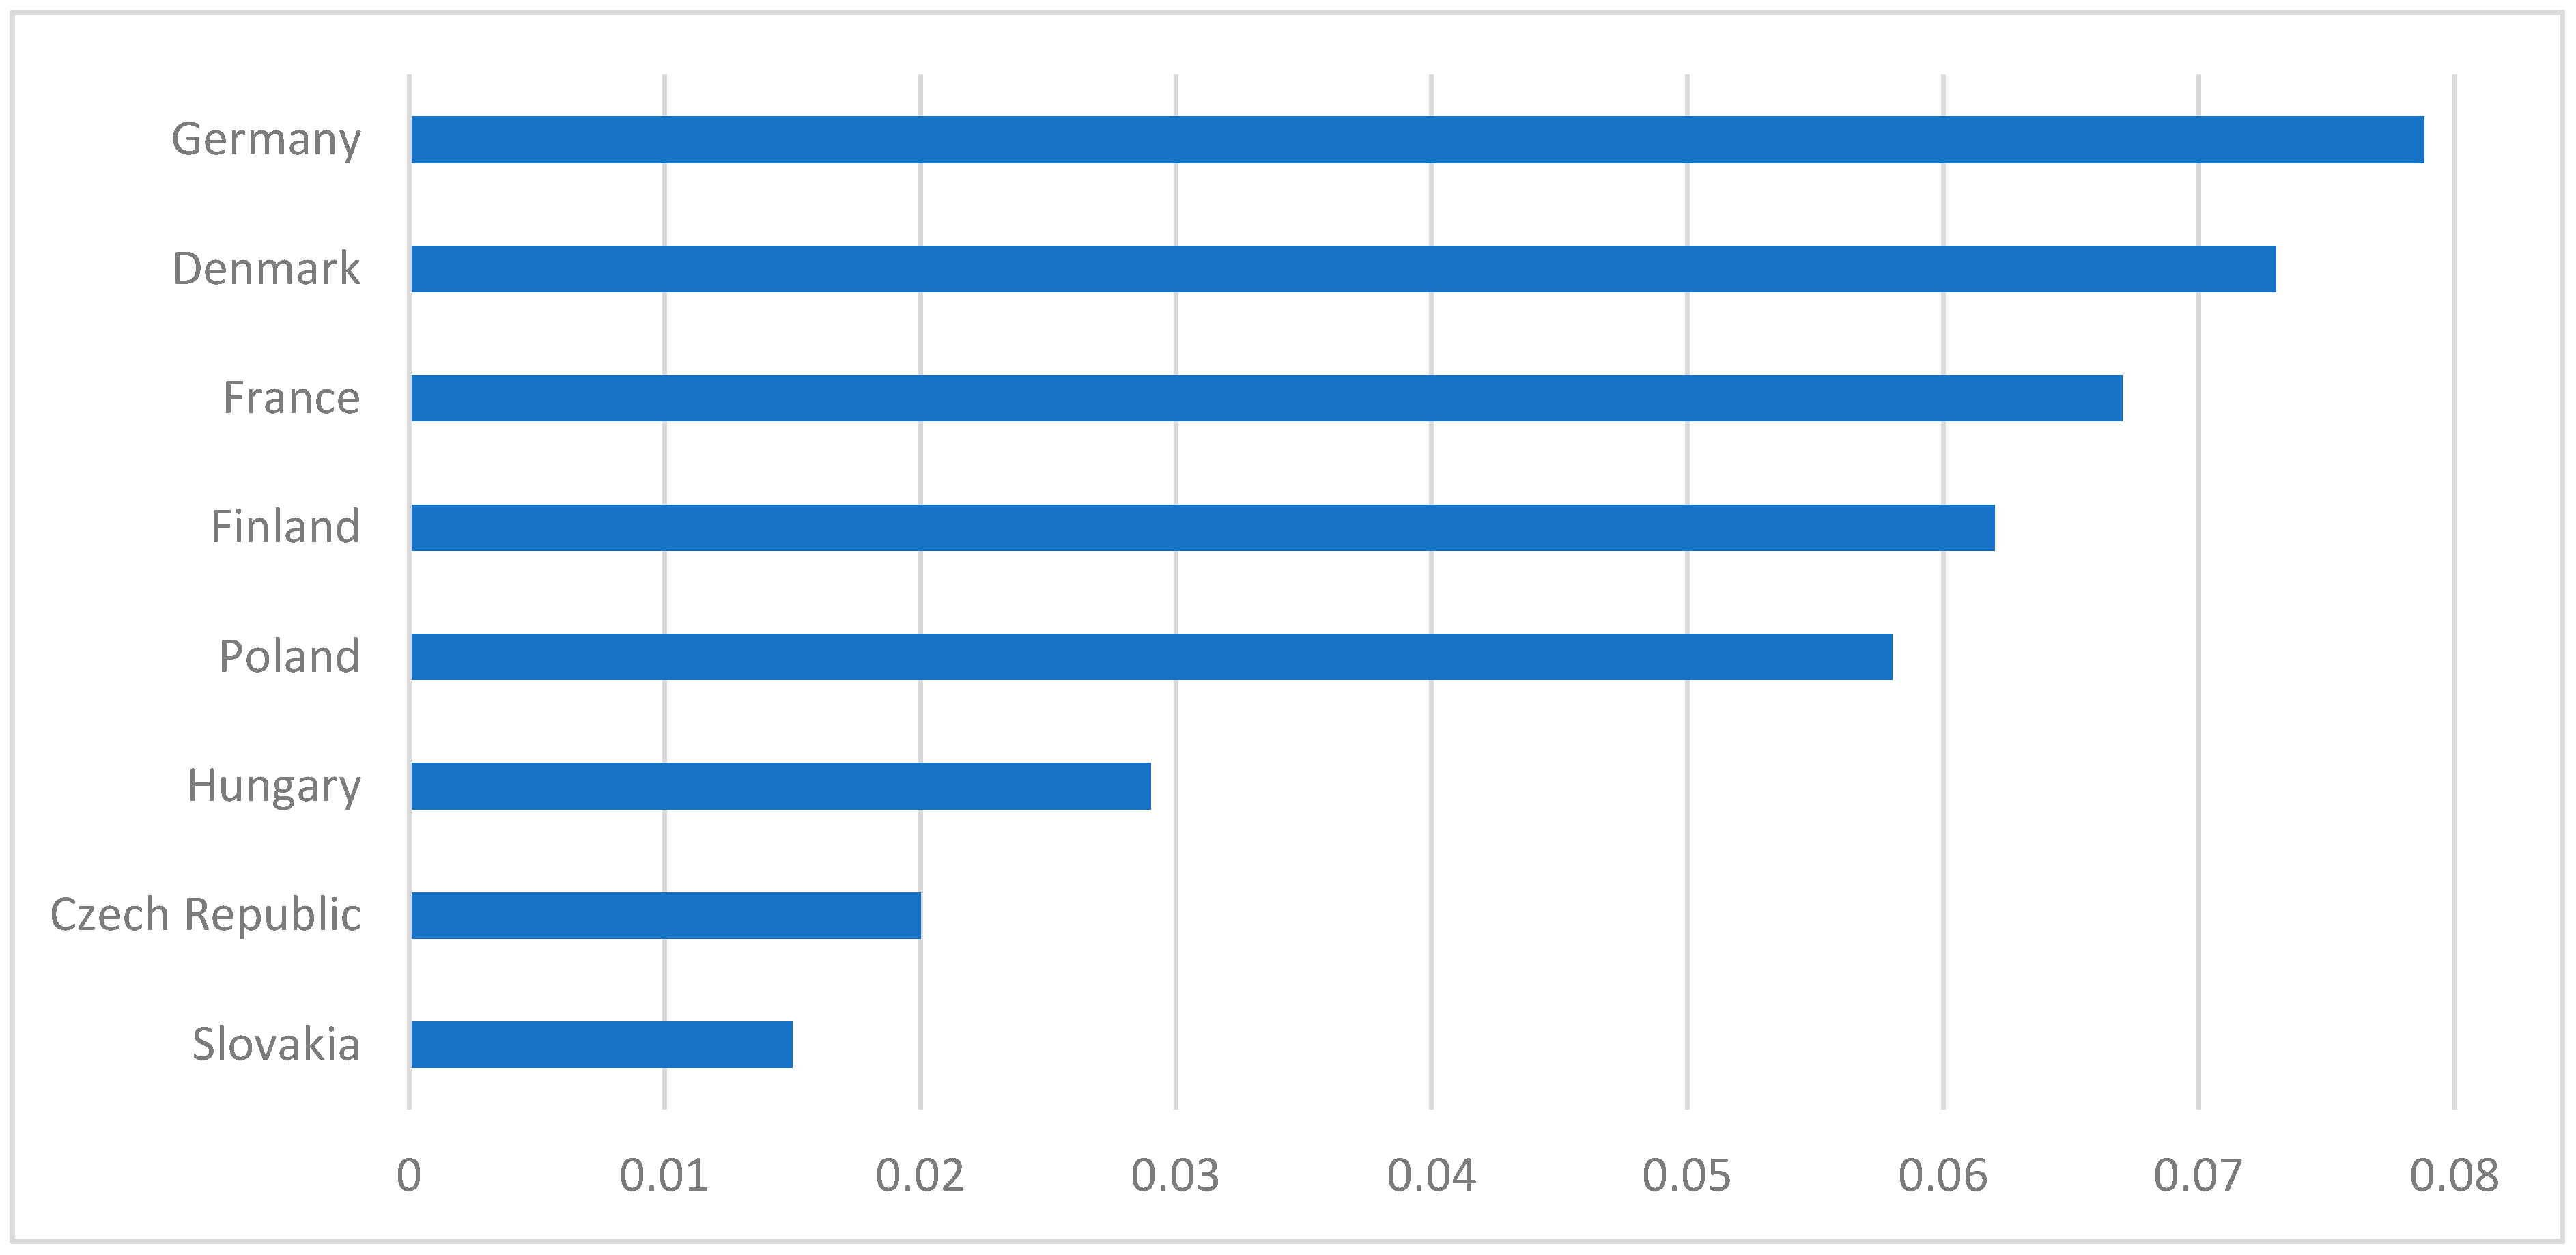
3.2.1. A Synthetic Indicator of a Diversified Level of Economic Development

The countries adopted for the analysis are characterised by a different level of economic development. Hence, differences in this development are indicated, and the classification according to the level of development is confirmed. The values of the synthetic index of the level of economic development calculated with this method are within the range of 0.12–0.85 (Table 2, Figure 1). We should add there are no units indicated, because the synthetic indicator is between 0 and 1, which is the result of Hellwig’s method. The higher it is (closer to 1), the more developed a country is.
According to the assumptions of the analysis, the closer the value of the indicator is to unity, the higher the level of economic development of the studied country, which was especially close to Denmark, Germany, and France, but also Finland, mainly due to their relatively high GDP per capita, low unemployment, small role of agriculture in the economy, a relatively well-educated society, and relatively low emissions (except Denmark, which leads in all types of pollution, e.g., into the air—these are air pollution by sulphur oxide, nitrogen oxide, and nonmethane volatile organic compounds).
Thus, one may conclude that there is a clear division into the more developed countries, whose synthetic indicator of the level of economic development is relatively higher and clearly stands out from the second separated group, i.e., countries with an average level of development—the Czech Republic, Slovakia, Hungary, and Poland, with a relatively lower value of this indicator, which, as indicated in the literature, occurs when certain objects are characterised by a much weaker development [34,35]. It should also be noted that until 2008 the division between the two groups of countries is even clearer, but after including the values related to air pollution emissions in the synthetic indicator (since 2008), the level of the synthetic indicator of economic development decreases with respect to the more developed countries. It is also not difficult to see that the least developed among these countries is Poland.
It is worth noting that an important problem that may indirectly affect the postcommunist economic development of Central and Eastern Europe is local corruption issues. Research indicates that corruption affects postsocialist countries in transition from a centrally planned to a market economy more than those with a mature, established market [36,37,38]. This adverse impact of corruption is evident in the lower level of economic development of CEE countries. It can also affect other spheres of social and economic life, including the development of the bioeconomy, which involves relatively large cash flows and with them the risk of corrupt and unethical behaviour (e.g., the manipulation of electricity prices on the stock exchange, CO2 emissions, etc.) [39].

3.2.2. Consumption and Production of Raw Materials as Measures of Bioeconomy Development in the Countries Studied

Renewable Energy

This section of the article analyses indicators that provided evidence of the level of development of the bioeconomy sector in selected EU countries between 2009 and 2018. These were: renewable energy and biomass consumption per 1000 inhabitants and per GDP per capita in USD, and agricultural production in euro per man-hour (rh), hectare of utilised agricultural area (UAA), and one euro rate of consumption (depreciation) of fixed assets. These were therefore partial performance indicators of the bioeconomy sector.
The first of the indicators that was taken to represent the level of development of the bioeconomy sector in selected EU countries with different levels of economic development between 2009 and 2018 was the per capita consumption of renewable energy. It can be concluded that the higher this indicator, the higher the efficiency of the bioeconomy. This is due to the fact that this indicator shows the values of renewable energy per capita; therefore, it can be thought that the higher the value, the more often the population of a country uses renewable energy and substitutes it for conventional energy sources, which promotes the development of the bioeconomy sector. In all countries included in the analyses, the per capita consumption of renewable energy was stable over the study period, which allows us to conclude that there were no significant changes in this area and that the differences between countries were characterised by persistence. By far the highest energy consumption over the whole period under study was in Finland (average 1.82 TOE per 1000 inhabitants), followed by Denmark (average 0.78 TOE per 1000 inhabitants). The differences in this respect between the leaders were thus significant, i.e., about 2.5 times more in Finland (Table 3). Taking into account the fact that the population of this country is similar to that of Denmark, it should be concluded that the inhabitants of Finland have by far the greatest possibilities, among the inhabitants of all the other countries studied, to substitute energy from nonrenewable sources with energy from renewable sources. Following these Scandinavian countries were Germany, with an average renewable energy consumption per capita between 2009 and 2018 of 0.43 TOE, and France (0.34 TOE).
The consumption of renewable energy per capita was similar in the Czech Republic (0.38 TOE/1000 inhabitants) and in Slovakia (0.27 TOE/1000 inhabitants). The lowest average consumption was in Poland (0.23 TOE/1000 inhabitants) and in Hungary (0.20 TOE/1000 inhabitants). Thus, these were the countries with the lowest renewable energy consumption, which may indicate a relatively low level of development of their bioeconomy.
Highly developed countries had nearly three times higher per capita renewable energy consumption than medium-developed countries during the period under review. However, it should be kept in mind that the value of this indicator was reflected in the very high consumption of renewable energy by the inhabitants of Finland and then Denmark, which stood out among the other economies. In the context of the criteria adopted, these countries should be considered to have the highest efficiency of the renewable energy sector, measured by its consumption per capita, among all the countries studied. This applies in particular to Finland.
Next, the renewable energy consumption in TOE was analysed per country’s GDP per capita in USD. This indicator showed, in turn, how often renewable energy can be used by the industrial and service sectors in a given country, and it is therefore reasonable to conclude that the higher the values of this indicator, the greater the efficiency of the renewable energy sector in these countries, as there is relatively more renewable energy production and opportunities for businesses to use it.
Taking this into account, there were different relationships in relation to the previous indicator. Germany had by far the highest rate of renewable energy consumption per GDP per capita (as high as 0.75 TOE on average in 2009–2019), followed by France (0.54 TOE). In the context of the above statement, it should be emphasised that these were highly developed countries with the highest efficiency of the renewable energy sector in terms of its availability to industrial and service entities. Much lower average indices were obtained for Finland (0.24 TOE) and Denmark (0.09 TOE). This is important because the conclusions of the analysis of the availability of renewable energy for the inhabitants of these countries indicated different relationships. Hence, we argue that these countries are characterised by the different efficiency of this sector, taking into account the criteria determining the availability of renewable energy for residents and businesses in these countries.
Germany was also the country with the largest increases in the renewable energy indicator per GDP per capita in USD, compared to the others. The Czech Republic and Finland were also among the countries with an increasing trend in this indicator between 2009 and 2019. The increase in the value of the indicator of renewable energy consumption per GDP per capita should be assessed as a very favourable trend, as it shows the increasing availability of energy from renewable sources by enterprises in these countries. It also indirectly indicates the development of this sector. Compared to medium-developed countries, Poland had by far the highest and most outstanding performance in the plus consumption of renewable energy per GDP per capita. The average for 2009–2018 here was 0.35 TOE. The Czech Republic came second with an average indicator of only 0.13 TOE, followed by Hungary and Slovakia. In the context of the assumptions made, it is worth noting that highly developed countries were characterised by an almost three times higher renewable energy consumption than medium-developed countries (see Table 4), which may indicate a higher level of bioeconomy development.

Biomass Consumption

Biomass consumption per capita and GDP per capita in USD were also used as indicators to show the level of development of the bioeconomy sector in selected EU countries with different levels of development. As in the case of renewable energy consumption, it was assumed that the higher these indicators, the higher the biomass consumption. This is due to the fact that these measures showed the use of biomass by both consumers and the industrial sector. As it is known, the use of biomass is more beneficial to the natural environment than the combustion of fossil fuels, which results from the fact that the content of harmful elements in biomass is lower than in nonrenewable sources. Moreover, the use of biomass allows one to reduce the amount of waste, as it includes both household waste and other biodegradable organic residues. The per capita consumption of biomass in the countries studied was more variable than the consumption of renewable energy. The average range of biomass consumption in thousand tonnes per 1000 inhabitants between 2009 and 2018 was from 2.15 in the Czech Republic to 6.16 in Finland.
Highly developed countries were characterised by higher per capita biomass consumption than medium-developed countries. The average ratio for the former in the period under review was 4.72, and for the latter, it was 3.38 thousand tonnes per 1000 inhabitants (Table 5). The highest per capita biomass consumption was recorded in Finland (an average of 6.16 thousand tonnes per 1000 inhabitants) and Denmark (5.27 thousand tonnes per 1000 inhabitants). In the light of the criteria adopted, these were the countries with the highest per capita biomass consumption among all the countries covered by the analyses. Biomass consumption per capita in Germany and France was about half that in Denmark and Finland. Among the medium-developed countries, Poland had the highest indicators in this respect. Biomass consumption per capita here was even higher than in Germany and France. In the context of the adopted criteria, one may say that Poland was characterised by the highest per capita use of biomass among all the analysed mid-developed countries. Slovakia, Hungary, and the Czech Republic were next in this respect in the period under discussion. It is also worth noting that biomass consumption by inhabitants in Slovakia and Hungary did not differ significantly from that in highly developed countries such as Germany and France.
As in the case of per capita biomass consumption, there were slight differences between countries differing in their level of economic development in terms of the level of indicators determining biomass consumption per GDP per capita. However, the data in Table 6 show that among the highly developed countries, Germany and France had the highest biomass consumption per GDP per capita, and not Finland and Denmark, as indicated by the biomass consumption per capita index (see Table 5). Poland had the highest average biomass consumption per unit of value added of all countries in the period under review. It was more than seven times higher than in other middle-developed countries and also slightly higher than in Germany and France (see Table 6).
This confirms the conclusion from the data in Table 5 that Poland has a similar biomass consumption to Germany and France.

Agricultural Production

Agriculture provides key resources for use in the bioeconomy. Therefore, it can be said that the development of this sector also influences the development of that economy. This is because it determines the quantity and quality of the raw materials that continue to be used by the sector.
Data on the agricultural sector in individual European Union countries are provided by the system of collecting accounting data from farms in the EU (FADN). It enables obtaining information about the value of agricultural production and the outlays of particular resources involved in achieving this effect in representative farms in particular countries. These data were also used to assess the productivity of the agricultural sector and for comparative analyses between EU countries with different levels of development from 2009 to 2018. It was assumed that the higher the value of agricultural output per resource (efficiency) in a country, the greater the positive indirect effect also on the level of development of the bioeconomy.
Total income from agriculture per labour input engaged in the sector was by far the highest and prominent in Denmark compared to other countries (Table 7). The next places in this respect were France, Germany, and then Finland. Only after these highly developed countries was the Czech Republic, which belonged to the group of medium-developed countries. Slovakia and Hungary followed, and Poland was in the last position. The differences between total revenue from agricultural production per agricultural labour input between the intermediate developed countries, such as the Czech Republic, Slovakia, and Hungary, were not large. Only Poland stood out in this respect. All this explains the almost four times higher productivity of labour resources, measured by total income from agricultural production per labour input, in 2009–2018 in highly developed countries than in the cluster of medium-developed countries.
The country with the highest average total income per hectare (ha) of utilised agricultural area (UAA), over the period 2009–2018, as with the ratio of total agricultural revenue per labour input engaged in the sector, was Denmark. This was followed by Germany, France, and Finland. Therefore, we can say that the order in terms of productivity of the land factor in agriculture in highly developed countries was practically the same as in the case of the productivity of labour factor. The only difference here was that the second position in terms of the labour factor productivity in agriculture, in the period 2009–2018 was occupied by France, and in the case of land factor productivity, it was Germany (Table 7 and Table 8). As regards the average productivity of agricultural land in the studied period, in the group of medium-developed countries, Poland was in the first place in this respect. Let us recall that in the case of labour input efficiency in agriculture in 2009–2018, it was in the last place. The next positions in this respect were the Czech Republic and Hungary, with a minimum difference of 24 euro/ha. Slovakia was in last place in this respect. Thus, again the highly developed countries were characterized by higher efficiency of the agricultural land factor than the middle-developed countries. This appears to be a permanent tendency, as it concerns each of the years of the research period (Table 8).
Considering the efficiency of the capital factor in agriculture, it should be pointed out that the country with the highest average value of the indicator of total income from agricultural production per capital input was Hungary, where, for example, we may note there is one of the highest indicators in the EU-12 countries of the share of tractors and harvesters, especially in agricultural holdings above 30 ha. This is surprising, because this country belongs to the group of medium-developed countries and in terms of efficiency of agricultural land and labour involved in this sector, it ranked at one of the last positions. It was followed by Denmark, the Czech Republic, and Germany. These countries had similar ratios of total income from agricultural production per unit of capital input, measured by depreciation of fixed assets. Then came Poland, France, and Slovakia, also with similar indicators of capital efficiency in agriculture, and Finland, which was in the last position (Table 9).
It should be stressed that, in relation to labour and land factor productivity in agriculture, there was a peculiarity in that the middle-developed countries achieved relatively higher indices determining capital input productivity in agriculture than the highly developed countries, which may have been determined by relatively high depreciation costs. The opposite was true for labour and land factor efficiency. This tendency was characterised by persistence and applied to all years of the research period.
In conclusion, it can be argued that in the period under study, highly developed countries were characterised by a higher level of development of the bioeconomy sector than medium-developed countries, which manifested itself, among other things, in higher renewable energy and biomass consumption per capita, and in terms of GDP per capita in higher total revenues from agricultural production per labour and land input. At the same time, it can be assumed that higher efficiency of agriculture translates into a higher level of bioeconomy development, as it is the most important supplier of raw materials used by this sector.

3.3. Sigma Convergence rate in EU Countries with Similar and Different Levels of Development in the Bioeconomy Area

Following is a study carried out to answer the question of whether there is a convergence, or even an increase, in differences in measures of the level of development of the bioeconomy, between countries with different levels of economic development over the study period. Convergence sigma indicators were used for this purpose. When examining trends in per capita renewable energy consumption between countries with different and similar levels of economic development, none of these groups of countries showed a decrease in differences in this respect, as evidenced by the σ-convergence coefficients in Table 10. Differences in this respect, despite the passage of time, remained at the same level or even deepened between countries, which was particularly evident in the group of medium-developed countries. The sigma-convergence coefficient for this group in 2018 was 0.3 compared to 0.22 in 2009. It is also worth noting that this group of countries, compared to the highly developed ones, was characterised by more than 3 times and about 2.5 times lower variation in renewable energy consumption per capita in 2009–2011 and in 2009–2018 (Table 10).
In terms of renewable energy consumption per GDP in countries with different levels of economic development, the sigma-convergence analysis did not show a narrowing of the gap. This was even more evident in the group of intermediate-developed countries. Only in the highly developed countries, in some years, did renewable energy consumption per GDP per capita decrease slightly (Table 10).
In the case of biomass consumption by the inhabitants of both medium- and highly developed countries, the convergence study confirmed similar differences, albeit slightly smaller in highly developed countries (Table 11). There was also no tendency for these differences to diminish in any group of countries during the study period. It is also worth noting that both in countries with different and similar levels of economic development, the differences between countries in per capita biomass consumption were similar.
The sigma-convergence coefficients in Table 11 show that the level of variation between the analysed countries in terms of biomass consumption in thousand tonnes per GDP per capita in US$ was the highest of all bioeconomy performance indicators studied so far. It remained at a similar level regardless of the level of economic development, as evidenced by the high standard deviations in the group of countries with different levels of development. The variation in biomass consumption per capita was only slightly smaller among middle-developed countries than among highly developed countries.
As regards trends in factor productivity in agriculture in high and medium-developed countries, in the former group, in recent years there has been a tendency for the differences to decrease with respect to the previous years. Such a trend did not occur in the medium-developed countries, where either an increase in the variation in agricultural factor productivity relative to previous years took place most frequently throughout the period under study or the variation between countries remained at the same level as the year before (e.g., 2013 and 2015). The data below also show that the variation in total agricultural income per labour input engaged in agriculture between countries with different levels of development, from 2009 to 2018, was significantly higher than in countries with similar levels of economic development.
The variation between countries with different and similar levels of economic development in total revenue per land and capital input during the period under study was much smaller than for the agricultural production revenue per man-hour. This was particularly true for total revenue from agricultural production per euro of capital input. This is evidenced by the comparative analysis of the sigma-convergence coefficients (Table 12). In the case of the agricultural land factor efficiency, we can see that in relation to 2009, the differentiation in this respect between highly developed countries first increased and then decreased after 2013. With regard to middle-developed countries, also no constant trend in this respect can be indicated, because it was so that in one year the differentiation increased in relation to the previous year and in the next year it decreased. The differentiation of indicators of total income from agricultural production per the input of land engaged in agriculture in the examined period was smaller in the group of medium-developed countries than in the group of highly developed countries. Moreover, the differentiation in this respect between countries with different levels of economic development was definitely greater than in countries with similar levels of economic development and referred to all years of the research period.
The variation in the efficiency of the capital factor in agriculture, in the period 2009–2018 was similar, and in 2012–2015, even identical in countries with different levels of development. It is also peculiar that between countries with different levels of economic development, it was smaller than in the groups of countries with similar levels of economic development. Here, one can also point to the tendency of decreasing differences in this respect between countries with different levels of economic development and highly developed countries (Table 12).

4. Discussion

The study makes it possible to rank selected EU countries with different levels of economic development according to the level of development of the bioeconomy sector over the study period. This approach was also used in the work prepared by Bracco and Flammini [41], who analysed countries with different levels of economic development and with different bioeconomy strategies. They focused on countries from six continents such as Argentina, Australia, Germany, Malaysia, the Netherlands, South Africa, and the United States. The analysis showed that the sectors covered by a country’s bioeconomy strategy mostly reflect the priorities set by the country and comparative advantages related, for example, to the availability of natural resources, traditional industries, labour productivity, and investment in research and development. Examples include the agri-food sector, which has been identified as a priority for Argentina, Malaysia, and South Africa, while the Netherlands and the United States focus more on nonfood sectors. The results presented also indicate that most countries measure the progress of the bioeconomy through economic values and share of GDP.
The bioeconomy performance indicators provide an aggregate assessment of the performance of the sector, as they are made up of submeasures, which were discussed earlier. In principle, two clusters of countries can be identified.
The first of these, with significantly higher bioeconomy effectiveness, includes highly developed countries and Poland. Effectiveness of the bioeconomy sector in Poland should therefore, against the background of countries with a similar level of economic development, be assessed as the highest and similar to that in Finland. For example, in 2009, the efficiency of the bioeconomy sector in Poland was even slightly higher than in Finland, and in 2011, it was higher than in France. However, subsequent years have seen the efficiency of the bioeconomy sector in Poland deteriorate relative to the highly developed countries, which should be assessed as a negative trend.
The second group of countries with significantly lower bioeconomy efficiency than in highly developed countries are Hungary, the Czech Republic, and Slovakia. In all years of the 2009–2018 period, the country with by far the lowest bioeconomy efficiency of all the countries studied was Slovakia; and only slightly higher efficiency indicators of this sector were recorded by the Czech Republic.
Therefore, we can say that during the studied period, highly developed countries were characterised by a higher bioeconomy sector efficiency than medium-developed countries, which follows from the earlier comparative analysis of partial bioeconomy efficiency indicators. The higher efficiency of the bioeconomy sector in highly developed countries is also indicated by Komen [42], as well as by D’Hondt, Jimenez-Sanchez, and Philp [43].
In terms of developed countries, depending on the year, the country with the highest bioeconomy performance was either Germany or Denmark (Figure 2).
In assessing the drivers of bioeconomy development, it is important to emphasise that the EU single market comprises nearly 500 million consumers with growing consumption needs in terms of both range and quality and with growing needs met by environmental services. Satisfaction of consumer needs is ensured because EU Member States have a large production potential, in terms of primary production from agriculture, forestry, fisheries and aquaculture, and microorganisms. Diversified raw materials from primary production provide a solid raw-material base for processing into food and feed for animal husbandry and breeding. Part of the raw materials from agriculture, fisheries and aquaculture, raw materials from forestry, waste from primary production, and food waste and organic waste from the municipal sphere constitute a valuable raw material—biomass, which is intended to be processed into bioproducts and bioenergy, as mentioned above. It should be noted that with the extension of the biomass processing chain (cascade use), the added value of the produced bio-products and bio-energy increases. Production surpluses of agricultural raw materials, as well as raw materials from fisheries and aquaculture and raw materials from forestry which are used for processing in the following industries: chemical, pulp and paper, wood, furniture, biotechnology and bioenergy production, can be used for these purposes. Of particular importance for stimulating the development of the bioindustry is the development of technologies for cascade and the circular use of biomass, the development of technologies for biorefining of biomass and the development of technologies allowing for the production of bioenergy, including biofuels I, II, and subsequent guarantees, biogas, and biomethane. A similar perspective is provided by D’Hondt, Jimenez-Sanchez, and Philp [43] indicating that the bioeconomy provides an opportunity to address the problems of the efficient use of biomass and to solve critical issues such as food security.
In the bioenergy sector, there is a decrease in the use of solid biomass for direct combustion in favour of cogeneration, including for heating and cooling, and an increasing use of bioenergy in transport.
An important driver for the development of the bioeconomy in the EU is high, and simultaneously developed, qualifications and skills of the workforce, both in primary production, as well as in the processing and feed industries and sectoral bioindustries. The basis for high qualifications and skills of the workforce is education, which is guaranteed by well-qualified researchers in the life sciences, biotechnology, materials engineering, and ITC technologies. The development in this field has accelerated with the concept of a knowledge-based bioeconomy and developing technological, organisational, or management innovations [44]. A similar approach is presented by Biber-Freudenberger et al. [45], indicating that some technological innovations have led to increased resource efficiency and that part of the sustainability gains achieved by high-tech countries are due to the development and application of advanced technologies and knowledge as an intrinsic part of innovative activities. Of particular importance is the development of agricultural, pharmaceutical, industrial, and environmental biotechnology. The development of biotechnology revolutionizes primary production supported by new plant varieties, animal breeds, and microorganisms, which allow one to obtain higher plans with expected parameters, as well as the breeding of animals with effective use of feed in relation to weight gain, quantity and quality of milk produced, or other values of this production. Individual biotechnological technologies make it possible to obtain modern medicines, bioproducts, including biodegradable bioplastics, and reduce the use of chemical fertilisers and plant protection products, which reduces the eutrophication of ecosystems. There is a growing number of patents in the bioeconomy, supported by good intellectual property protection.
Policy decisions taken by the EU on the implementation of the Bioeconomy Strategy, coupled with the implementation of the Global Development Goals, the Europe 2020 Economic Strategy, the Forestry Strategy, the Circular Economy and the Blue Economy [46], give a strong impetus to the implementation of the bioeconomy in Member States, as well as at the regional and local levels. The operationalisation of the implementation of the bioeconomy can be found in a number of Community policies, including agriculture, climate and energy and support for the development of bio-based industries, including the cascading use of biomass. The EU supports policies for the development of regional and smart specialisation, which dynamises the implementation of regional development strategies affecting regional and local development. The EU research, development, and innovation policy with high R&D investments under Horizon 2020 intensively support research development and innovation implementation in the bioeconomy area. In addition, public procurement policy can effectively support the development of the bioeconomy and the offered biobased products in a wide spectrum of bioeconomy sectors.
Constraints on the development of the bioeconomy in EU member states are mainly related to the competition for bioresources between food and feed production and the use of bioresources for bioindustry and bioenergy production. One should point out the high import of soya meal for the needs of the feed industry, for the production of which about 20 million ha of soya crops are used, especially in South America. Despite changing crop technologies, plant varieties, and animal breeds, there is a limit to the amount of biomass that can be obtained from agriculture, forestry, fisheries and aquaculture, microorganisms, and marine biomass, to be used as raw materials for the bioindustry and to generate bio-energy. The limit on biomass harvesting in agriculture and forestry is also linked to the need to leave some biomass, such as harvest and wood residues, to enrich soils with organic matter due to the scarcity of organic fertilisers. Indeed, soils should contain an adequate level of humus, which guarantees the binding of water and nutrients in the soil. Soil humus is also an important carbon store in the soil, helping to reduce GHG emissions. Harvested biomass especially from agriculture is largely local due to its use and high transport costs. There are opportunities and technologies to increase biomass production by using a group of plants with high photosynthetic efficiency in cultivation, but given the monoculture nature of these crops, this can lead to a serious threat to biodiversity. Growing highly intensive monoculture crops with high biomass yields, increases pressure on the environment, leading to soil degradation, increased demand for water for cultivation and eutrophication of the environment. It should also be added that data on the amount of biomass obtained, as well as its components, i.e., proteins, fats, sugars, starch, and cellulose, are largely estimates. It is important to stress the need to complete value chains in the bioeconomy, which allow effective cascading of biomass use and to complete the knowledge on the life cycle of products made from biomass. Among the constraints, the need to reduce energy intensity in the bioeconomy and the necessary reduction of GHG and ammonia emissions in primary production as well as in the bioprocessing chain should also be pointed out. Among the social indicators, declining employment in primary production, especially in agriculture, which is also facing cost reductions that could increase resource efficiency, should be mentioned as a constraint.

5. Conclusions

Both the adopted objectives of the study and the scope of the conducted analyses made it possible to positively verify the research hypothesis that the differentiation of the development of the bio-geo-based economy is conditioned by the level of economic development. Turning to the conclusion, it should be stated that the development of the bioeconomy of the studied countries is linked to the level of GDP, both in nominal terms and GDP per capita, to the share of agriculture in gross value added, to the share of employed in agriculture and hunting in total employment, to the share of expenditure on R&D, to the unemployment rate, to the productivity of resources, and to the share of people with tertiary education or to emissions of pollutants into the air, as confirmed by the different values of the constructed synthetic indicator of their economic level.
Identification of similarities between the countries studied in terms of resources related to production, forestry, and aquaculture indicates that two groups of countries can be distinguished. The first group includes Germany, France, and Poland with high resources in agriculture and aquaculture, and partly in forestry, where Poland was ranked fourth after Finland. The second group with lower primary production resources includes Denmark, Finland, the Czech Republic, Slovakia, and Hungary.
In the countries belonging to the group of medium economically developed, there are real opportunities to develop their bioeconomy, thanks to a relatively high (compared to highly developed countries) share of agriculture in GDP or opportunities to develop aquaculture; however, high spending on research and development and growth of eco-innovation is higher in highly developed economies, which contributes to maintaining a developmental advantage between these groups of countries.
The study found that highly developed countries had a significantly higher level of development in the bioeconomy sector over the period studied than medium-developed countries. The country with the highest level of development in this respect was Germany, followed by Denmark, France, and Finland. Poland, on the other hand, had the highest level of bioeconomy sector development among the middle-developed countries, and which was similar to some highly developed countries (Finland and France). However, the gap between Poland and highly developed countries has widened. It was also noted that during the studied period the value of the aggregated indicator of the level of bioeconomy development brought Poland closer to Finland and France than to the medium-developed countries.
The lowest level of bioeconomy sector development was found in Slovakia, slightly higher in the Czech Republic, and significantly higher in Hungary, but the trends were stable as they applied to each of the years of the research period, allowing us to conclude that differences in the level of bioeconomy sector development between the medium-developed countries studied are stable and similar despite the passage of time.
The research undertaken and the results obtained allow for further research in the future to extend the analysis to other sectors of the economy and other EU countries. In the future, the issues raised will also oscillate around the issue of evaluating the support system for bioeconomy-related activities in relation to formulating programmes and strategies for its development in EU countries.

Author Contributions

Conceptualization, A.C. and A.M.; methodology, A.M.; formal analysis, A.G.; investigation, A.M. and A.G.; resources, A.M., A.G., and M.M.; writing—original draft preparation, A.M. and A.C.; writing—review and editing, A.M.; visualization, M.M.; supervision, A.C.; funding acquisition, A.C. and M.M. All authors have read and agreed to the published version of the manuscript.

Funding

This research was funded by the Institute of Economics and Finance—University of Zielona Góra.

Institutional Review Board Statement

Not applicable.

Informed Consent Statement

Not applicable.

Data Availability Statement

No new data were created or analysed in this study. Data sharing is not applicable to this article.

Conflicts of Interest

The authors declare no conflict of interest. The funders had no role in the design of the study; in the collection, analyses, or interpretation of data; in the writing of the manuscript; or in the decision to publish the results.

References

  1. Van Huylenbroeeck, G. A Multifunctional Agriculture in Bioeconomy Era: The Global and Local Challenges; Universitat Gent: Ghent, Belgium, 2013; Available online: www.asu.lt (accessed on 17 May 2021).
  2. Ronzon, T.; Piotrowski, S.; Tamosiunas, S.; Dammar, L.; Carus, M.; M’Barek, R. Developments of Economic Growth and Employment in Bioeconomy Sectors across the EU. Sustainability 2020, 12, 4507. [Google Scholar]
  3. Maciejczak, M.; Hofreiter, K. How to define Bioeconomy? Ann. Pol. Assoc. Agric. Agribus. Econ. 2013, 15, 243–248. [Google Scholar]
  4. Woźniak, E.; Tyczewska, A.; Twardowski, T. Bioeconomy development factors in the European Union and Poland. New Biotechnol. 2021, 60, 2–8. [Google Scholar] [CrossRef] [PubMed]
  5. Szymańska, D.; Korolko, M.; Chodkowska-Miszczuk, J.; Lewandowska, A. Bioeconomy in Cities; The Scientific Publishing House of the Nicolaus Copernicus University: Toruń, Poland, 2017. [Google Scholar]
  6. Risteiu, N.T.; Remus, C.; O’Brien, T. Contesting Post-Communist Economic Development: Gold Extraction, Local Community. Eurasian Geogr. Econ. Rural Decline Rom. 2021. [Google Scholar] [CrossRef]
  7. Grzyb, A. Contemporary Problems of Bioeconomy in the Light of Experience of Selected European Union Countries. Ph.D. Thesis, Poznan University of Economics and Business, Poznan, Poland, 2018. Available online: https://www.wbc.poznan.pl/Content/450103/PDF/Grzyb_Andrzej-rozprawa_doktorska.pdf (accessed on 17 May 2021).
  8. Łogwiniuk, K. The use of taxonomic methods in the comparative analysis of the access to the ICT infrastructure by schoolchildren in Poland. Econ. Manag. 2011, 1, 7–23. [Google Scholar]
  9. Stec, A. Application of Hellwig Method to Determine the Tourist Attractiveness of Municipalities—Podkarpackie Voivodeship Example; Quantitative Methods in Economics; Warsaw University of Life Sciences: Warsaw, Poland, 2015; Volume XVI/4, pp. 117–126. [Google Scholar]
  10. Ostasiewicz, W. (Ed.) Statistical Methods of Data Analysis; Publishing House of the University of Economics: Wroclaw, Poland, 1998. [Google Scholar]
  11. Poczta-Wajda, A.; Poczta, J. The role of natural conditions in qualified agritourism—Case of Poland. Agric. Econ. 2016, 62, 167–180. [Google Scholar] [CrossRef] [Green Version]
  12. Salamon, J. Studies on multifunctional rural development in the świętokrzyskie province. Infrastruct. Ecol. Rural Areas 2005, 4, 145–155. [Google Scholar]
  13. Malaga, K. Economic Convergence in OECD Countries in the Light of Aggregate Growth Models; Publishing House of the Poznań University of Economics: Poznań, Poland, 2004; Volume 13, p. 170. [Google Scholar]
  14. Georgescu-Roegen, N. Inequality, limits and growth from a bioeconomic viewpoint. Rev. Soc. Econ. 1997, 35, 361–375. [Google Scholar] [CrossRef]
  15. Enriquez, J. Genomics and the World Economy. Science 1998, 281, 925–926. [Google Scholar] [CrossRef] [PubMed]
  16. McCormick, K. The Knowledge—Based Bio-Economy in Europe; Lund University Publications: Lund, Sweden, 2010; Volume 5, Available online: http://lup.lub.lu.se/record/1774406 (accessed on 17 May 2021).
  17. Staffas, L.; Gustavsson, M.; McCormick, K. Strategies and Policies for the Bioeconomy and Bio- Based Economy: An Analysis of Official National Approaches. Sustainability 2013, 5, 2751–2769. [Google Scholar] [CrossRef] [Green Version]
  18. European Commission. Communication from the Commission to the European Parliament, the Council, the European Economic and Social Committee and the Committee of the Regions Innovating for Sustainable Growth: A Bioeconomy for Europe; COM(2012) 60 Final; European Commission: Brussels, Belgium, 2012. [Google Scholar]
  19. Golden, J.S.; Handfield, R.B.; Daystar, J.; McConnell, T.E. An Economic Impact Analysis on the U.S. Biobased Product Industry: A Report to the Congress of the United States of America; A Joint Publication of the Duke Center for Sustainability & Commerce and the Supply Chain Resourse Cooperative at North Carolina State University; United States Department of Agriculture: Washington, DC, USA, 2015; p. 16.
  20. Enriquez, J.; Martinez, R. Biotechonomy 1.0: A Rough Map of Biodata Flow; Harvard Business School Working Paper # 03-028; Harvard Business School: Boston, MA, USA, August 2002; p. 10. [Google Scholar]
  21. European Commission. European Commission’s Research DG, New Perspectives on Knowledge Based Bio-Economy; Conference Report; European Commission: Brussels, Belgium, 2005. [Google Scholar]
  22. DG Research. Work Programme 2007–2008 Cooperation Theme 2 Food, Agriculture and Fisheries, and Biotechnology; European Commission C(2007)2460 of 11 June 2007; European Commission: Brussels, Belgium, 2007. [Google Scholar]
  23. DECHEMA. En Route to the Knowledge-Based Bio-Economy (KBBE); Cologne Paper 2007; DECHEMA: Frankfurt, Germany, 2007; Available online: http://www.bio-economy.net/reports/files/koln_paper.pdf (accessed on 17 May 2021).
  24. DEFRA. UK Biomass Strategy; White Policy Paper: London, UK, 2007. [Google Scholar]
  25. OECD. The Bioeconomy to 2030. Designing a Policy Agenda; OECD Publishing: Paris, France, 2009. [Google Scholar] [CrossRef]
  26. BECOTEPS. Bio-Economy Technology Platforms Join Forces to Address Synergies and Gaps between Their Strategic Agendas; European Commission: Brussels, Belgium, 2011; Available online: https://efi.int/projects/becoteps-bio-economy-technology-platforms-join-forces-address-synergies-and-gaps-between (accessed on 17 May 2021).
  27. Geoghegan-Quinn, M. Bioeconomy for a better life. In Proceedings of the Conference the Knowledge-Based Bio-Economy towards 2020, Brussels, Belgium, 14 September 2010; SPEECH/10/423. Available online: https://europa.eu/rapid/press-release_SPEECH-10-423_en.htm (accessed on 17 May 2021).
  28. European Commission. A Bioeconomy for Europe; European Commission: Brussels, Belgium, 2010. [Google Scholar]
  29. McCormick, K. The Knowledge-Based Bio-Economy in Europe; International Institute for Industrial Environmental Economics: Lund, Sweden, 2010. [Google Scholar]
  30. The White House. National Bioeconomy Blueprint; The White House: Washington, DC, USA, 2012. [Google Scholar]
  31. European Commission. Innovating for Sustainable Growth: A Bioeconomy for Europe; European Commission: Brussels, Belgium, 2012. [Google Scholar]
  32. Von Braun, J. Bioeconomy—Science and technology policy for agricultural development and food security. In Proceedings of the Festschrift Seminar, Cornel University, Ithaca, NY, USA, 13–14 December 2013; p. 5. Available online: www.ppafest.nutrition.cornell.edu (accessed on 27 March 2021).
  33. Eurostat Data. Available online: www.ec.europa.eu/eurostat (accessed on 26 March 2021).
  34. Zeliaś, A. Taxonomic Analysis of the Spatial Diversity of the Standard of Living in Poland in Terms of Dynamics; Publishing House of the Cracow University of Economics: Cracow, Poland, 2000. [Google Scholar]
  35. Kulesza, M.; Ostasiewicz, S. Ordering of European Union member countries according to the level of well-balanced development. Sci. Issues Jan Długosz Univ. Częstochowa 2011, V, 41–58. [Google Scholar]
  36. Cretan, R.; O’Brien, T. Corruption and conflagration: (In)justice and protest in Bucharest after the Colectiv fire. Urban Geogr. 2020, 41, 368–388. [Google Scholar] [CrossRef]
  37. Abed, G.T.; Davoodi, H.R. Corruption, Structural Reforms, and Economic Performance in the Transition Economies; International Monetary Fund: Washington, DC, USA, 2000. [Google Scholar]
  38. Rose-Ackerman, S. Corruption: A Study in Political Economy; Academic Press: New York, NY, USA, 1978. [Google Scholar]
  39. National Report of the President of the Energy Regulation. 2020. Available online: https://www.ure.gov.pl (accessed on 15 May 2021).
  40. OECD. Available online: https://data.oecd.org/ (accessed on 27 March 2021).
  41. Bracco, S.; Flammini, A. Assessing the Contribution of Bioeconomy to Countries’ Economy. A Brief Review of National Frameworks; Food and Agriculture Organization of the United Nations: Rome, Italy, 2018. [Google Scholar]
  42. Komen, J. Africa Rising’ to a sustainable future: Economic prospects of bio-economy development in eastern Africa. In Fostering a Bio-Economy in Eastern Africa: Insights from Bio-Innovate; Liavoga, A., Virgin, I., Ecuru, J., Morris, J., Komen, J., Eds.; ILRI: Nairobi, Kenya, 2016. [Google Scholar]
  43. D’Hondt, K.; Jiménez-Sánchez, G.; Philip, J. Reconciling Food and Industrial Needs for an Asian Bioeconomy: The Enabling Power of Genomics and Biotechnology. Asian Biotechnol. Dev. Rev. 2015, 17, 85–130. [Google Scholar]
  44. European Commission. The Knowledge Based Bio-Economy in Europe: Achievments and Challenges; European Commission: Brussels, Belgium, 2010. [Google Scholar]
  45. Biber-Freudenberger, L.; Kumar Basukala, A.; Bruckner, M.; Börner, J. Sustainability Performance of National Bio-Economies. Sustainability 2018, 10, 2705. [Google Scholar] [CrossRef] [Green Version]
  46. European Commission. Communication from the Commission to the European Parliament, the Council, the European Economic and Social Committee and the Committee of the Regions, “Blue Growth” Opportunities for Marine and Maritime Sustainable Growth; COM(2012)0494 Final; European Commission: Brussels, Belgium, 2012. [Google Scholar]
Figure 1. A synthetic indicator of the differential level of economic development in the EU countries studied, 2001–2018. Source: own elaboration based on Eurostat data [33].
Energies 14 03182 g001
Figure 2. Aggregate bioeconomy efficiency index in the analysed EU countries with different levels of economic development from 2009 to 2018. Source: own elaboration based on Eurostat data [33] and OECD [40].
Energies 14 03182 g002
Table 1. Definitions of what constitutes the bioeconomy.
Year of PublicationSource/Author of the PublicationDefinition
1977Gregorescu RoegenA new bioeconomic approach to land resources, which should be used with a view to conservation and use for future generations.
1997Enriquez MartinezAll economic activities arising from scientific and/or research activities focusing on the understanding of the mechanism and processes at the genetic/molecular level and their application to industrial processes.
2005KE DG ReasearchEnvironmentally friendly ecoefficient transformation of renewable biological resources into food, energy, and other industrial products.
2006EC DG ReasearchAll production systems that use biochemical and biophysical processes, including the life sciences and related technologies generally necessary for the production of useful products; agricultural and industrial applications of biotechnology, biorefineries, bioenergy, and biochemicals are an integral part of the bioeconomy; the term also includes novel uses of land and sea (such as those improving ecosystem services and other public goods), as well as the use of materials currently regarded as waste.
2007Cologne PaperIncludes production of renewable biological resources and their processing into food, feed, bio-based products, and bioenergy.
2007DEFRAAn economic activity that captures the hidden value in biological processes and renewable bioresources, resulting in a healthier population, growth and environmentally friendly economic development.
2009OECDTurning knowledge from the life sciences into new, environmentally friendly, ecoefficient, and competitive products.
2010BECOTEPSAll sectors whose products are derived from biomass.
2010Geoghegan-GquinThe part of the economy that generates growth and creates jobs through development, processing, and using biological resources in an environmentally friendly way.
2010European CommissionProduction models based on biological processes, as in natural ecosystems, using natural materials, consuming a minimum of energy and generating no waste, as all the waste from one process is material for the next one and is therefore reused in the ecosystem.
2011McCormickAn economy in which the basic building blocks of materials, chemicals, and energy are derived from renewable biological resources such as plant and animal resources.
2012White HouseBased on the application of research and innovation in life sciences to stimulate economic activity and generate public benefits.
2012European CommissionThe economics of using biological resources of terrestrial or marine origin, as well as those derived from waste, including food residues, as inputs for industry and energy generation; also includes the use of bio-based processes in environmentally friendly industry.
Source: own elaboration, also based on [3,14,20,21,22,23,24,25,26,27,28,29,30,31].
Table 2. Values of the synthetic indicator of the level of economic development in the studied EU countries in 2001–2018.
Country/Year200120012003200420052006200720082009201020112012201320142015201620172018
Czech Rep.0.440.450.440.450.440.440.440.290.290.290.300.300.300.300.280.290.280.30
Denmark0.800.840.830.850.840.830.830.480.470.480.470.470.470.470.460.480.490.48
Finland0.690.670.650.700.670.660.630.480.470.450.500.500.470.470.430.450.440.45
France0.780.780.780.770.750.710.680.600.640.650.660.650.650.620.570.580.600.62
Germany0.800.790.790.770.750.710.670.600.640.650.670.660.650.620.600.600.610.62
Poland0.190.190.170.170.150.150.160.130.180.140.150.150.140.160.120.130.120.11
Slovakia0.240.230.250.260.240.210.260.160.180.210.210.210.190.160.170.180.160.17
Hungary0.300.330.320.310.310.300.310.260.280.260.250.240.270.260.260.240.260.25
Source: own elaboration based on Eurostat data [33].
Table 3. Renewable energy consumption per capita in the surveyed EU countries (in TOE per 1000 inhabitants).
Country/Year2009201020112012201320142015201620172018Average
Czech Republic0.270.300.330.350.390.400.410.430.430.440.38
Denmark0.600.710.720.750.770.800.850.860.880.890.78
Finland1.511.741.701.851.821.881.901.921.941.971.82
France0.300.330.280.320.360.330.340.350.360.380.34
Germany0.300.340.370.400.410.440.470.510.520.530.43
Poland0.160.190.210.220.220.220.230.250.270.300.23
Slovakia0.210.250.240.250.260.260.290.310.320.330.27
Hungary0.180.200.190.180.190.190.200.200.210.220.20
Medium-developed countries—average
(Poland, Czech Republic, Hungary, Slovakia)
0.210.240.240.250.270.270.280.300.310.320.27
Highly developed countries—average
(Germany, France, Denmark, Finland)
0.680.780.770.830.840.860.890.910.930.940.84
Source: own elaboration based on Eurostat data [33] and OECD [40].
Table 4. Renewable energy consumption per GDP per capita in USD in the surveyed EU countries (in TOE).
Country/Year2009201020112012201320142015201620172018Average
Czech Republic0.100.110.120.130.130.130.130.140.140.140.13
Denmark0.080.090.090.090.090.090.100.100.100.110.09
Finland0.210.240.220.250.240.250.250.250.260.260.24
France0.540.580.480.550.580.530.530.540.540.550.54
Germany0.650.690.690.740.740.750.800.800.810.810.75
Poland0.320.350.350.370.350.340.340.340.350.350.35
Slovakia0.050.050.050.050.050.050.050.050.060.060.05
Hungary0.090.090.080.080.080.070.080.080.080.090.08
Medium-developed countries—average
(Poland, Czech Republic, Hungary, Slovakia)
0.140.150.150.160.150.150.150.150.160.160.15
Highly developed countries—average
(Germany, France, Denmark, Finland)
0.370.400.370.410.410.410.420.420.430.430.41
Source: own elaboration based on Eurostat data [33] and OECD [40].
Table 5. Biomass consumption per capita in the surveyed EU countries (thousand tonnes per 1000 inhabitants).
Country/Year2009201020112012201320142015201620172018Average
Czech Republic2.171.982.231.781.942.212.302.252.312.292.15
Denmark4.964.945.235.415.175.375.485.335.365.495.27
Finland5.376.145.935.966.616.346.166.226.386.516.16
France4.033.603.633.773.694.043.843.964.013.973.85
Germany3.313.133.683.693.373.933.643.623.733.693.58
Poland4.624.314.844.644.504.894.734.584.644.824.66
Slovakia3.533.603.803.092.983.763.373.233.383.303.40
Hungary3.142.873.322.473.284.023.503.343.683.553.32
Medium-developed countries—average
(Poland, Czech Republic, Hungary, Slovakia)
3.373.193.553.003.183.723.483.353.503.493.38
Highly developed countries—average
(Germany, France, Denmark, Finland)
4.424.454.624.714.714.924.784.784.874.924.72
Source: own elaboration based on Eurostat data [33] and OECD [40].
Table 6. Biomass consumption per GDP per capita in USD in the surveyed EU countries (thousand tonnes).
Country/Year2009201020112012201320142015201620172018Average
Czech Republic0.830.750.810.650.670.720.710.700.690.650.72
Denmark0.680.640.660.680.620.630.630.640.630.610.64
Finland0.760.850.790.790.870.840.800.810.830.820.82
France7.256.286.126.355.966.435.986.216.116.056.27
Germany7.196.396.916.806.006.746.116.336.416.156.50
Poland9.167.978.277.607.097.416.867.026.796.917.51
Slovakia0.830.780.790.630.580.700.620.640.590.610.68
Hungary1.531.341.461.061.331.561.311.421.331.371.37
Medium-developed countries—average
(Poland, Czech Republic, Hungary, Slovakia)
3.092.712.832.492.422.602.382.452.352.392.57
Highly developed countries—average
(Germany, France, Denmark, Finland)
3.973.543.623.663.363.663.383.503.503.413.56
Source: own elaboration based on Eurostat data [33] and OECD [40].
Table 7. Total income from agricultural production per labour input in agriculture of the surveyed EU countries (in euro per man-hour).
Country/Year2009201020112012201320142015201620172018Average
Czech Republic16.9319.7924.6224.8924.8126.4926.0926.3227.5626.4924.40
Denmark96.63116.50135.47145.08143.64128.61123.18124.08135.06122.23127.05
Finland27.5531.0934.5141.3242.3343.5941.8443.4242.5544.6739.29
France46.2753.1358.7662.2659.6848.0760.2155.6761.3454.7856.02
Germany36.6943.8747.6153.9355.0452.0249.0751.0249.8753.4549.26
Poland5.886.857.667.888.007.817.717.948.028.247.60
Slovakia13.5815.6921.9021.2922.1826.5125.1124.3425.8726.9822.35
Hungary13.7616.2619.7920.1319.5719.6121.1020.8719.5621.0919.17
Medium-developed countries—average
(Poland, Czech Republic, Hungary, Slovakia)
12.5414.6518.4918.5518.6420.1120.0019.8720.2520.7018.38
Highly developed countries—average
(Germany, France, Denmark, Finland)
51.7961.1569.0975.6575.1768.0768.5868.5572.2168.7867.90
Source: own elaboration based on Eurostat data [33] and OECD [40].
Table 8. Total income from agricultural production per hectare (ha) of utilised agricultural area (UAA) in the surveyed EU countries (in euro per ha).
Country/Year2009201020112012201320142015201620172018Average
Czech Republic10291176143114651453151414861498151215031407
Denmark34654017449746864849432940574235435544784297
Finland13621468164417891802190417671810191418891735
France17882018219023842284231323132367228923992235
Germany21442548272830493090286226963088289929872809
Poland11931422157616211606158315281609157715991531
Slovakia68976110719731001118311201096110410991010
Hungary10061135142714461398141815061488149915021383
Medium-developed countries—average
(Poland, Czech Republic, Hungary, Slovakia)
9791124137613761365142514101423142314261333
Highly developed countries—average
(Germany, France, Denmark, Finland)
21902513276529773006285227082875286429382769
Source: own elaboration based on Eurostat data [33] and OECD [40].
Table 9. Total income from agricultural production per capital employed in agriculture of the surveyed EU countries (multiples).
Country/Year2009201020112012201320142015201620172018Average
Czech Republic7.638.189.198.978.658.887.848.027.998.438.38
Denmark8.279.4310.3510.9210.939.298.968.889.029.459.55
Finland3.073.373.674.254.254.224.074.114.294.233.95
France5.105.886.276.515.886.216.185.986.116.286.04
Germany6.697.567.978.528.338.217.617.898.128.347.92
Poland5.786.476.967.106.325.965.715.986.126.346.27
Slovakia3.734.105.566.476.537.206.236.566.896.926.02
Hungary8.549.3211.4011.4510.7812.0412.1411.9711.5312.0311.12
Medium-developed countries—average
(Poland, Czech Republic, Hungary, Slovakia)
6.427.028.288.508.078.527.988.138.138.437.95
Highly developed countries—average
(Germany, France, Denmark, Finland)
5.786.567.077.557.356.986.716.726.897.086.87
Source: own elaboration based on Eurostat data [33] and OECD [40].
Table 10. Sigma coefficients (σ)-convergence in the studied EU countries with different and similar levels of economic development with regard to renewable energy consumption—in TOE per 1000 inhabitants and in TOE per GDP per capita in USD.
Renewable Energy Consumption in TOE per 1000 Inhabitants
Specification2009201020112012201320142015201620172018
countries with different levels of economic development 0.730.750.740.760.740.750.740.750.740.75
countries with similar levels of economic developmenthighly developed0.770.790.800.780.740.770.750.760.750.76
medium developed0.220.210.240.280.310.310.300.310.310.30
Renewable Energy Consumption in TOE per GDP per Capita in USD
countries with different levels of economic development 0.950.950.940.980.980.980.970.970.980.98
countries with similar levels of economic developmenthighly developed0.950.930.900.930.940.920.930.940.930.93
medium developed0.790.790.830.850.940.920.930.920.930.93
Source: own elaboration based on Eurostat data [33] and OECD [40].
Table 11. Sigma coefficients (σ)-convergence in the studied EU countries with different and similar levels of economic development in relation to biomass consumption—in thousand tonnes per 1000 inhabitants and in thousand tonnes, converted to GDP per capita in USD.
Biomass Consumption in Thousand Tonnes per 1000 Inhabitants
Specification2009201020112012201320142015201620172018
countries with different levels of economic development 0.290.350.310.400.370.310.310.330.340.35
countries with similar levels of economic developmenthighly developed0.220.300.250.250.310.230.260.270.250.23
medium developed0.310.340.320.400.350.340.290.300.310.33
Biomass Consumption Thousand Tonnes Converted to GDP per Capita in USD
countries with different levels of economic development 1.161.111.111.161.121.121.111.121.131.11
countries with similar levels of economic developmenthighly developed1.331.251.281.271.221.281.241.261.251.24
medium developed1.141.111.101.181.221.111.241.211.191.18
Source: own elaboration based on Eurostat data [33] and OECD [40].
Table 12. Sigma coefficients (σ)-convergence in the examined EU countries with different and similar levels of economic development in relation to total revenues from agricultural production per: labour input involved in agriculture (in euro per man-hour); land input involved in agriculture (in euro per ha) and per capital input involved in agriculture (multiplicity).
Total Revenues from Agricultural Production per Labour Input Involved in Agriculture (in Euro per Man-Hour)
Specification2009201020112012201320142015201620172018
countries with different levels of economic development 0.870.880.850.880.870.820.820.830.840.83
countries with similar levels of economic developmenthighly developed0.540.560.580.540.530.500.480.480.470.47
medium developed0.470.560.580.520.520.580.580.570.590.58
Total Revenues from Agricultural Production per Land Input Involved in Agriculture (in Euro per ha)
countries with different levels of economic development 0.510.520.450.490.500.430.410.470.490.50
countries with similar levels of economic developmenthighly developed0.390.420.410.430.430.350.350.370.380.40
medium developed0.230.260.170.230.210.350.150.280.310.22
Total Revenues from Agricultural Production per Capital Input Involved in Agriculture (Multiplicity)
countries with different levels of economic development 0.380.380.370.320.320.320.330.340.330.34
countries with similar levels of economic developmenthighly developed0.430.440.440.400.410.350.340.350.340.33
medium developed0.370.360.310.400.410.350.340.360.350.34
Source: own elaboration based on Eurostat data [33] and OECD [40].
Publisher’s Note: MDPI stays neutral with regard to jurisdictional claims in published maps and institutional affiliations.

