Article

Online Synthesis of an Optimal Battery State-of-Charge Reference Trajectory for a Plug-in Hybrid Electric City Bus

Department of Robotics and Automation of Manufacturing Systems, Faculty of Mechanical Engineering and Naval Architecture, University of Zagreb, 10002 Zagreb, Croatia
*
Author to whom correspondence should be addressed.
Energies 2021, 14(11), 3168; https://doi.org/10.3390/en14113168
Submission received: 22 March 2021 / Revised: 8 May 2021 / Accepted: 24 May 2021 / Published: 28 May 2021
(This article belongs to the Special Issue Modeling and Control of Hybrid Vehicles)

Abstract

:
The powertrain efficiency of plug-in hybrid electric vehicles (PHEV) can be increased by effectively using the engine along the electric motor to gradually discharge the battery throughout a driving cycle. This sets the requirement of the optimal shaping of the battery state-of-charge (SoC) reference trajectory. The paper deals with the online synthesis of the optimal SoC reference trajectory, which inherently includes adaptive features in relation to the prediction of upcoming driving cycle features such as the trip distance, the road grade profile, the mean vehicle velocity and the mean demanded power. The method performs iteratively, starting from an offline-synthesized SoC reference trajectory obtained based on dynamic programming (DP) control variable optimization results. The overall PHEV control strategy incorporating the proposed online SoC reference trajectory synthesis method is verified against the DP benchmark and different offline synthesis methods. For this purpose, a model of a PHEV-type city bus is used and simulated over a wide range of driving cycles and conditions including varying road grade and low-emission zones (LEZ).

1. Introduction

Plug-in hybrid electric vehicles (PHEV) bridge the gap between conventional and fully electric vehicles in terms of leveraging investment costs, driving range, efficiency, emissions, and infrastructure requirements [1]. As such, they are considered as an effective intermediate solution towards fully electrified road transportation. The PHEVs are characterized by a complex powertrain structure consisting of several power sources, including an internal combustion engine, one or more electric machines, and a battery. Therefore, it is essential to develop an optimal PHEV control strategy that properly coordinates the different power sources in various operating modes. A PHEV can operate in a charge depleting (CD) mode until its battery is discharged to a prescribed lower limit value, after which a charge sustaining (CS) mode is activated to sustain the battery state-of-charge (SoC) and extend the driving range. If the driving distance is known in advance, which is particularly satisfied in the case of the city bus application considered herein, the fuel economy can be considerably increased by gradually discharging the battery throughout the whole driving cycle in the so-called blended (BLND) mode [2]. However, the implementation of this mode requires the planning of a proper SoC reference trajectory, which is either commanded to an explicit SoC controller or set as a constraint when solving an online optimal control problem [3].
SoC reference trajectory planning methods for the BLND mode are usually based on heuristic algorithms that require a minimum knowledge of an upcoming driving cycle. For instance, the SoC reference trajectory can be set to linearly decrease with respect to driving distance and reach its target, lower limit value right at the end of trip [2,3]. More advanced methods employ control variable optimization algorithms, which are conducted either offline (e.g., immediately before the start of trip) or online on a moving optimization horizon (the model predictive control approach, MPC), where a powertrain model and complete or partial knowledge of the upcoming driving cycle is needed [3,4]. Apart from minimum prior knowledge, the heuristics-based methods are characterized by computational efficiency and scalability, which makes them generally more appropriate for production vehicles. On the other hand, they can only achieve near-optimal performance.
It is well-known from the literature (e.g., [2,5,6]) that the optimal SoC trajectory that is expressed over a travelled distance assumes a nearly linear shape for common, e.g., certification driving cycles. Such a linear SoC reference trajectory can readily be applied in various PHEV control strategies. For instance, the authors in [6,7] describe a linear SoC reference trajectory that is determined at the beginning of the driving cycle and incorporated into an adaptive Pontryagin’s minimum principle (PMP)-based energy management strategy. However, the optimal SoC trajectories can significantly deviate from the linear-like trend in different real-world driving conditions, e.g., in the presence of low-emission zones (LEZ; where electric-only driving is preferred) [8], significantly varying road grade [5,9], and mixed driving patterns (e.g., city driving followed by highway driving) [10]. To account for these effects, a piecewise-linear SoC reference trajectory can be synthesized based on a principle of minimizing battery losses and dynamic programming (DP) optimization results [8,9].
A two-stage PMP-based hierarchical predictive control strategy is proposed by the authors in [11], who describe a strategy which relies on a driving cycle preview to compute a global SoC reference trajectory prior to the trip. The reference trajectory is determined at the superimposed control level and fed to the low-level adaptive PMP controller, which controls the powertrain operating points in real time and achieves SoC reference tracking. A fuel saving of 2% is reported when compared to the baseline strategy. In [12], the authors describe how an offline-calculated SoC reference trajectory is modified during steep hill climbing based on the road grade preview and heuristically determined rules, which results in improved SoC sustainability and marginally reduced fuel consumption. A quadratic programming-based SoC reference synthesis method is proposed by the authors in [13], who describe a method which employs a driving cycle preview and a crude approximation of the SoC recharging rates during negative road grades to minimize the SoC reference rates during positive road grades, thus managing to achieve up to 8% fuel consumption savings when compared to the baseline scenario. An MPC strategy based on PMP cost function is revealed by the authors in [6], who describe a strategy in which the online-optimized SoC trajectory is constrained by the upper and lower values of the offline-calculated linear SoC reference trajectory segments and computed on the current prediction horizon.
In [14,15] the authors describe how predictive control strategies are used to optimize the PHEV powertrain control variables online and penalize the SoC trajectory deviation from a prescribed linear SoC reference profile. An MPC strategy proposed by the authors in [16] relies on a simplified power balance-based PHEV powertrain model optimized offline over a full-horizon predicted driving cycle. The resulting SoC trajectory is then used to set the upper and lower SoC constraints for MPC law that employs a more detailed powertrain model within a limited prediction horizon. Simulation verifications point out that the fuel consumption can be improved by up to 5% when compared to the baseline CD/CS operating mode. Another PMP-based MPC strategy is presented by the authors in [17], who describe strategy in which a set of optimal SoC trajectories obtained by offline optimization are mapped with respect to corresponding vehicle velocity profiles using a Monte Carlo approach. SoC reference trajectories for each MPC control horizon are then determined from these maps and predicted velocity profiles, thus reducing the overall fuel consumption by up to 10%.
Based on the above literature review, it can be concluded that the proper planning of an SoC reference trajectory can considerably reduce fuel consumption and improve SoC sustainability. However, there is a lack of a systematic, near-optimal and computationally efficient approach towards SoC reference trajectory planning for a wide range of realistic driving scenarios. To this end, this paper proposes an online, computationally efficient, heuristics-based SoC reference trajectory synthesis method for a general class of driving cycles including the presence of LEZs and varying road grades. The first step towards the online strategy is based on an improvement of the authors’ previous work presented in [9], in terms of designing an offline synthesis method that does not require a preview of the whole driving cycle, but only predictions of the mean vehicle velocity and the mean demanded power. This is a particularly proper assumption for the considered application in city buses, as they operate on fixed routes. Finally, the online synthesis method performs an SoC reference trajectory recalculation in each time step, to incorporate adaptive features with respect to memorized driving cycle characteristics from the trip start until the current time instant. The proposed methods are verified against the DP optimization benchmark, based on a PHEV-type city bus model and a previously developed PHEV control strategy comprising of an explicit SoC controller and an equivalent consumption minimization strategy (ECMS) [18]. In addition, a robustness analysis with respect to prediction errors of the road grade profile, mean velocity and mean demanded power is conducted.
The main contributions of the paper include: (i) a practical and near optimal offline SoC reference trajectory synthesis method, applicable to a general case of varying road grades and LEZ presence and assuming a certain knowledge of the driving cycle characteristics, and (ii) an online SoC reference trajectory synthesis method where the instantaneous SoC reference is updated in each time step and adapted based on an accumulated knowledge of the driving cycle.
The paper is organized as follows. Section 2 presents a mathematical model and corresponding control strategy of the considered parallel PHEV powertrain. DP-based PHEV control variable optimization results are presented and briefly analysed in Section 3. The proposed SoC reference trajectory synthesis methods are elaborated in Section 4. Simulation results and corresponding analyses are presented in Section 5. Concluding remarks are given in Section 6.

2. Powertrain Model and Control Strategy

The PHEV powertrain backward-looking model and the corresponding energy management control strategy are outlined based on the previous publications [9,18], respectively.

2.1. Model

The modelled PHEV is of a parallel P2 configuration and corresponds to a Volvo 7900 Electric Hybrid 12-meter city bus [19]. The P2 parallel powertrain configuration consists of an automated manual transmission with 12 gears, a motor/generator machine (M/G) placed at the transmission input shaft and supplied by an electrochemical battery, and an internal combustion engine connected to the rest of powertrain via the clutch, placed between the engine and the M/G machine (Figure 1). For electric-only driving the engine is switched off and disconnected by the disengaged clutch.
The powertrain is modelled based on the computationally efficient backward-looking modelling approach [1]. The relations between powertrain variables are described by kinematic equations formulated in the backward order, i.e., in the direction from the wheels toward the machines. When the engine is switched on, it rotates with the same speed as the M/G machine:
ω e = ω M G = i o h ω w = i o h v v r w ,
where ωe and ωMG are the engine and M/G machine speeds, respectively, io is the final drive ratio, h is the transmission gear ratio, ωw is the wheel speed, vv is the vehicle velocity and rw is the effective tire radius. The engine torque τe and the M/G machine torque τMG are summed up at the transmission input shaft to deliver the demanded torque at the drivetrain output shaft (τcd):
τ e + τ M G = τ c d i o h = τ w η t r k t τ w + P 0 ω w ω w i o h ,
where τw is the demanded torque at the wheels, P0(ωw) represents the speed-dependent drivetrain idling power losses, and ηtr(τw) is the torque-dependent transmission efficiency, where the coefficient kt is defined as kt = 1 for τw < 0 (regenerative braking) and kt = −1 for τw ≥ 0 (motoring). The maps of P0(ωw) and ηtr(τw) are defined in [7].
The wheel torque is determined according to the vehicle longitudinal dynamics equation [1]:
τ w = r w M v v ˙ v + r w R 0 M v g cos δ r + r w M v g sin δ r + r w ρ a i r A f C d v v 2 ,
where Mv is the total vehicle mass (including passenger mass), R0 is the rolling resistance factor, g is the gravitational acceleration constant (g = 9.81 m/s2), δr is the road grade, ρair is the air density, Af is the frontal vehicle surface and Cd is the aerodynamical drag factor. Additionally, the transmission input power demand Pd is defined as (cf. Equation (2)):
P d = ω w τ w η t r k t τ w + P 0 ω w .
The parameter values of the transmission model are given in Appendix A.
The engine fuel mass flow m ˙ f is determined from the instantaneous specific fuel consumption map Aek(τe, ωe) (Figure 1c) as:
m ˙ f = A e k τ e , ω e τ e ω e ,
where Aek is meant to be expressed in g/Ws unlike in Figure 1c where it is given in g/kWh.
The battery is modelled by an equivalent circuit shown in Figure 1a, with the parameter maps given in Figure 1b. The state of the charge variable SoC = Q/Qmax is the only model state variable, defined by the following state equation [1]:
S o C ˙ = I b a t t Q max = U o c 2 S o C 4 R S o C P b a t t U o c S o C 2 Q max R S o C ,
where Qmax is the battery charge capacity and Q is the current battery charge. Pbatt is the battery output power defined by:
P b a t t = η M G k b τ M G , ω M G τ M G ω M G P M G ,
where kb = −1 for motoring (PMG ≥ 0) and kb = 1 for regenerative braking (PMG < 0).

2.2. Control Strategy

In general, the aim of the energy management control strategy is to set an appropriate powertrain operating point in each time step to achieve a favourable powertrain efficiency, while satisfying the driver torque/power demand.
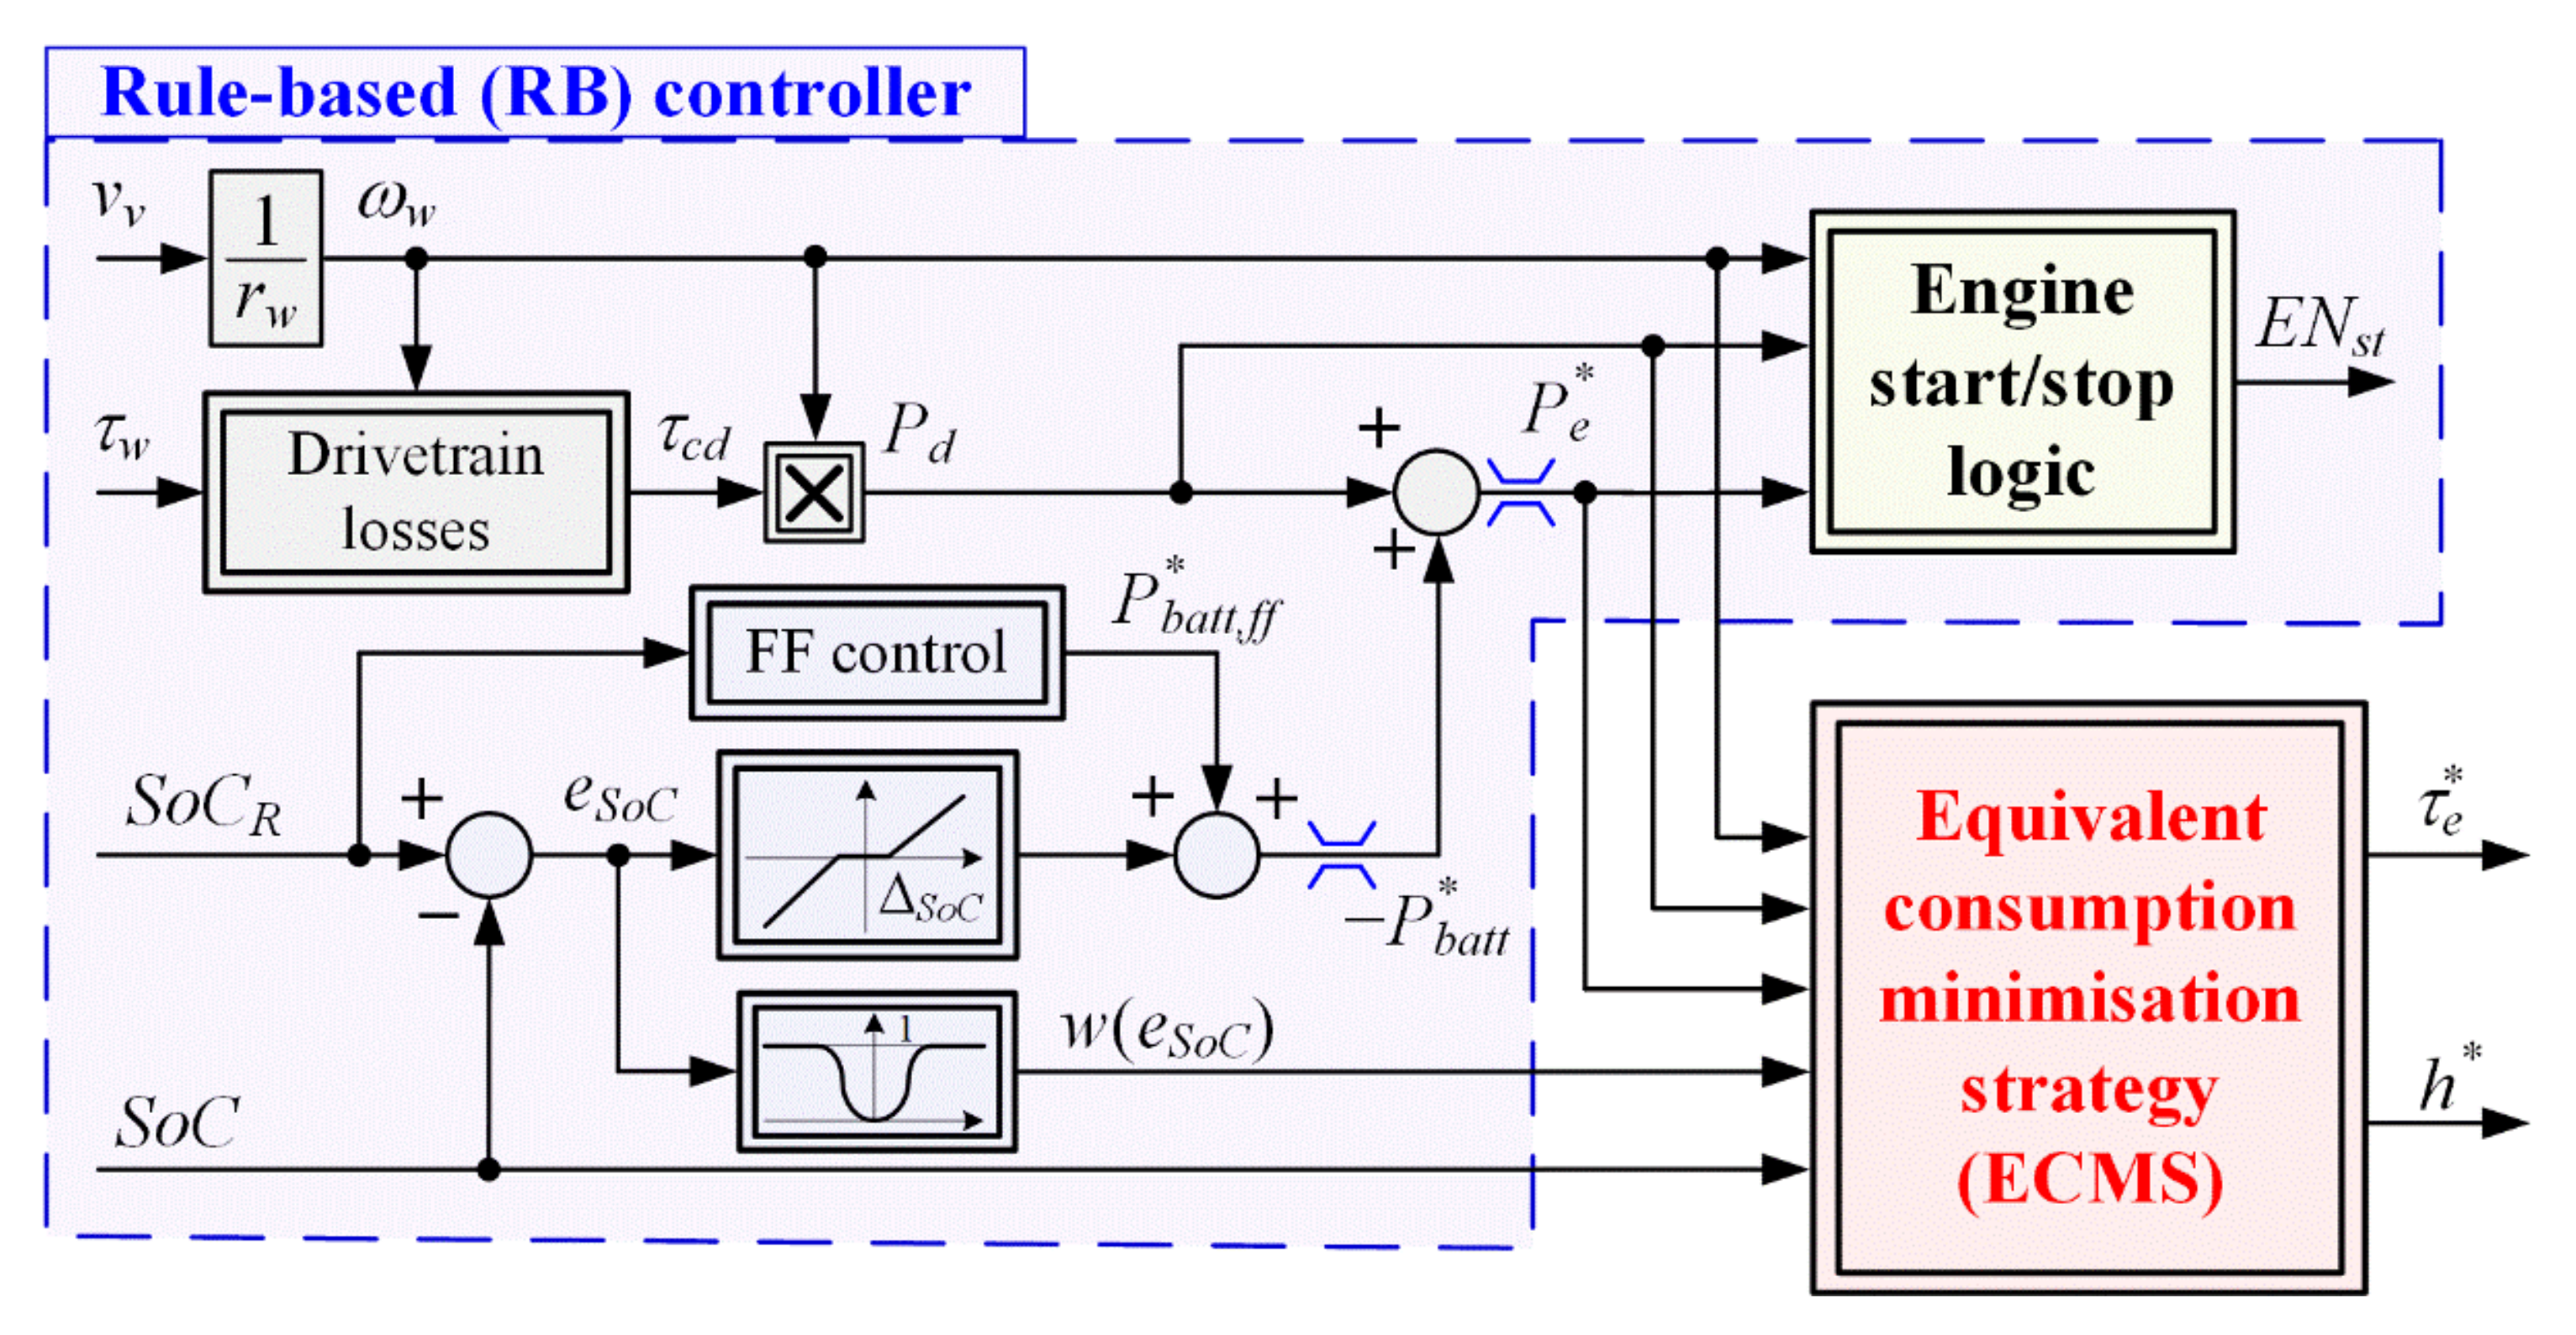
The engine torque τe and the transmission gear ratio h are selected as control variables, which in combination with the driving cycle-defined wheel torque and speed variables τw and ωw define the remaining powertrain variables (see Equations (1) and (2)). The control strategy is based on a combination of a rule-based (RB) controller and an equivalent consumption minimization strategy (ECMS) (see Figure 2 and [18]). The RB controller consists of an SoC controller and engine start-stop logic. The SoC controller is of proportional type, with a deadzone included, and it is extended with a feedforward (FF) control signal to improve the quality of the SoC reference (SoCR) tracking. The SoC controller determines the required battery power P*batt which is summed up with the transmission input power demand Pd, given by Equation (4), to calculate the engine power demand P*e (Figure 2). The engine start-stop logic switches the engine on (ENst = 1) if P*e is greater than a power-on threshold Pon, while it is switched off (ENst = 0) if P*e is lower than a power-off threshold Poff < Pon (see Appendix B for the control strategy parameter values). Exceptionally, the engine will be kept switched on regardless of the P*e signal if the M/G machine itself cannot deliver the demanded power Pd due to its speed-dependent torque limit denoted in Figure 1d.
The ECMS [18,20] provides an instantaneous minimization of the equivalent fuel consumption m ˙ e q with respect to the control inputs τe and h (2D-ECMS) [18]:
min τ e , h   m ˙ e q = m ˙ f + m ˙ f + A e k η b a t t , c P b a t t A ¯ e k η b a t t , d 1 P b a t t m ˙ b a t t ,         for   P b a t t < 0 ,         for   P b a t t > 0 .
In this way, the actual fuel mass flow m ˙ f is summed with a virtual battery fuel mass flow m ˙ b a t t , which accounts for the fuel-equivalent of discharged or recharged battery power. The variables ηbatt,d and ηbatt,c represent battery discharging and recharging efficiencies [21], respectively, and A ¯ e k is the mean engine specific fuel consumption during the battery discharging which is set to a constant value (Appendix B). To ensure SoC sustainability, the ECMS search-related engine torque limits are made dependent on the SoC control error eSoC (see function w(eSoC) in Figure 2 and [18]). When eSoC approaches zero, the engine torque is constrained between the absolute lower limit Poff/ωe and the absolute upper limit τe,max(ωe), i.e., the search range has the maximum width. As the SoC control error eSoC increases, the lower and upper engine torque limits become narrower and for high errors converge in the engine operating point defined by τe = P*e/ ωe, where the RB controller power demand is satisfied (i.e., SoC sustainability is guaranteed) and minimization is conducted only with respect to the transmission gear ratio h (1D-ECMS). When the engine is switched off, the M/G machine propels the vehicle and the transmission gear ratio h is selected to minimize the electricity consumption [18].
In order to reduce frequent gear ratio switching that could be requested by the RB+ECMS controller, and which would reduce driving comfort and drivability, a gear shift delay (GSD) algorithm is incorporated into the ECMS [18]. The GSD algorithm encourages the ECMS to keep the current gear ratio for a somewhat prolonged period, thus trading-off efficiency for comfort.

3. Control Variable Optimization

An overview of the DP-based offline control variable optimization is presented in this section, which is used to establish a benchmark for the verification of the online control strategies and to gain insights into the optimal SoC patterns for different driving conditions.

3.1. Driving Cycle Scenarios

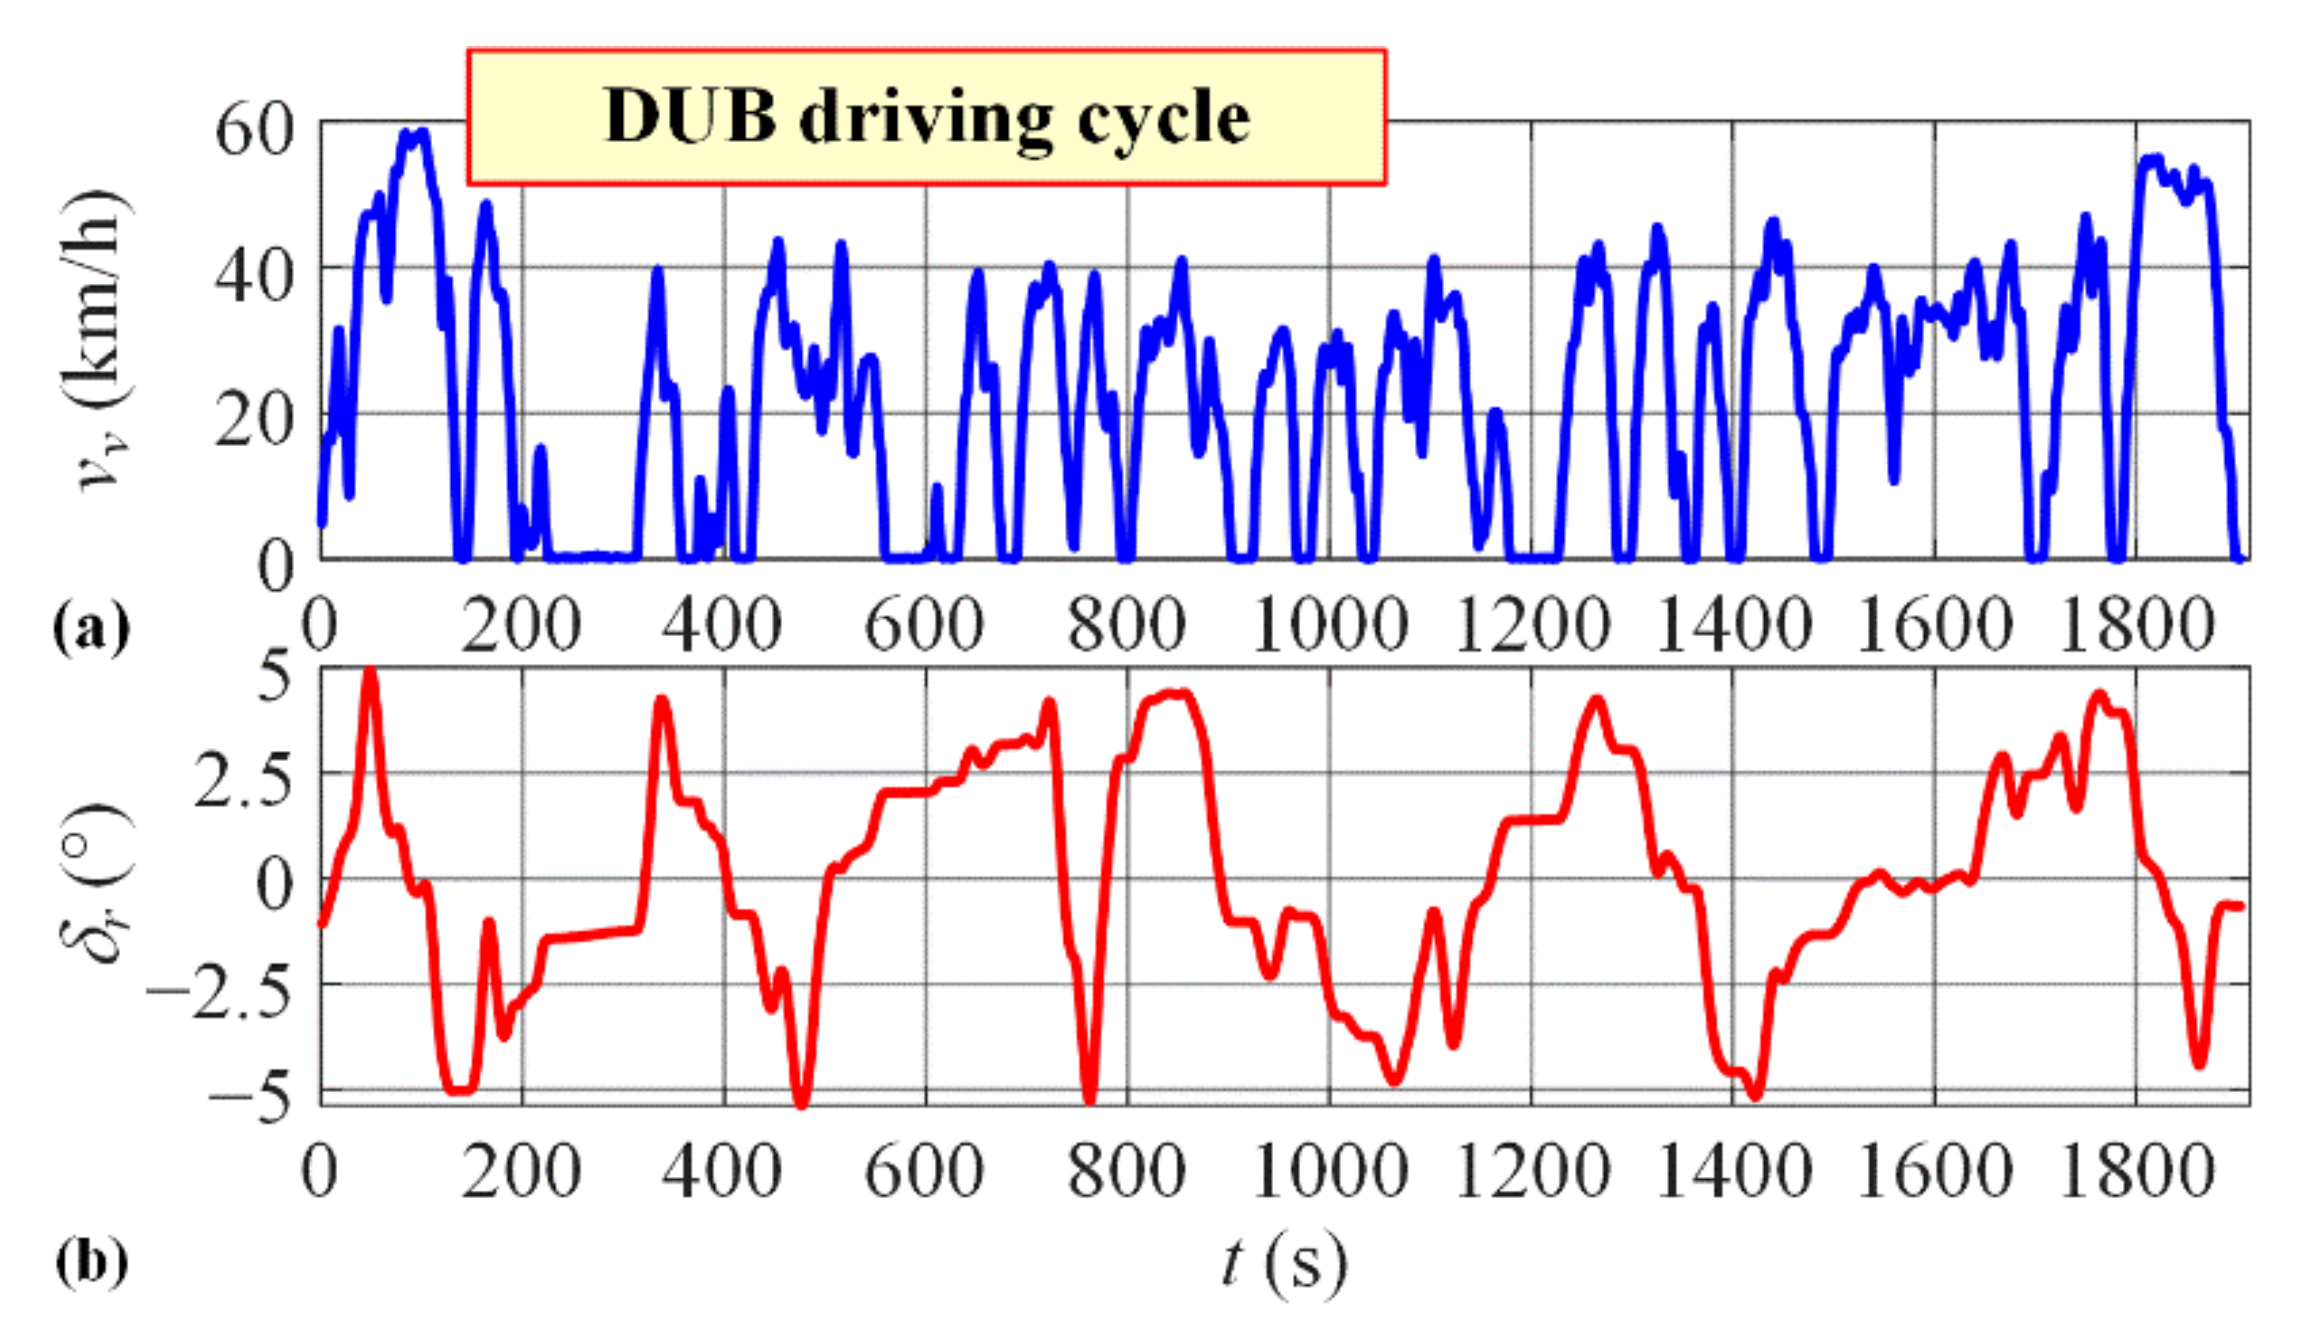
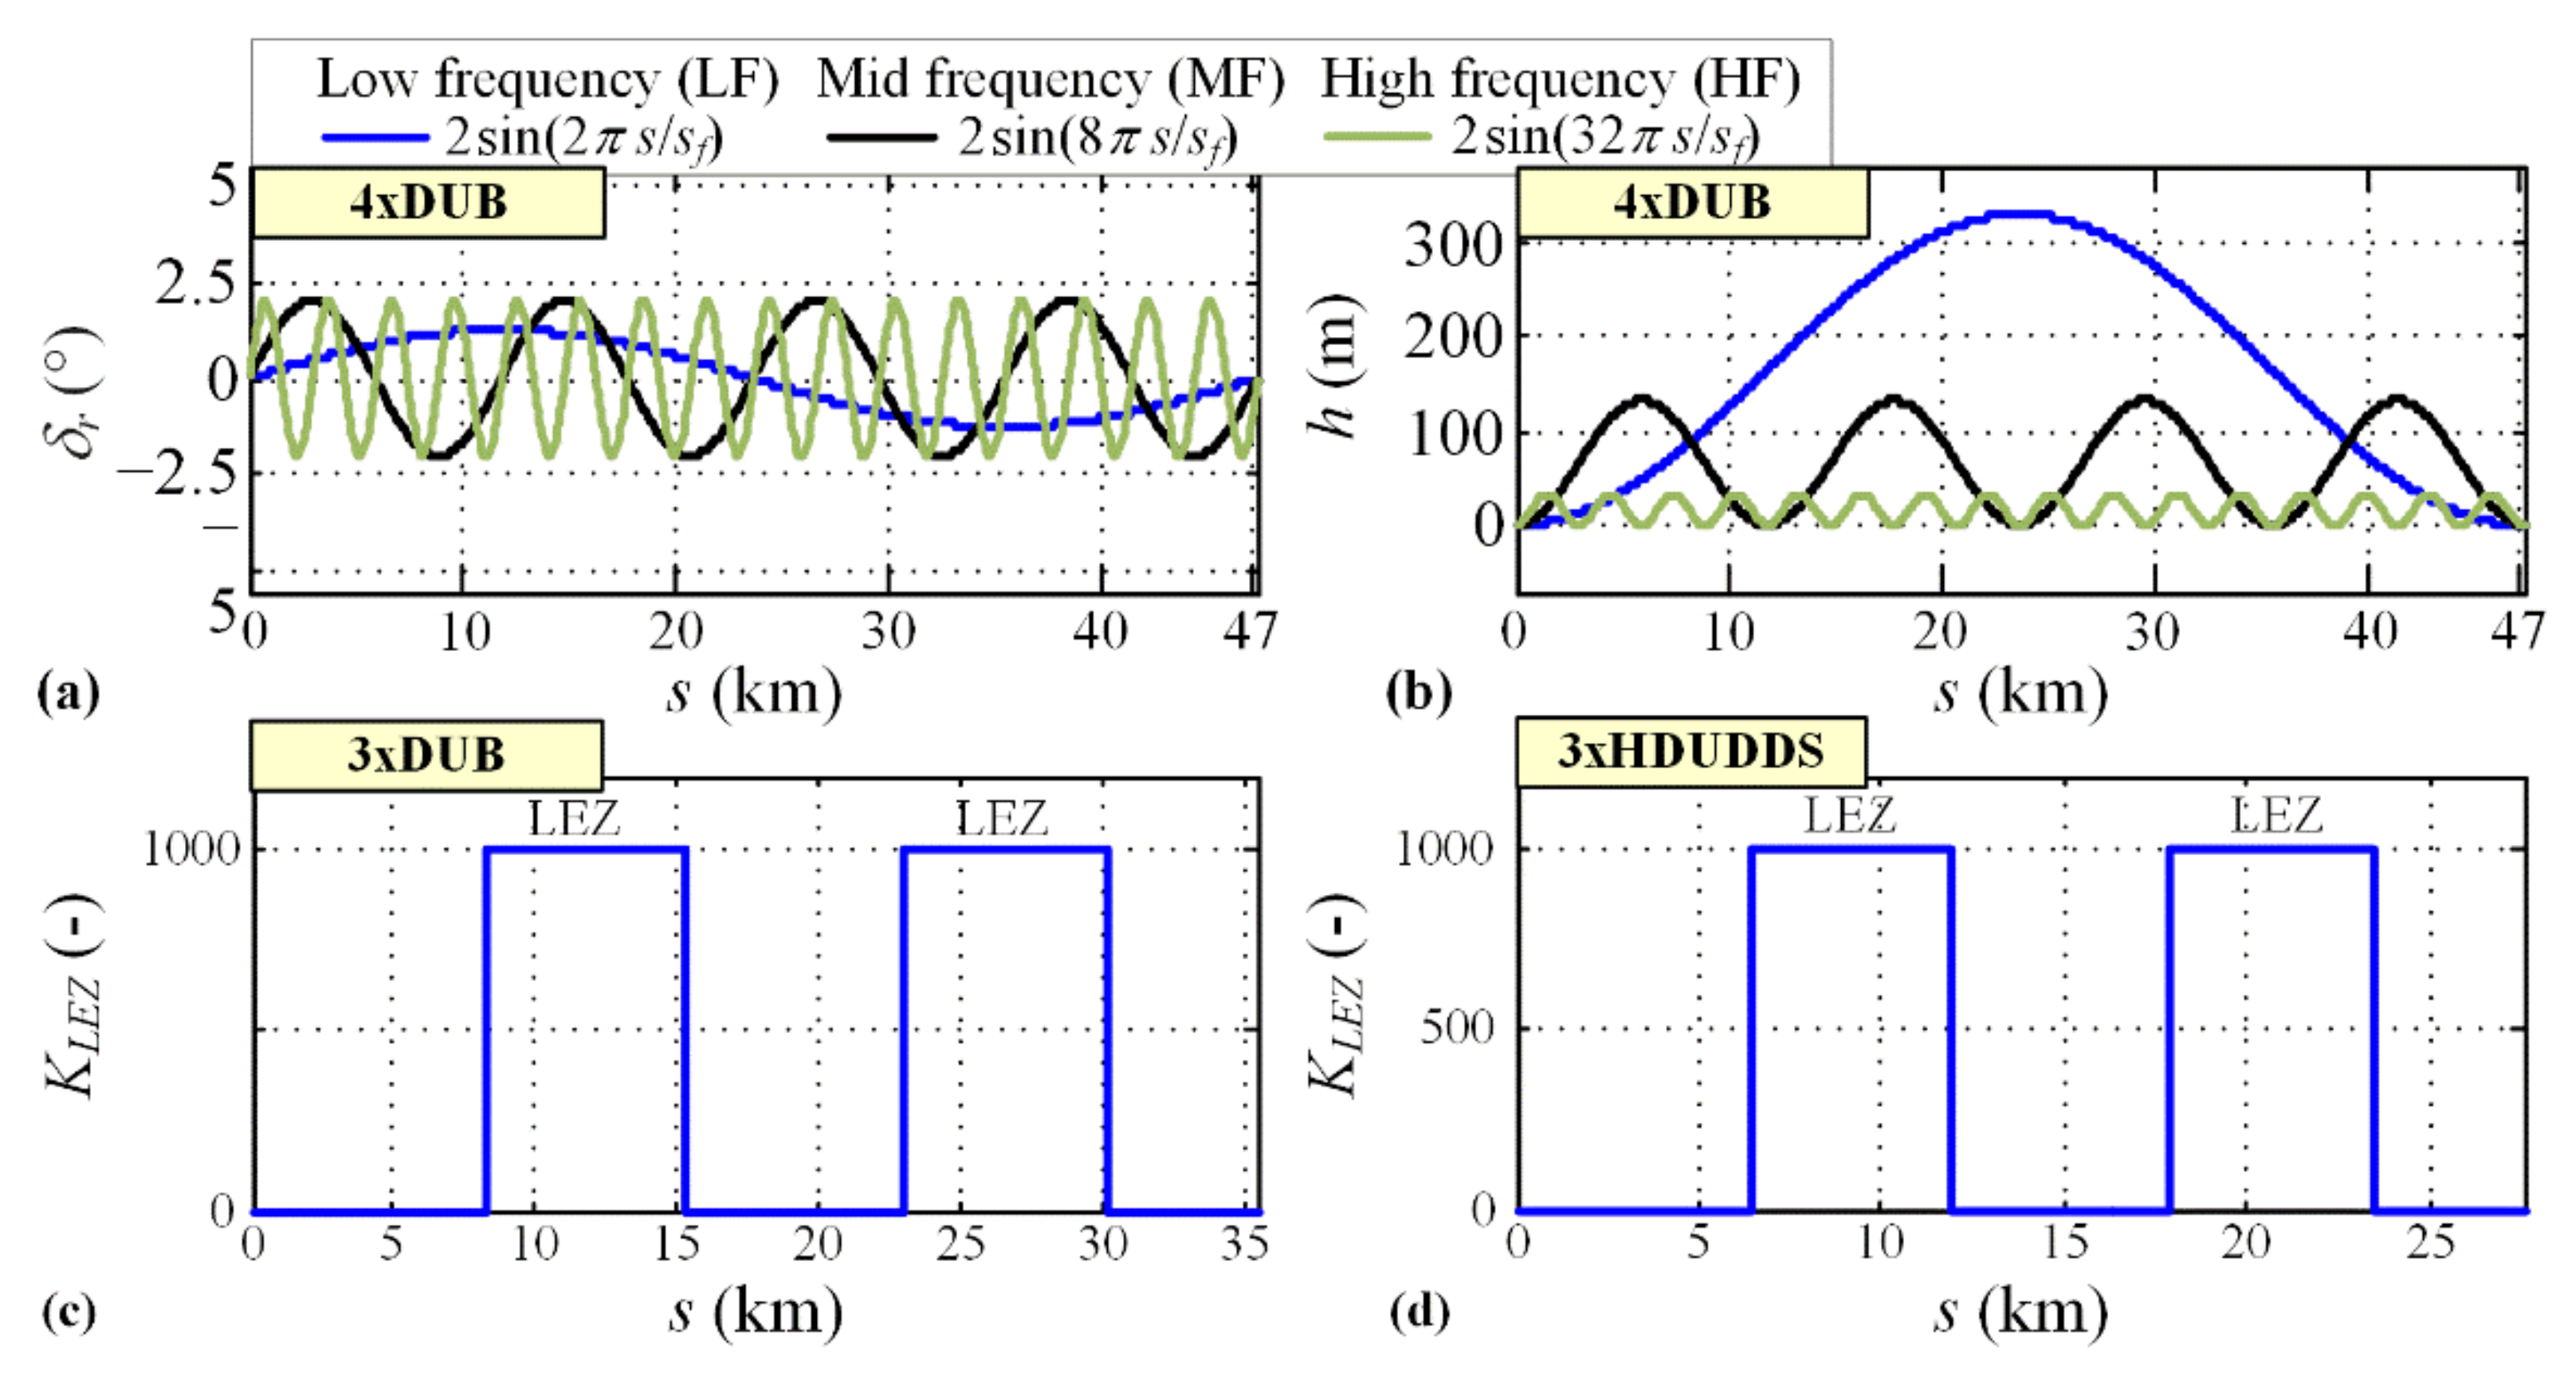
The optimization was conducted over a driving cycle recorded on a circular bus route in the city of Dubrovnik (denoted as DUB cycle and shown in Figure 3 [22]). In addition to velocity time profiles, the driving cycle included the road grade profile (DUB w/rec. grade). In addition, optimizations were conducted over three certification driving cycles that are characteristic for heavy vehicles including HDUDDS, JE05 and WHVC. To further analyse the influence of a varying road grade on the optimal SoC trajectory, optimization over repetitive 4xDUB cycles with sinusoidal road grade profiles of different spatial frequency (Figure 4a) were conducted. Finally, optimizations were conducted over repetitive driving cycles characterized by the existence of low emission zones (LEZs). Two LEZ profiles were considered, as illustrated in Figure 4c,d, where non-zero KLEZ corresponds to LEZ-related segments [8].

3.2. Optimal Problem Formulation

As noted in Section 2, the engine torque τe and the transmission gear ratio h represent control variables (u), which in combination with the wheel speed and torque external inputs (contained in v) determine the M/G machine speed ωe = ωMG and torque τMG, while the battery SoC is the only state variable (x):
x = S o C ,             u = τ e h T   ,             v = τ w ω w   T .
The SoC dynamics are described by the state Equation (6), which is discretized using Euler method with Td = 1 s time step and rewritten into the following, equivalent discrete-time form:
x k + 1 = f x k ,   u k ,   v k ,             k = 0 , 1 , , N 1 ,             N = t f T d ,
where tf is the driving cycle duration, while the initial condition is set as x0 = SoC(0) = SoCi.
The discrete-time cost function to be minimized is described by
J = K f S o C f f x N 1 , u N 1 , v N 1 2 J f + k = 0 N 1 F x k , u k ,   v k ,
where the terminal cost Jf penalizes SoC deviation from the prescribed final value SoCf = SoC(tf), while the second right-hand term relates to fuel consumption and reads [9]:
F x k , u k , v k = m ˙ f , k T d + K L E Z s k m ˙ f , k T d                                                                                   + L x k ,   P b a t t , k ,   τ e , k ,   ω e , k ,   τ M G , k ,   ω M G , k ,
In the right-hand side of Equation (12), the first term corresponds to the fuel consumption increment, the second term penalizes the fuel consumption within the LEZ by multiplying it with the binary LEZ profile signal illustrated in Figure 4c,d, while the third term penalizes the violation of different powertrain constraints/limits (i.e., those related to SoC, battery power, and engine and M/G machine speeds and torques; see [7] for details). The weighting factor Kf in Equation (11) is set to a large enough value to ensure the fulfilment of the SoC boundary condition (Kf = 106, herein).
The presented optimal problem is solved by using dynamic programming (DP), which guarantees a globally optimal solution for a general non-convex problem [23]. Its computational complexity, which grows exponentially with the number of state and control variables, does not pose a major constraint in the given application, as it is characterized by only two control inputs and a single state variable [24].

3.3. Optimization Results

Figure 5 shows the DP optimization results obtained for repetitive DUB driving cycles with recorded road grade profile and three sinusoidal road grade profiles. The LEZ were not considered, and the initial and final SoC values were set to SoCi = 0.9 and SoCf = 0.3, respectively. The optimal SoC trajectory expressed with respect to the travelled distance (Figure 5a) has a linear trend in the case of a zero road grade. However, in the presence of a road grade the optimal SoC trajectory deviates from the linear trend, particularly in the case of low-frequency (LF) and mid-frequency (MF) grade variations [9].
To gain a deeper insight into the optimal SoC trajectory behaviour, the rate of change of the optimal SoC trajectory was analysed with respect to the power demand Pd defined by Equation (4) [9]. Based on the results shown in Figure 5b, three distinct regions can be identified: (i) regenerative braking (Pd ≤ 0), (ii) electric-only driving (0 < PdPd,th; where Pd,th is the identified, driving cycle-dependent power threshold above which the engine is used more frequently), and (iii) hybrid driving for which the SoC rate is significantly reduced and can even be positive (recharging). In the case of regenerative braking and electric-only driving, the optimal SoC rate’s dependence on the power demand Pd can be approximated by a simple quadratic function independently of the grade profile (the fitting curve in Figure 5b) [9]:
S o C ˙ a p p , k = k 1 P d , k 2 + k 2 P d , k + k 3 .
On the other hand, no clear S o C ˙ P d   dependence can be extracted for hybrid driving. In order to establish the SoC rate rules for hybrid driving, the overall optimal SoC vs. distance trajectory was further analysed by decomposing it and rearranging into charging and discharging segments, as illustrated in Figure 5c and described in [9]:
Δ S o C n , k n r e c Δ s k n = Δ S o C k Δ s k ,                 P d , k 0 ,   k n = 0 ,   1 ,   ,   N n 1 , Δ S o C p , k p r e c Δ s k p = Δ S o C k Δ s k ,                 P d , k > 0 ,   k p = 0 ,   1 ,   ,   N p 1 , Δ S o C r e c Δ s = Δ S o C n r e c Δ s Δ S o C p r e c Δ s   ,
where kn and kp denote time instants in which the demanded power Pd,k is negative and positive, respectively. The final, rearranged SoC gradient sequence is obtained by concatenating the resulting sequences with negative and positive SoC rates (operator denotes concatenation of two arrays). The corresponding travelled distance increments are also decomposed and rearranged in the same way:
Δ s r e c = Δ s n , k n r e c Δ s p , k p r e c .
Finally, the rearranged SoC trajectory is reconstructed as
S o C r e c , k + 1 = S o C r e c , k + Δ S o C k + 1 r e c Δ s k + 1 Δ s k + 1 r e c   , S o C r e c , 0 = S o C i ;       k = 0 , , N n + N p 1 .
The reconstructed SoC trajectory shown in Figure 5c indicates linear trends in discharging and charging segments for all, quite distinctive road grade profiles. This means that the peak values of SoC gradients were effectively minimized, which minimized battery and generally electric path power losses [25].

4. Synthesis of Battery SoC Reference Trajectory

Based on the insights gained through the DP optimization results presented in Section 3, offline and online methods of SoC reference trajectory synthesis are proposed in this section.

4.1. Offline Synthesis of Linear SoC Reference Trajectory for Zero Road Case

4.1.1. Case 1: No LEZ Presence

In accordance with the optimization results shown in Figure 5a (red plot), a linear SoC reference trajectory over a travelled distance is set up. This approach only relies on the knowledge of the total trip distance sf and the initial and final SoC (SoCi and SoCf, respectively) [2]:
S o C R , j + 1 = S o C R , j + S o C f S o C i s f s d , j + 1   ,                 j = 0 , 1 ,   ,   N j 1 ,
where j is the discrete distance step, sd,j is the distance within jth discrete step (set to the constant value of 10 m), sf is the driving cycle length and Nj is the total number of discrete distance steps.

4.1.2. Case 2: LEZ Presence

In the case of LEZ presence, a piecewise linear SoC reference trajectory is applied to comply with the DP optimization results presented in [9] (see also Section 5). The total trip distance sf and the LEZ edge positions (see Figure 4c,d) are assumed to be known, while the cumulative/total SoC depletion within all LEZs ( Δ S o C L E Z ) is estimated/predicted in advance ( Δ S o C ^ L E Z ; see [8] for more details). The SoC gradients associated with the piecewise linear segments are calculated individually for LEZ segments (strictly negative due to anticipated electric-only driving) and non-LEZ segments [8], as
Δ S o C R , j Δ s j = S o C f S o C i Δ S o C ^ L E Z s f s L E Z ,           for   K L E Z s j = 0                     Δ S o C ^ L E Z s L E Z ,                                               for   K L E Z s j > 0 ,
where sLEZ is the total length of all LEZ segments. The non-LEZ gradient, given in the first row of Equation (18), is determined from the total SoC difference (SoCfSoCi) and the estimated SoC depletion within LEZs Δ S o C ^ L E Z . Finally, the SoC reference trajectory is reconstructed as (cf. Equation (17)):
S o C R , j + 1 = S o C R , j + Δ S o C R , j + 1 Δ s j + 1 s d , j + 1 .

4.2. Offline Synthesis of a Nonlinear SoC Reference Trajectory for Varying Road Grades

The presented method extends on the previous work [9] in terms of not requiring a preview of the whole driving cycle, but rather a couple driving cycle features. These features include: (i) the total trip distance sf, (ii) the road grade vs. distance profile δr(s), (iii) the mean velocity v ¯ v , and (iv) the mean power demand P ¯ d . The assumption of having these data in advance while planning a trip is found to be reasonable, since sf and δr(s) can be acquired from the vehicle navigation system, v ¯ v could be obtained from historical data and/or cloud-based, online traffic monitoring data, while P ¯ d could be predicted based on historical driving data, particularly for vehicles operating over a constant set of routes (e.g., city buses).
As shown in Figure 5b, the optimal SoC rates for regenerative braking and electric-only driving can accurately be expressed in dependence on the instantaneous power demand Pd,k according to Equation (13). By inserting Equation (3) in Equation (4), the power demand can be described as
P d , k = M v , k v ˙ v , k v v , k η t r , k k t P d , a c c , k + ρ a i r A f C d v v , k 3 η t r , k k t P d , a e r o , k +                                                                                                   + M v , k R 0 g cos δ r , k v v , k η t r , k k t P d , r o l l , k + M v , k g sin δ r , k v v , k η t r , k k t P d , g r a d e , k + P 0 , k ω w .
By introducing the assumptions on the constant vehicle velocity (denoted by v ¯ v ) and the constant vehicle mass and transmission efficiency (denoted by Mv and η ¯ t r , respectively), Equation (20) can be rewritten to
P ^ d , k = P ^ d , a c c + ρ a i r A f C d v ¯ v 3 η ¯ t r k t P ^ d , a e r o + M v R 0 g cos δ r , k v ¯ v η ¯ t r k t P ^ d , r o l l , k + + M v g sin δ r , k v ¯ v η ¯ t r k t P ^ d , g r a d e , k + P 0 v ¯ v r w P ^ 0   .
Due to the assumption of constant velocity (i.e., zero acceleration), the term P ^ d , a c c in Equation (21) would be equal to zero. However, in order to account for the effort of vehicle acceleration and the related power consumption, the term P ^ d , a c c is retained in Equation (21) as a non-zero offset. This offset is determined to satisfy the mean power demand P ¯ d , as the driving cycle feature is assumed to be known in advance:
P ^ d , a c c = P ¯ d P ^ d , a e r o P ^ 0 k = 0 N 1 P ^ d , r o l l , k + P ^ d , g r a d e , k N .
For steps for which the condition P ^ d , k P d , t h holds, the SoC reference gradient is derived from Equation (13) (see Figure 5b for illustration). For the remaining distance steps (i.e., when P ^ d , k > P d , t h holds), the SoC reference gradient over the travelled distance is set to a constant that satisfies the final SoC condition. The constant gradient is selected to minimize the SoC trajectory length and correspondingly the battery power losses, as discussed in Section 3 and illustrated in Figure 5c. Since Equation (22) represents an approximation based on a limited set of available driving cycle data, the threshold Pd,th is conservatively set to 0 (the regenerative braking boundary) rather than to the real-boundary: the positive value from Figure 5b (electric-only driving). Hence, the SoC reference gradient in the kth step is determined as:
Δ S o C R , k Δ s k = k 1 P ^ d , k 2 + k 2 P ^ d , k + k 3 1 v ¯ v ,     for   P ^ d , k 0 S o C i S o C f Δ S o C r e g , o f f s f Δ s r e g , o f f ,                             otherwise   ,
where Δ S o C r e g , o f f and Δ s r e g , o f f represent the cumulative, regenerative braking-related SoC reference change and the total distance travelled, respectively, which can be calculated from the predicted power demand profile P ^ d , k , given by Equations (21) and (22), and the assumed mean velocity v ¯ v as:
Δ S o C r e g , o f f = k = 0 N 1 ϕ 1 , k T d ,       ϕ 1 , k = k 1 P ^ d , k 2 + k 2 P ^ d , k + k 3 ,         for   P ^ d , k 0 0 ,                                                                               otherwise   ,
Δ s r e g , o f f = k = 0 N 1 ϕ 2 , k ,   ϕ 2 , k = v ¯ v T d ,       for   P ^ d , k 0 , 0 ,                   otherwise     .  
where Td is the discrete time step. Note that that the total number of time steps is estimated as N = s f / T d v ¯ v . The final SoC reference trajectory is reconstructed in the travelled distance domain according to Equation (19), with s d , j = v ¯ v T d , which is conducted immediately before the trip. It should be noted that in the case of a zero road grade profile, the above, nonlinear SoC reference trajectory generation method reduces to the linear one presented in Section 4.1.1. Namely, due to the constant vehicle velocity assumption and zero-road grade, the predicted power demand P ^ d , k is always positive (no regenerative braking), which results in a constant SoC gradient in accordance with Equations (23)–(25), and consequently in a linearly falling SoC in accordance with Equation (17).

4.3. Online Synthesis of SoC Reference Trajectory

In order to achieve a better synthesis accuracy, the proposed online synthesis method relies on actual driving cycle-related inputs and SoC change predictions based on past inputs. The sensitivity to assumptions is mitigated by using corrective actions based on offline synthesis results.

4.3.1. Online Prediction of PHEV Powertrain Operation Features

In the offline synthesis method (Section 4.2), the regenerative braking-related values of the total SoC reference change (∆SoCreg,off) and travelled distance (∆sreg,off) need to be predicted before the trip. In order to enhance the synthesis accuracy, these quantities are now meant to be updated within the online method, where they are denoted as Δ S o C ^ r e g , N and Δ s ^ r e g , N . The same quantities are predicted for electric-only driving (denoted as Δ S o C ^ e l , N and Δ s ^ e l , N ). These predictions are used by the online synthesis method presented in Section 4.3.2.
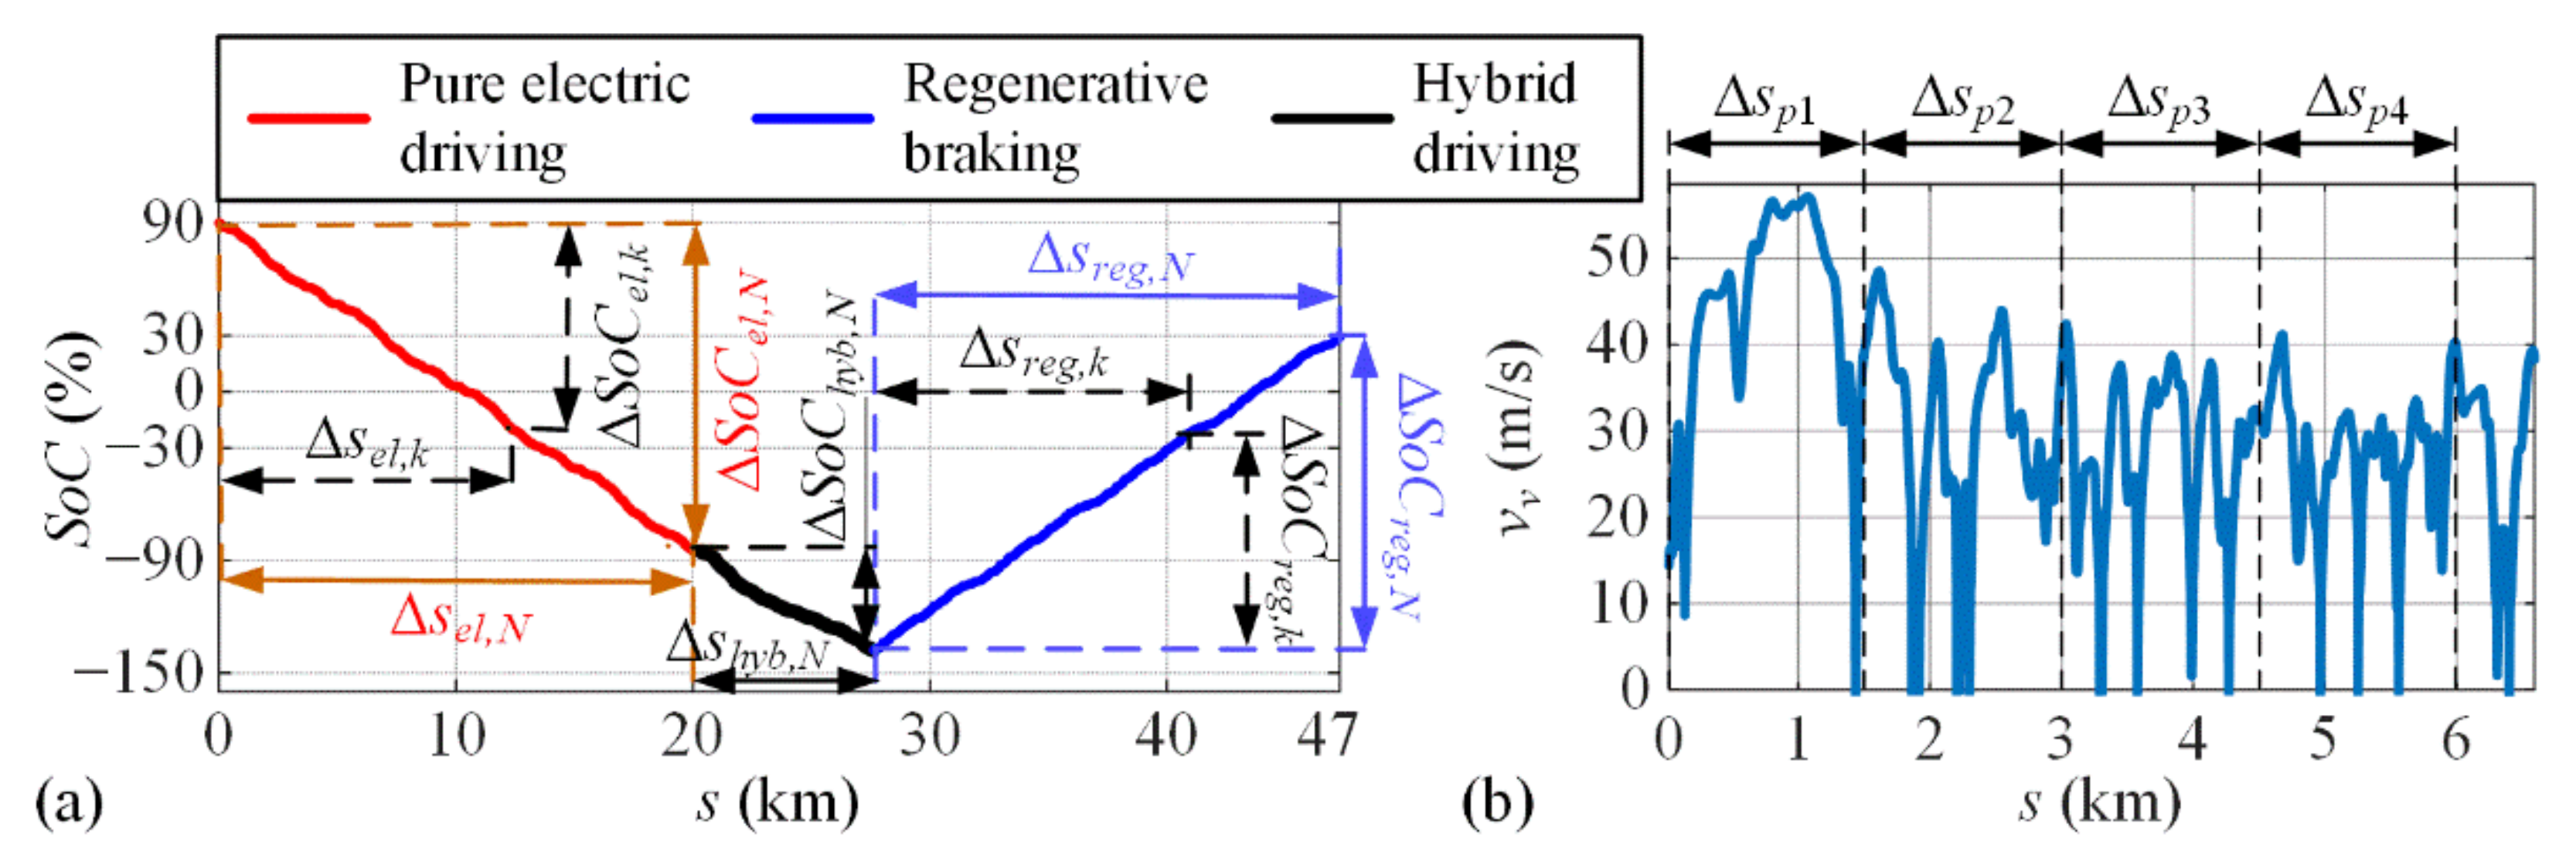
The rearranged DP-optimal SoC trajectory from Figure 5c can further be segmented into pure electric driving, hybrid driving, and regenerative braking segments. The corresponding results shown in Figure 6a point again to a linear-like SoC vs. the distance trends in the electric-only driving and regenerative braking segments. Therefore, the total SoC changes and the travelled distances corresponding to those two operating modes can be predicted/updated for the whole trip based on the data collected up to the current, kth time step by means of linear extrapolation (see Figure 6a for illustration):
Δ S o C ^ r e g , N = Δ s ^ r e g , N Δ S o C r e g , k Δ s r e g , k = s f s k Δ s r e g , k Δ s ^ r e g , N Δ S o C r e g , k Δ s r e g , k = s f s k Δ S o C r e g , k ,  
Δ S o C ^ e l , N = Δ s ^ e l , N Δ S o C e l , k Δ s e l , k = s f s k Δ s e l , k Δ s ^ e l , N Δ S o C e l , k Δ s e l , k = s f s k Δ S o C e l , k ,
where sk denotes the distance travelled up to the kth instant, and Δ S o C r e g , k   and Δ S o C e l , k are the total SoC reference changes in regenerative braking and the pure electric drive up to the kth instant, respectively, which are iteratively updated as defined in Appendix C.
The prediction of the total distance travelled in the hybrid driving mode, Δ s ^ h y b , N , is determined as (see Figure 6a):
Δ s ^ h y b , N = s f s L E Z s f s k Δ s r e g , k Δ s ^ r e g , N s f s k Δ s e l , k Δ s ^ e l , N   ,
where the iterative process of updating Δ s r e g , k and Δ s e l , k is expressed in Appendix C. Similarly, the prediction of the total SoC change in the hybrid driving mode, Δ S o C ^ h y b , N , is obtained as
Δ S o C ^ h y b , N = S o C f S o C i Δ S o C ^ L E Z Δ S o C ^ e l , N Δ S o C ^ r e g , N .
The predictions Δ S o C ^ r e g , N , Δ S o C ^ e l , N , Δ S o C ^ h y b , N and Δ s ^ h y b , N are updated/sampled at the end of every prediction-related trip section Δsp,l, which is, herein, set to Δsp,l = 1.5 km (see illustration in Figure 6b). Note, however, that the iterative process of calculating the components of these predictions (Appendix C) is run in each sampling instant k. The total SoC change within the LEZs, Δ S o C ^ L E Z , is predicted only at the beginning of the trip based on Equation (13) (for assumed electric driving within LEZ), and the known/predicted mean demanded power P ¯ d and the mean velocity v ¯ v :
Δ S o C ^ L E Z = s L E Z v ¯ v k 1 P ¯ d 2 + k 2 P ¯ d + k 3 ,  

4.3.2. Online Synthesis Method

The SoC reference gradient is calculated online in each discrete time step k depending on the actual values of the power demand Pd,k and the velocity vv,k, and using the predictions given by Equations (26)–(30):
Δ S o C R , k Δ s k = k 1 P d , k 2 + k 2 P d , k + k 3 1 v v , k ,       for   P d , k P d , t h   or   K L E Z s k > 0 Δ S o C ^ h y b , N + Δ S o C R , c o r r Δ s ^ h y b , N ,                                 otherwise   ,
where Equation (13) is employed for electric-only driving and regenerative braking ( P d , k P d , t h ), as well as within LEZs ( K L E Z s k > 0 ), while a constant, predictions-dependent SoC gradient is set for hybrid driving to resemble the DP-observed linear-like SoC vs. distance trend (Figure 6a, black line). The threshold P d , t h is set to the mean value of the engine power on/off thresholds ( P d , t h = (PonPoff)/2; Appendix B). The term Δ S o C R , c o r r represents a corrective action introduced to improve the robustness of the synthesis in the presence of prediction errors. This corrective action is described in more detail at the end of this section. Note that in the first trip section (Δsp,1 in Figure 6b), for which there are no valid predictions, the nominal, constant SoC gradient (SoCfSoCi)/sf (cf. Equation (17)) is applied at the place of right-hand side of Equation (31). Alternatively, the gradient calculated by the offline method has been considered in that case, with no notable difference observed in the final simulation results.
The SoC reference gradient calculated by Equation (31) is limited in accordance with the following inequality:
1 v v , k S o C ˙ a p p P d , k Δ S o C R , k Δ s k 1 v v , k S o C ˙ max ,  
where the lower limit is introduced because the SoC gradient in hybrid driving should not be lower (i.e., larger in absolute value) than that in the electric-only driving (here approximated by S o C ˙ a p p , k given in Equation (13)), while the upper limit is imposed to reflect the limit on the maximum battery power (see [9] for more details).
The predictions based on Equations (26)–(30) may be imprecise to some extent in the cases of varying road grade or mixed driving patterns, thus resulting in a sub-optimal SoC reference trajectory synthesis and a deviation from the SoC value at the end of trip (SoCf). To improve the robustness of the synthesis, certain constraints are imposed on the predictions. First, the prediction Δ S o C ^ r e g , N is limited as given by
k l Δ S o C r e g , o f f Δ S o C ^ r e g , N k u Δ S o C r e g , o f f ,
where Δ S o C r e g , o f f represents the regenerative braking-related SoC change determined by the offline synthesis method (see Equation (24)), while the coefficients kl and ku determine the allowed prediction variation range (Appendix B). Next, a lower limit is imposed to the prediction Δ S o C ^ e l , N :
S o C f S o C i Δ S o C ^ r e g , N Δ S o C ^ L E Z Δ S o C ^ e l , N ,
which is derived from the ‘idealized’ case of exclusively using electric-only driving including regenerative braking (no hybrid driving at all; cf. Equation (29)).
Finally, the prediction of the distance travelled in hybrid driving, Δ s ^ h y b , N , is subject to an upper limit derived from the opposite (worst) case of exclusively using hybrid driving outside LEZs and apart from regenerative braking:
0 Δ s ^ h y b , N s f Δ s ^ r e g , N s L E Z .
In addition to the constraints imposed on the predictions, the aforementioned corrective term Δ S o C R , c o r r is introduced in Equation (31), in order to further improve robustness with respect to prediction errors. For this purpose, an auxiliary SoC reference trajectory SoCR,off is set up, which is equated with the reference synthesized by the offline method in Section 4.1 and Section 4.2. The corrective term Δ S o C R , c o r r is then determined based on the following proportional feedback control law:
Δ S o C R , c o r r = k r e f S o C R , o f f , k S o C R , k ,  
where SoCR,k is the actual SoC reference value determined by Equations (31) and (19), and the proportional gain kref is set arbitrarily as a trade-off between robustness and performance.

5. Simulation Results

This section presents the results of the simulation verification of the proposed SoC reference trajectory synthesis methods, based on the PHEV backward model and RB+ECMS controller presented in Section 2. The results are given for different repetitive driving cycles, including varying road grade and LEZ scenarios. The performance of the overall control strategy is verified against the DP benchmark, and also in comparison with the basic, charge depleting/charge sustaining (CD/CS) control strategy that does not require an SoC reference trajectory. The verification study also includes a robustness analysis with respect to the change in the SoC prediction errors.

5.1. Scenarios with no LEZ Presence

5.1.1. Zero Road Grade

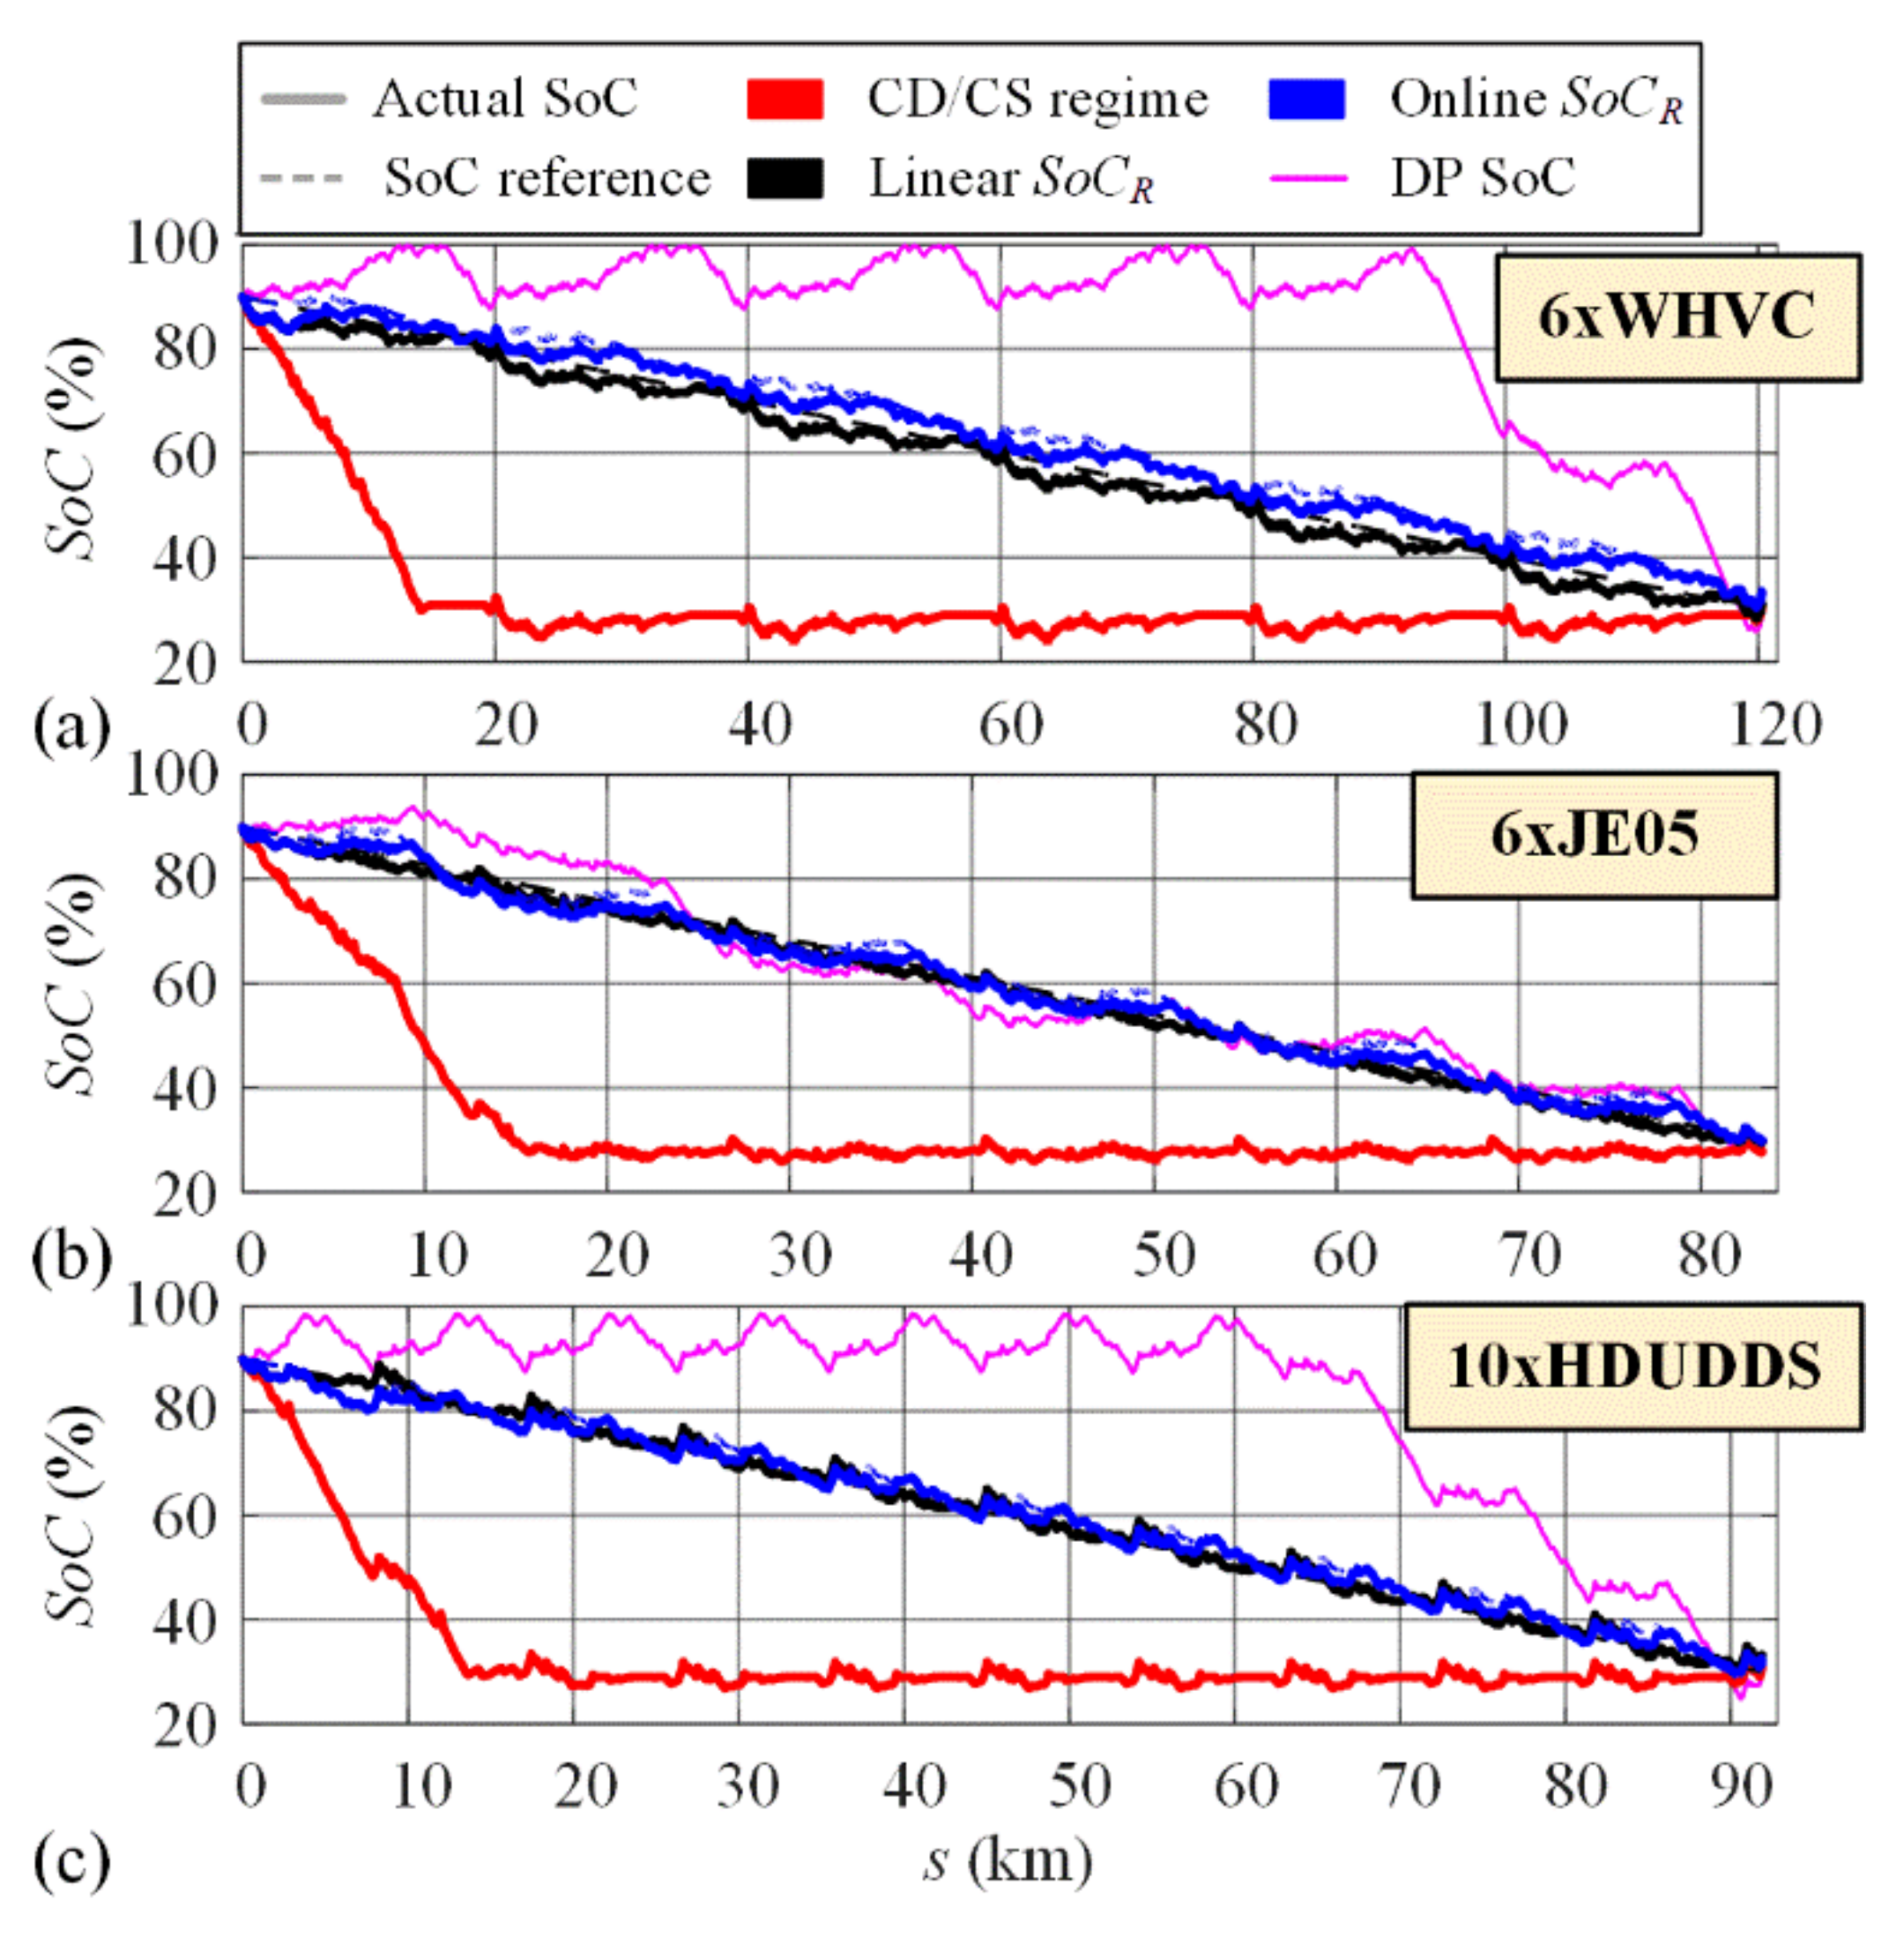
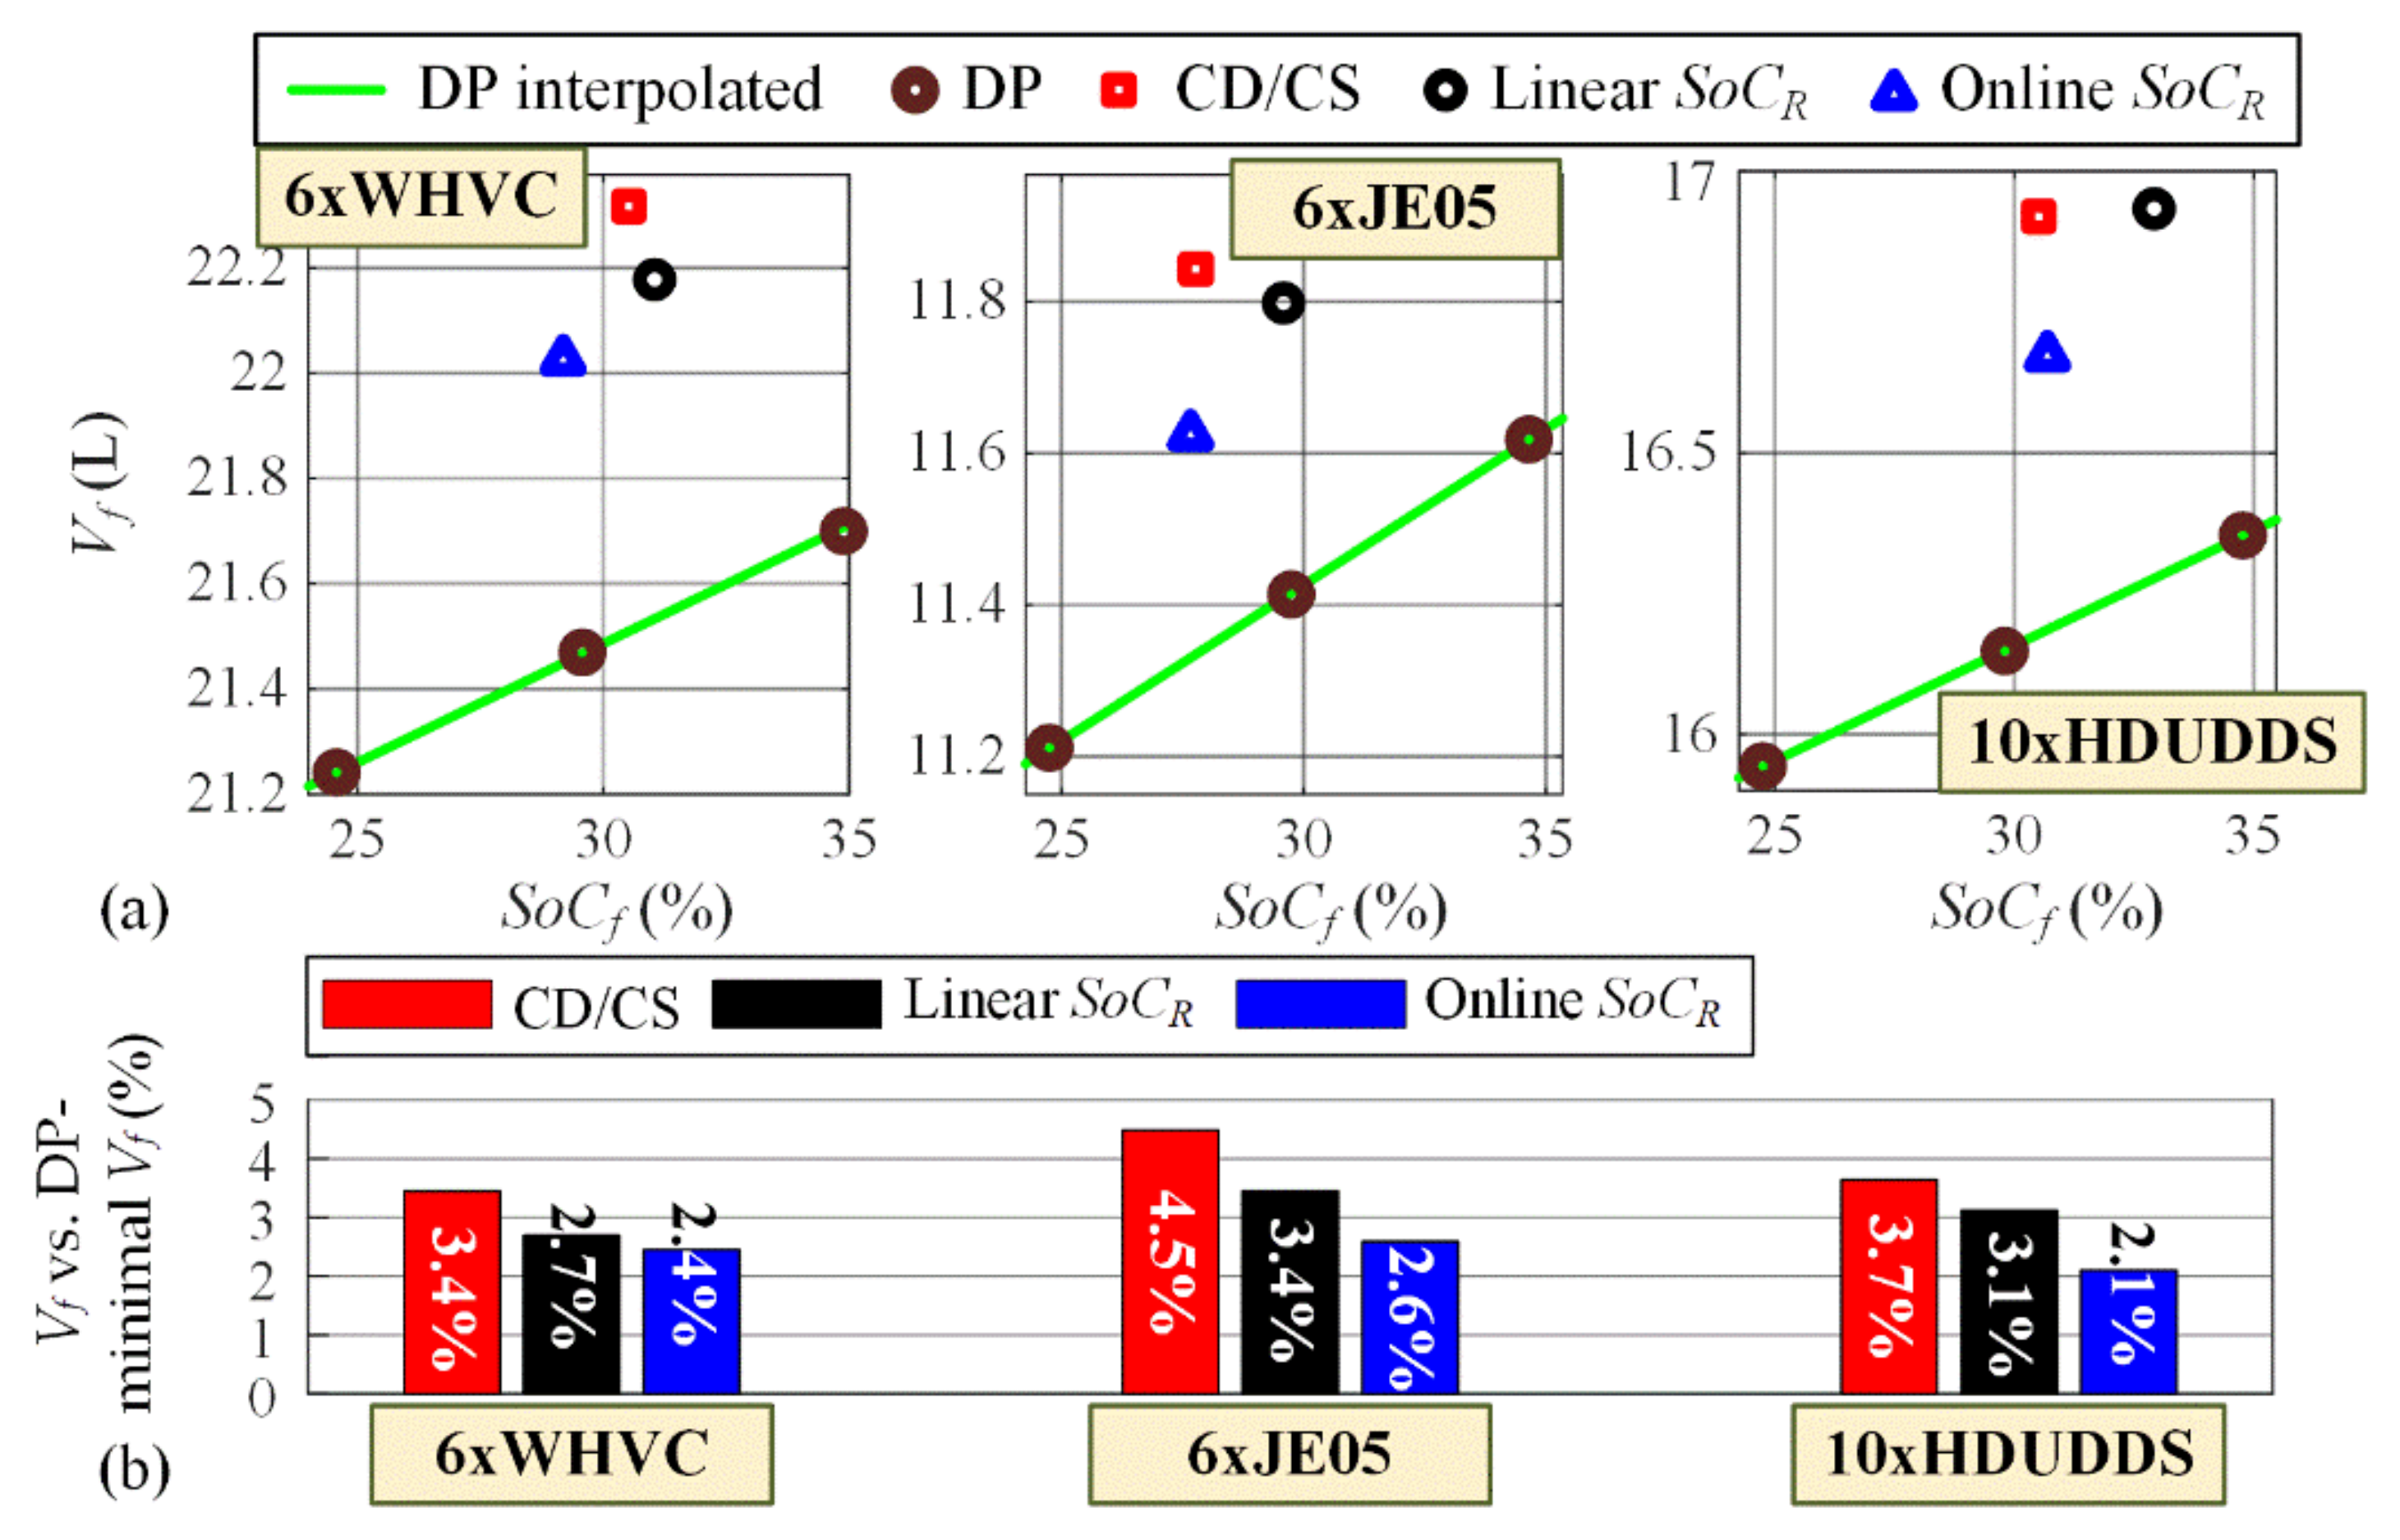
Figure 7 shows the SoC vs. the distance trajectories obtained for different driving cycles and control strategy variants. Solid lines represent the actual SoC trajectories, while the reference trajectories are shown by dashed lines (except for DP and CD/CS case, where SoCR is meaningless). The initial and final SoC values were set to SoCi = 90% and SoCf = 30%, respectively. The corresponding fuel consumption results are shown in Figure 8 in comparison with linearly interpolated DP-minimized values determined for different values of SoCf.
While the DP-optimal SoC trajectory exhibited the expected, linear-like trend for the 6xJE05 cycle (Figure 7b), it behaved very differently in the case of the 6xWHVC and 10xHDUDDS cycles and assumed a CS/CD-like form (Figure 7a,c). This effect is analysed in detail by the authors in [26], who shows that it is characteristic for longer driving cycles and associated with a tendency to minimize the SoC-dependent battery power losses. Although the DP-optimal CS/CD shape significantly differs from the linear trend, using the linear SoCR trajectory results in a similar fuel consumption increase against the DP benchmark of around 3% for both WHVC/HDUDDS and JE05 driving cycles (Figure 8b, black bars), i.e., those with CS/CD and linear-like profiles of DP-optimal SoC trajectory, respectively (cf. Figure 7).
The results in Figure 8 further indicate that in the case of a basic, CD/CS control strategy, the fuel consumption increases with respect to the DP benchmark from around 3% to 5% depending on the driving cycle. When using the linear SoCR trajectory, this fuel consumption excess reduces from 2.7% to 3.4%. Note that the offline synthesis gives the same linear SoCR in the considered special case of no LEZ and zero road grade. Finally, if the more complex, nonlinear, online-synthesized SoC reference is applied, the fuel consumption excess is consistently further reduced from between 2.6% and 2.1% depending on the cycle. The performance improvement of the online synthesis strategy may be explained by its ability to anticipate regenerative braking opportunities and accordingly update the SoCR trajectory to make use of regenerated energy later in an efficient manner. On the contrary, when imposing the strictly linear SoCR trajectory, any regenerated energy which causes the deviation from the linear SoCR pattern would tend to be discharged shortly afterwards, thus affecting the efficiency.

5.1.2. Varying Road Grade

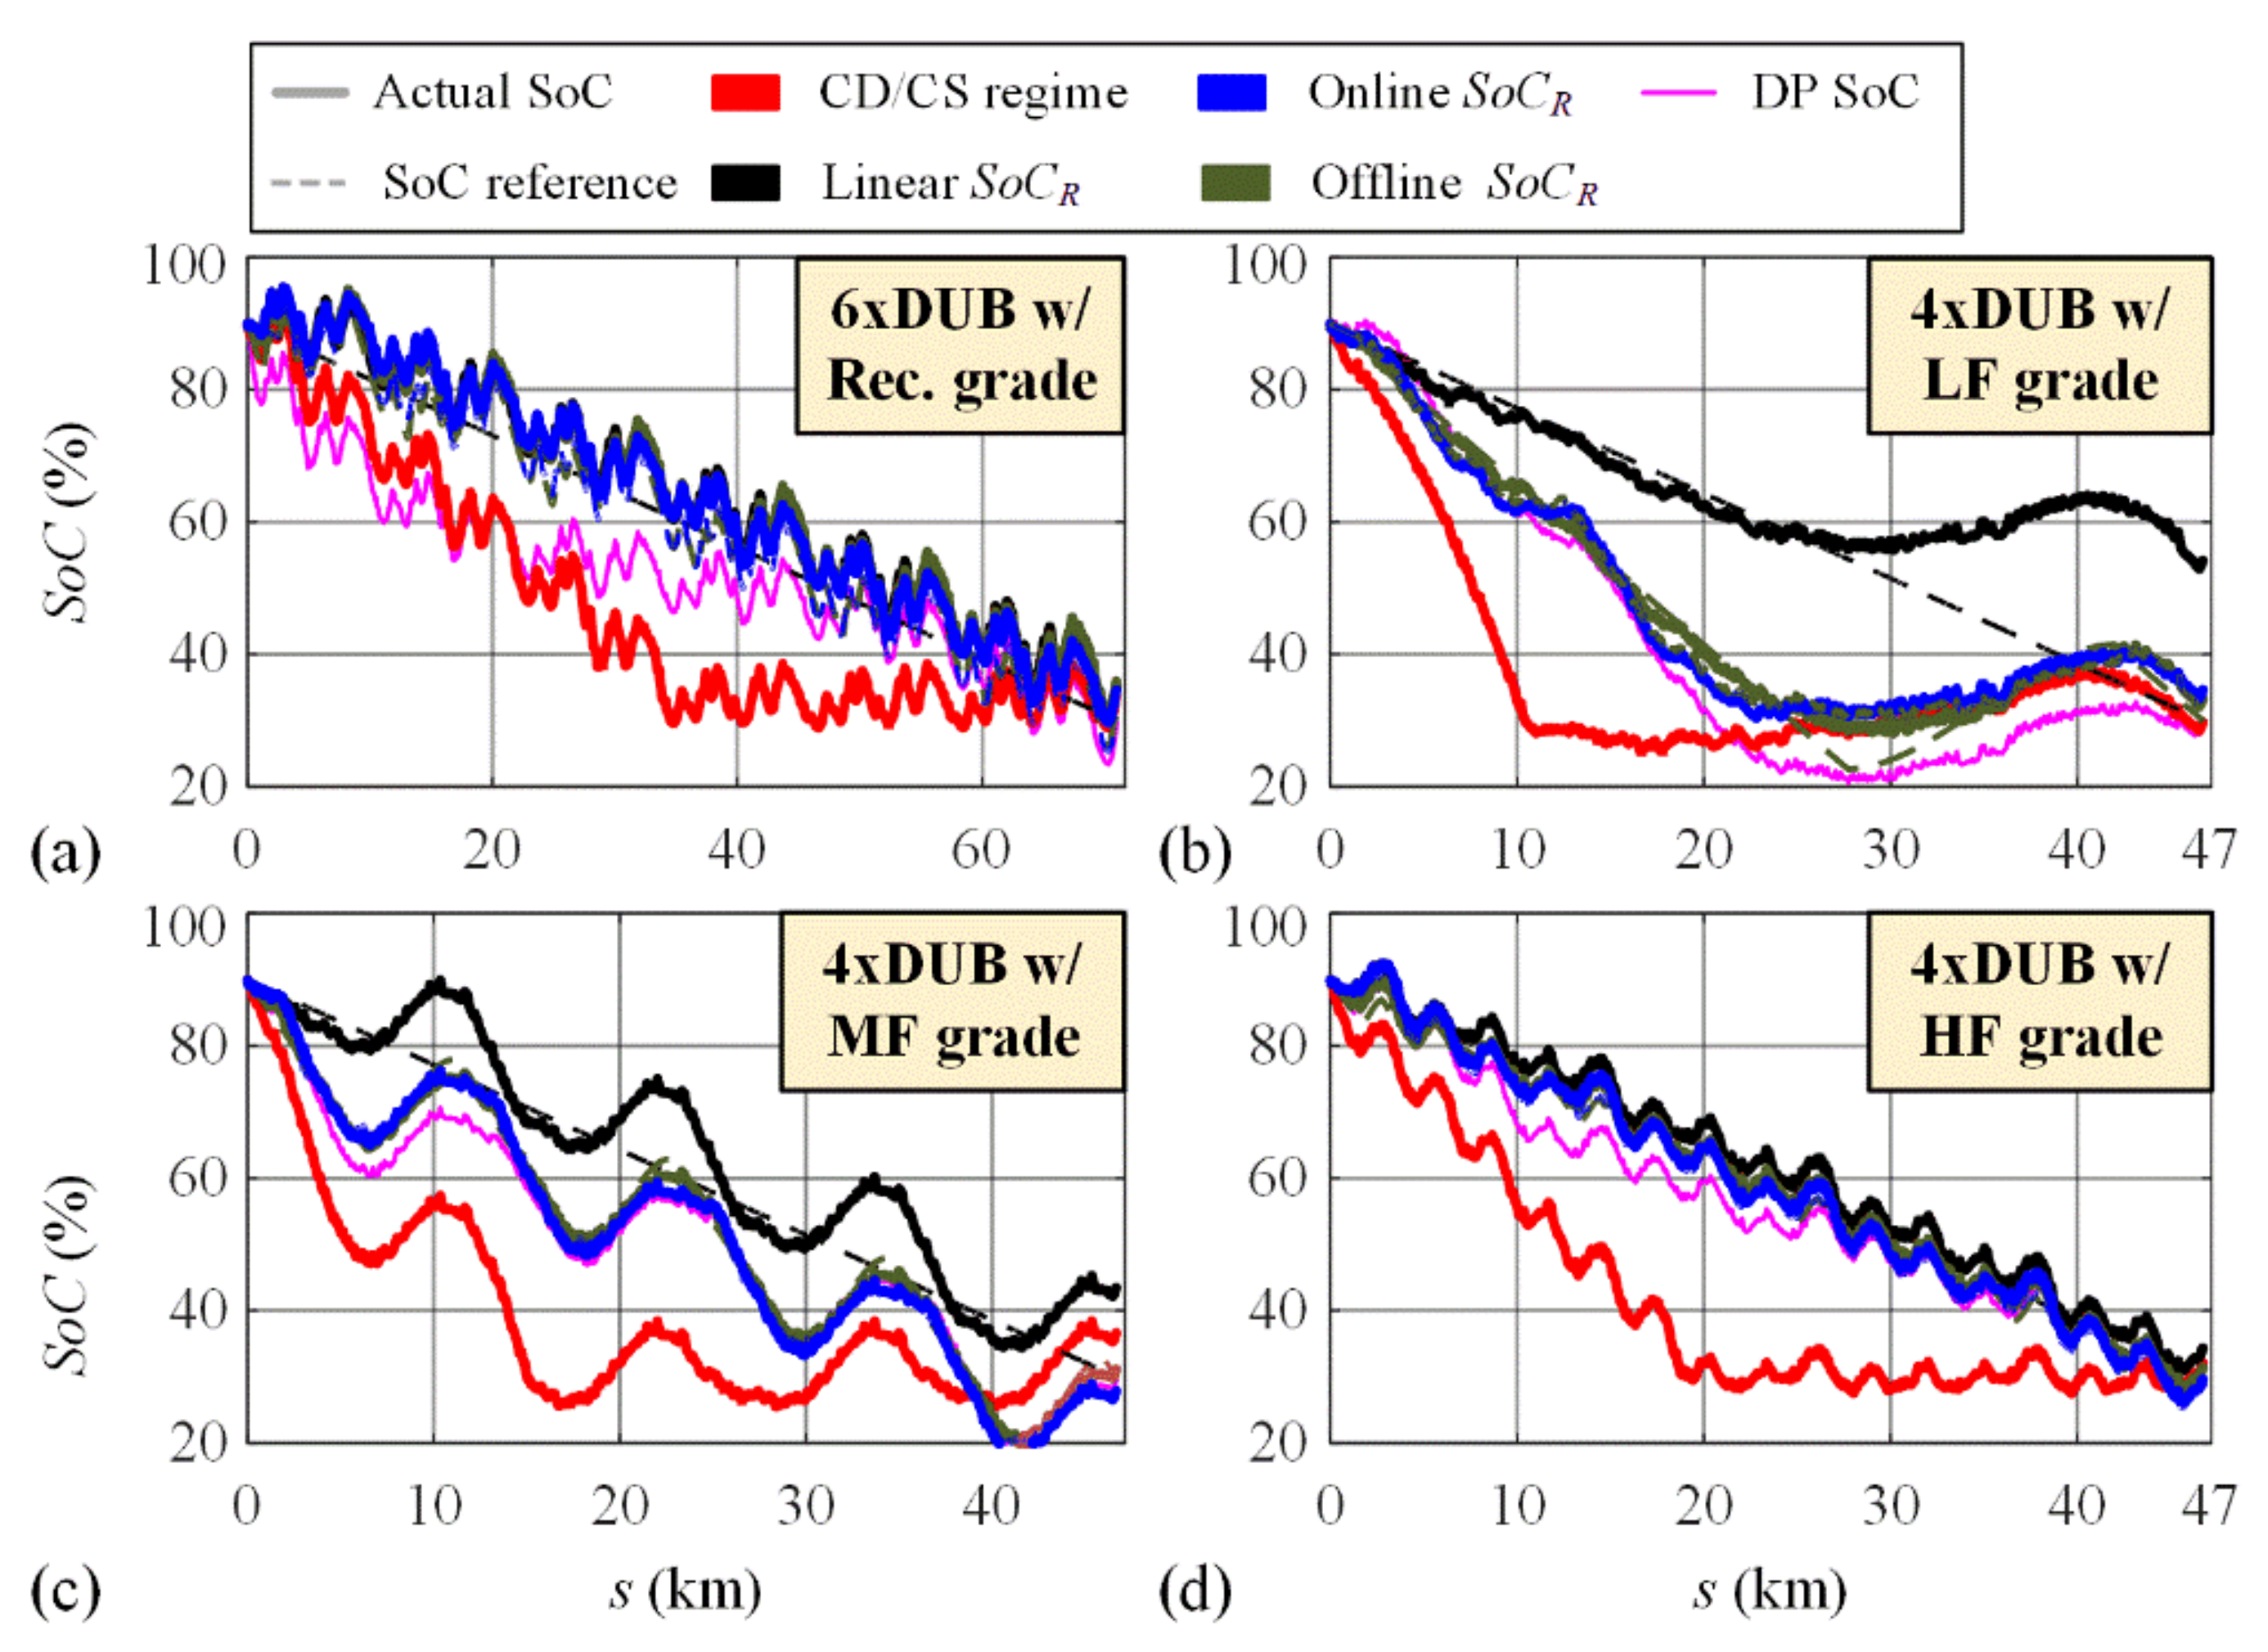
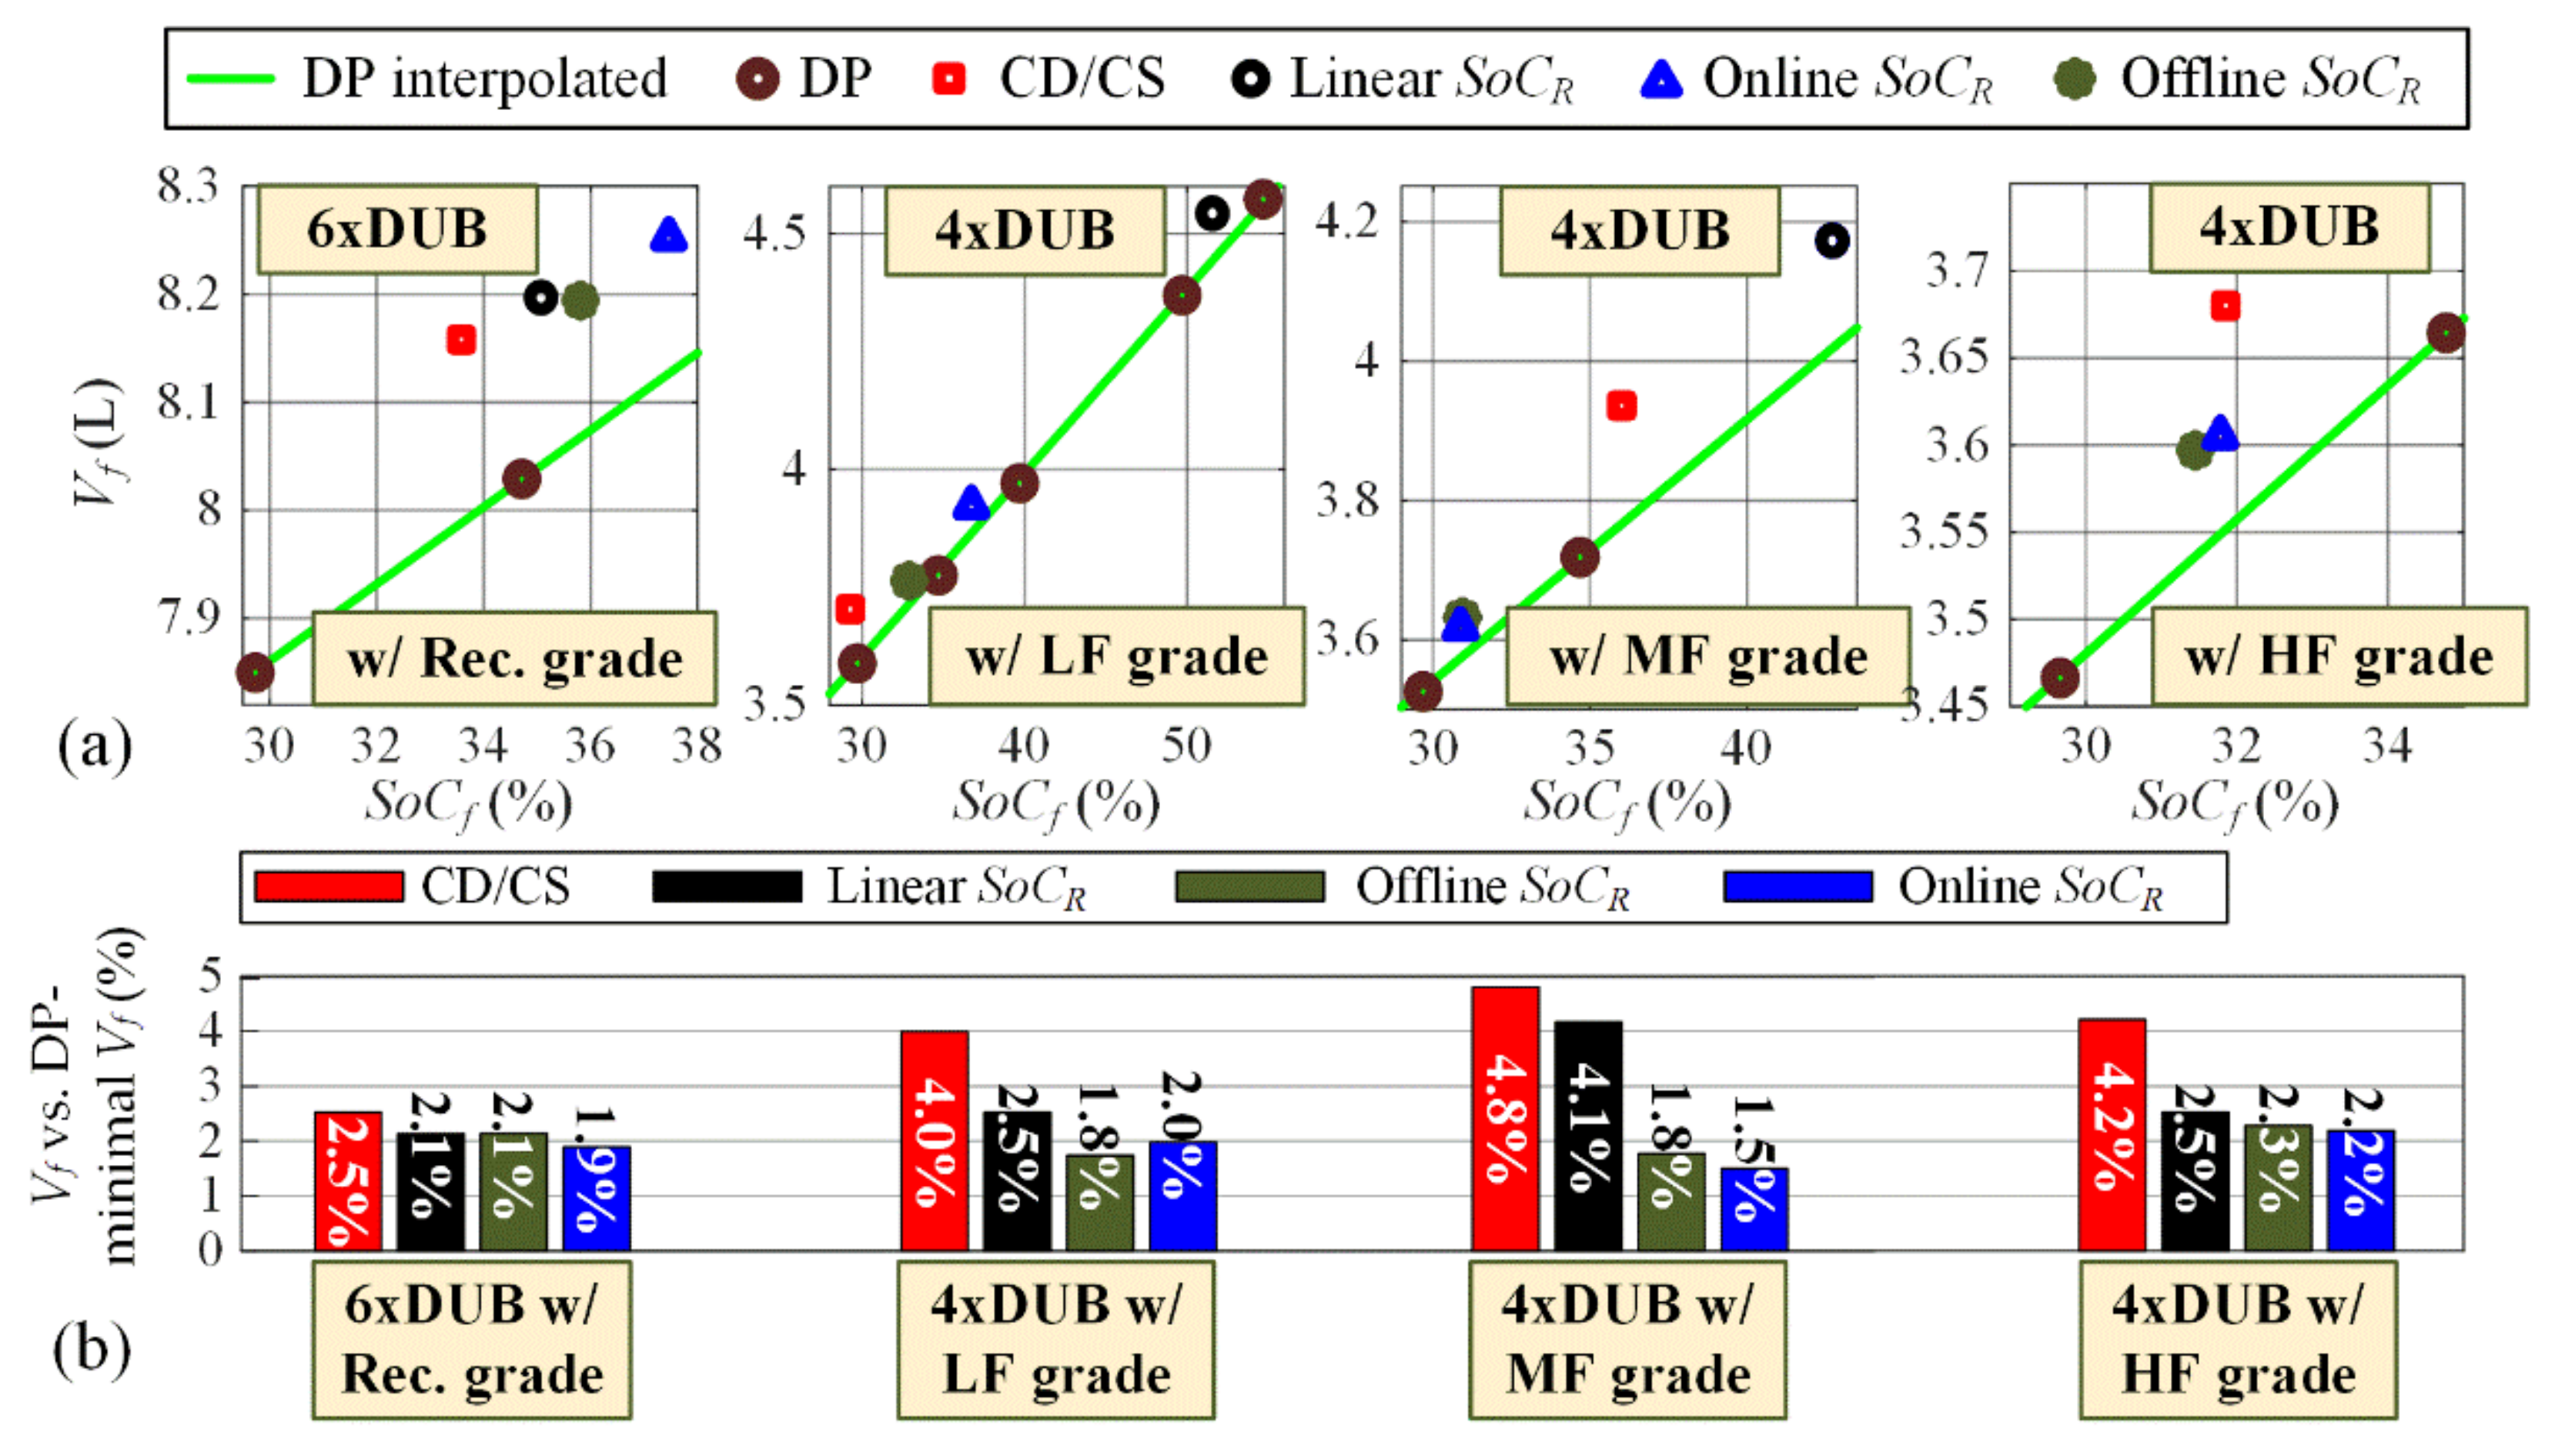
Figure 9 shows the SoC trajectories obtained for repetitive DUB cycles with recorded and sinusoidal road grade profiles, and different control approaches. The corresponding fuel consumption results are given in Figure 10. As already observed with Figure 5, the DP optimal SoC trajectories can significantly vary from the linear trend for the case of varying road grade, particularly for low- and mid-frequency variations (Figure 9). Therefore, applying the linear SoCR trajectory in those cases may not lead to a considerable improvement in fuel economy when compared to the basic, CD/CS strategy (see e.g., the mid-frequency case in Figure 10). When using the proposed offline or online SoCR trajectory synthesis methods, the SoC trajectory becomes closer to the DP optimal one (Figure 9) and the fuel consumption considerably and consistently reduces, particularly in the aforementioned mid-frequency case (Figure 10). The online method mostly performs better than the offline one.

5.2. LEZ Scenarios with Zero Road Grade

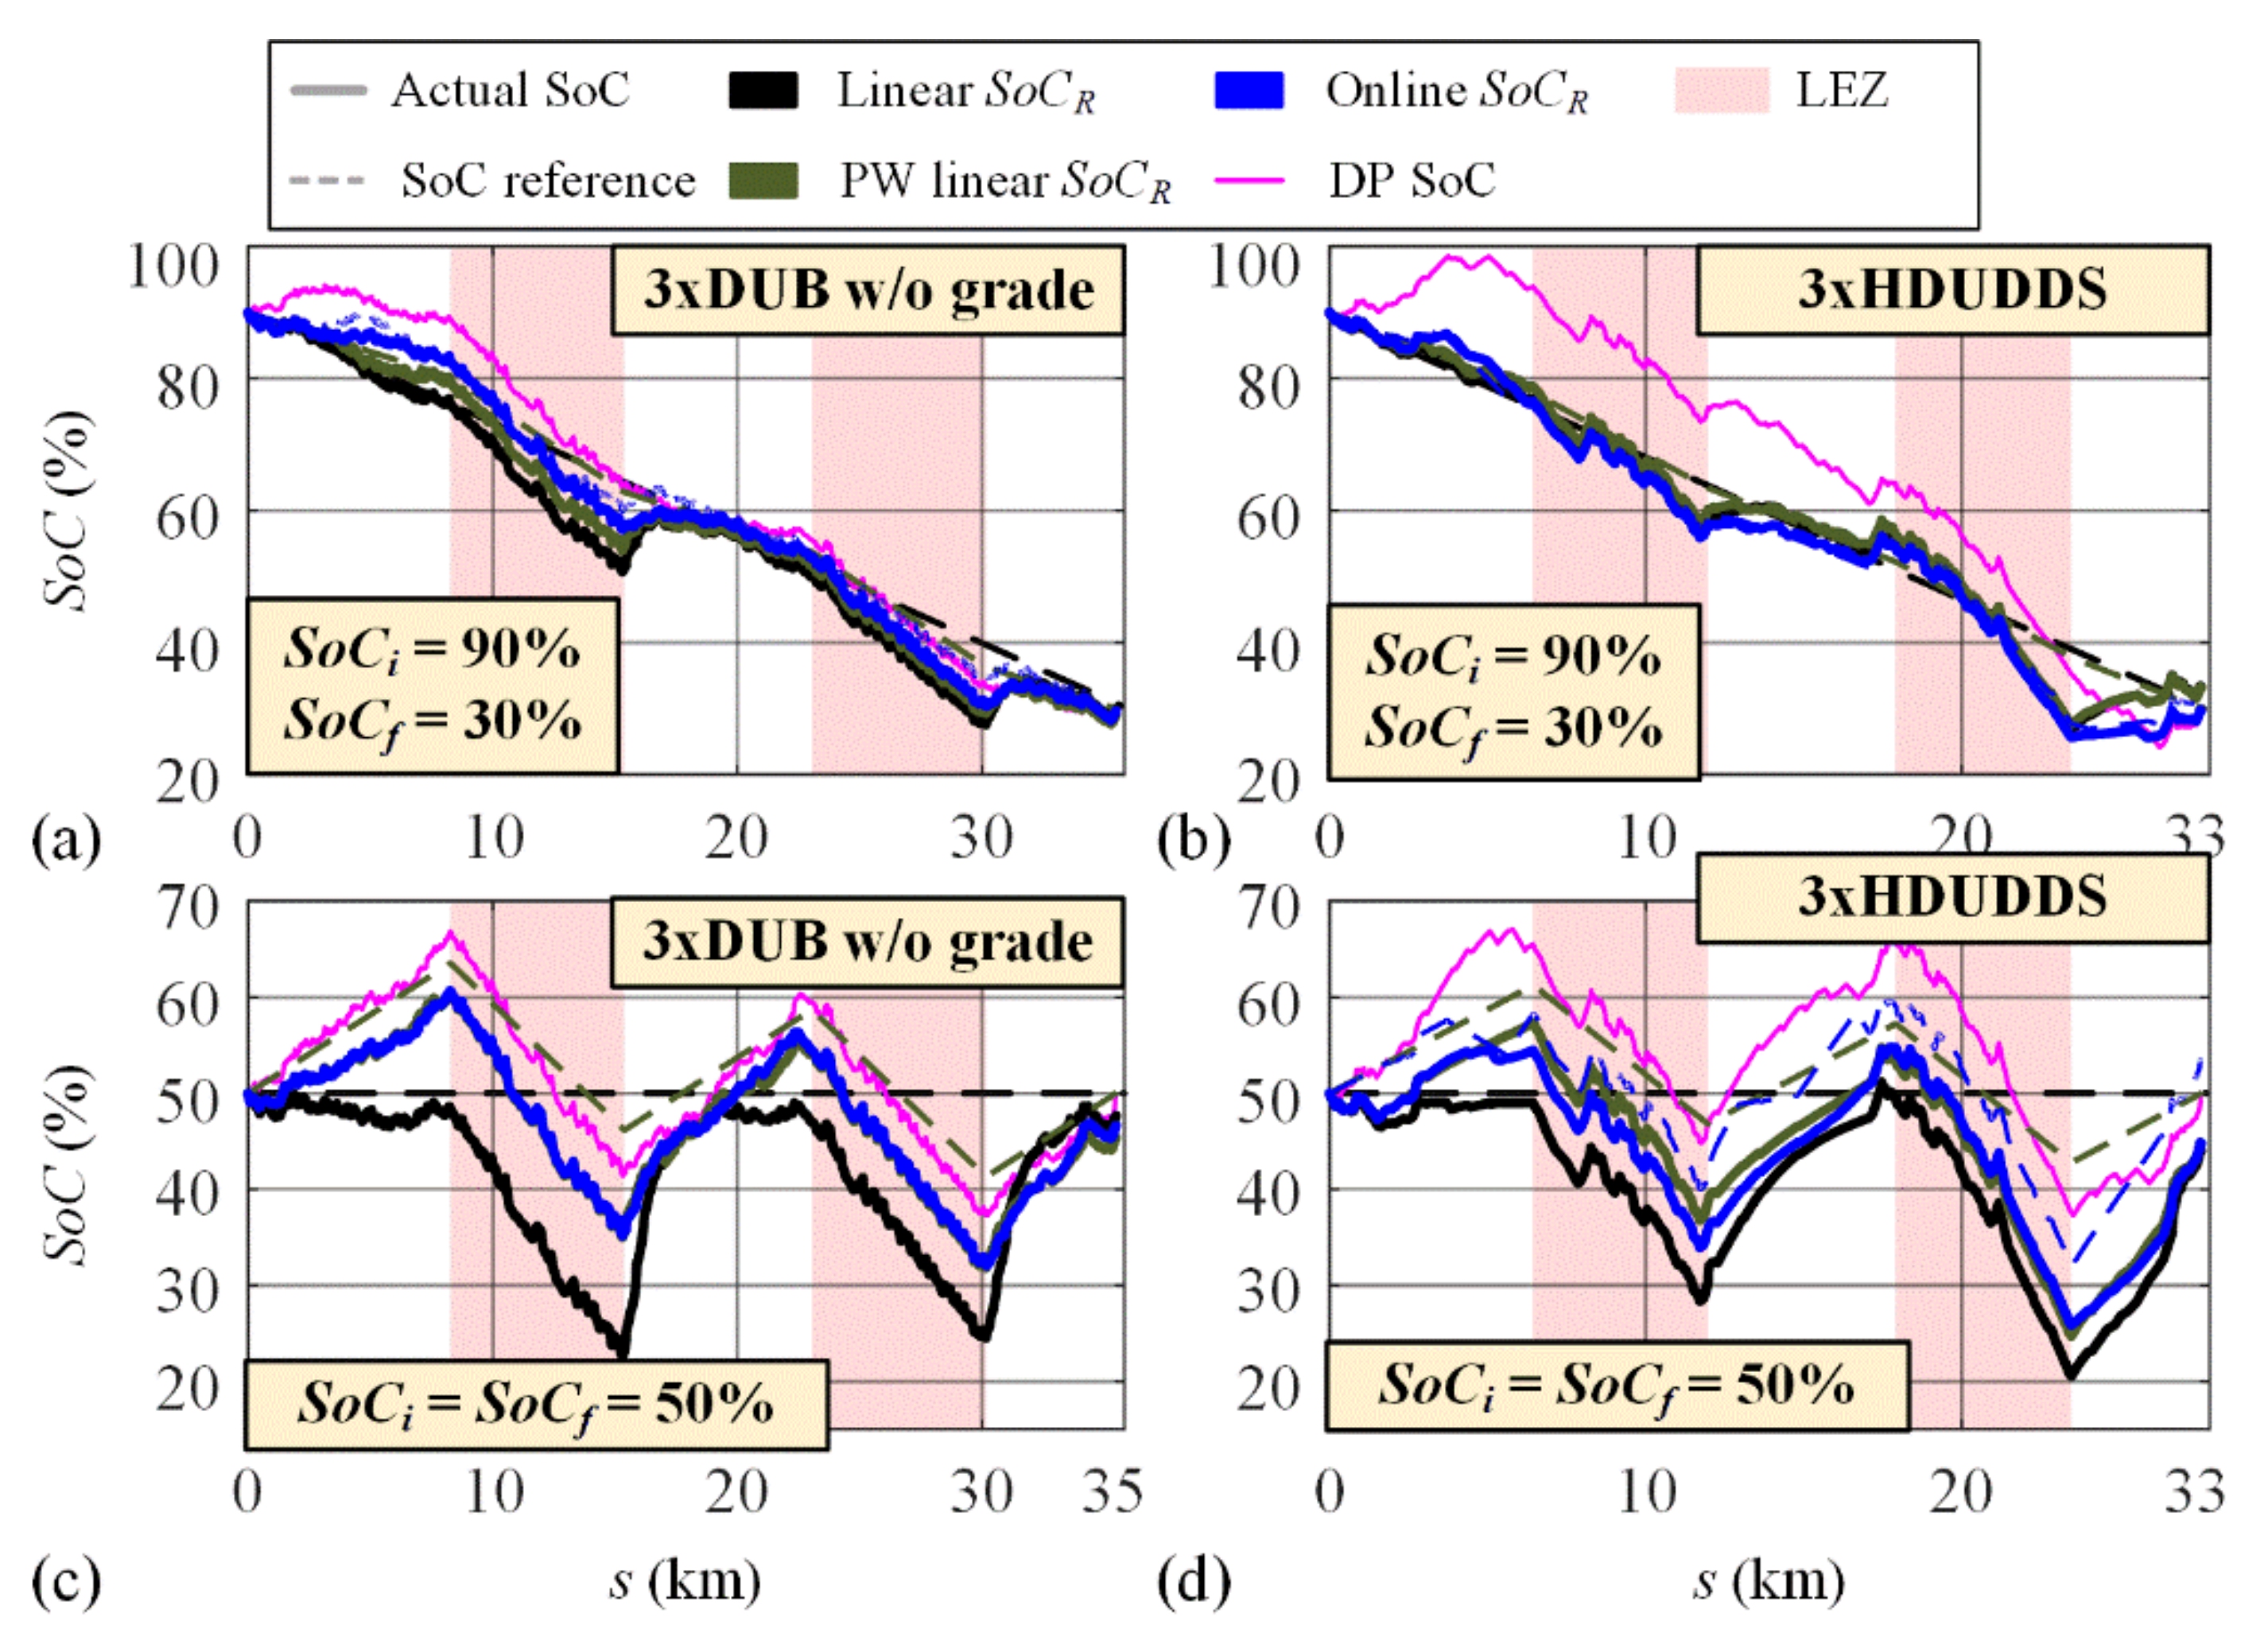
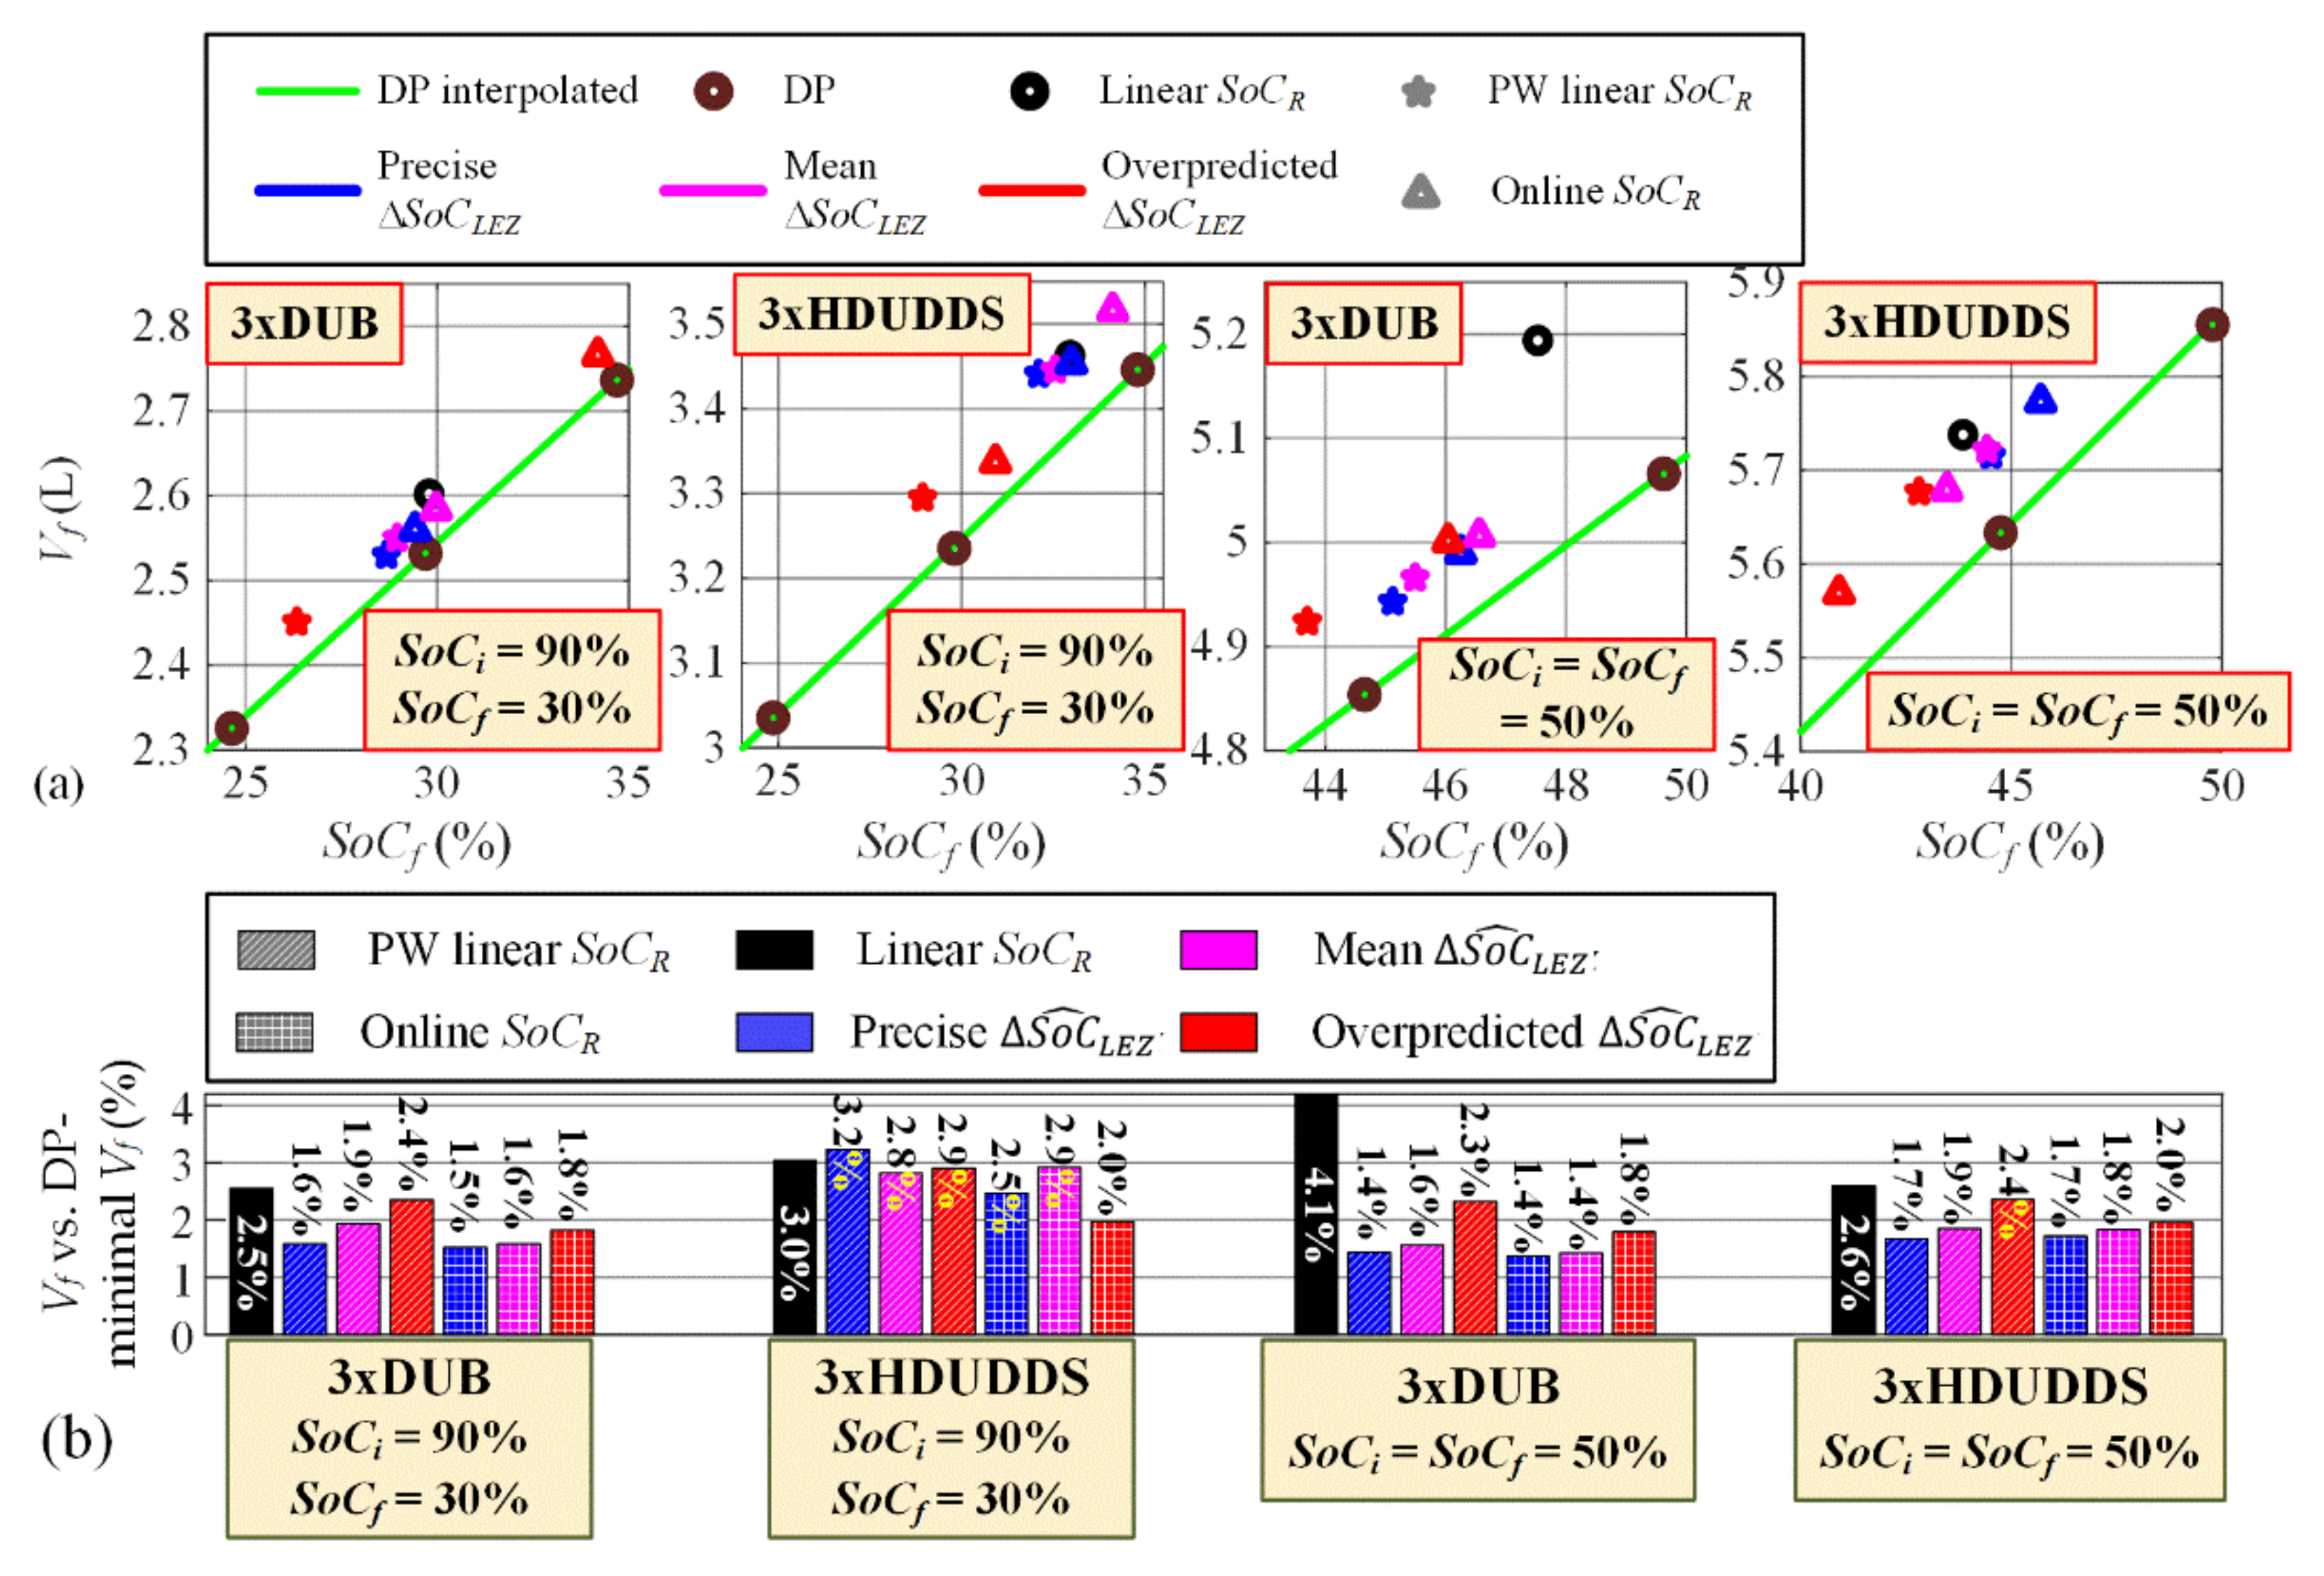
Figure 11 shows the comparative simulation results for two LEZ scenarios: (i) SoCi = 90%, SoCf = 30% and (ii) SoCi = SoCf = 50%, which resemble the BLND and the CS mode operations, respectively. The corresponding fuel economy results are shown in Figure 12. For the sake of robustness analysis, the following three scenarios are considered depending on the way they predict the cumulative SoC change within LEZs ( Δ S o C ^ L E Z ): (i) precise prediction based on simulation, (ii) mean-like prediction based on Equation (30) (default option for which the results in Figure 11 are given), and (iii) overprediction, where Δ S o C ^ L E Z is doubled with respect to precise Δ S o C ^ L E Z from Point (i).
The use of offline synthesized (piecewise linear) and online determined SoC references result in SoC trajectories that are close to DP optimal trajectories, particularly in the case SoCi = SoCf (Figure 11). Consequently, the fuel consumption is consistently lower in these cases when compared to the use of linear SoCR (Figure 12). According to the results shown in Figure 12, the online synthesis provides a higher degree of robustness with respect to accuracy of prediction Δ S o C ^ L E Z when compared to the offline synthesis approach. In most cases, the control strategy with online synthesized SoCR approaches the DP benchmark within the margin of 2%, even if an inaccurate prediction Δ S o C ^ L E Z   is used.

5.3. Robustness Analysis

Since both offline and online SoC reference synthesis methods directly or indirectly rely on driving cycle predictive information, a robustness analysis was conducted with respect to the inaccuracies of driving cycle parameters. The repetitive DUB cycle with different road grade profiles was considered for this purpose. The boundary conditions were set to SoCi = 90% and SoCf = 30%.
Table 1 shows the robustness analysis results for different combinations of actual and assumed road grade profiles. The online method is characterized by a low sensitivity to wrongly assumed road grade profiles, i.e., the relative difference between simulated and DP optimal fuel consumption remains approximately the same for various grade profile combinations. On the other hand, the sensitivity of the offline method is considerable. Moreover, the online approach kept the actual SoCf closer to its target value SoCf = 30% when compared with the offline method.
The results of the robustness analysis with respect to the inaccuracies in the mean velocity v ¯ v and the mean power demand P ¯ d are given in Table 2. Two scenarios were tested: (i) the assumed values of v ¯ v and P ¯ d were 50% higher than the actual ones, and (ii) the assumed values of v ¯ v and P ¯ d were taken from a different driving cycle than the actual one. The results show that both the offline and online methods of SoC reference synthesis have a comparable performance in terms of fuel consumption when compared to the nominal cases.

6. Discussion

Practical and near-optimal, offline and online SoC reference synthesis methods have been proposed for the PHEV blended operating mode and a wide range of driving scenarios including those concerning LEZ and varying road grade cases. The offline method results in an explicit, ready-to-use SoC reference, which can be employed in combination with various PHEV control strategies. The online method calculates the SoC reference rate in each time step based on the actual and past powertrain data collected. The proposed methods show consistent improvements in terms of fuel consumption when compared to the commonly used CD/CS mode and BLND mode based on linear SoC references.
The offline method relies on a-priori knowledge or a reasonable approximation of the total trip distance sf, the road grade profile δr(s), the mean velocity v ¯ v , and the mean power demand P ¯ d , rather than a prediction of the full driving cycle. This is particularly suitable for city buses and also for delivery vehicle applications, where the trip distance and the road grade profile could be extracted from the vehicle GPS/GPRS tracking system. This would require interfacing the tracking system with the vehicles control strategy (e.g., through vehicle CAN bus) and storing the road grade profile in the tracking electronic unit memory (permanently or sporadically through communication with fleet management system). The mean velocity v ¯ v can be readily obtained from historical or online traffic monitoring data, while the mean power demand P ¯ d could be predicted based on historical driving data. This would require an extension of vehicle tracking unit software towards a particular (PHEV) type of vehicle. An alternative implementation would be based on vehicle control software and the navigation system. The former calculates the SoC reference trajectory and feeds it to the internal PHEV control strategy. The latter provides the trip distance and road grade profile, while the mean velocity and power demand predictions would be retrieved from memorized historical data or through vehicle-to-infrastructure communication.
The online method mostly relies on the available actual data including vehicle velocity vv, driver-demanded power Pd, and battery SoC. The information regarding the total trip distance is also required, which means that a basic interface with the vehicle navigation system should be established. Unlike the offline approach, the online method does not directly use other, more demanding driving cycle prediction information. Because of this and also due to the adaptive feature based on usage of past driving cycle data, the online method consistently outperforms the offline method and shows a better robustness with respect to prediction errors. Since the enhancement is rather modest and the online method requires specific feedback parameter tuning for good accuracy and stability, both methods are deemed to be credible for application.
For the particular P2-parallel PHEV powertrain configuration of a 12 m city bus, the fuel economy reduction gained by the application of the proposed SoC reference trajectory synthesis methods when compared to the CD/CS mode and linear SoCR trajectory cases is up to 3%. It is anticipated that the fuel economy improvement would be higher in more complex PHEV or EREV powertrains, characterized by a higher number of control degrees of freedom, such as series-parallel powertrains (see e.g., [2]). Verifying this hypothesis could be a subject of future work, together with efforts to extend the online synthesis methods with more advanced online driving cycle feature prediction algorithms. Future work should include the implementation and testing of the proposed algorithms on more detailed forward-looking powertrain dynamics model and ultimately on real vehicles.

7. Conclusions

Offline and online methods of the synthesis of optimal battery state-of-charge (SoC) reference trajectories in blended operating modes have been proposed and illustrated using an example of a parallel plug-in hybrid vehicle (PHEV) given in a P2 powertrain configuration. The offline method is executed prior to the trip, and it relies on a certain, and mostly aggregate predictive knowledge of the driving cycle features. The online method updates the SoC reference in real time and adapts it with respect to past knowledge of the driving cycle. Both methods are designed for general cases of driving cycles (e.g., the presence of low-emission zones and varying road grades). The SoC reference synthesis methods have been tested based on a backward-looking PHEV powertrain model and verified against optimal solutions obtained by the dynamic programming (DP) algorithm in terms of the total fuel consumption.
The simulation results point out that when employing the proposed offline and online control methods, the fuel consumption is consistently reduced in comparison with the application of a linear SoC reference. In the case of zero road grade and no low-emission zones (LEZ), the fuel economy performance for the online method approaches the DP benchmark with a margin of around 2 to 2.5%, while in the case of the more common CD/CS mode or the linear reference trajectory, this DP-benchmark related margin equals 3.5–5% and 2.7–3.5%, respectively. The improvement is emphasized more in the presence of road grade variations (particularly low-mid frequency ones) and in the strong presence of LEZ. In the former case, the DP benchmark approaching margin is below or around 2%, while it grows up to 4–5% for the linear reference trajectory and the CD/CS mode. In the latter case, the DP approaching margin is mostly below 2%, even where prediction errors are concerned, while for the linear SoC trajectory it amounts up to 4%.

Author Contributions

Conceptualization, J.D. and B.Š.; methodology, J.S., B.Š. and J.D.; software, J.S.; validation, J.S. and B.Š.; writing—original draft preparation, B.Š. and J.S.; writing—review & editing, J.D.; supervision: J.D. All authors have read and agreed to the published version of the manuscript.

Funding

It is gratefully acknowledged that this work has been supported by the Croatian Science Foundation under the project No. IP-2018-01-8323 (Project Acronym: ACHIEVE; web site: http://achieve.fsb.hr/, accessed on 26 May 2021).

Conflicts of Interest

The authors declare no conflict of interest.

List of Abbreviations

BLND Blended (mode)
CDCharge depleting (mode)
CS Charge sustaining (mode)
DP Dynamic programming
ECMS Equivalent consumption minimization strategy
EREVExtended range electric vehicle
FF Feedforward (control)
GSD Gear shift delay (algorithm)
HF High frequency (grade)
LEZ Low emission zone
LFLow frequency (grade)
M/G Motor/generator (machine)
MFMedium frequency (grade)
MPC Model predictive control
PHEV Plug-in hybrid electric vehicle
PMP Pontryagin’s minimum principle
RBRule-based (controller)
SoC(Battery) State-of-charge

Appendix A. PHEV Model Parameters

The PHEV model parameters are given in what follows, with the gear ratios listed in Table A1: Final drive ratio io = 4.72, effective tire radius rw = 0.481 m, rolling resistance factor R0 = 0.012, vehicle mass Mv = 12,635 kg, air density ρair = 1.225 g/m3, frontal vehicle surface Af = 7.52 m2, vehicle aerodynamical drag factor Cd = 0.7, battery charge capacity Qmax = 30 Ah.
Table A1. Transmission gear ratios.
Gear1.2.3.4.5.6.
Gear ratio (-)14.9411.739.047.095.544.35
Gear7.8.9.10.11.12.
Gear ratio (-)3.442.702.081.631.271.00

Appendix B. Control Parameters

The control parameters are set as follows: Engine power on threshold Pon = 85 kW, engine power off threshold Poff = 75 kW, mean engine specific fuel consumption for equivalent fuel consumption calculation during battery discharging A ¯ e k = 186 g/kWh, mean transmission efficiency η ¯ t r = 0.9, lower and upper margin coefficients used in SoC prediction constraint (34): kl = 0.85 and ku = 1.15, gain used in proportional corrective action (36): kref = 5.

Appendix C

The cumulative SoC reference changes in regenerative braking and electric-only driving conditions, calculated up to the kth discrete time instant of the trip and used in Equations (26) and (27) are determined from the following recursive equations:
Δ S o C r e g , k = Δ S o C r e g , k 1                                         + Δ S o C R , k Δ s k v v , k T d ,   for   P d , k 0   and   K L E Z s k = 0 0 ,                                 else                                                                     ,  
Δ S o C e l , k = Δ S o C e l , k 1                                         + Δ S o C R , k Δ s k v v , k T d ,   for   0 < P d , k P d , t h   and   K L E Z s k = 0 0 ,                                         else                                                 ,
where Δ S o C r e g , 0 = Δ S o C e l , 0 = 0 .
The corresponding total distances travelled, used in Equation (28), are defined as
Δ s r e g , k = Δ s r e g , k 1 + v v , k T d ,   for   P d , k 0   and   K L E Z s k = 0 0 ,   else    
Δ s e l , k = Δ s e l , k 1 + v v , k T d , 0 < P d , k P d , t h   and   K L E Z s k = 0 0 ,             else                               ,
where Δ s r e g , 0 = Δ s e l , 0 = 0 .

References

  1. Guzzella, L.; Sciaretta, A. Vehicle Propulsion Systems, 2nd ed.; Springer: Berlin, Germany, 2007. [Google Scholar]
  2. Škugor, B.; Cipek, M.; Deur, J. Control variables optimization and feedback control strategy design for the blended operating regime of an extended range electric vehicle. SAE Int. J. Altern. Powertrains 2014, 3, 152–162. [Google Scholar] [CrossRef]
  3. Martinez, C.M.; Hu, X.; Cao, D.; Velenis, E.; Gao, B.; Wellers, M. Energy Management in Plug-in Hybrid Electric Vehicles: Recent Progress and a Connected Vehicles Perspective. IEEE Trans. Veh. Technol. 2017, 66, 4534–4549. [Google Scholar] [CrossRef] [Green Version]
  4. Huang, Y.; Wang, H.; Khajepour, A.; He, H.; Ji, J. Model predictive control power management strategies for HEVs: A review. J. Power Sources 2017, 341, 91–106. [Google Scholar] [CrossRef]
  5. Onori, S.; Tribioli, L. Adaptive Pontryagin’s Minimum Principle supervisory controller design for the plug-in hybrid GM Chevrolet Volt. Appl. Energy 2015, 147, 224–234. [Google Scholar] [CrossRef]
  6. Xie, S.; Li, H.; Xin, Z.; Liu, T.; Wei, L. A pontryagin minimum principle-based adaptive equivalent consumption minimum strategy for a plug-in hybrid electric bus on a fixed route. Energies 2017, 10, 1379. [Google Scholar] [CrossRef]
  7. Xie, S.; Hu, X.; Xin, Z.; Brighton, J. Pontryagin’s Minimum Principle based model predictive control of energy management for a plug-in hybrid electric bus. Appl. Energy 2019, 236, 893–905. [Google Scholar] [CrossRef] [Green Version]
  8. Soldo, J.; Skugor, B.; Deur, J. Optimal Energy Management Control of a Parallel Plug-In Hybrid Electric Vehicle in the Presence of Low-Emission Zones. SAE Tech. Pap. 1215, 2019-01-1215. [Google Scholar] [CrossRef]
  9. Soldo, J.; Škugor, B.; Deur, J. Synthesis of Optimal Battery State-of-Charge Trajectory for Blended Regime of Plug-in Hybrid Electric Vehicles in the Presence of Low-Emission Zones and Varying Road Grades. Energies 2019, 12, 4296. [Google Scholar] [CrossRef] [Green Version]
  10. Yu, H.; Kuang, M.; McGee, R. Trip-oriented energy management control strategy for plug-in hybrid electric vehicles. IEEE Trans. Control Syst. Technol. 2014, 22, 1323–1336. [Google Scholar]
  11. Schmid, R.; Buerger, J.; Bajcinca, N. Energy Management Strategy for Plug-in-Hybrid Electric Vehicles Based on Predictive PMP. IEEE Trans. Control Syst. Technol. 2021, 1–13. [Google Scholar] [CrossRef]
  12. Liu, Y.; Li, J.; Qin, D.; Lei, Z. Energy management of plug-in hybrid electric vehicles using road grade preview. In Proceedings of the IET International Conference on Intelligent and Connected Vehicles (ICV 2016), Chongqing, China, 22–23 September 2016. [Google Scholar]
  13. Ambuhl, D.; Guzzella, L. Predictive reference signal generator for hybrid electric vehicles. IEEE Trans. Veh. Technol. 2009, 58, 4730–4740. [Google Scholar] [CrossRef]
  14. Gaikwad, T.; Asher, Z.; Liu, K.; Huang, M.; Kolmanovsky, I. Vehicle Velocity Prediction and Energy Management Strategy Part 2: Integration of Machine Learning Vehicle Velocity Prediction with Optimal Energy Management to Improve Fuel Economy. SAE Tech. Pap. 2019, 2019-01-1212. [Google Scholar]
  15. Taghavipour, A.; Moghadasi, S. A Real-Time Nonlinear CRPE Predictive PHEV Energy Management System Design and HIL Evaluation. IEEE Trans. Veh. Technol. 2021, 70, 49–58. [Google Scholar] [CrossRef]
  16. Sun, C.; Moura, S.J.; Hu, X.; Hedrick, J.K.; Sun, F. Dynamic Traffic Feedback Data Enabled Energy Management in Plug-in Hybrid Electric Vehicles. IEEE Trans. Control Syst. Technol. 2015, 23, 1075–1086. [Google Scholar]
  17. Bouwman, K.R.; Pham, T.H.; Wilkins, S.; Hofman, T. Predictive Energy Management Strategy Including Traffic Flow Data for Hybrid Electric Vehicles. IFAC-PapersOnLine 2017, 50, 10046–10051. [Google Scholar] [CrossRef]
  18. Soldo, J.; Škugor, B.; Deur, J. Optimal energy management and shift scheduling control of a parallel plug-in hybrid electric vehicle. Int. J. Powertrains 2020, 9, 240–264. [Google Scholar] [CrossRef]
  19. Volvo 7900 Electric Hybrid Specifications. Available online: https://www.volvobuses.co.uk/en-gb/our-offering/buses/volvo-7900-electric-hybrid/specifications.html (accessed on 17 March 2021).
  20. Paganelli, G.; Delprat, S.; Guerra, T.M.; Rimaux, J.; Santin, J.J. Equivalent consumption minimization strategy for parallel hybrid powertrains. Proc. IEEE Veh. Technol. Conf. 2002, 4, 2076–2081. [Google Scholar]
  21. Škugor, B.; Deur, J.; Cipek, M.; Pavković, D. Design of a power-split hybrid electric vehicle control system utilizing a rule-based controller and an equivalent consumption minimization strategy. Proc. Inst. Mech. Eng. Part D J. Automob. Eng. 2014, 228, 631–648. [Google Scholar] [CrossRef]
  22. Škugor, B.; Hrgetić, M.; Deur, J. GPS measurement-based road grade reconstruction with application to electric vehicle simulation and analysis. In Proceedings of the 11th Conference on Sustainable Development of Energy, Water and Environment Systems (SDEWES 2015), Dubrovnik, Croatia, 27 September–2 October 2015. [Google Scholar]
  23. Bellman, R.E.; Dreyfus, S.E. Applied Dynamic Programming; Princeton University Press: Princeton, NJ, USA, 1962. [Google Scholar]
  24. Cipek, M.; Škugor, B.; Čorić, M.; Kasać, J.; Deur, J. Control variable optimisation for an extended range electric vehicle. Int. J. Powertrains 2016, 5, 30. [Google Scholar] [CrossRef]
  25. Škugor, B.; Soldo, J.; Deur, J. Analysis of Optimal Battery State-of-Charge Trajectory for Blended Regime of Plug-in Hybrid Electric Vehicle. World Electr. Veh. J. 2019, 10, 75. [Google Scholar] [CrossRef] [Green Version]
  26. Soldo, J.; Škugor, B.; Deur, J. Analysis of Patterns of Optimal Battery State-of-Charge Trajectories for Blended Regime of a Parallel Plug-in Hybrid Electric Vehicle and a Wide Range of Driving Conditions. In Proceedings of the 15th Conference on Sustainable Development of Energy, Water and Environment Systems (SDEWES 2020), Cologne, Germany, 1–5 September 2020. [Google Scholar]
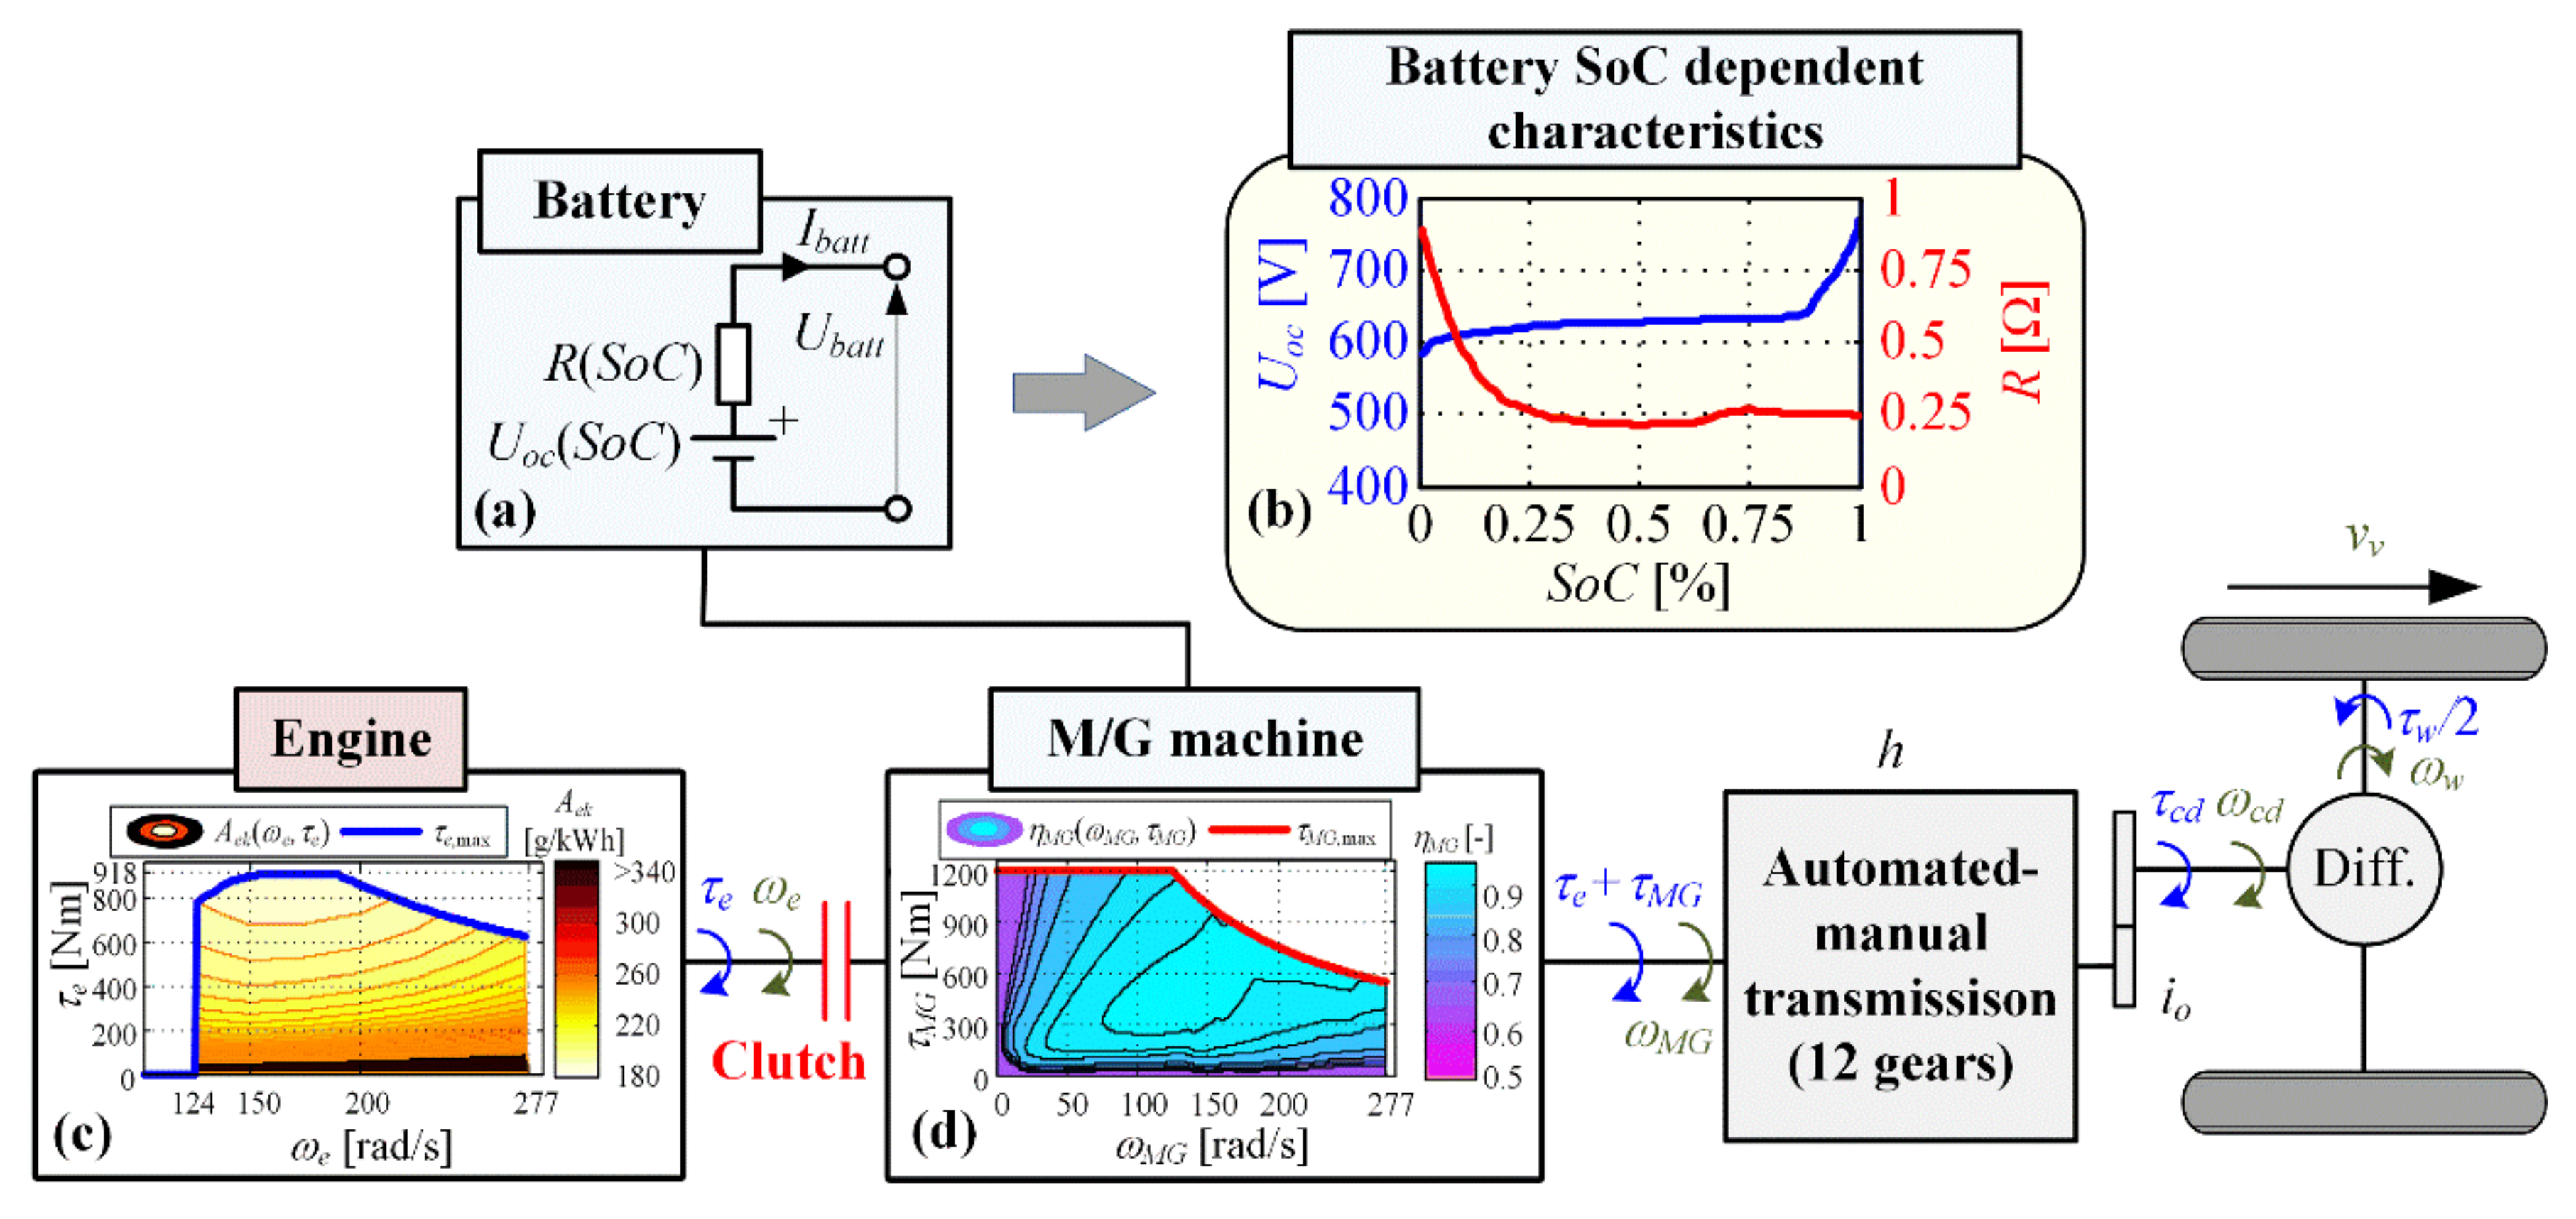
Figure 1. Functional scheme of the considered parallel PHEV powertrain, including: (a) equivalent battery circuit, (b) SoC-dependent open-circuit voltage Uoc and internal resistance R for LiFePO4 battery, (c) engine specific fuel consumption and (d) M/G machine efficiency maps, including the corresponding maximum torque lines (bold lines), adapted from [9].
Energies 14 03168 g001
Figure 2. Block diagram of a PHEV energy management control strategy based on combining an RB controller and an ECMS.
Energies 14 03168 g002
Figure 3. DUB driving cycle: (a) velocity profile and (b) road grade profile.
Energies 14 03168 g003
Figure 4. (a) Different synthetic road grade profiles for a total, repetitive DUB driving cycle travelled distance sf = 47.3 km and (b) corresponding altitude profiles; and low-emission zone (LEZ) profiles inserted into (c) 3xDUB driving cycle and (d) 3xHDUDDS driving cycle, adapted from [9].
Energies 14 03168 g004
Figure 5. (a) DP optimal SoC trajectories for 4xDUB driving cycle and different road profiles, (b) distribution of corresponding SoC rates with respect to the power demand Pd, and (c) SoC trajectories decomposed and rearranged to battery discharging and recharging sections.
Energies 14 03168 g005
Figure 6. (a) DP-optimal SoC trajectory decomposed and rearranged into electric-only driving, hybrid driving and regenerative braking segments (4xDUB cycle w/recorded road grade profile), and (b) illustration of the SoC change and the travelled distance prediction sections.
Energies 14 03168 g006
Figure 7. SoC trajectories for different control strategy variants, including DP optimal SoC trajectory, all given for: (a) 6xWHVC, (b) 6xJE05 and (c) 10xHDUDDS repetitive driving cycles (no LEZ and zero road grade scenario).
Energies 14 03168 g007
Figure 8. (a) Fuel consumptions obtained by DP optimization and different control strategies and (b) corresponding relative fuel consumption increases with respect to the DP benchmark, all given for different driving cycles with no LEZ and zero road grade.
Energies 14 03168 g008
Figure 9. SoC trajectories for different control strategy variants, including DP optimal SoC trajectory, all given for repetitive DUB driving cycles with (a) recorded and (bd) sinusoidal grade profiles of different frequency (no LEZ).
Energies 14 03168 g009
Figure 10. (a) Fuel consumptions obtained by DP optimization and different control strategies and (b) corresponding relative fuel consumption increases with respect to the DP benchmark, given for different driving cycles with varying road grades (recorded and sinusoidal) and no LEZ.
Energies 14 03168 g010
Figure 11. SoC trajectories for different control strategy variants, including DP optimal SoC trajectory, all given for: (a,b) BLND-like conditions with SoCi = 90% and SoCf = 30%, and (c,d) and CS-like conditions with SoCi = SoCf = 50% (and zero road grade scenario).
Energies 14 03168 g011
Figure 12. (a) Fuel consumptions obtained by DP optimization and different control strategies and (b) corresponding relative fuel consumption increases with respect to DP benchmark, given for different driving cycles with LEZ presence and zero road grade.
Energies 14 03168 g012
Table 1. Results of the robustness analysis with respect to inaccuracies in the road grade profile.
Assumed Road Grade Profile
Rec. GradeMF GradeHF Grade
Vf (L)Vf,comp1 (%)SoCf (%)Vf (L)Vf,comp1 (%)SoCf (%)Vf (L)Vf,comp1 (%)SoCf (%)
Driving cycle and actual/applied road grade profile6 × DUB w/Rec. gradeOffline8.23+2.1135.488.23+4.2330.888.12+2.4231.79
Online8.29+1.9437.477.80+2.3123.368.20+2.0534.90
4 × DUB w/MF gradeOffline4.35+4.8946.233.64+1.8430.914.32+4.7045.67
Online3.75+1.8433.863.63+1.5130.873.70+1.6232.61
4 × DUB w/HF gradeOffline3.97+3.3639.353.60+4.8428.673.62+2.2931.45
Online3.67+2.4333.323.24+2.6221.693.63+2.1731.83
1 relative fuel consumption increases with respect to DP benchmark.
Table 2. Results of the robustness analysis with respect to inaccuracies in the mean velocity ( v ¯ v ) and the mean power demand ( P ¯ d ) parameters.
Assumed Driving Cycle Characteristics
Actual Actual Ones Increased by 50%Characteristics of Characteristics of WHVC Driving Cycle Used
P ¯ d = 11.14   kW ,   v ¯ v = 30.40   m / s
Vf (L)Vf,comp 1 (%)SoCf (%)Vf (L)Vf,comp 1 (%)SoCf (%)Vf (L)Vf,comp 1 (%)SoCf (%)
Driving cycle and actual driving cycle characteristics6 × DUB w/Rec. grade
P ¯ d = 10.94   kW v ¯ v = 6.21   m / s
Offline8.23+2.1135.488.22+2.1335.508.23+1.9935.86
Online8.29+1.9437.478.24+1.9336.198.56+2.1044.60
4 × DUB w/MF grade
P ¯ d = 10.38   kW v ¯ v = 6.13   m / s
Offline3.64+1.8430.913.64+1.8430.913.78+2.2034.40
Online3.63+1.5130.873.62+1.4930.763.72+1.6033.31
4 × DUB w/HF grade
P ¯ d = 6.14   kW v ¯ v = 10.33   m / s
Offline3.62+2.2931.453.62+2.3031.423.68+2.3332.96
Online3.63+2.1731.833.63+2.1631.783.76+2.1335.31
1 relative fuel consumption increases with respect to DP benchmark.
Publisher’s Note: MDPI stays neutral with regard to jurisdictional claims in published maps and institutional affiliations.