
The Efficiency of the Biogas Plant Operation Depending on the Substrate Used


Abstract
1. Introduction
2. Materials and Methods
Theoretical Background
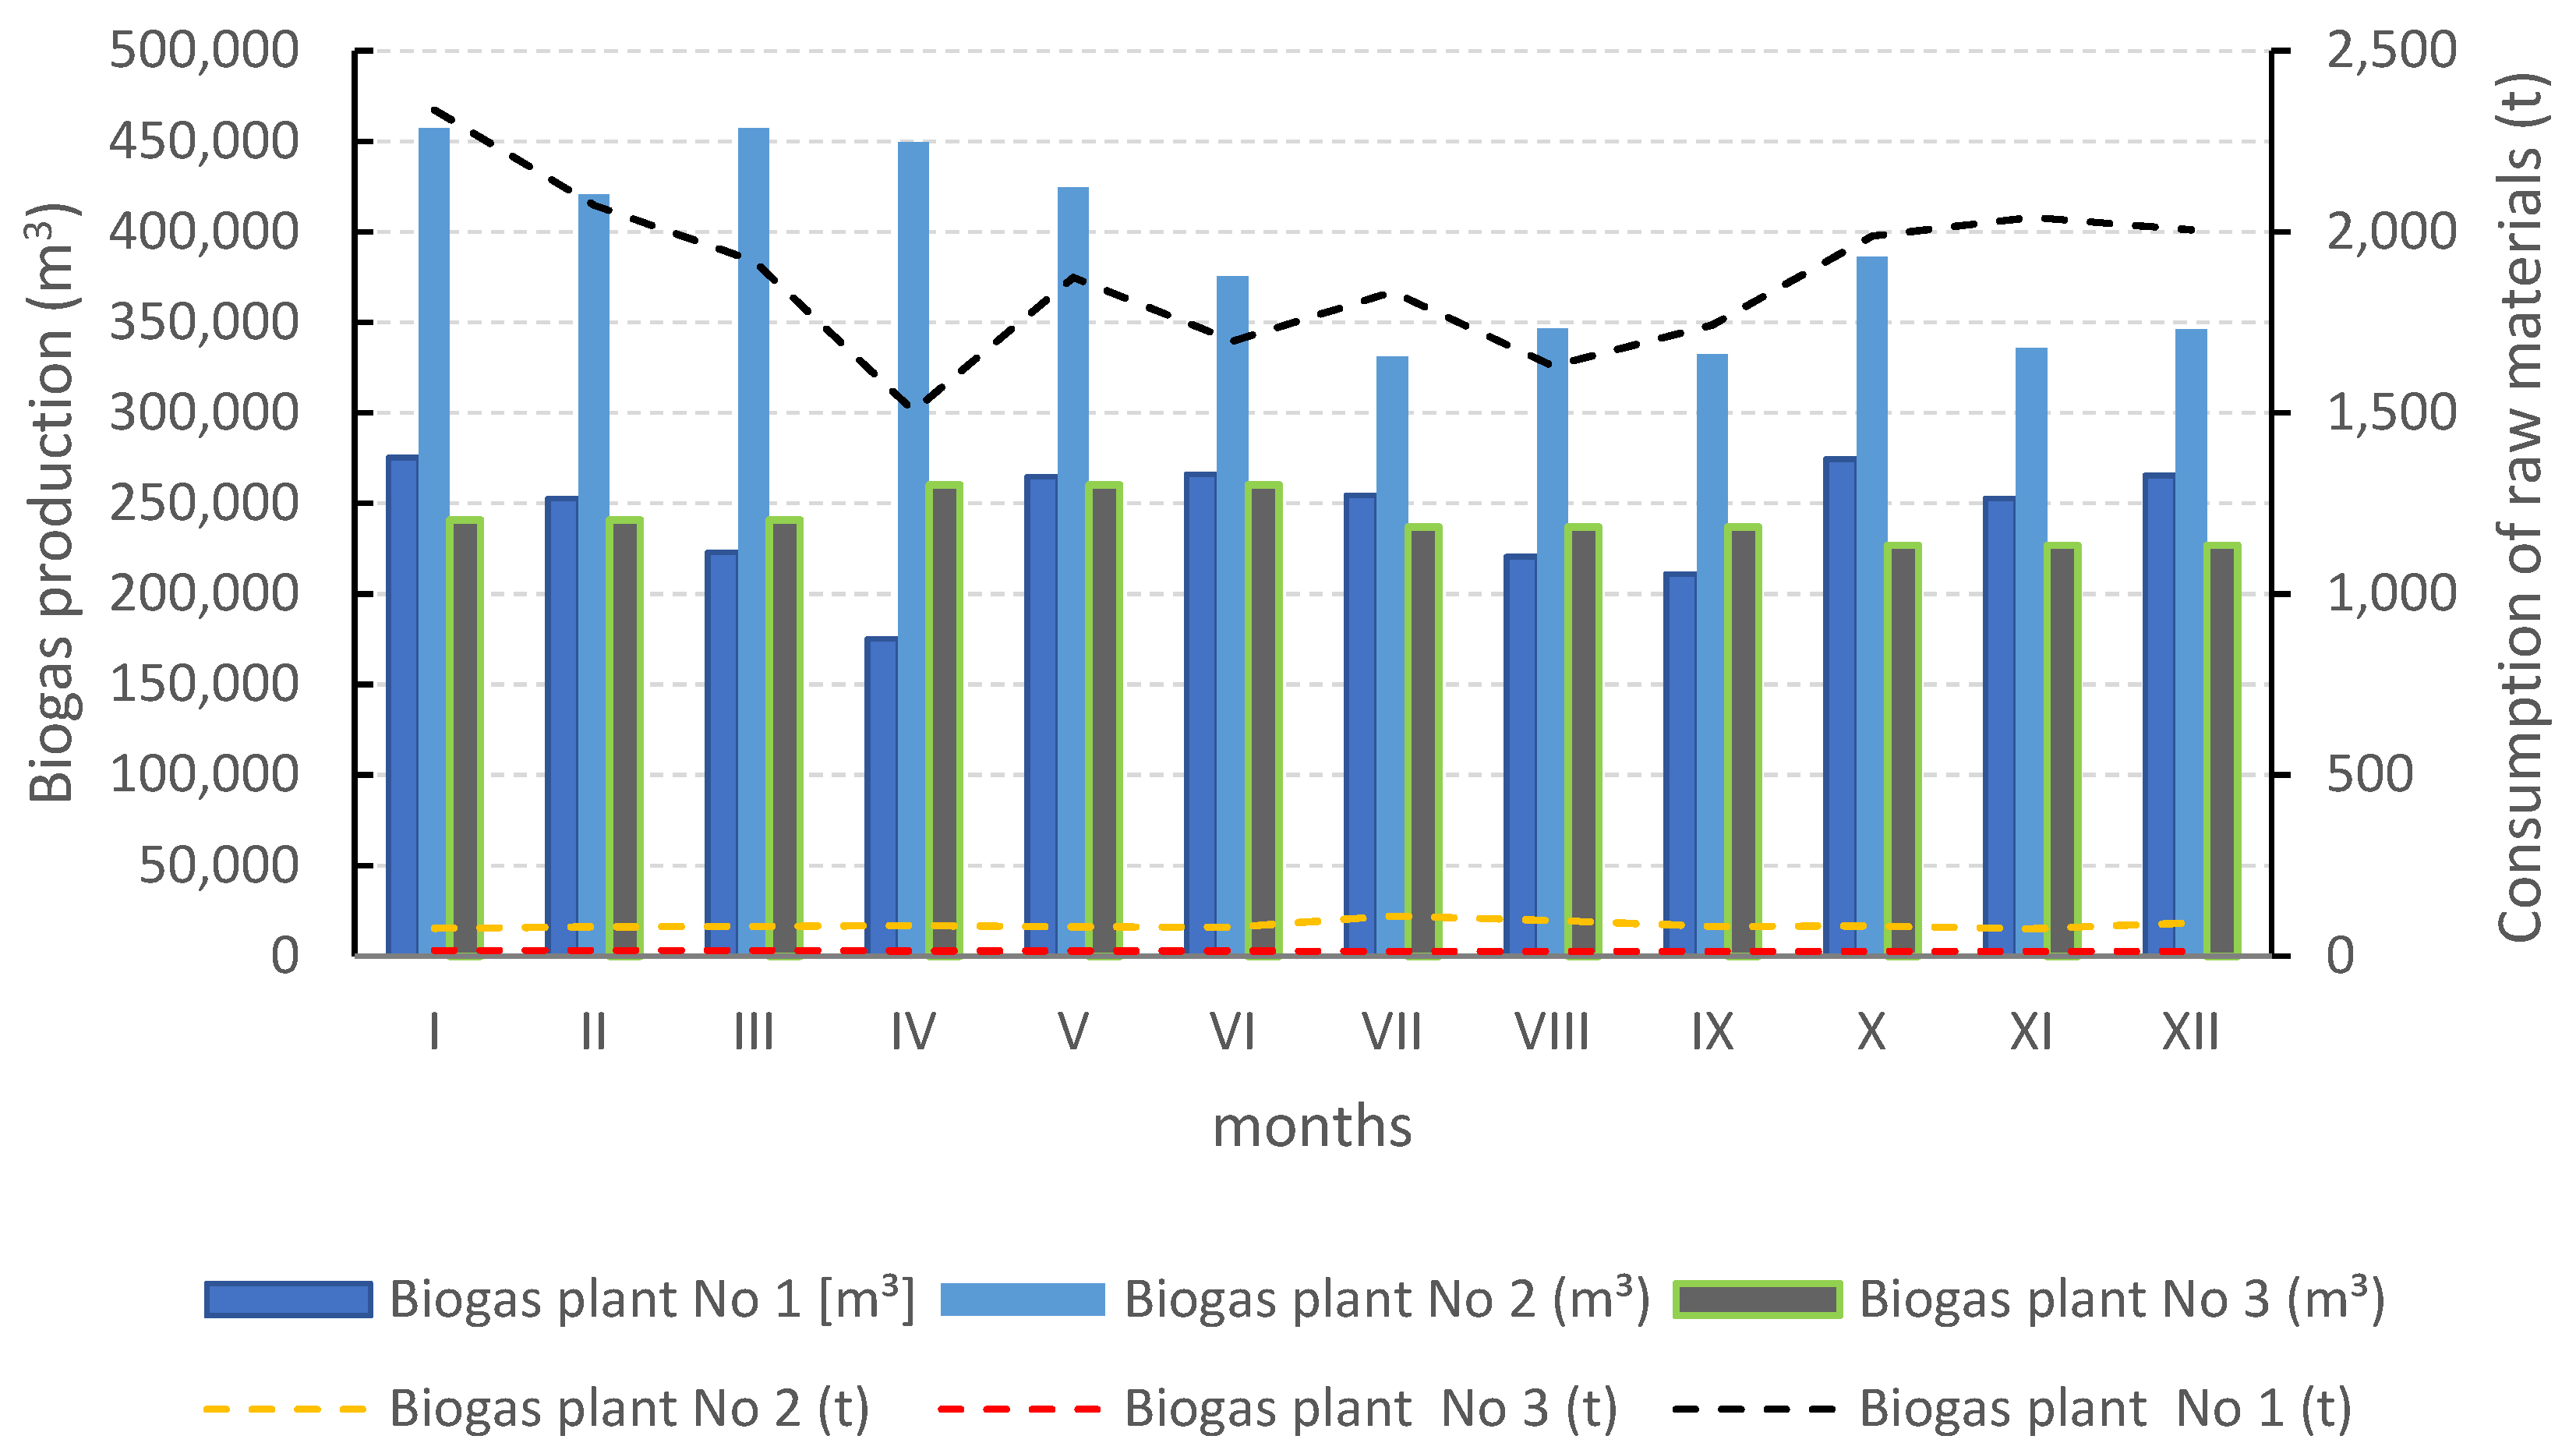
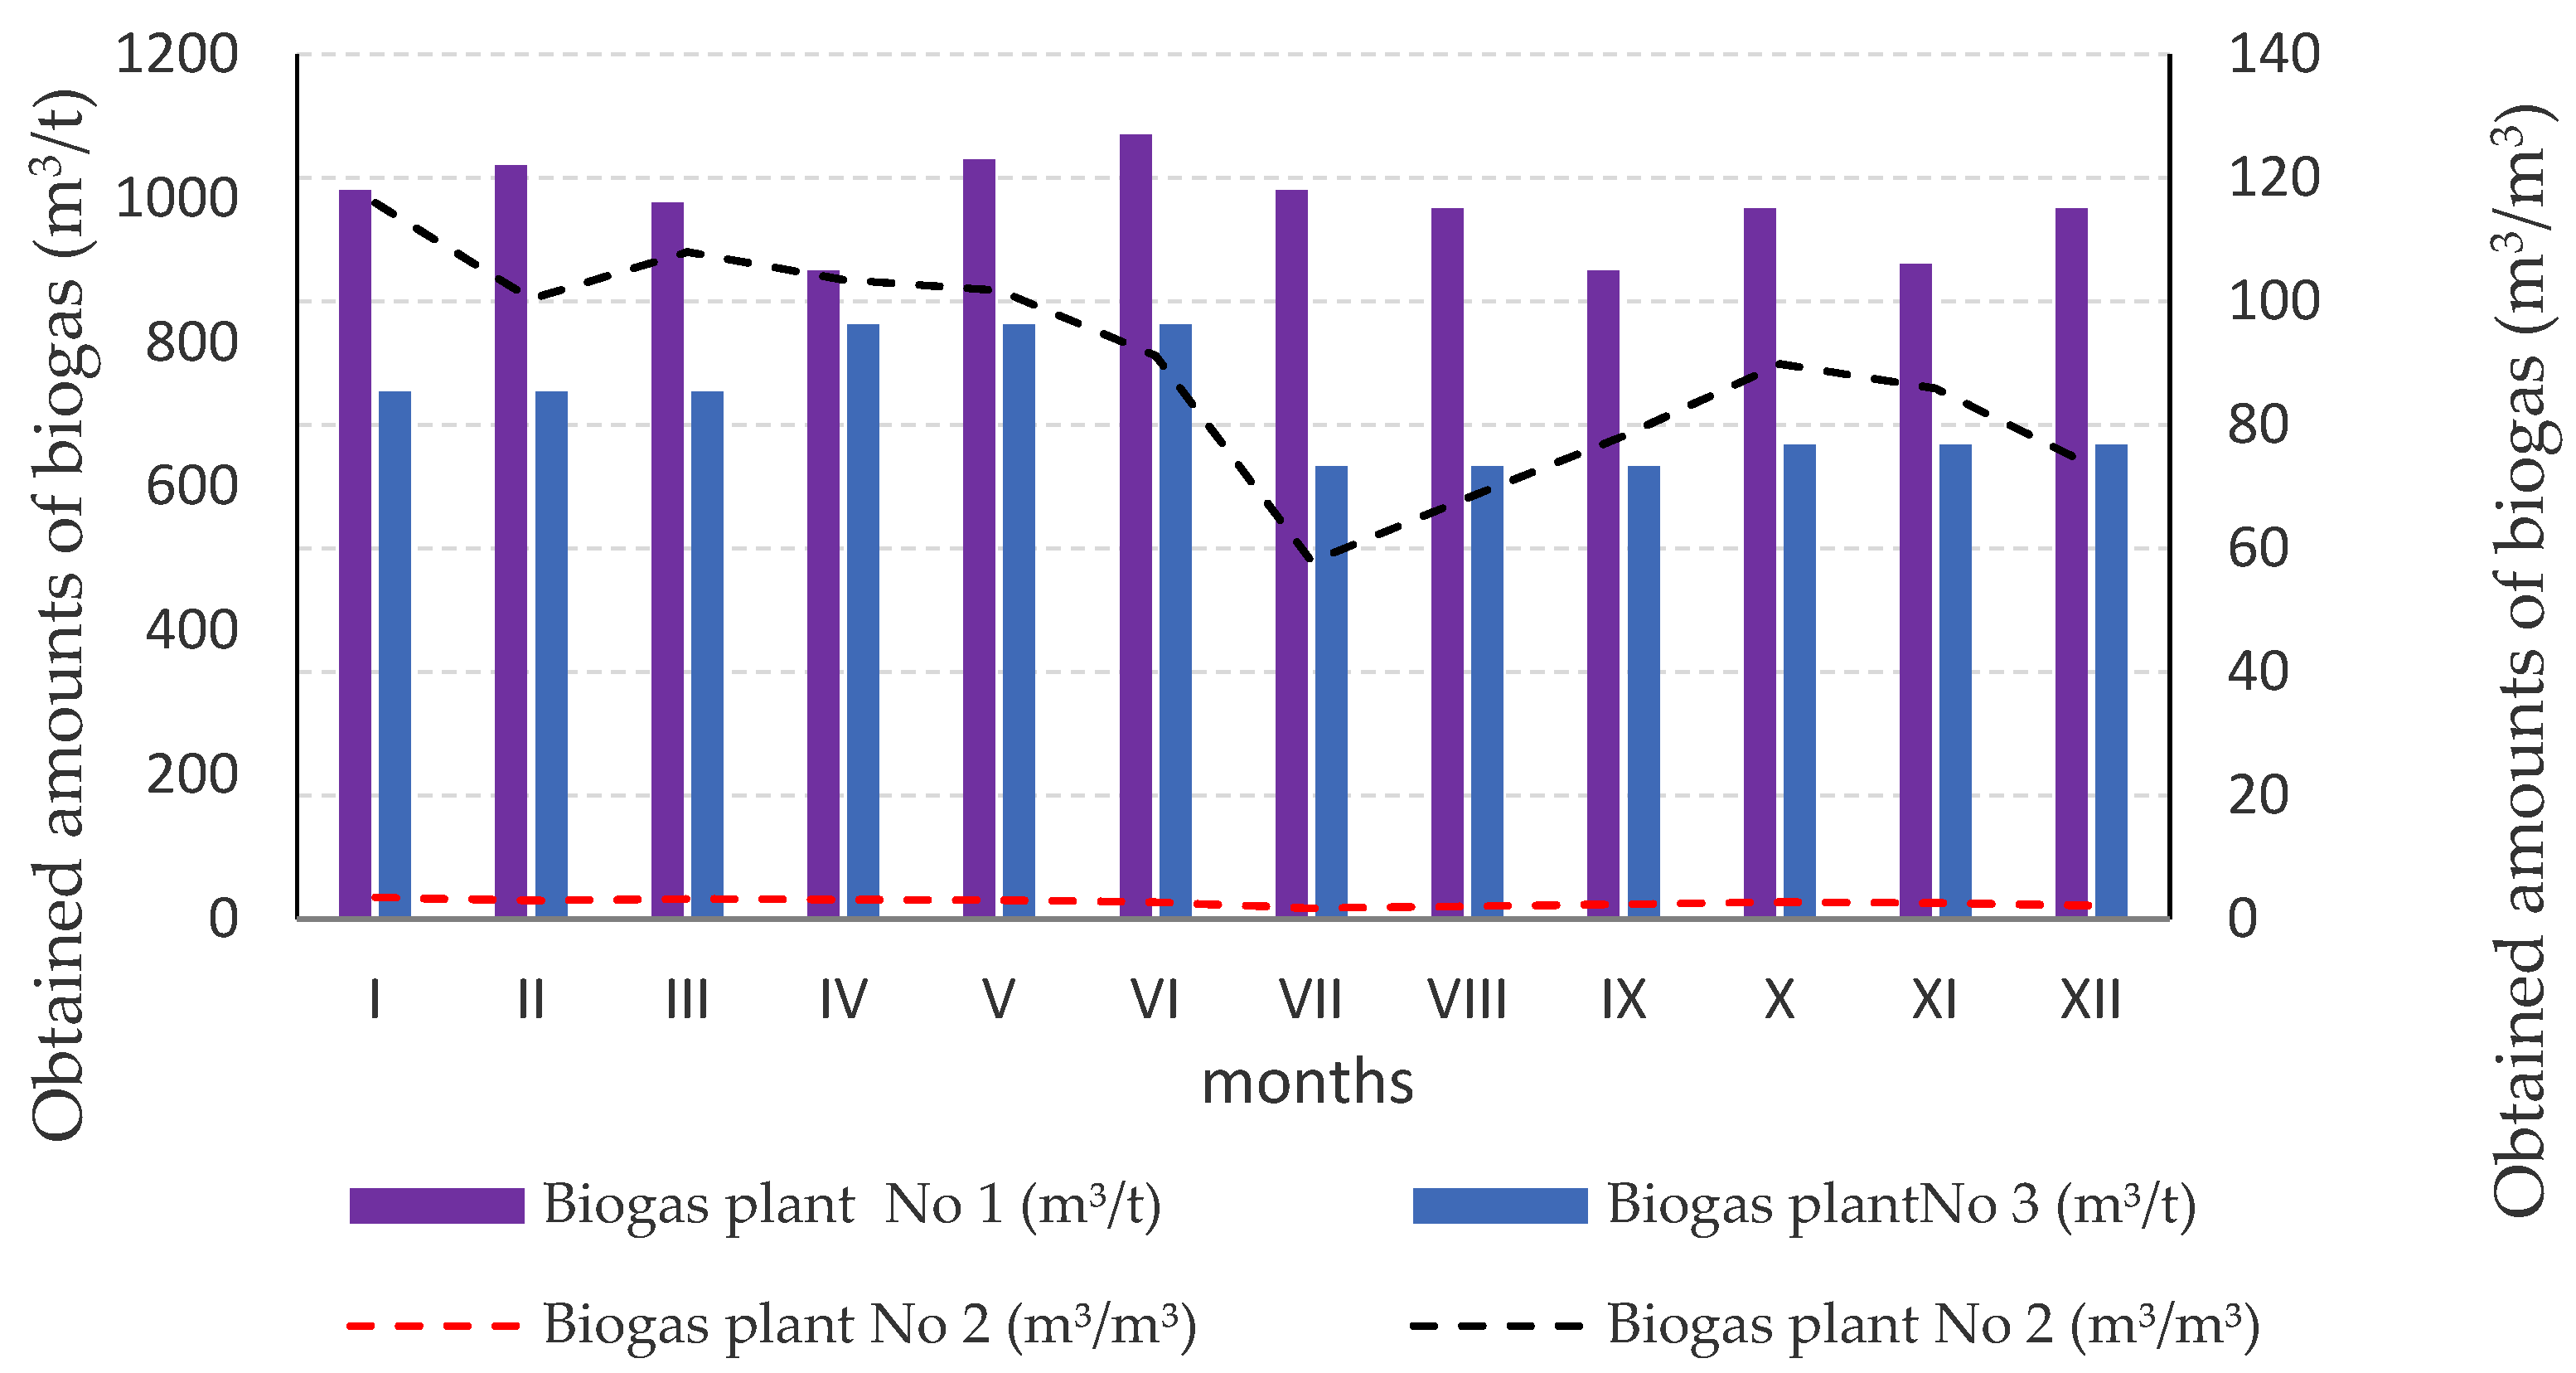
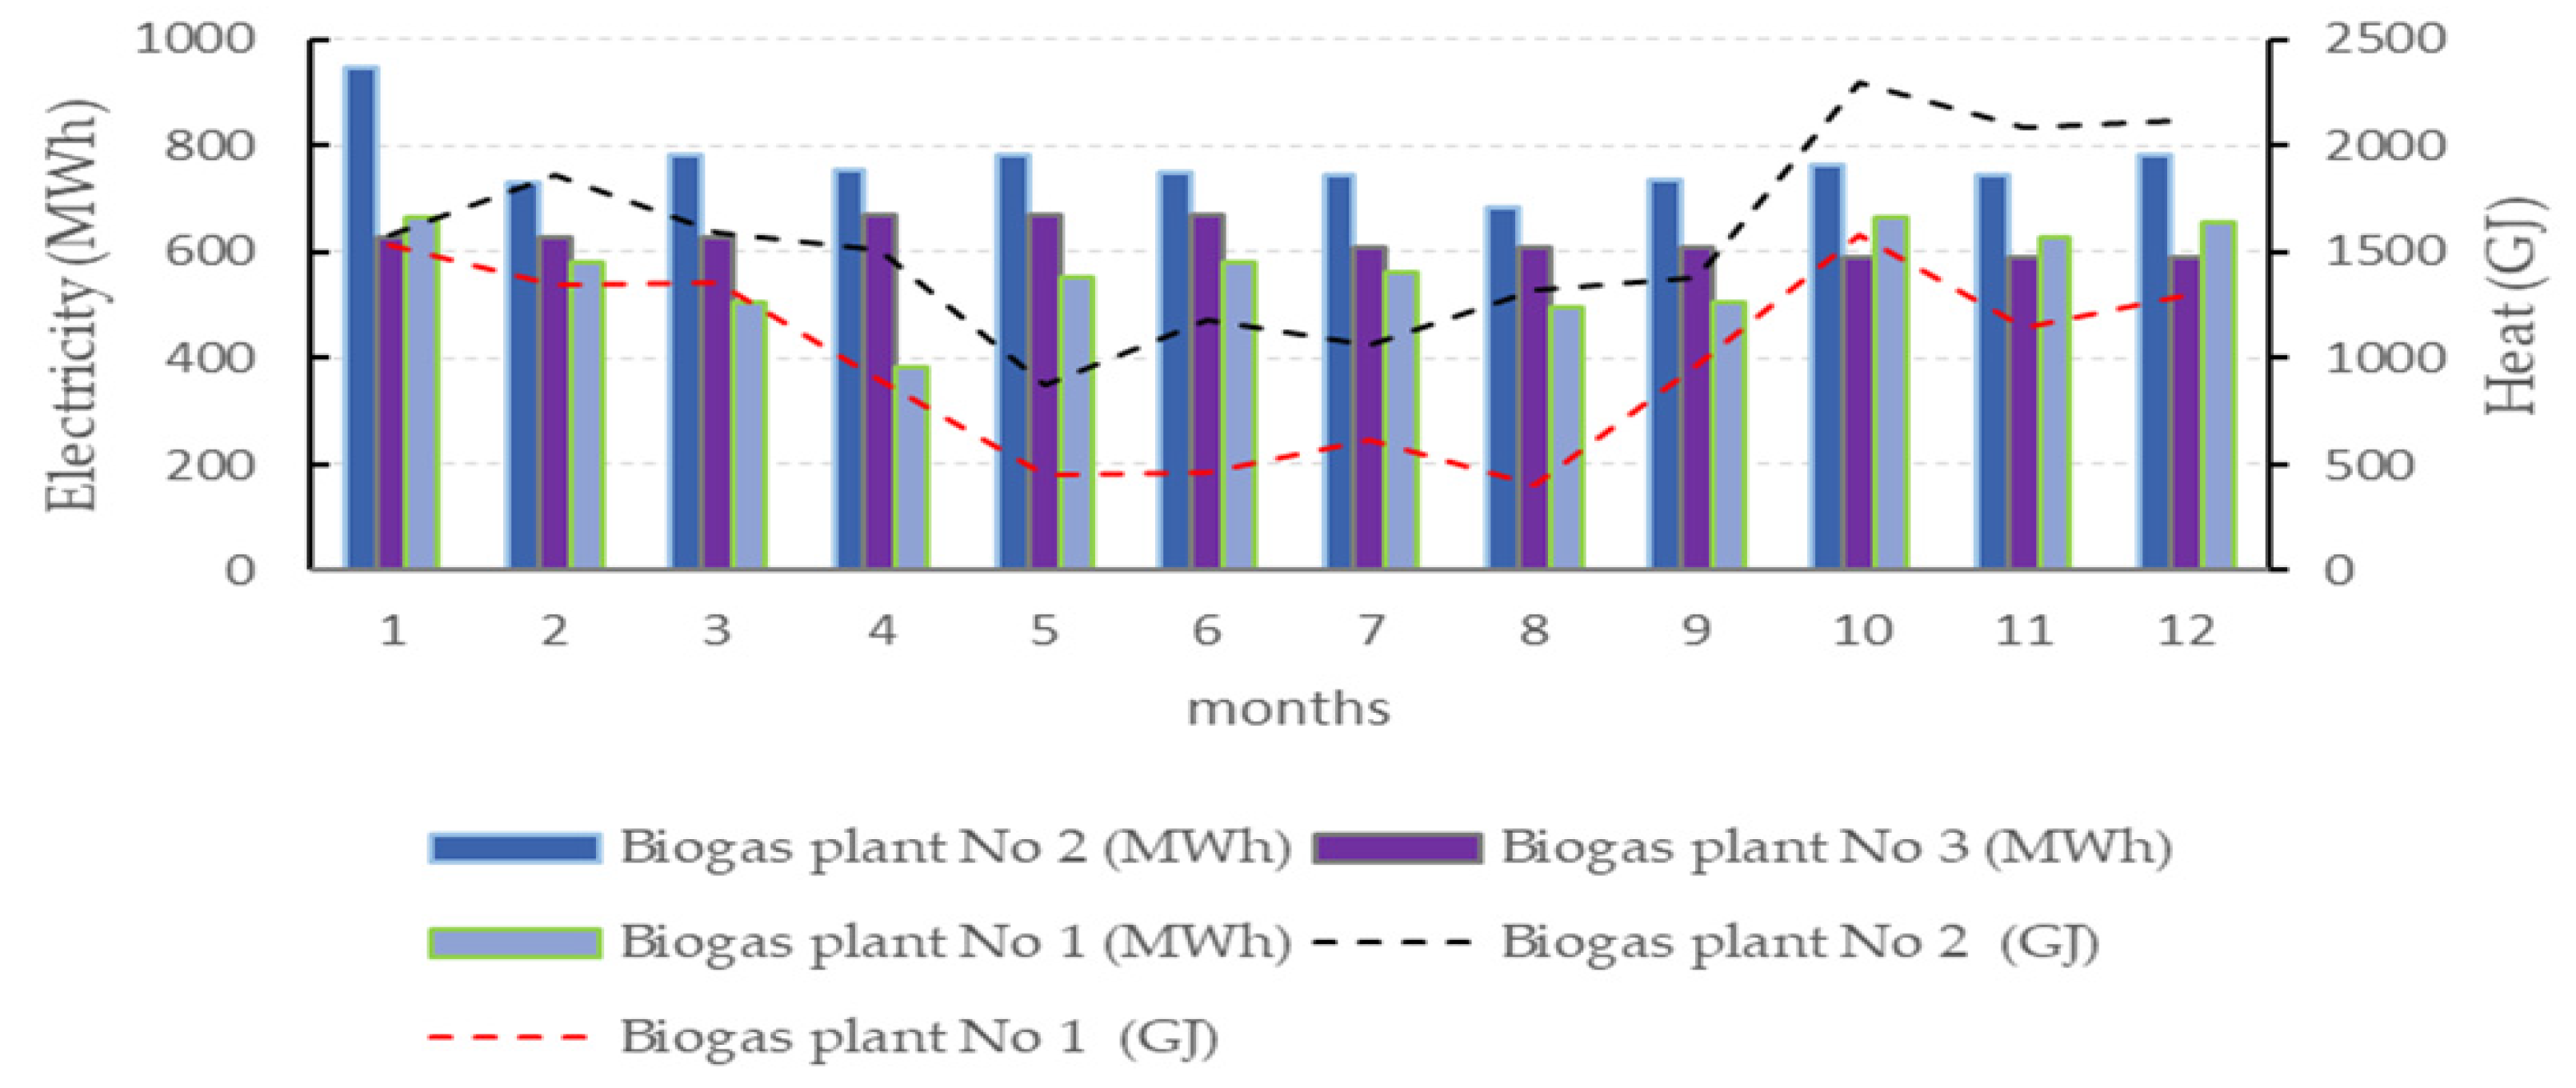
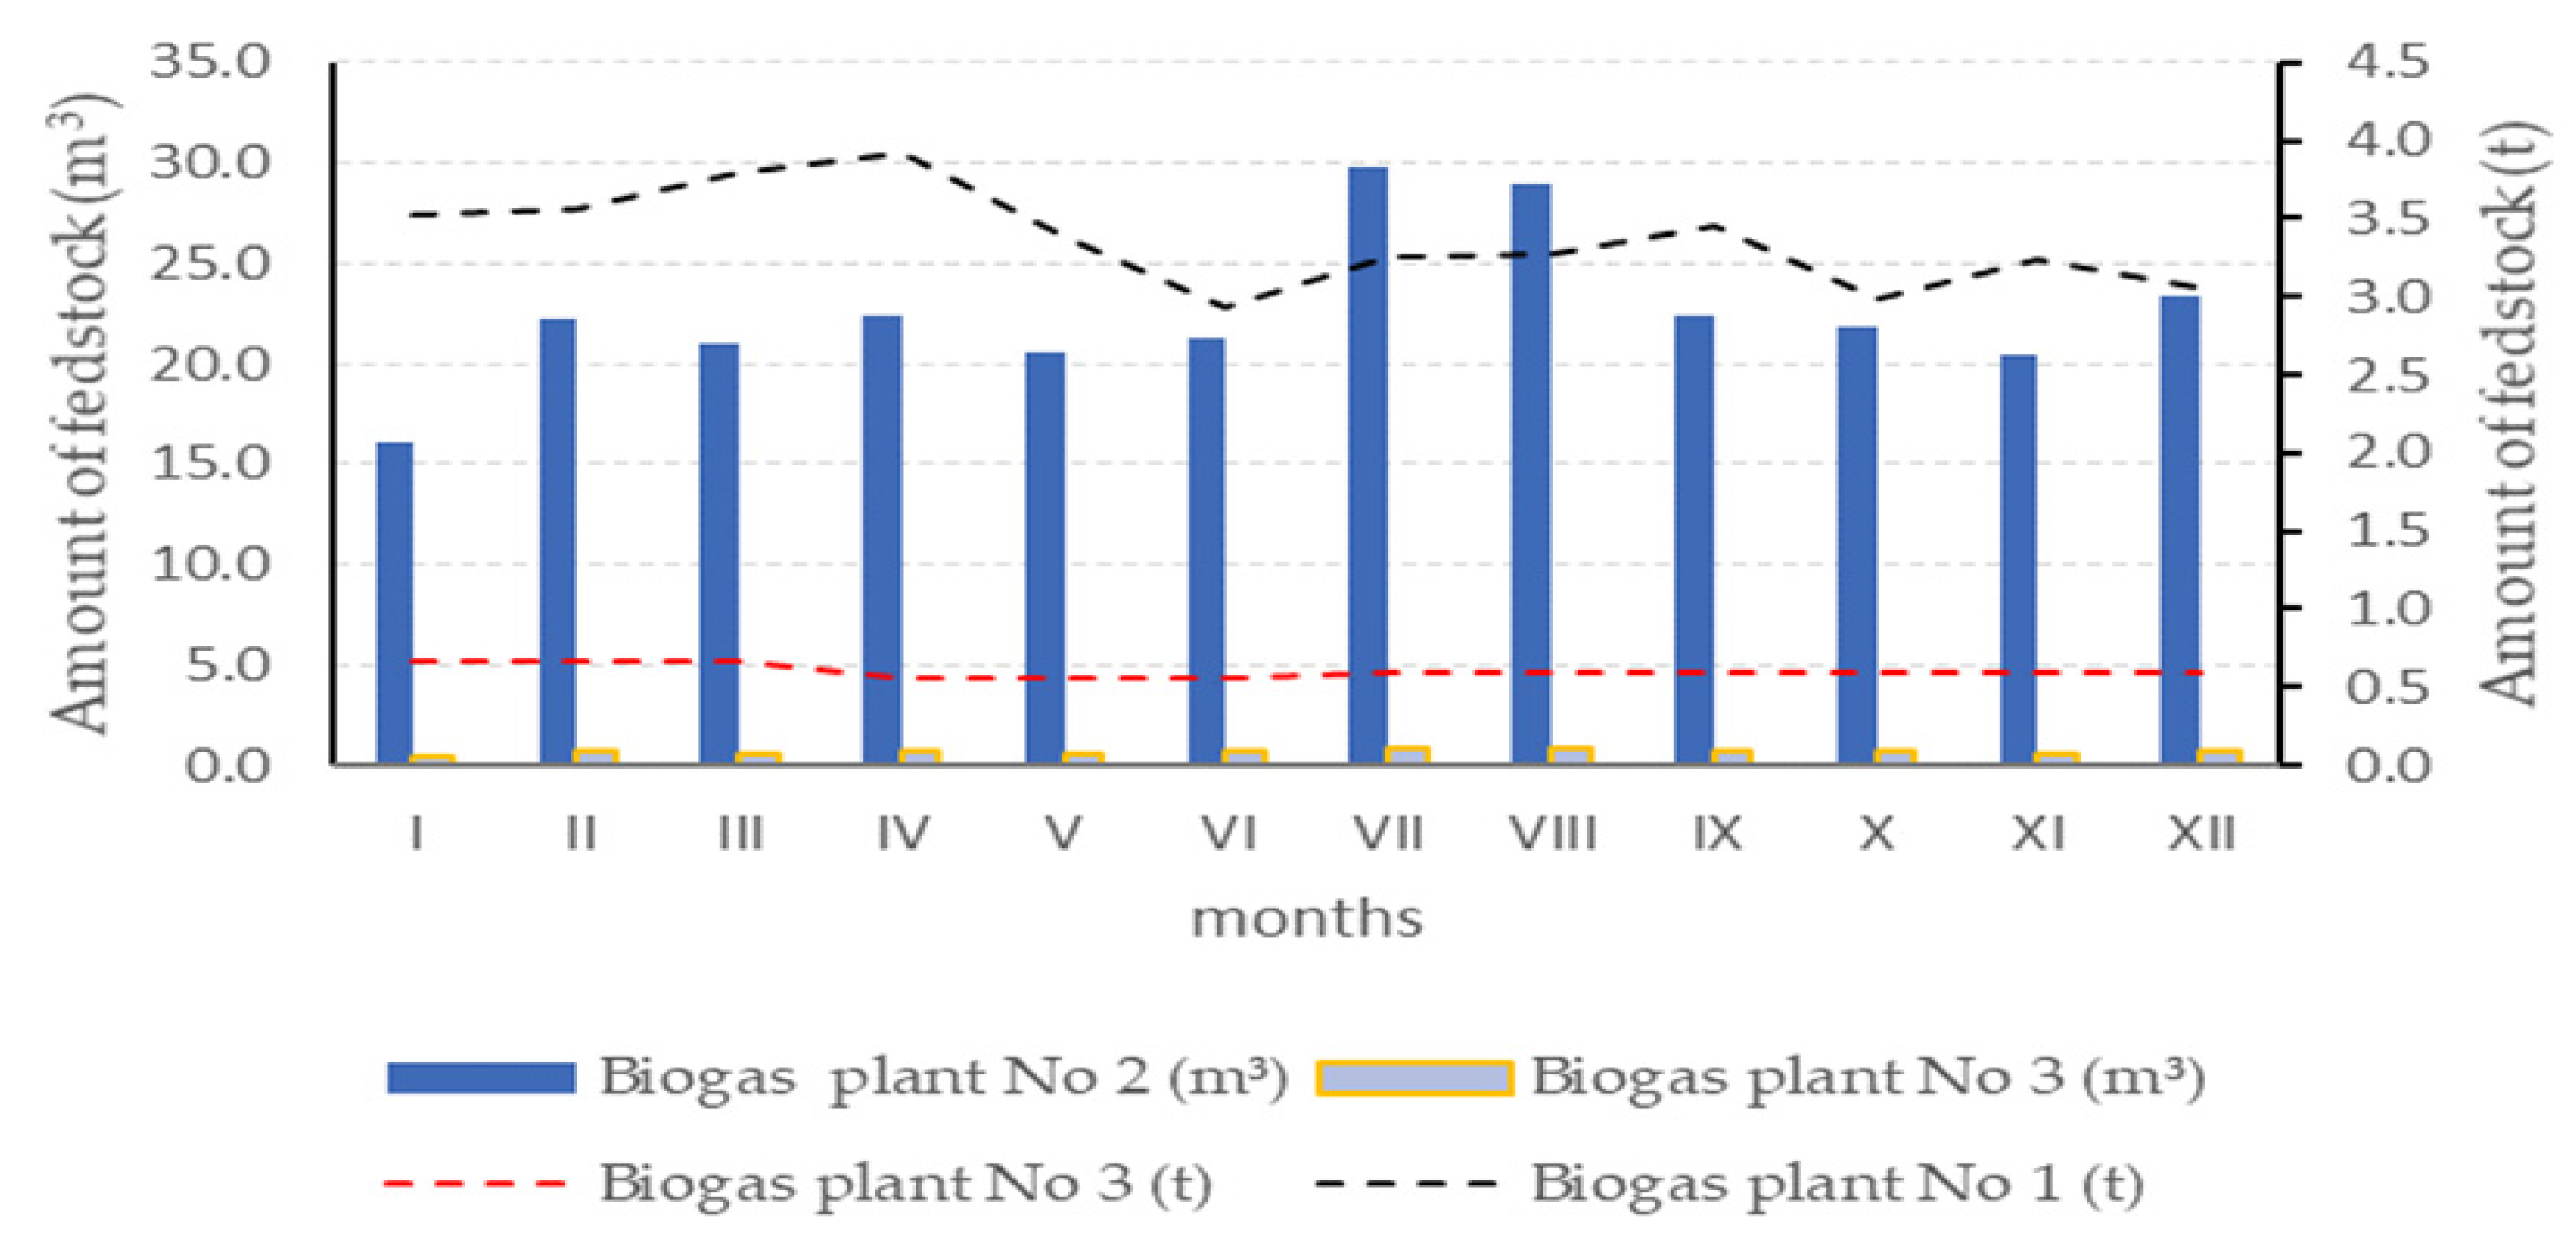
3. Results and Discussion
4. Conclusions
Author Contributions
Funding
Institutional Review Board Statement
Informed Consent Statement
Data Availability Statement
Acknowledgments
Conflicts of Interest
References
- Ahmad, S.; Razzaq, S.; Rehan, M.A.; Hashmi, M.A.; Ali, S.; Amjad, M.S.; Mehmood, U. Experimental Investigation of Novel Fixed Dome Type Biogas Plant using Gas Recovery Chamber in Rural Areas of Pakistan. Int. J. Renew. Energy Res. 2019, 9, 1537–1547. [Google Scholar]
- Csikos, N.; Schwanebeck, M.; Kuhwald, M.; Szilassi, P.; Duttmann, R. Density of Biogas Power Plants as An Indicator of Bioenergy Generat-ed Transformation of Agricultural Landscapes. Sustainability 2019, 9, 11. [Google Scholar]
- Kilic, M.K.; Abut, N.; Kilic, F.C.; Eyidoğan, M.; Kaya, D. An examination of measuring and control systems in an industrial biogas plant in turkey. Int. J. Ecosyst. Ecol. Sci. (IJEES) 2019, 9, 11–16. [Google Scholar] [CrossRef]
- Pochwatka, P.; Kowalczyk-Juśko, A.; Sołowiej, P.; Wawrzyniak, A.; Dach, J. Biogas Plant Exploitation in a Mid-dle-Sized Dairy Farm in Poland: Energetic and Economic Aspects. Energies 2020, 13, 6058. [Google Scholar] [CrossRef]
- Yu, Q.; Li, H.; Deng, Z.; Liao, X.; Liu, X.; Liu, J. Comparative assessment on two full-scale food waste treatment plants with different anaer-obic digestion processes. J. Clean. Prod. 2020, 263, 121625. [Google Scholar] [CrossRef]
- Jarrar, L.; Ayadi, O.; Al, A.J. Techno-economic Aspects of Electricity Generation from a Farm Based Biogas Plant. J. Sustain. Dev. Energy Water Environ. Syst. 2020, 8, 476–492. [Google Scholar] [CrossRef]
- Ervasti, S.; Vainio, M.; Tampio, E. Use of local resources as co-substrates in a farm-scale biogas plant. Open Agric. 2019, 4, 650–660. [Google Scholar] [CrossRef]
- Perez, V.; Mota, C.R.; Munoz, R.; Lebrero, R. Polyhydroxyalkanoates (PHA) production from biogas in waste treatment facilities: Assessing the potential impacts on economy, environment and society. Chemosphere 2020, 255, 126929. [Google Scholar] [CrossRef]
- Nikiciuk, M. Ecological and progrowth potential of agricultural biogas sector in podlaskie voivodeship. Pol. To-Warzystwo Ekon. 2018, 3, 98–117. [Google Scholar]
- Załuska, M.; Piekutin, J.; Magrel, L. Economic and energetic efficiency of biogas plant depending on the substrate appli-cable. Oficyna Wydawnicza Politech. Białostockiej 2018, 9, 51–56. [Google Scholar]
- Puchlik, M.; Ignatowicz, K. Seasonal Changes in Quality of Wastewater from Fruit and Vegetable Industry. E3S Web Conf. 2017, 22, 00139. [Google Scholar] [CrossRef]
- Uddin, M.E.; Larson, R.A.; Wattiaux, M.A.E. Ects of dairy cow breed and dietary forage on greenhouse gas emissions from manure during storage and after field application. J. Clean. Prod. 2020, 270, 122461. [Google Scholar] [CrossRef]
- Wattiaux, M.A.; Uddin, M.E.; Letelier, P.; Jackson, R.D.; Larson, R.A. Invited Review: Emission and mitigation of greenhouse gases from dairy farms: The cow, the manure, and the field. Appl. Anim. Sci. 2019, 35, 238–254. [Google Scholar] [CrossRef]
- Xue, B.; Wang, L.; Yan, T. Methane emission inventories for enteric fermentation and manure management of yak, buffalo and dairy and beef cattle in China from 1988 to 2009. Agric. Ecosyst. Environ. 2014, 195, 202–210. [Google Scholar] [CrossRef]
- Kozłowski, K.; Dach, J.; Lewicki, A.; Malińska, K.; Do Carmo, I.E.P.; Czekała, W. Potential of biogas production from animal manure in Poland. Arch. Environ. Prot. 2019, 45, 99–108. [Google Scholar]
- Czubaszek, R. Exchange of Carbon Dioxide between the Atmosphere and the Maize Field Fertilized with Digestate from Agricultural Biogas Plant. J. Ecol. Eng. 2019, 20, 145–151. [Google Scholar] [CrossRef]
- Haczykowski, M. Evaluation of Selected Biogas Plants in Terms of Feedstock Management. Master’s Thesis, Bialystok University of Technology, Białystok, Poland, 2019; pp. 76–78. [Google Scholar]
- Renewable Energy—Recast to 2030 (RED II) EU Science Hub. Available online: https://ec.europa.eu/jrc/en/jec/renewable-energy-recast-2030-red-ii (accessed on 10 October 2020).
- Piñas, J.A.V.; Venturini, O.J.; Silva Lora, E.E.; del Olmo, O.A.; Calle Roalcaba, O.D. An economic holistic feasibility assessment of centralized and decentralized biogas plants with mono-digestion and co-digestion systems. Renew. Energy 2019, 139, 40–51. [Google Scholar] [CrossRef]
- Sadecka, Z.; Suchowska-Kisielewicz, M. Co-fermentation of chicken manure. Annu. Set Environ. Prot. 2016, 18, 609–625. [Google Scholar]
- Vega, G.C.C.; Hoeve, M.; Birkved, M.; Sommer, S.G.; Bruun, S. Choosing co-substrates to supplement biogas production from animal slurry—A life cycle assessment of the environmental consequences. Bioresour. Technol. 2014, 171, 410–420. [Google Scholar] [CrossRef] [PubMed]
- Wang, Y.; Zhang, W.; Dong, H.; Zhu, Z.; Li, B. Performance Evaluation of a Large-Scale Swine Manure Mesophilic Biogas Plant in China. Trans. ASABE 2017, 60, 1713–1720. [Google Scholar] [CrossRef]
- Konieczny, R.; Łaska, B. The production capacity of renewable energy from available biomass including available tech-nologies. J. Res. Appl. Agric. Eng. 2014, 59, 120–123. [Google Scholar]
- Deublein, D.; Steinhauser, A. Biogas from Waste and Renewable Resources; John Wiley & Sons: Hoboken, NJ, USA, 2008; pp. 20–399. [Google Scholar]
- Bień, J.D.; Bień, B. Agricultural Biogas Plant as an Element of Waste Management Plant and Green Energy Production in Local Municipality. Eng. Prot. Environ. 2021, 13, 17–27. [Google Scholar]
- Maragkaki, A.; Fountoulakis, M.; Kyriakou, A.; Lasaridi, K.; Manios, T. Boosting biogas production from sewage sludge by adding small amount of agro-industrial by-products and food waste residues. Waste Manag. 2018, 71, 605–611. [Google Scholar] [CrossRef] [PubMed]
- Czekała, W.; Dach, J.; Dong, R.; Janczak, D.; Malińska, K.; Jóźwiakowski, K.; Smurzyńska, A.; Cieślik, M. Composting potential of the solid fraction of digested pulp produced by a biogas plant. Biosyst. Eng. 2017, 160, 25–29. [Google Scholar] [CrossRef]
- Saber, M. Designing biogas units for cleaner energy production from different wastewater effluents. Desalin. Water Treat. 2015, 57, 1–7. [Google Scholar] [CrossRef]
- Paramaguru, G.; Kannan, M.; Senthilkumar, N.; Senthilkumar, N.; Lawrence, P. Effect of temperature on biogas produc-tion from food waste through anaerobic digestion. Desalin. Water Treat. 2017, 85, 68–72. [Google Scholar] [CrossRef]
- European Biogas Association. Biogas and Biomethane Report; European Biogas Association: Brussels, Belgium, 2015; Available online: http://european-biogas.eu/wp-content/uploads/2016/02/EBA-Annual-Report-2015-Web.pdf (accessed on 28 November 2018).
- Lozanovski, A.; Lindner, J.P.; Bos, U. Environmental evaluation and comparison of selected industrial scale biomethane production facilities across Europe. Int. J. Life Cycle Assess. 2014, 19, 1823–1832. [Google Scholar] [CrossRef]
- Börjesson, P.; Tufvesson, L.M. Agricultural crop-based biofuels—Resource efficiency and environmental performance in-cluding direct land use changes. J. Clean. Prod. 2011, 19, 108–120. [Google Scholar] [CrossRef]
- Appels, L.; Lauwers, J.; Degrève, J.; Helsen, L.; Lievens, B.; Willems, K.A.; Van Impe, J.; Dewil, R. Anaerobic digestion in global bio-energy production: Potential and research challenges. Renew. Sustain. Energy Rev. 2011, 15, 4295–4301. [Google Scholar] [CrossRef]
- Weiland, P. Biogas production: Current state and perspectives. Appl. Microbiol. Biotechnol. 2010, 85, 849–860. [Google Scholar] [CrossRef]
- Ioelovich, M. Recent findings and the energetic potential of plant biomass as a renewable source of biofuels—A review. Bioresources 2015, 10, 1879–1914. [Google Scholar]
- Ahlberg-Eliasson, K.; Nadeau, E.; Levén, L.; Schnürer, A. Production efficiency of Swedish farm-scale biogas plants. Biomass Bioenergy 2017, 97, 27–37. [Google Scholar] [CrossRef]
- White, E.M.; Latta, G.; Alig, R.J.; Skog, K.E.; Adams, D.M. Biomass production from the US forest and agriculture sectors in support of a renewable electricity standard. Energy Policy 2013, 58, 64–74. [Google Scholar] [CrossRef]
- Maj, G.; Piekarski, W.; Kowalczyk-Juśko, A.; Łukaszczyk, A. Waste from agri-food sector, communal and targeted crops as a source of biogas. Przemysł Chem. 2014, 93, 732–736. [Google Scholar]
- Almomani, F.; Bhosale, R.R. Enhancing the production of biogas through anaerobic co-digestion of agricultural waste and chemical pre-treatments. Chemosphere 2020, 25, 126805. [Google Scholar] [CrossRef]
- Ibrahim, U.M.; Ahmed, S.I.; Gutti, B.; Muhammad, I.M.; Hamza, U.D.; Ibrahim, M.D. Biogas Production from Combined Irish Potato and Poultry Wastes: Optimization and Kinetic Studies. Int. J. Eng. Technol. 2018, 7, 170. [Google Scholar] [CrossRef][Green Version]
- Han, Y.; Green, H.; Tao, W. Reversibility of propionic acid inhibition to anaerobic digestion: Inhibition kinetics and micro-bial mechanism. Chemosphere 2020, 255, 126840. [Google Scholar] [CrossRef]
- Dach, Z.; Zbytek, Z.; Pilarski, K.; Adamski, M. Perspectives and problems of agricultural biogas plants development in Poland. Tech. Rol. Ogrod. Leśna 2009, 6, 2–4. [Google Scholar]
- Kozłowski, K.; Lewicki, A.; Cieslik, M.; Janczak, D.; Czekała, W.; Smurzyńska, A.; Brzoski, M. The possibility of improv-ing the energy and economic balance of agricultural biogas plant. Tech. Rol. Ogrod. Leśna 2017, 3, 10–13. [Google Scholar]
- Ryckebosch, E.; Drouillon, M.; Vervaeren, H. Techniques for trans-formation of biogas to biomethane. Biomass Bioenergy 2011, 35, 1633–1645. [Google Scholar] [CrossRef]
- Batlle-Vilanova, P.; Rovira-Alsina, L.; Puig, S.; Balaguer, M.D.; Icaran, P.; Monsalvo, V.M.; Rogalla, F.; Colprim, J. Biogas upgrading, CO2 valorisation and economic revaluation of bio-electrochemical systems through anodic chlorine production in the framework of wastewater treatment plants. Sci. Total Environ. 2019, 690, 352–360. [Google Scholar] [CrossRef] [PubMed]
- Bocci, E.; Di Carlo, A.; McPhail, S.J. Biomass to fuel cells state of the art: A review of the most innovative technology solu-tions. Int. J. Hydrogen Energy 2014, 39, 21876–21895. [Google Scholar] [CrossRef]
- Hamawand, I. Anaerobic digestion process and bio-energy in meat industry: A review and a potential. Renew. Sustain. Energy Rev. 2015, 44, 37–51. [Google Scholar] [CrossRef]
- Masłoń, A.; Czarnota, J.; Szaja, A.; Szulżyk-Cieplak, J.; Łagód, G. The Enhancement of Energy Efficiency in a Wastewater Treatment Plant through Sustainable Biogas Use: Case Study from Poland. Energies 2020, 13, 6056. [Google Scholar] [CrossRef]
- Masłoń, A. An Analysis of Sewage Sludge and Biogas Production at the Zamość WWTP. In Proceedings of the 17th International Scientific Conference on Current Issues of Civil and Environmental Engineering Lviv-Kosice-Rzeszow (CEE), Lviv, Ukraine, 11–13 September 2019. [Google Scholar]
- Szczyrba, P.; Masłoń, A.; Czarnota, J.; Olszewski, K. Analysis of sewage sludge and biogas-energy management at the Opole wastewater treatment plant. Inżynieria Ekol. 2020, 21, 26–34. [Google Scholar] [CrossRef]
- Kowalczyk-Juśko, A.; Listosz, A.; Flisiak, M. Spatial and social conditions for the location of agricultural biogas plants in Poland (case study). In Proceedings of the 1st International Scientific Conference on Ecological and Environmental Engineering, Krakow, Poland, 26–29 June 2018; Volume 86. [Google Scholar]


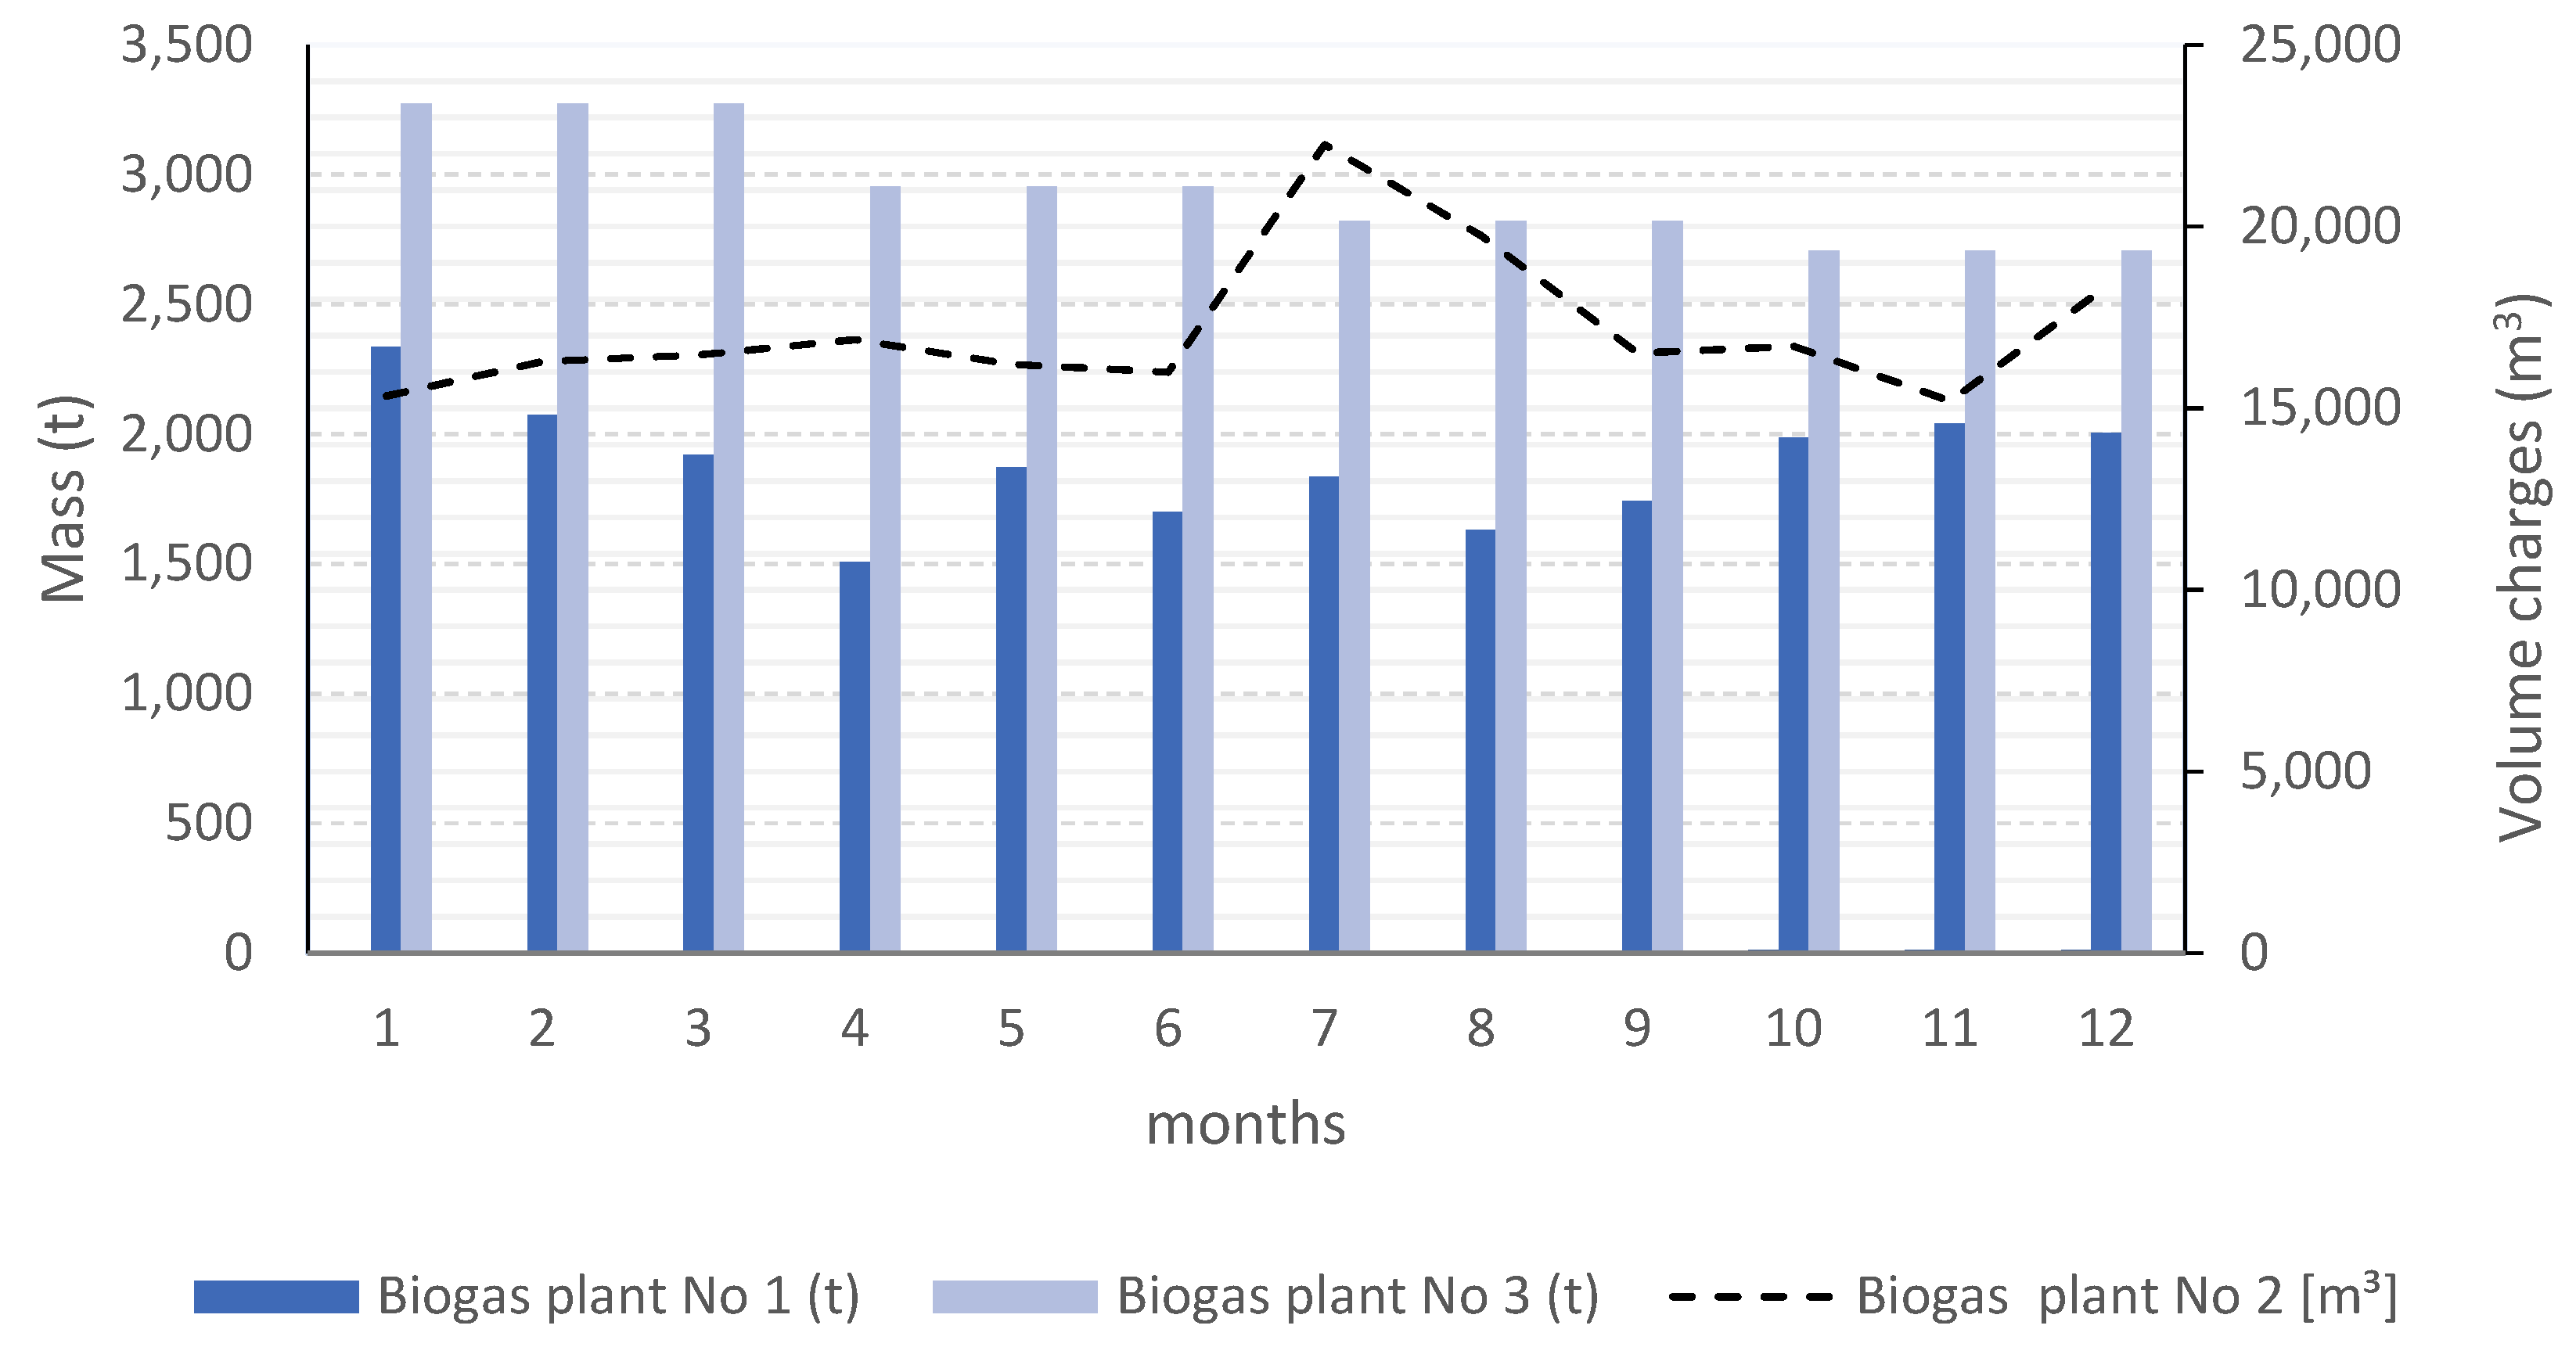
| Month 2018 | Total Silage (t) | Manure (t) | Apple Pomace (t) | Potato Pulp (t) | Others (t) | UPPZ Cat. 2 Stomach Contents (t) | Total Solid Substrates (mln t) | Total Liquid Substrates [t] |
|---|---|---|---|---|---|---|---|---|
| I | 1135 | 65.0 | 0 | 35 | 3.50 | 24.1 | 1263 | 1073 |
| II | 1067 | 83.0 | 0 | 15 | 17.6 | 26.3 | 1209 | 864.0 |
| III | 944.0 | 64.0 | 0 | 5.0 | 0 | 22.2 | 1035 | 884.0 |
| IV | 725.0 | 80.0 | 0 | 30 | 0 | 28.6 | 863.6 | 799.0 |
| V | 1194 | 133 | 0 | 40 | 0 | 26.6 | 1393 | 751.0 |
| VI | 1274 | 70.0 | 0 | 0 | 0 | 30.4 | 1374 | 718.0 |
| VII | 1240 | 70.0 | 0 | 0 | 0 | 20.3 | 1330 | 849.0 |
| VIII | 996.0 | 41.0 | 15.0 | 0 | 4.50 | 23.3 | 1080 | 847.0 |
| IX | 1018 | 12.0 | 170 | 0 | 1.00 | 23.2 | 1224 | 788.0 |
| X | 820.0 | 16.0 | 575 | 0 | 0 | 24.4 | 1435 | 945.0 |
| XI | 767.0 | 67.0 | 626 | 0 | 0 | 29.2 | 1489 | 905.0 |
| XII | 892.0 | 64.0 | 500 | 51 | 0 | 13.0 | 1520 | 782.0 |
| Sum | 12,072 | 765 | 1886 | 176 | 27.0 | 292 | 15,217 | 10,204 |
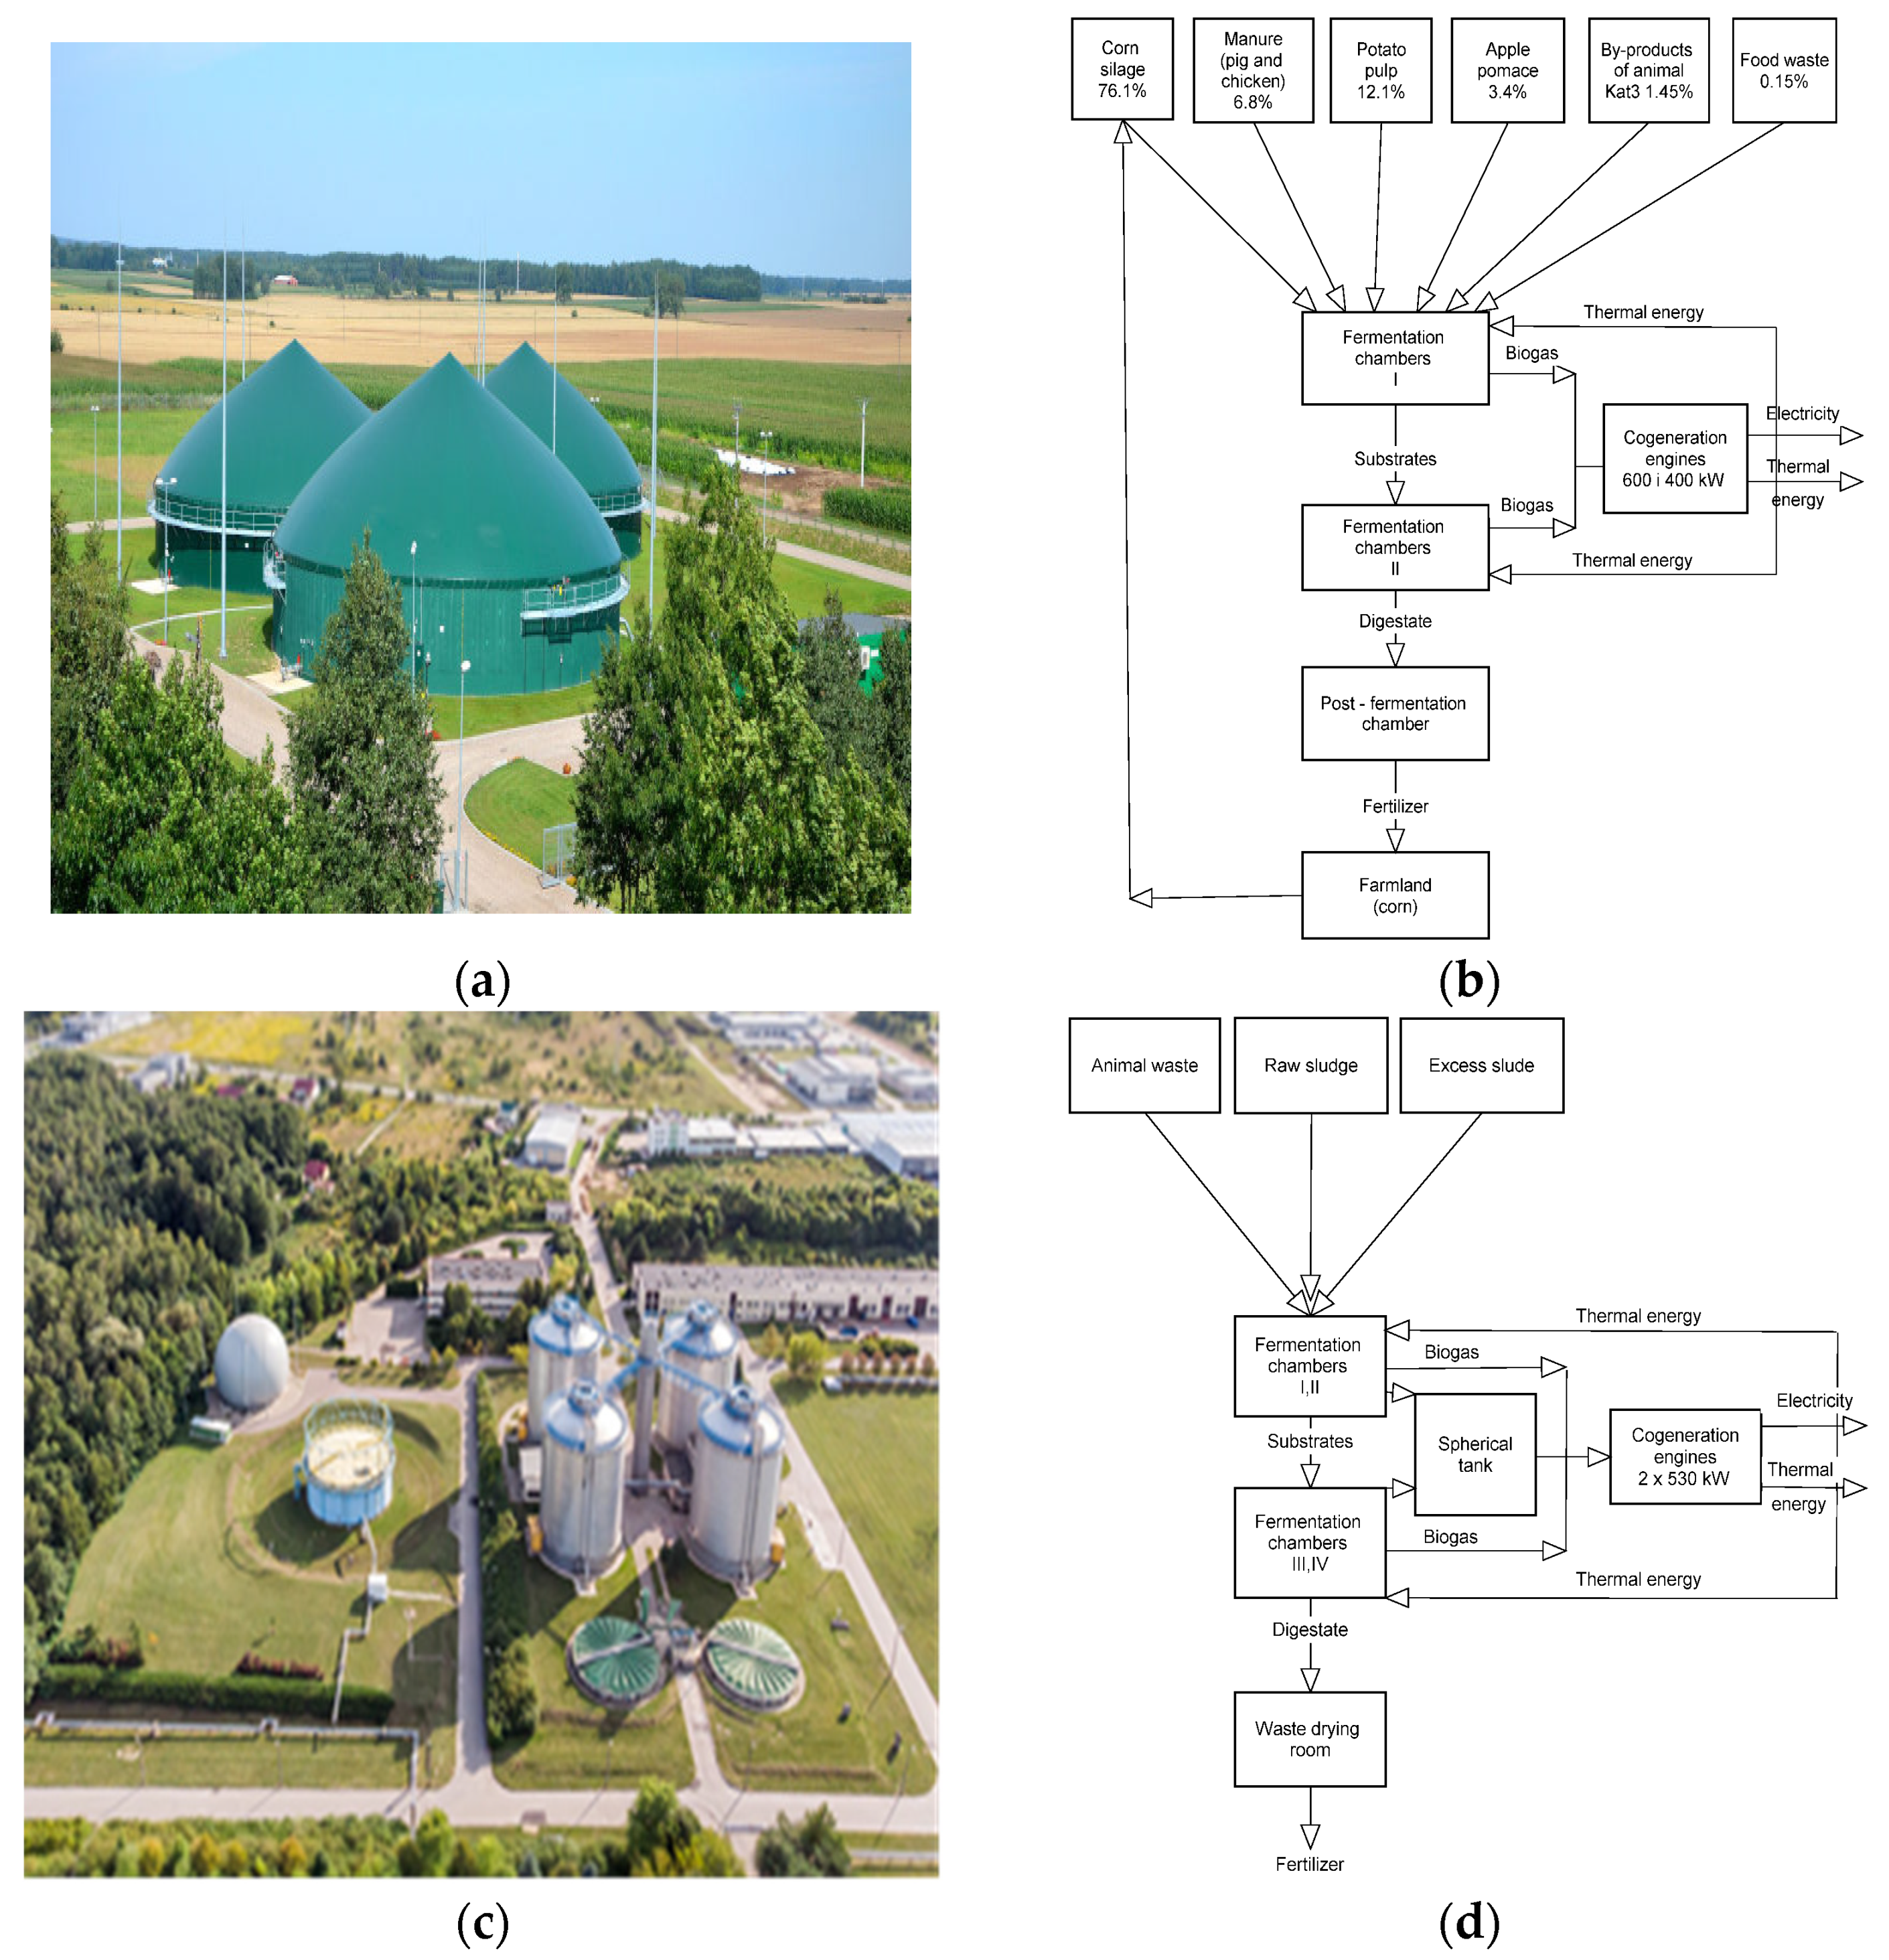
| Biogas Plants | Type of Feedstock Used | Amount of Input Material [t/Day] | Fermentation Chamber Volume [m3] | Volume of Biogas Tanks [m3] | Biogas Management |
|---|---|---|---|---|---|
| 1 | Corn silage, manure, liquid manure, fruit pomace, mulch, stomach contents, potato pulp | 62 | 2 × 4.241 6.433 | Depends on the fermenter filling level | Co-generators: 400 kW, 600 kW |
| 2 | Crude sludge, excessive active sludge, co-ferment | 47 | 4 × 7.700 | 5.000 | Co-generation: 2xJENBACHER JMS 312 GS-B/N.L.; 530 kW each; HORUS HE-sec 480/510; 480-B, 480 kW each; Combustion: 2xVITOPLEX 300, 1.400 kW each |
| 3 | Liquid manure, chicken manure, slaughterhouse and dairy fleet, poultry feathers, cheese whey, vegetable matter, stomach contents | 98 | 2 × 3.200 770 | 500 | Co-generator: 0.99 MW el |
Publisher’s Note: MDPI stays neutral with regard to jurisdictional claims in published maps and institutional affiliations. |
© 2021 by the authors. Licensee MDPI, Basel, Switzerland. This article is an open access article distributed under the terms and conditions of the Creative Commons Attribution (CC BY) license (https://creativecommons.org/licenses/by/4.0/).
Share and Cite
Piekutin, J.; Puchlik, M.; Haczykowski, M.; Dyczewska, K. The Efficiency of the Biogas Plant Operation Depending on the Substrate Used. Energies 2021, 14, 3157. https://doi.org/10.3390/en14113157
Piekutin J, Puchlik M, Haczykowski M, Dyczewska K. The Efficiency of the Biogas Plant Operation Depending on the Substrate Used. Energies. 2021; 14(11):3157. https://doi.org/10.3390/en14113157
Chicago/Turabian StylePiekutin, Janina, Monika Puchlik, Michał Haczykowski, and Katarzyna Dyczewska. 2021. "The Efficiency of the Biogas Plant Operation Depending on the Substrate Used" Energies 14, no. 11: 3157. https://doi.org/10.3390/en14113157
APA StylePiekutin, J., Puchlik, M., Haczykowski, M., & Dyczewska, K. (2021). The Efficiency of the Biogas Plant Operation Depending on the Substrate Used. Energies, 14(11), 3157. https://doi.org/10.3390/en14113157