1. Introduction
Recently, the number of wind power plants (WPPs) has been growing in the Integrated Power System of Ukraine (IPS), the European Network of Transmission System Operators for Electricity, electric utility systems of North America and other countries. This is due to the fact that at the state level, the so-called “green” generation, which uses renewable energy resources, is stimulated. Of particular interest to investors are powerful WPP, consisting of many individual wind turbine generators (WTGs) with a nameplate rating ranging from 1.5 MW to 5.5 MW. For this power, doubly-fed induction generators (DFIGs) with wound rotors are used. In Ukraine generally each WTG has a step-up transformer, which is a pad-mounted unit, to connect to a medium-voltage collector network operating at 10 kV to 35 kV. The collector network consists of one or several feeders. All WTGs are divided into groups connected to different feeders. Typically, WTGs are connected in series (
Figure 1). All feeders are connected together at a collector system station. As a rule, a station can have one or more transformers which step-up voltage to the rated value of the interconnection point. If the station is not adjacent to the interconnection point, an interconnection transmission line is used.
To increase the generation of electrical energy, WTGs are positioned as high as possible. Modern generators are located at a height of more than 80 m with a distance between towers of more than 200 m, which requires a large area, which is mostly used for agricultural purposes. To be able to use the land for its intended purpose, a collector network is built with underground power lines, as a rule, with cross-linked polyethylene (XLPE) insulated cables.
Many articles are devoted to solving a large number of problems associated with the design of cable lines with XLPE insulation, but none of them consider the case in which cable lines connect several sources of electrical energy. This is especially the case with the short length of the cable line, which we observe on the territory of the WPP.
In [
1], the ways of WTG control are considered to improve the transmission capacity of a low-voltage network during a voltage dip, and in [
2] a WTG control system to reduce inter-area oscillations that can be formed during parallel operation of a WPP with a power system. However, the processes considered in [
1,
2] will also depend on the parameters of the cable line that connects the WTG.
The selection of cross-sections of cable core and optimization of the WPP network structure by various algorithms to minimize electrical energy losses are well described in [
3,
4,
5,
6,
7,
8]. The articles [
9,
10] also raise problems of minimizing power losses in electrical networks. In [
11], methods of calculating the currents that can flow through the cable screen in normal mode are considered. In [
12,
13], it is proposed to identify the aging of cable insulation by currents in screens that are grounded on both sides. The article [
14] also raises questions of fault identification. However, these articles do not discuss the task of selecting screen cross-section of the cable. Therefore, authors raised problems of correct calculation of faults current which helps to select screen cross-section of the cable. The results give the possibility to reduce the cost of the WPPs power network.
2. Description of the Problem
The selection of cross-sections of conductors of XLPE insulated cables and their screens should be carried out in accordance with the requirements of the existing regulatory documents [
15,
16]. The cross-section of the cable cores is selected according to the limiting continuous current of load in normal condition and is checked by the current in the post-fault condition and also checked by the thermal short-circuit strength. In Ukraine, Italy, Finland, the Russian Federation and other countries medium voltage power networks (10–35 kV) operate with isolated (undergrounded) or resonant grounded (using grounded-fault neutralizer) neutral. Using this neutral mode allows the network to continue operating after a line-to-earth fault, which increases reliability of power generation, but in some countries, operation of the network after a line-to-earth fault is unacceptable. In the article, we only considered networks where this operation is allowed.
As known, cables with XLPE insulation are very reliable, and a line-to-earth fault in networks built using this type of cable occurs most often in the cable joint (end) sleeve. In these networks during a line-to-earth fault the line-to-screen voltage increases to a line-to-line value. This fact increases the possibility of other faults. If a second line-to-earth fault occurs on one of the other phases of the cable line, much higher current will flow from line to line through the cable screen (interphase fault current through the cable screens or double line-to-earth fault current). Therefore, when choosing the cross-section of the cable screen, it is necessary to take into account the fault like this. Because the thermal effect of this current can damage the cable.
The line-to-earth faults rarely occur in cable but more often occur in the cable joint (or end) sleeve [
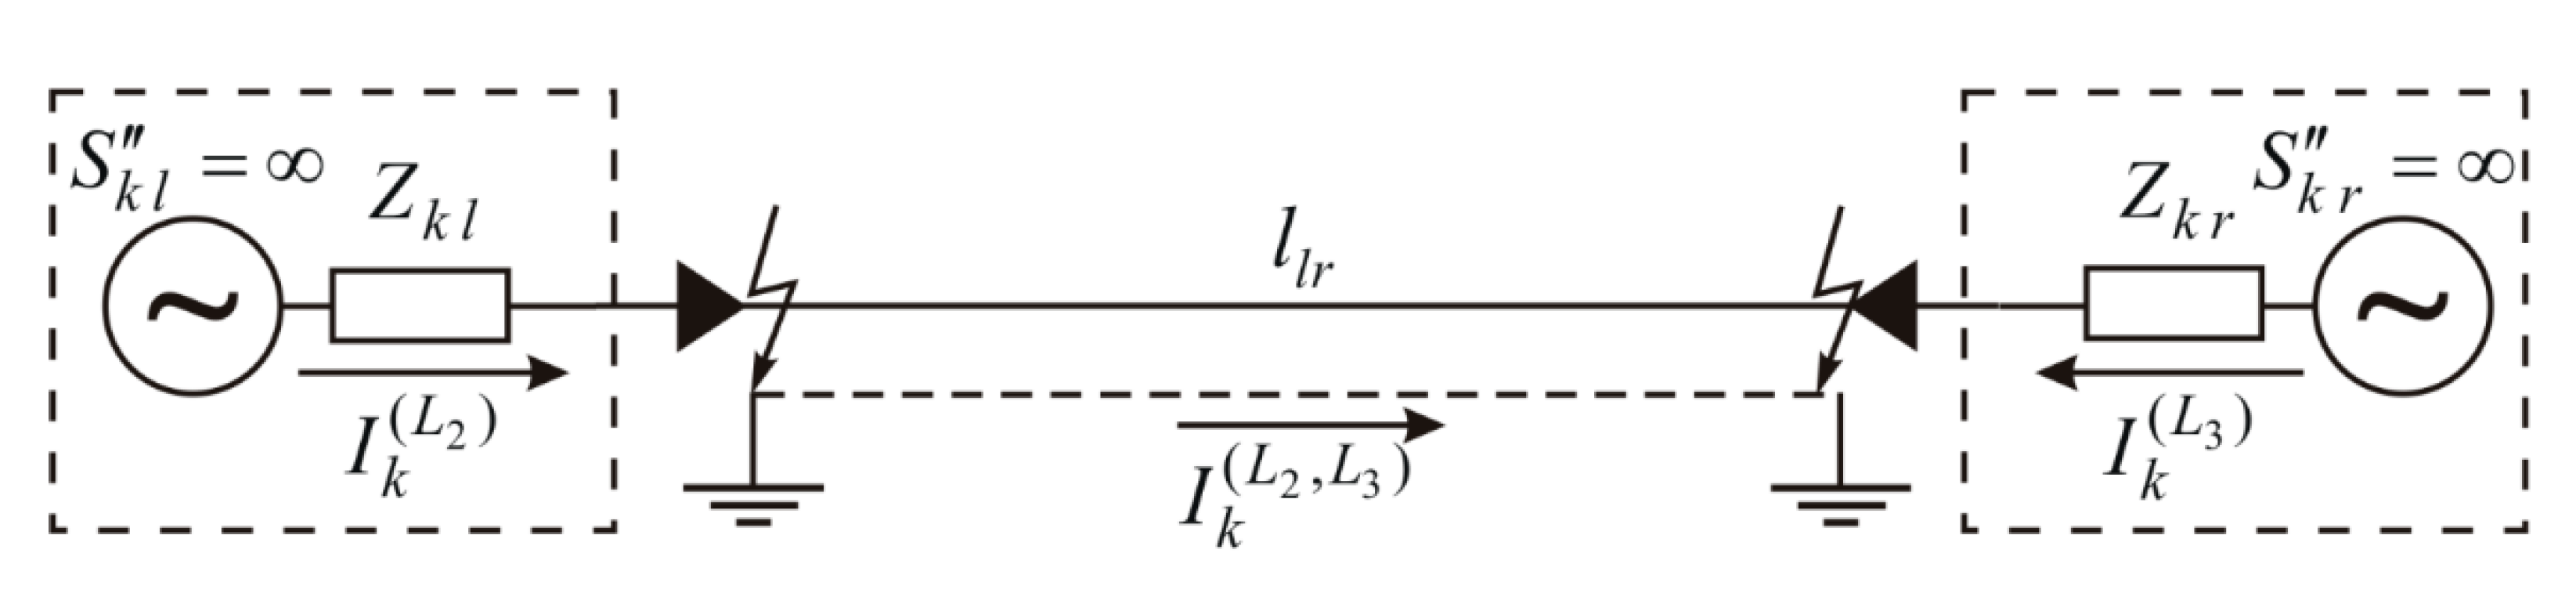
17]. In the worst case, the double line-to-earth fault can occur simultaneously in the cable joint (or end) sleeve on the left and right side in different phases of one cable line section (between two WTGs). In this case, the current value will be the highest. Hereinafter we will call this current the double line-to-screen fault current.
Figure 2 shows a single-line diagram in the worst case when line-to-earth faults occur simultaneously on the left and right side in the cable line section between two WTGs.
We will assume that the screen of a three-core cable (or three single-core cables) is grounded on both sides. It should be noted that in the case of grounding the screens of three single-core cables on only one side, the entire double line-to-screen fault current will flow through the screen of only one core, which will require a significant increase in the cross-section of the screens. Therefore, this design is not used in practice.
The problem is that to select the screen cross-section of the cable you need to know the value of the screen fault current, but to calculate the current you need to know the screen cross-section impedance, which is not yet selected. Therefore, this problem is iterative and can be solved in two or more iterations steps:
In the first step, for the smallest possible screen cross-section (selected earlier), the value of double line-to-screen fault current is calculated and the required screen cross-section is selected again;
In the second step, for the selected screen cross-section, the updated value of double line-to-screen fault current is calculated and the selected cross-section is checked for thermal strength.
Condition to check is:
where
is the value of the permissible short-circuit current of the screen with the duration of a clearance time.
This current is calculated under the assumption that during a fault the temperature of the cable screen must not exceed 350 °C. For this, cable manufacturers indicate the permissible one-second screen current
with the possibility of subsequent adjustment of its value for another short-circuit clearance time according to the formula [
15,
16]:
where
is the maximum permissible short-circuit clearance time in seconds.
If the calculated permissible current of the cable screen is less than the value of (condition (1) is not satisfied), then it is necessary to select the larger screen(s) cross-section and repeat the second step.
It is necessary to repeat the second step until condition (1) is satisfied.
There is a problem for engineers to calculate current
in this algorithm. To calculate the current, a full three-phase circuit of cable power line is needed. In this circuit, parameters such as alternating current (AC) resistance of cores (screens) and self and mutual inductance between core or other core (and screens) are applied. To calculate these parameters for the model we need to know dimensions of XLPE-cable layers (
Figure A3) and geometry of the cable power line (
Figure A4). However, the real dimensions of the cable layers are hidden for the engineers and they are not shown in the catalogs of cable manufacturers. So, it is difficult to use this calculation in real life. Therefore, engineers use a highly simplified method to calculate screen current. This method takes into account only sources which are located on the side of the interconnection point. This method provides acceptable results only for the case of low-power WPPs, but for high-power WPPs it leads to large errors. To avoid the negative effect of those errors, project engineers deliberately overestimate the cable cross-section using the expert method. As a result, the selected cross-section of the cable screen could be in several times larger than the required cross-section. This leads to an increase in the cost of the WPPs cable networks.
We propose a simplified calculation method and compare the calculations results with the existing methods. It should be noted that the proposed method uses open data of XLPE-cable manufacturers.
3. Methodology
We replace WTGs with equivalent sources, which have its own symmetrical three-phase fault power
(or symmetrical three-phase fault current
) for generators on the left side and
(or
) for generators on the right side (see
Figure 3). It is possible because symmetrical three-phase fault power or current is known on the moment of selection screen cross-section. These sources have their own internal impedances
and
.
In the calculations, we will choose arbitrary phases in which faults occur. On the left side—in phase L2 (current )—and on the right side—in phase L3 (current ). Forasmuch the impedance of the cable copper screen is much less than the total grounding impedances of the two grounding devices, then in further considerations it is assumed that all the fault current flows through the cable screen.
As a rule, only the root mean square (RMS) values of symmetrical three-phase fault currents
and
are known, then, according to [
18], the internal impedances can be calculated by the formulas:
where
c—voltage factor;
—rated line voltage;
,
,
,
—equivalent resistive and imaginary impedances of the power sources on left and right side, and modulus of impedance of such sources according to the formulas:
where
,
—the ratio between the imaginary and resistive impedances of the left and right equivalent sources.
Using the ratio between the imaginary and resistive impedances, we can calculate the resistive impedances of the sources using the formulas:
and imaginary impedances as
,
.
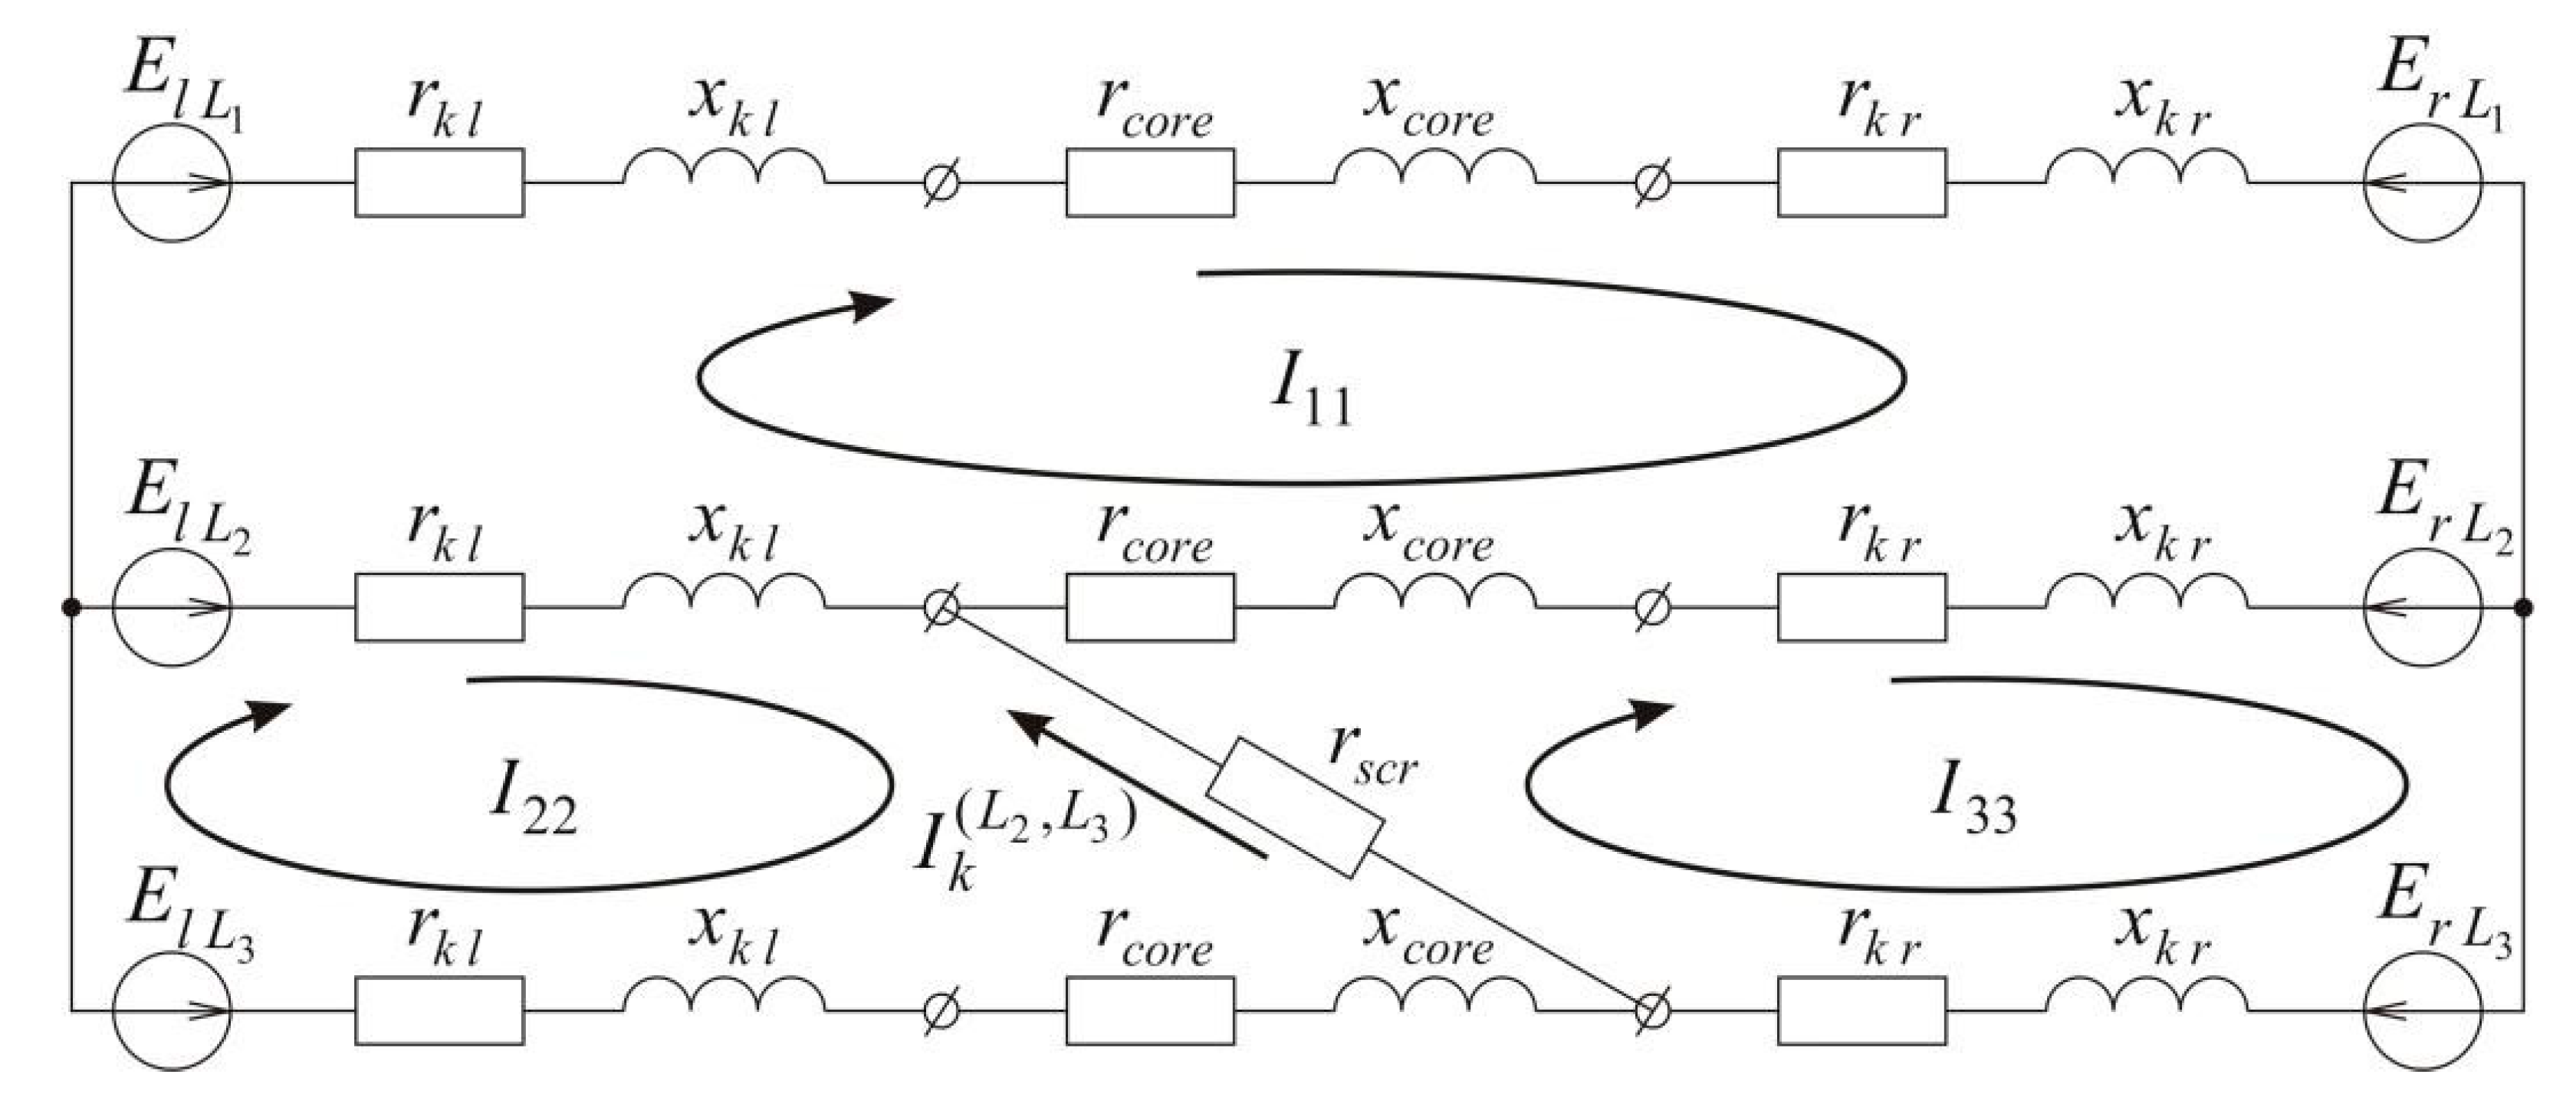
The above assumptions allowed us to obtain a three-phase equivalent circuit of the part of the electrical network between two WTGs (
Figure 4). This circuit allows to calculate the double line-to-screen fault current
which flows through the cable screen. In the figure, the impedance of the cable section is given by resistive
and imaginary
impedances of a cable core and resistive impedances of a cable screen resistances
. These parameters can be calculated from catalog data of cable manufacturers considering the length of the cable power line.
Equivalent sources have symmetrical phase electromotive force (EMF) of the positive sequence:
where
,
—line-to-line voltages of the left and right sources which are equal to the rated voltages of the network,
,
—the phase angle between phase EMF of the left and the right source.
The cable screen cross-section should be selected for the case of maximum current. As shown in
Appendix A the current will be maximum if the phase angle is equal to zero, because in the next calculation the phase angle between phase EMF of the left and the right source is taken as equal to zero.
For single-core cables in which the screens are grounded on both sides, the screen impedance is equal to the equivalent impedance of the three screens of the cables connected in parallel, .
The value of the double line-to-screen fault current in the circuit, shown on
Figure 4, can be calculated by the mesh-current method [
19].
Loop mesh-current equation for the equivalent circuit:
Double line-to-screen fault current, calculated by the formula:
In the case of using single-core cable in which cable screens are grounded on both sides, double line-to-screen fault current is calculated as:
4. Results of Analytical Calculation for Real WPP
For example, consider the real calculation of double line-to-screen fault current for the part of electrical network of Sivash WPP (which is located in the south of Ukraine) with total power 250 MW between two WTGs, where a cable 3×NA2XS(FL)2Y 1×400/35 (TELE-FONIKA Kable S.A., Myślenice, Poland) with XLPE insulation and length equal 0.42 km is used. This cable line has resistive and imaginary impedances of the cores
Ω and resistive impedances of the screen
Ω. These parameters were taken from catalogs of the cable manufacturer [
20].
We assume that EMFs in phases of equivalent circuit (
Figure 4) is three-phase symmetrical
kV. Equivalent resistive and imaginary impedances of the sources were calculated from the known value of symmetrical three-phase fault current
and
by Equations (3)–(5). To simplify the calculations, it is assumed that the sources have only imaginary impedances
Ω and
Ω.
Solved loop mesh-current Equation (7) for the equivalent circuit are:
Double line-to-screen fault current through three cable screens:
and magnitude of current
Double line-to-screen fault current through one cable screen calculated in Equation (9) equals to 4.24 kA.
5. Results Simulation in the MATLAB Simulink for Real WPP
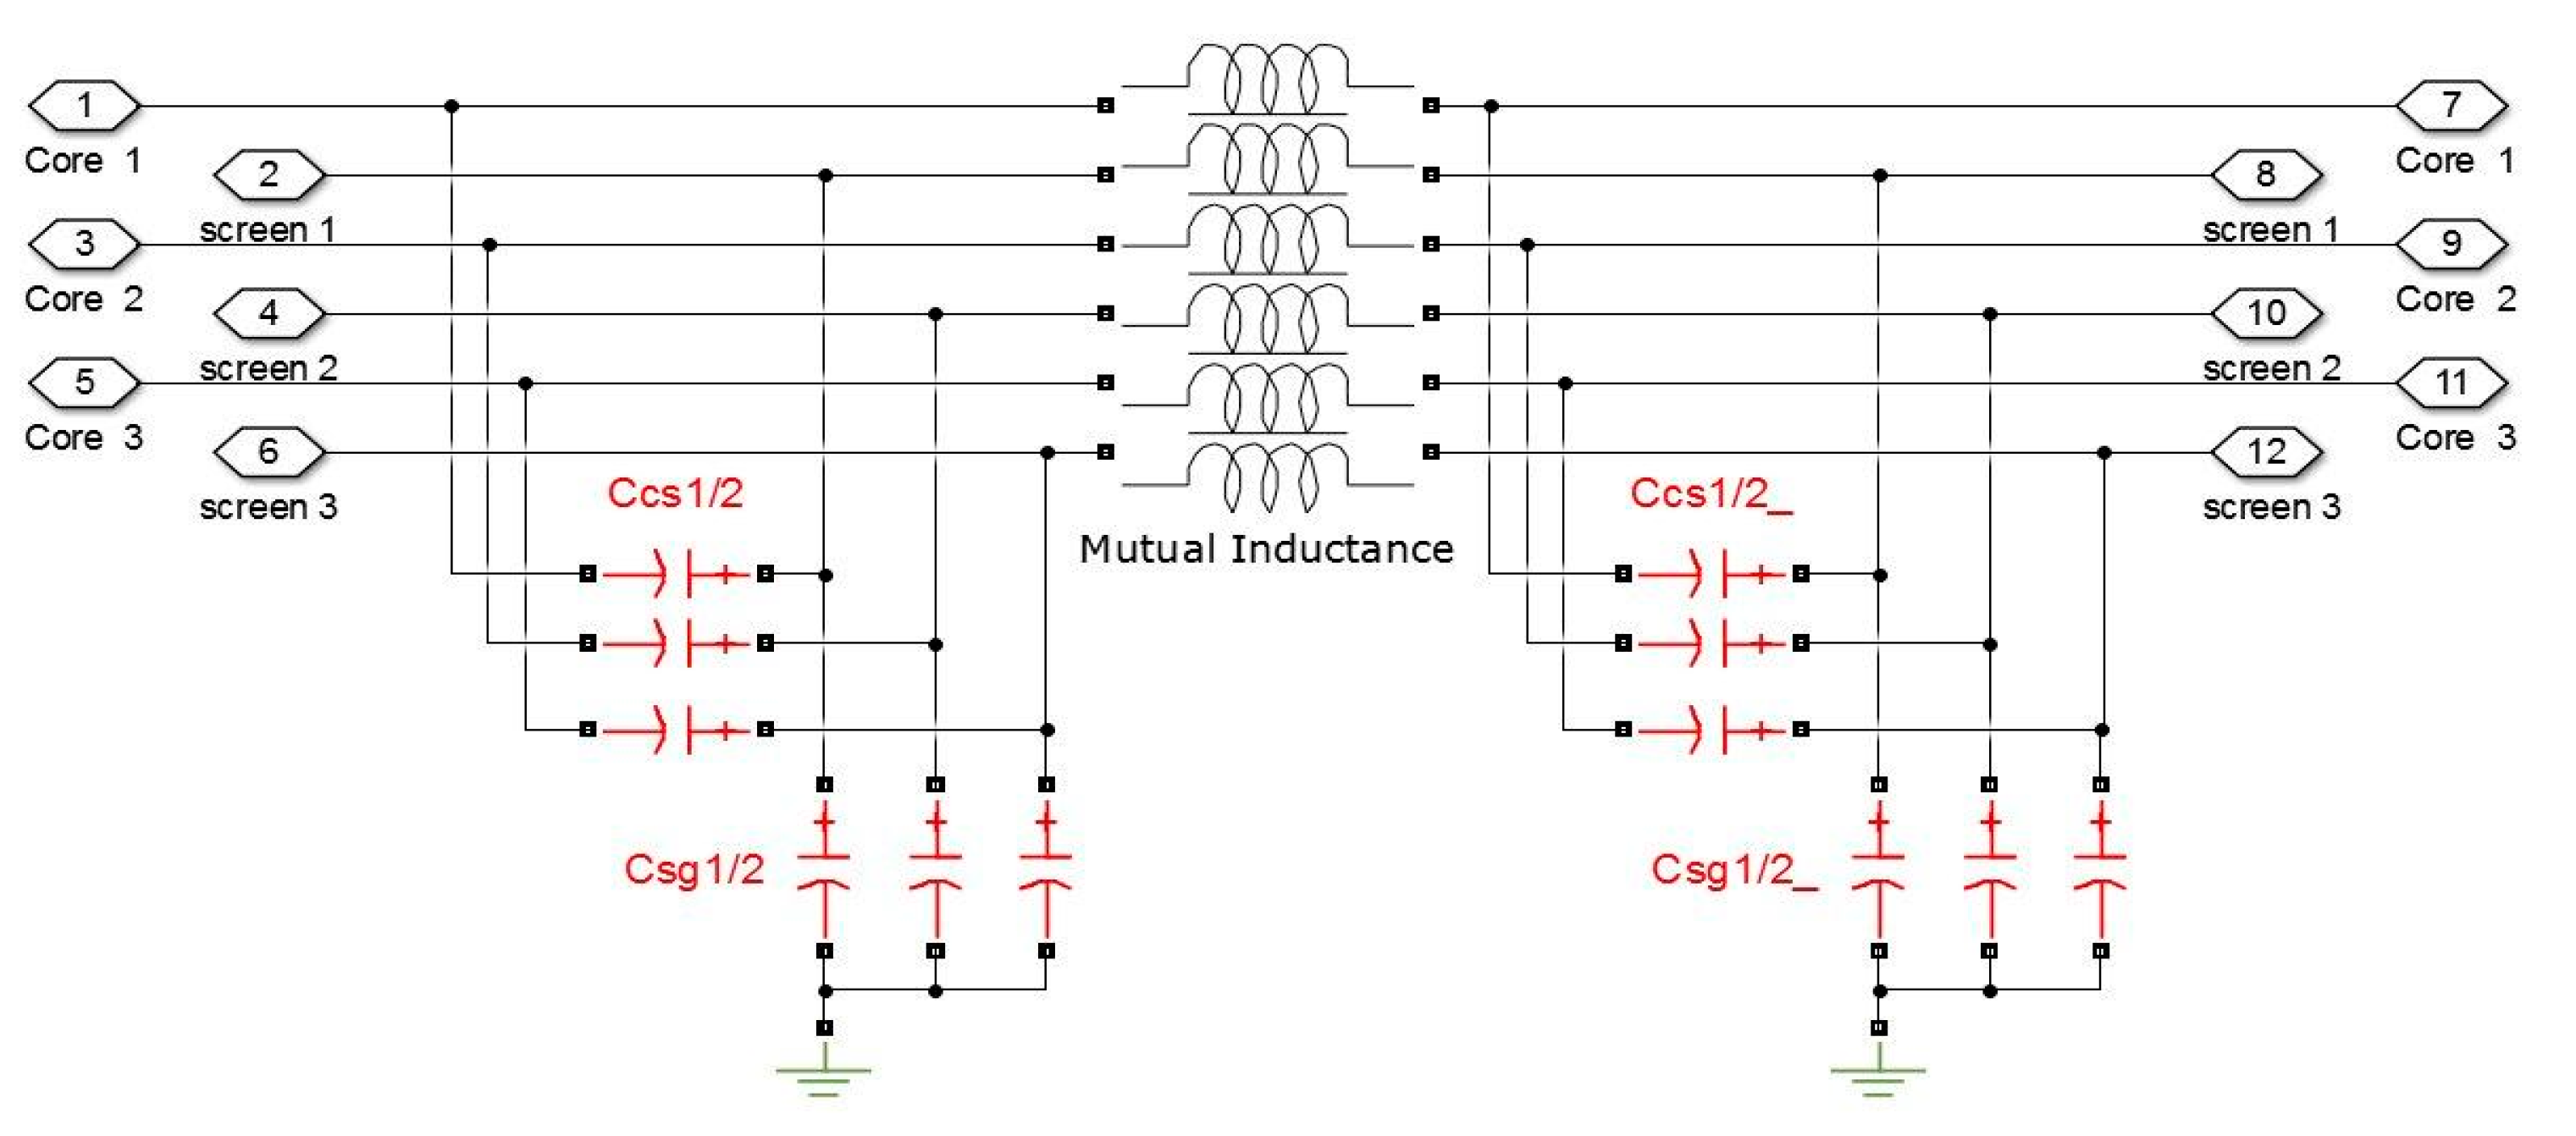
The obtained analytical values of the double line-to-screen fault current were verified by modeling in the MATLAB Simulink R2015b (MathWorks, Natick, MA, USA) (see
Figure 5) using a common model of cable power line. The model was built considering the mutual inductances of the cores and screens of the cable power line. The impedance of the grounding devices were taken to be 10 Ω. The internal structure of block “3 Cable with screen” is shown in
Appendix B.
The parameters for the model of the cable power line with used cable type 3×NA2XS(FL)2Y 1×400/35 were obtained by formulas in
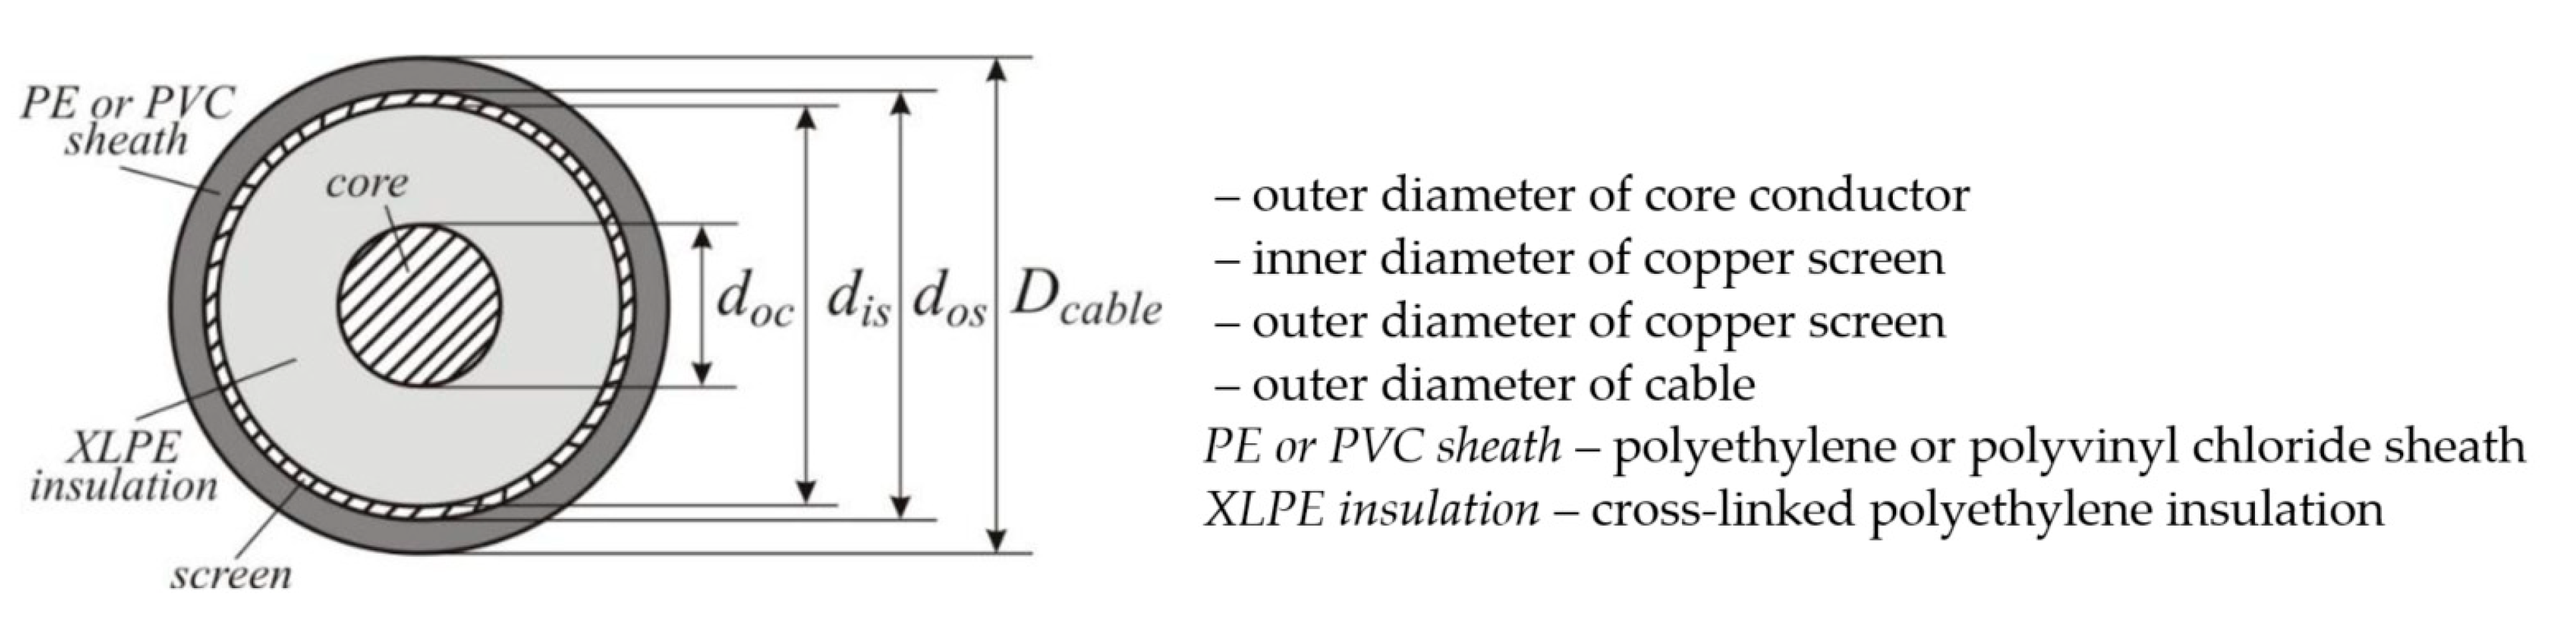
Appendix C. For this type of cable dimensions (see
Figure A3) are
mm,
mm,
mm,
mm; self-resistances of core and screen conductor are
Ω/km,
Ω/km. For the earth resistivity
Ω·m and frequency
Hz, self- and mutual inductances were obtained:
mH/km,
mH/km,
mH/km,
mH/km. These dimensions of the cable layers are not included in the catalogs of cable manufacturers, that is why they are not known to engineers. As a result, it is difficult to use this calculation in real life.
For the XLPE core-screen insulated () and PE screen-earth insulated () the capacitance between the core and screen F/km and capacitance between the screen and earth F/km.
Figure 5 shows that the currents in the three screens of cables during the double line-to-screen fault are 4.214 kA, 4.38 kA, 4.22 kA, which almost coincides with the value obtained analytically—4.24 kA. This confirms the adequacy of the proposed principle of analytical calculation of the current through the screen(s) of cables during a double line-to-earth fault. However, it is necessary to analyze in detail the error of calculation for other cable power lines parameters.
6. Results of Analysis of Calculation Accuracy of the Current
Here we analyze the accuracy of our simplified analytical method. We calculate the relative error from the simulation based on the common model of the power line as:
where
—cable screen currents in
i-phase (
L1,
L2 and
L3) obtained using the simulation in MATLAB Simulink;
—cable screen currents obtained using the proposed simplified analytical method.
Figure 6a shows the dependence of the error δ on cable screen cross-section from 16 to 35 mm
2. The dependence was plotted for the cable mentioned above with length 1 km and core cross-section 400 mm
2 and was added a range of error variation when changing length of cable line from 0.5 to 2.5 km. In the figure it is shown relative error of current calculation in screen
L1 (red),
L2 (blue) and
L3 (green). From the figure it is seen that for the proposed simplified analytical method the error does not exceed 6.3% (this maximum value of error is for the case of the maximum cross-section of the cable screen which is applied in WPPs and maximum length). Generally, on the real WPPs the WTGs are located with distance from 0.5 to 1 km and the calculated cable screen cross-section of one line is 25 mm
2. In this case of real WPPs the maximum error will be only 3.3%. However, the error can be different other core cable cross-sections.
Figure 6b shows the dependence of the error δ on cable core cross-section from 70 to 400 mm
2. The dependence was plotted for above cable with length 1 km and cable screen cross-section 25 mm
2 and was added a range of error variation when changing cable screen cross-section from 16 to 35 mm
2. From the figure it is seen that the error almost does not depend on the cable core cross-section.
As we can see for real WPPs the error will be smaller than 4.0 %. This allows to apply the proposed principle of analytical calculation to calculate the maximum current in the screen of cable during a double line-to-earth fault.
Generally, it is difficult for engineers to consider all factors that influence the current. Additionally, the calculation becomes complicated if it takes into account sources on both sides. As a rule, real calculations are made ignoring the smaller power source (highly simplified method). Therefore, we conducted research on the error of this method.
The ratio of the symmetrical three-phase fault currents on the buses of each of the sources (WTGs)
and
has the greatest influence on the value of the calculated current. Analysis of the values of symmetrical three-phase fault currents on the buses of 10–35 kV electrical power networks in Ukraine (
) and similar fault currents on the buses of wind turbine groups (
) showed that the ratio of currents
is within the range from 3 to 10. Therefore, we plotted the dependence of the ratio between the value of the calculated current obtained using the simulation in MATLAB Simulink and highly simplified method (with two and one source
) only for this range of
(
Figure 7).
Figure 7 also shows the domain in which
will change with the change in other parameters: the length of power line (from 0.5 to 2.5 km), cable screen cross-section (from 16 to 35 mm
2) and cable core cross-section (from 70 to 400 mm
2).
From the chart shown in
Figure 7, it can be seen that the error of calculation will be in the range from 33 to 10 %. The domain of variability of
is narrow.
This indicates the need to take into account the second source when calculating the double line-to-screen fault current in order to further select the cable screen.
Based on the above, we can recommend to use the highly simplified method which takes in account only one source (the most powerful). However, the result of calculation should be multiplied on the ratio
from the chart in
Figure 7. In this case engineers have to calculate the ratio of the symmetrical three-phase fault currents on the buses of each sources
and use this value to find
from the chart in
Figure 7.
7. Conclusions
The objective of this paper was to improve the accuracy of calculation the cross-section of cable screen in a medium voltage collector network with isolated neutral used in wind power plants. Currently in real setting a highly simplified method is used which leads to large errors. To avoid the negative effects of such errors, project engineers have to choose a larger cross-section of the cable screen using an expert method. Thus, the selected cross-section of the cable screen is often several times larger than the required cross-section. This leads to an increase in the cost of the WPPs cable networks.
The results obtained in this paper can be summarized as follows:
The simplified analytical method was proposed for calculating cable screen current during double line-to-earth fault on a cable line section of a medium voltage network with isolated neutral of a wind power plant. The advantage of the proposed method is that the method uses open data from catalogs of cable manufacturers. In contrast, the common model requires the dimensions of XLPE-cable layers which are hidden;
Results of calculation of the proposed simplified method were compared with the simulation results of a common model of cable power line that takes into account self- and mutual inductances of the cores and screens in different phases. It is shown that for parameters of the real WPPs (the length of section power line 0.5–2.5 km, cable screen cross-section 16–25 mm2 and cable core cross-section 70–400 mm2) the maximum error of the proposed method will be smaller than 4.0%. This allows to use the proposed method for design;
The analysis of calculation results of a highly simplified method (which is currently used in practice) shows that its relative error can be in the range from 10 to 33% from the common model simulation results. It was shown that the error of calculation is little dependent on the cable line parameter of the real WPPs (the length of section, screen and core cross-section of cable line) but the error is highly dependent on the ratio of the symmetrical three-phase fault currents on the left and right side of cable power line section. Therefore, to simplify the calculation in practice we obtained dependence which allows to correct the results of the highly simplified method. We recommend to use this method only with the correction according to
Figure 7.
Author Contributions
Conceptualization, R.B. and M.Q.; methodology, H.A.A. and R.B.; validation, M.Q., H.A.A., A.K., O.M. and V.B.; formal analysis, R.B.; investigation, R.B.; resources, R.B.; writing—original draft preparation, R.B.; writing—review and editing, R.B. and V.B. All authors have read and agreed to the published version of the manuscript.
Funding
This research received no external funding.
Institutional Review Board Statement
Not applicable.
Informed Consent Statement
Not applicable.
Data Availability Statement
The data presented in this study are available on request from the corresponding author.
Conflicts of Interest
The authors declare no conflict of interest.
Appendix A
To control the power supplied by the generator, the method of changing the angle of the generator EMF relative to the EMF of the external grid can be used. We analyzed the effect of the angle on the screen current during double line-to-screen fault.
Dependencies of the double line-to-screen fault current
from the phase angle
between phase EMF of left and right sources are shown in
Figure A1.
Figure A1.
Dependence of the double line-to-earth fault current through the cable screen(s) from the phase angle φ between phase EMF of the left and the right sources ( kV; kA; ; kA; ; mm2; km).
Figure A1.
Dependence of the double line-to-earth fault current through the cable screen(s) from the phase angle φ between phase EMF of the left and the right sources ( kV; kA; ; kA; ; mm2; km).
Figure A1 shows that with an increase in the angle from 0 to 90 degrees, the current decreases. For other input parameters the shape of the curve will stay the same with the maximum at zero angle. This indicates that the calculation condition should be held for the angle equal to zero because the selection of cable screen cross-section should be done for case of maximum current.
Appendix B
In the MATLAB Simulink we created a model of cable power line with Mutual Inductance block (
Figure A2). This model takes into account the mutual inductance between cores and screens with earth return, capacitance between core and screen and the screen and earth.
Figure A2.
Model of cable power line.
Figure A2.
Model of cable power line.
Parameters of model is given by:
The parameters of the model of cable line are obtained by formulas in
Appendix C.
Appendix C
The appendix contains a description of the calculation of electrical cable power line parameters. To calculate these parameters, we have to know the geometric dimensions of the cable. Simplified image of the XLPE-cable structure is shown in
Figure A3.
Figure A3.
Simplified image of the XLPE-cable layers structure.
Figure A3.
Simplified image of the XLPE-cable layers structure.
However, real dimensions of the XLPE-cable layers are hidden for the engineers and are not included in the catalogs of cable manufacturers. So, it is difficult to use this calculation in real life.
The self-inductance of a cable core conductor can be obtained from the formula [
21]:
where
is the permeability of free space (or air) equals to
H/km;
is the depth of equivalent earth return conductor is given by
in meters;
is the earth resistivity in Ω·m;
is the current frequency in Hz.
The self-inductance of a copper screen:
The mutual inductance between core or screen with earth return, is given by:
where
GMD is the geometric mean distance between the two conductors, e.g., the
GMD between the core and the screen of cable is given by:
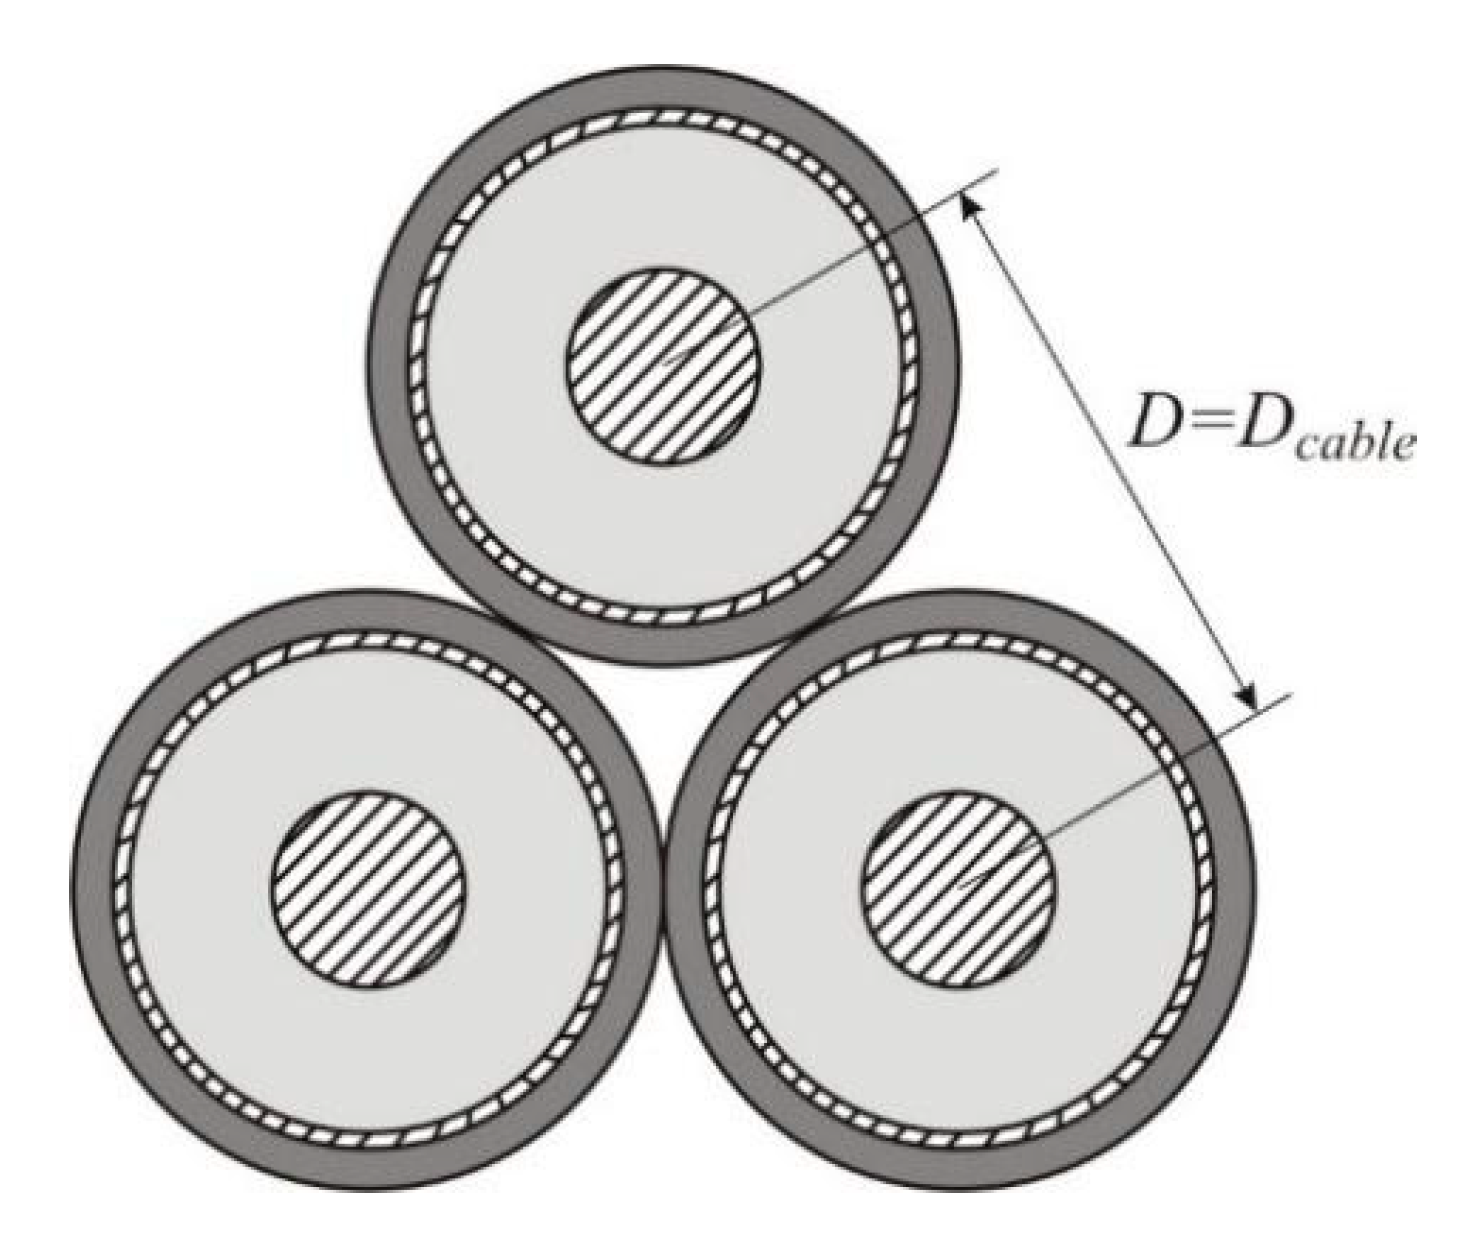
To calculate mutual inductances, we should choose the type of three single-core cable layouts. In our case the trefoil formation layout is chosen (see
Figure A4).
Figure A4.
Single-core cable in the trefoil formation.
Figure A4.
Single-core cable in the trefoil formation.
The mutual inductance between core and other core (core and screen) with earth return, is given by:
where
is the
GMD between the centers of cables. For a trefoil formation cable power line
.
The capacitance between the core and screen is given by:
Similarly, the capacitance between the screen and earth is given by:
where
and
are the relative permittivities of core-to-screen and screen-to-earth insulation.
References
- Nadour, M.; Essadki, A.; Nasser, T. Improving low-voltage ride-through capability of a multimegawatt DFIG based wind turbine under grid faults. Prot. Control. Mod. Power Syst. 2020, 5, 33. [Google Scholar] [CrossRef]
- Tummala, A.S.L.V. A robust composite wide area control of a DFIG wind energy system for damping inter-area oscillations. Prot. Control. Mod. Power Syst. 2020, 5, 25. [Google Scholar] [CrossRef]
- Semków, M. Optimisation of Cable Cross in Medium Voltage Networks of a Wind Farm. Acta Energetica 2013, 17, 132–138. [Google Scholar] [CrossRef]
- Wang, L.; Wu, J.; Tang, Z.; Wang, T. An Integration Optimization Method for Power Collection Systems of Offshore Wind Farms. Energies 2019, 12, 3965. [Google Scholar] [CrossRef]
- González, J.S.; Payán, M.B.; Santos, J.M.R.; González-Longatt, F. A review and recent developments in the optimal wind-turbine micro-siting problem. Renew. Sustain. Energy Rev. 2014, 30, 133–144. [Google Scholar] [CrossRef]
- Quinonez-Varela, G.; Ault, G.; Anaya-Lara, O.; McDonald, J. Electrical collector system options for large offshore wind farms. IET Renew. Power Gener. 2007, 1, 107. [Google Scholar] [CrossRef]
- Pillai, A.; Chick, J.; Johanning, L.; Khorasanchi, M.; De Laleu, V. Offshore wind farm electrical cable layout optimization. Eng. Optim. 2014, 47, 1689–1708. [Google Scholar] [CrossRef]
- González, J.S.; Gonzalez-Rodriguez, A.G.; Mora, J.C.; Payán, M.B.; Santos, J.R. Overall design optimization of wind farms. Renew. Energy 2011, 36, 1973–1982. [Google Scholar] [CrossRef]
- Buinyi, R.; Krasnozhon, A.; Zorin, V.; Kvytsynskyi, A. Justification for use of voltage class 20 kv in urban electrical networks. Tekhnichna Elektrodynamika 2019, 2019, 68–71. [Google Scholar] [CrossRef]
- Krasnozhon, A.V.; Buinyi, R.O.; Pentegov, I.V. Calculation of active power losses in the grounding wire of overhead power lines. Tekhnichna Elektrodynamika 2016, 2016, 23–25. [Google Scholar] [CrossRef]
- Grinchenko, V.S.; Tkachenko, O.O.; Grinchenko, N.V. Improving calculation accuracy of currents in cable shields at double-sided grounding of three-phase cable line. Electr. Eng. Electromechanics 2017, 2, 39–42. [Google Scholar] [CrossRef]
- Li, L.; Yang, Z.; Luo, Z.; Liu, K. Transient Disturbances Based Non-Intrusive Ageing Condition Assessment for Cross-Bonded Cables. IEEE Access 2020, 8, 176651–176660. [Google Scholar] [CrossRef]
- IEEE Guide for Bonding Shields and Sheaths of Single-Conductor Power Cables Rated 5 kV through 500 kV; IEEE Std 575-2014 (Revision of IEEE Std 575-1988); IEEE: New York, NY, USA, 2014; pp. 1–83. [CrossRef]
- Bezruchko, V.M.; Buinyi, R.O.; Strogii, A.Y.; Tkach, V.I. Application of GSM technology for identification of phase-to-ground faults in electric networks with isolated neutral and pin-type isolation. Tekhnichna Elektrodynamika 2018, 2018, 96–99. [Google Scholar] [CrossRef]
- Electrical Installation Regulations; Fort: Kharkiv, Ukraine, 2017; 760p.
- SOU-N MEV 40.1-37471933-49:2011. Design of Cable Power Lines with Voltage up to 330 kV. Requirements (with Changes 2017); Ministry of Energy of Ukraine: Kyiv, Ukraine, 2017; 168p.
- Vogelsang, R.; Sekula, O.; Nyffenegger, H.; Weissenberg, W. Long-Term Experiences with XLPE Cable Systems up to 550 kV. 9th CIGRE CIRED Conference 2009 (SC B1, Kranjska Gora, Slovenia). Available online: https://silo.tips/download/long-term-experiences-with-xlpe-cable-systems-up-to-550-kv#modals (accessed on 10 March 2021).
- IEC 60909-0. Short-Circuit Currents in Three-Phase a.c. Systems-Part 0: Calculation of Currents; International Electrotechnical Commission (IEC): Geneva, Switzerland, 2001; p. 137. [Google Scholar]
- Charles, K.; Matthew, N. Fundamentals of Electric Circuits, 5th ed.; Mc Graw Hill: New York, NY, USA, 2013; 995p. [Google Scholar]
- Official Site of NEXANS Group. Available online: https://www.nexans.ua/ (accessed on 10 March 2021).
- Tleis, N. Power Systems Modelling and Fault Analysis: Theory and Practice, 1st ed.; Newnes: Oxford, UK, 2008; 650p. [Google Scholar]
| Publisher’s Note: MDPI stays neutral with regard to jurisdictional claims in published maps and institutional affiliations. |
© 2021 by the authors. Licensee MDPI, Basel, Switzerland. This article is an open access article distributed under the terms and conditions of the Creative Commons Attribution (CC BY) license (https://creativecommons.org/licenses/by/4.0/).


 ,
, 


