1. Introduction
The key economic decision related to economic activity development is the determination of production scale. The goal of each enterprise is to determine the activity size that will allow it to maximize profit and to produce cheaper than its competitors. As the size of a business increases, there may appear to be increasing, constant, and decreasing returns to scale. Their source is the changing dependencies between the increases in production factor inputs and outputs. Long-term average production costs have a direct relationship with the variable returns of the production scale. Then, economies of scale occur when, along with the development of the activity, the long-term average production cost decreases. Conversely, diseconomies of scale appear when production development is accompanied by an increase in the unit cost of production.
In the transport industry, economies of scale are characterized by a significant diversification in terms of type and possible effects. In transport, there are three types of economies of scale [
1], namely:
Related to the increase in the size of transport means (economies of vehicle size).
Resulting from the development of the production capacity of a transport enterprise in the form of an increase in the number of rolling stock/fleet (economies of fleet size).
Combined with the spatial expansion of a transport network served by a carrier be-cause of new connections and/or covering additional transport nodes (economies of network size).
Their effects can be studied in relation to the means of transport (plant level) and/or transportation enterprise (firm size level) [
2]. Economies of scale can also be considered in relation to the development of transport infrastructure and of the unit cost of increased capacity.
In maritime transport, economies of scale are studied primarily in terms of the increasing sizes of sea-going vessels (economies of vessel size) [
2,
3]. The sizes of sea-going vessels are classified according to the deadweight (as abbreviated to DWT, or dwt), which is a measure of how much weight a ship can carry, and/or in the case of vessels for the transport of containers according to the number of equivalent twenty-foot containers (TEUs) they can transport at one time. Here, economies of scale refer to a situation where unit costs (i.e., cost/dwt, or cost/TEU), in other words, the costs relevant to pricing and competitiveness, decline as ship size increases [
4].
The dry bulk shipping sector is engaged mainly in the transportation of raw materials and energy goods, such as coal, iron ore, and grains. As such, dry bulk shipping uses large and unsophisticated ships, such as bulk carriers to transport goods in bulk (i.e., in an unpacked from) on a contract basis (the so-called charter party). The industry is highly competitive, with freight rates fluctuating widely even over a single week [
4]. The foundation of bulk shipping lays mainly in the concept of economies of scale. Economies of scale in bulk carriage by sea are substantial and refer to bulk carriers over a vast size range [
5,
6].
In dry bulk shipping, there is an increase in the average deadweight of bulk carriers (in particular, groups of ship sizes) and in the importance of larger ships in the world fleet structure. In 2014, the world fleet of dry bulk ships numbered 10,886 units, with a total deadweight of 794.9 million dwt. The average deadweight of a bulk carrier in service was 73,020 dwt in 2014. The expansion of the bulk carrier fleet over the past decade has been largely due to the introduction of large Capesize (+100,000 dwt) and Panamax (+60,000 dwt) ships in operation. They are mainly employed for the ocean transport of cargoes from the major bulk group, which consists of iron ore, coal, grains, phosphates, and bauxite/alumina. In terms of deadweight, the largest ships of the Capesize class (40.6% of the total tonnage of the bulk carrier fleet) and Panamax ships (25.7%) dominate the world fleet of bulk carriers. Ships with a deadweight in the range from 40,000 to 60,000 dwt (Handymax/Supramax) make up 21.8% of the total tonnage [
7]. The share of Handysize ships with a deadweight of up to 40,000 dwt in the global tonnage of bulk carriers is 11.8%. Among Handysize bulk carriers, the largest ships are in the capacity range of 30,000–40,000 dwt. It is expected that their share in the total tonnage of the global Handysize fleet will increase soon [
8]. They currently find employment primarily in the short- and medium-range transport of cargo from the minor bulk group, which includes fertilizers, agriproducts, dry chemicals, steel products, forest products, cement, and other products.
The liner shipping sector is nowadays dominated by container shipping, being involved in transportation of final and semi-final goods. Container shipping is geared to the provision of regular service between specific ports according to timetables and processes advertised in advance [
9].
At the beginning of 2020, the global fleet of cellular container ships amounted to 5337 vessels, having a total capacity of 23.23 million TEU [
10]. The development of the container ship fleet is based on the continuous introduction of increasingly larger ships into service. In 2014, the average capacity of a container ship in the world fleet was 3444 TEU, while in 2020 it increased to 4352 TEU. Large container ships with a capacity above 2000 TEU operate in long-distance shipping on major transcontinental trade routes and collectively account for over 89% of the world’s container fleet capacity. The remaining 11% is made up of ships of sizes up to 2000 TEU, which are used in feeder services and in short sea shipping [
10].
Recently, there has been a spectacular growth in the size of container ships. The fleet of ultra large container vessels (ULCS), consisting of ships with a capacity of 10,000–18,000 TEU, has grown to 428 vessels and their share in the total capacity of the container fleet is now close to 25%. During 2015–2019, another 91 mega large container vessels (MLCV) with capacities from 18,000 to 23,000 TEU were put into operation.
If this trend remains consistent, 25,000 to 30,000 TEU ships will appear on the shipping market in the near future [
11].
This paper thus focuses on the key maritime transport problem of cost economies related to ship scale (size) and determines the relationships between the increase in the size of dry bulk carriers and container ships and the development of shipping costs under its various categories. The main research questions are:
How does the increase in dry bulk carriers and container ship size influence their full operating, other operating, capital, and fuel shipping costs?
How does the technology and regular or irregular service provision affect scale economies in shipping?
How does the economies of scale in terms of daily and unit shipping costs can be plausible estimated?
To answer these questions, several models of shipping daily and unit costs with respect to vessels size were derived by regression. Shipping cost economies are expressed in terms of the estimated elasticities of daily and unit shipping costs relative to vessel size, measured in deadweight tonnage. Furthermore, the developed models allow for the calculation of shipping costs for any bulk carrier and container ship sizes.
This manuscript contributes to the literature on sustainable maritime supply chains, given discussions about issues of energy consumption and savings in maritime industry [
12,
13], reduction of emissions in shipping [
14,
15], and sustainable developments of maritime logistics chains [
16,
17,
18,
19]. It also supplements advances in circular maritime supply chains [
20,
21].
The remainder of this paper is structured as follows.
Section 2 reviews the literature regarding economies of scale in shipping.
Section 3 discusses the materials and methodology. The measurements and research results for dry bulk shipping and container shipping costs are provided in
Section 4 and
Section 5, respectively, while
Section 6 discusses these results and draws conclusions.
2. Relevant Literature Review
Research on the economies of ship size can be broken down into three main areas:
Determining the effects that occur during the operation of a ship at sea and the performance of single and/or circular port-to-port voyages. These are the economies of shipping costs.
Determining the effects occurring in maritime transport, thus covering both the shipping costs and costs related to the ship’s stay in seaports. These are the economies of maritime transport costs.
Determining the optimal size of a sea-going vessel in the context of cost savings in maritime transport, as well as the effects occurring in sea–land transport and the supply chain.
Economies of scale are achieved from the operation of large ships and consist of a decrease in the cost of transporting a tone of cargo or a TEU by ship. Research related to the economies of the size of sea-going vessels mainly focus on the estimation of the elasticity of daily costs and its cost categories incurred by the ships during sea voyages. Values of elasticity below unity mean the existence of economies of scale (i.e., the singled-out categories of shipping costs grow less than proportional to ship size/deadweight, which means the existence of economies of scale). An elasticity value above unity means that shipping costs increase more than proportional to the deadweight of a sea-going vessel, indicating diseconomies of scale. In the first case, the daily shipping cost decreases with the increase in ship size and, in the second case, the daily shipping cost increases with the increase in the ship’s deadweight.
For tramp vessels, i.e., dry bulk carriers and tankers [
22], the elasticity indices for capital costs were 0.67, for operation costs without fuel 0.4, and for fuel 1.0. In the case of dry bulk carriers, the elasticity values for capital costs, operation costs (without fuel), and fuel costs were 0.7, 0.4, and 0.8, respectively [
6].
Recent studies on the economies of scale in bulk shipping concerned the determination of the optimal size of a bulk carrier for a specific port [
23], as well as the development of a ship-unit cost model for dry-bulk carriers [
24]. Research has moved towards determining the optimal bulk carrier size, a vessel being regarded as the optimal ship size from which its owner enjoys the minimum unit shipping costs. Changes in optimal ship size are strongly influenced by voyage length. For the dry bulk sector, the optimal ship size was determined to be 340,000 dwt [
25].
Research into economies of scale regarding bulk carriers is rare probably due to the following reasons:
In the case of bulk shipping, the disadvantages of scale are limited in seaports, as a flexible increase of transshipment efficiency is possible for larger vessels and, thus, the length of stay of large vessels in seaports is not critical in ensuring the cost-effectiveness of sea transportation.
The sizes of bulk carriers have been adapted to demand and shipment size, the ability to handle ships in ports, length of sea routes, and type of cargo transported (major and minor bulk).
However, multifaceted studies on the economies of scale in container shipping have developed dynamically. The literature is abundant and only selected issues are presented below. For example, in the works [
26,
27], daily capital cost is estimated to conform with the two-third power rule, whereas the size elasticities of operating cost and fuel cost are 0.43 and 0.72, respectively. Elasticities are estimated for different ship types (tankers, bulk carriers, and container ships) and vessel sizes.
For ocean transport and container ships ranging from 1000 to 8000 TEU, the elasticity indices of the unit cost shipping costs range from −0.42 to −0.20, the mean elasticity amounting to −0.25 [
28]. In studies on container ships in the 10,000–15,000 TEU and the 15,000–18,000 TEU size ranges [
29], the elasticities of unit costs of sea transport were respectively −0.25 and −0.35, which indicates economies of scale for mega container ships.
The analysis of the relationship between the cost savings of maritime transport and sea voyage distance shows that, on the longest shipping routes, container ships with sizes beyond 8000 TEU have a significant cost advantage over smaller container ships. Cost savings decrease as the number of served seaports increases [
30]. To maximize the economies of scale, the largest ships are employed on the longest sea routes.
There are also limitations to achieving economies of scale in container shipping. The capital cost savings are reduced once the ship exceeds 5000 TEU due to the increase in the costs associated with equipping large ships with more powerful marine engines and the higher steel consumption for the construction of large container ships. With the increase in the size of container ships, the possibilities of their flexible use on various trade routes decrease [
8,
31].
It is pointed out in the study [
32] that the size of ships results from demand volume and transport distance. Lower demand and the expectations of shippers regarding the high frequency of transport mean that smaller container ships are used on shorter transport routes. It was demonstrated [
33] the existence of benefits in terms of capital, fuel, and labor costs for ever-larger container ships. On the Europe–Far East routes, the elasticity of the unit cost of sea transport for container ships of 20,000 TEU is −0.35.
The size benefits of a container ship in terms of fuel consumption costs are large and, just as importantly, the savings increase as the vessel cruising speed increases [
34]. Large container ships can offer an appropriate frequency of voyages, and the operation of ever larger ships contributes to lowering average fuel costs and leads to an increase in the cost-effectiveness of shipping, even with an increase in ship speed.
The cost savings associated with the commissioning of ever larger ships primarily relate to shipping costs. The extent to which such benefits will affect the average costs of transporting cargo/containers for a sea voyage depends primarily on the degree of the ship’s deadweight/capacity utilization (i.e., the actual utilization of the ship’s capacity). In sea shipping, the cost benefits related to ship size are not reflected in the cost of transportation by sea when such assets are not adequately used for production [
35]. As such, economies of scale must be clearly distinguished from capacity utilization, as increasing capacity utilization spreads the fixed costs of existing facilities and personnel over large volumes, while economies of scale imply that an activity operating at full capacity is more efficient at a larger scale [
36].
Recently, the impact of economies of scale on costs at terminals has been considered [
37]. Examples of the impact of ship size on the costs related to sea access infrastructure, navigation services in seaports, and port fees are elaborated in [
38,
39]. The study [
40] includes an empirical analysis on ship deployment, capacity expansion, and the growth of ship size in container shipping.
Sea transport costs include sailing and transshipment costs. The decrease in the average shipping costs is greater the longer is a ship’s sea voyage (i.e., the shorter is the duration of its stay in ports). The stay of a ship in a port for loading/unloading of cargo is, in turn, an indispensable (unavoidable) component of each voyage, has a negative impact on the proportion of the vessel’s time at sea in relation to total port-to-port journey time; thus, it limits the possibility of deriving economies of scale related to the decrease in the average shipping costs of container ships of ever-increasing capacity. Therefore, there are diseconomies of scale in seaports that relate to the increase in vessel tonnage/capacity. The economies of scale obtained by a larger vessel during its sea voyage (i.e., the decrease in the unit operating cost) are diminished by the diseconomies of scale associated with the increasing cost of the time the ship spends in a port [
27,
41,
42].
Diseconomies of scale appearing in seaports result from the insufficient increase in the efficiency of transshipment of large container ships, which is in turn caused by [
4]:
Restrictions on the number of container cranes that can also be used to handle larger ships, as their length varies slightly with ship size.
Problems related to the coordination of transshipments in relation to the port hinterland as well as in the mega-container–smaller feeder ships system, availability of storage areas in port terminals, and increases in port congestion mainly on land transport connections.
The duration of a ship’s stay in port is the decisive factor for the employment of increasingly larger (tonnage) ships on shipping routes. The optimal size of a vessel for a given route is the one minimizing the total cost of sea transport [
43]. In this case, transport costs are the costs incurred by a ship at sea as well as in seaports. Under another approach, the optimal size of a ship is obtained by minimizing the sum of the unit cost for a sea trip and the unit cost of transshipment [
44]. The optimal size of a container ship is also the size that minimizes the cost of TEU transportation between two ports [
45]. For other researchers, the optimal ship size is determined by economies of scale [
8,
28,
30]. In the study [
27] it is emphasized that not only the costs incurred by the supplier of transport services (sea carrier) but also the ones incurred by the user (shipper, cargo recipient) should be considered. The optimal ship size is thus determined by the sum of the costs of the sea carrier and transport user. The costs of the supplier of the transport services are the costs of sea transport, while user costs are other logistic costs, including primarily the costs of storage. Employment of a larger vessel for transport when demand remains unchanged means fewer round trips. The time between consecutive trips becomes longer and, thus, the cost of storage increases for the transport user. Such relationships limit vessel sizes on many routes, as the employment of larger vessels leads to lower shipping costs per ship, while users face higher stock carrying costs due to the lower frequency of sailing. For the size of a ship, there are cost savings for sea shipping and cost disadvantages associated with the limited number of circular voyages [
33]. Therefore, the optimal ship size is determined by the minimum total costs incurred by the service provider and transport user.
When determine the optimal size of a ship in the context of minimizing the cost of sea transport of one TEU [
46], it was found that the economies of scale lose importance for a container ship size of around 12,500 TEU. The optimal size of a container ship covers the range of ship sizes within which such an optimum locates. The optimal size of a vessel is thus not only determined by the cost-effectiveness achievable by larger vessels but also by other factors, such as the frequency of voyages, number of ports served, and demand size. Limitations for the development of container ship sizes include the size of demand, port capacity, port transport accessibility and other logistics costs, and development of hub and spoke systems [
4].
The research [
47] is focused on the impact of larger container ships on the generalized costs of the sea–land transportation chain. Analysis covers the economies of scale originating at sea and the effects originating at seaports and in hinterland transport.
Recapitulating, few studies examine the elasticities of daily and unit shipping costs related to the size of dry bulk carriers. Moreover, it is necessary to update cost data, considering prior studies used historical cost data from the 1960s [
22] and the 1970s and 1980s [
6,
27]. Furthermore, tests were undertaken for various ship sizes and types (tankers, dry bulk carriers and container ships).
Recent studies on the container shipping industry concern relationships between shipping costs and costs related to a ship’s stay in seaports. They also focus on determining cost savings in sea–land transport and in the supply chain. However, such research is heavily dependent on studies of economies of container ship size, and the potential savings in shipping costs. It requires continuous empirical research to observe the effects of ever-growing container ship size on shipping cost.
The literature review reveals issues that require updating and researched intensively. Therefore, this study intends:
To measure daily and unit elasticities of shipping cost in relation to the size of dry-bulk carriers and container ships.
To develop daily and unit shipping cost models depending on the size of bulk carriers and container ships.
The aim of this manuscript is estimating the relationship between the growing size of dry bulk carriers and container ships and shipping costs, to gain an insight into the impact of technology and the way the services are provided (irregular versus regular) on shipping cost economies and develop models for daily and unit shipping costs by vessel size.
The cost advantages related to size of bulk carriers and container ships are established in two stages. In the first stage, the shipping cost per vessel/day is established for ships of different sizes measured in deadweight (dwt). Functional dependencies between daily shipping cost and ship size are determined. Elasticities are estimated for total shipping costs, as well as for the individual components of these costs. Based on the derived daily shipping cost function, it is possible to estimate the daily shipping costs for ships of various sizes (dwt). In the second stage, the shipping cost per ton-kilometer is calculated for vessels of various sizes and the functional dependencies of the unit shipping cost in relation to the size (deadweight) of a bulk carrier and a container ship determined. Elasticities of unit shipping costs in relation to ship size are also calculated. A unit shipping cost model is developed for bulk carriers and container ships of all sizes.
In sum, the main contributions of the article to the literature consist of estimating the elasticities of daily and unit shipping costs by their operating categories in relation to the increasing scale (size) of dry bulk carriers and container ships, and the development of daily and unit shipping cost models for bulk carriers and container ships.
3. Data and Methods
The analysis covers the shipping costs incurred by ships during a sea voyage in the port–port relationship. Shipping costs include [
8]:
Operating costs (manning, stores and lubricants, repairs and maintenance, insurance, administration).
Voyage costs, in our study limited to cost of fuel consumption.
Capital costs (capital repayments and interest).
The daily shipping cost (EUR/day) is defined as:
where:
DSC denotes the daily shipping cost;
DOC denotes the daily operating cost;
DVC denotes the daily voyage cost (fuel cost only);
DCC denotes the daily capital cost.
Data on the structure of the daily shipping costs of bulk carriers and container ships during operation were taken from [
38], who present the average daily shipping costs for selected groups of vessel sizes. The advantage of these data is that a detailed structure of daily shipping costs can be presented, being calculated for the average ship size in each group of ship sizes. The analysis is carried out for bulk carriers with guide deadweight of 25,000, 70,000, 85,000, and 155,000 dwt (
Table 1) and for container ships with guide deadweight of 7308, 18,270, 66,991, 103,532, and 133,982 dwt (
Table 2).
The shipping costs of a bulk carrier mainly include marine fuel and capital costs (instalments and interest on capital for financing the purchase of ships). Together, they account from 80.0% for Handysize to 82.1% for Capesize of the daily shipping costs. The personnel costs related to ship manning decrease in importance as the size of the ship increases and, in relation to total cost, they range from 6.5% for Handysize to 5.6% for large Capesize bulk carriers. The shares of the other costs by type in the total costs of operating bulk carriers do not show any significant changes in relation to ship size.
The shipping costs of a container ship mainly include marine fuel and capital costs (instalments and interest on the capital for financing the purchase of ships). Together, they account for 78.4% to 88.1% of the total shipping costs for small and large ships. As the size of a container ship increases, there are significant changes in cost structure. Namely, the share of fuel costs decreases from 54.2% for small container ships to 43.9% for large ships, while the share of capital costs for small and large ships increases from 24.2% to 44.2% of the total shipping costs. The increase in container ship size leads to a decrease in manning and ship administration costs, for small and large container ships their shares vary respectively from 9.6% to 2.9%, and from 3.1% to 1.2% in the total costs of ship operation. Other types of container ship shipping costs (insurance, repairs and overhauls, supplies, and oils) do not show significant (relative) changes for different container ship sizes.
The function of the daily shipping costs with respect to bulk carrier and containership size (dwt) is derived by regression for the entire range of vessel sizes, while its parameters are estimated using ordinary least squares (OLS). Next, the elasticities of daily costs for main categories of shipping cost are estimated.
Ship size economies can also be expressed as a function of the unit shipping cost relative to vessel size [
27]. In the second part of the paper, the unit shipping cost for the selected sizes of bulk carriers and container ships per ton-kilometer is estimated. The calculations use the following assumptions [
48]:
Full use of the ship’s capacity (in tons of cargo).
Constant sailing speed for a given ship size; consequently, the travel distance (in km) that the ship can cover in a 24-h period is constant.
The guide ship size (dwt) for a given size range is assumed.
The unit shipping cost (EUR/tkm) is defined as:
where:
denotes the unit shipping costs;
denotes the daily shipping cost;
denotes the daily operating cost;
denotes the daily voyage cost (fuel cost only);
denotes the daily capital cost;
denotes the full cargo weight (tonne)/vessel;
denotes the maximum daily distance (km);
denotes speed (km/h, constant);
= S × 24 h.
The unit cost of performing a ton-kilometer for ships with guide deadweight is calculated as follows:
Using the cruising speed of a vessel; then, converting it from sea knots to a speed expressed in km/h established the maximum distance of a sea voyage that a vessel can cover in 24 h. The daily shipping cost is divided by the maximum voyage distance per day, whereby the cost of operating the ship per kilometer is obtained;
By dividing the operating cost accruing for one kilometer of a ship’s voyage by its full cargo weight in ton, the cost of one ton-kilometer for a vessel is calculated.
The operating cost data for bulk carriers and container ships were obtained for 2010 and they have been updated for 2019 by using the nominal GDP indexation of the EU-28 countries, which amounted to a 1.2807-fold overall increase.
The analysis of the total unit shipping costs for bulk carriers and for container ships is presented in
Table 3 and
Table 4.
The function of the shipping cost per ton-kilometer is derived by regression for the entire range of vessel sizes, while its parameters were estimated with OLS. Next, the elasticities for main categories of unit shipping cost are estimated.
4. Measurements and Results for Dry Bulk Shipping Costs
Based on the scatter plot, the relationship between the daily shipping cost of a bulk carrier to its deadweight can be described using the following power model:
where:
denotes the average daily shipping cost of the i-th bulk carrier size;
denotes the i-th size of bulk carrier expressed as guide deadweight (dwt);
are structural parameters of the model; and
is a random component.
Using statistical data for daily and unit shipping costs (
Table 1 and
Table 3) and inputs estimates for daily and unit shipping costs for dry bulk carriers (
Appendix A), the parameters for the daily cost model are estimated using the OLS method and the following model of the daily shipping cost is obtained [
7]:
where:
1117.5 is the estimate of the parameter of the cost model;
0.291 is the parameter , that is, the mean elasticity of the ship-day operation cost in relation to the i-th ship deadweight.
The parameters are statistically significant, and the standard errors are presented between parentheses. The mean value of elasticity of the daily shipping cost in relation to the growing size of dry bulk carriers is 0.291.
Based on the scatter plot analysis, a model for the individual types of daily costs takes the following functional form:
where:
denotes the m-th category of average daily shipping cost of the i-th bulk carrier size;
denotes the i-th bulk carrier size in terms of guide deadweight tonnage (dwt);
denotes an intercept parameter for the m-th cost category;
denotes the elasticity of the average daily shipping cost for the m-th cost category;
is a random component for the m-th cost category.
Using the model of the daily cost of dry bulk shipping in Equation (5), estimations for the (
C1i) other operating costs (manning, insurance, repairs and maintenance, stores and lube oil, administration), (
C2i) capital costs (capital repayments and interest), and (
C3i) fuel are calculated. The estimated results are presented in
Table 5, where parameter
is the mean elasticity of the
m-th category of daily shipping cost.
For other operating costs (labor cost included), capital, and fuel costs, elasticities are low, with respective values of 0.238, 0.329, and 0.285, meaning that cost economies are significant.
In the analysis, a unit cost model with the following functional form is adopted:
where:
is the average total unit shipping cost of the i-th bulk carrier size;
is the i-th size of bulk carrier expressed as guide deadweight (dwt);
b1, b0 are structural parameters of the model;
is a random component.
The model of the total unit cost for dry bulk shipping in relation to ship deadweight, derived by the regression and parameters estimated using the OLS method, is as follows:
where:
4.0881 is the estimate of parameter of the cost model;
−0.751 is the estimate of parameter that is, the mean elasticity of the average total unit shipping cost in relation to the i-th ship deadweight tonnage (dwt).
The mean value of elasticity of the total unit shipping cost in relation to growing size of dry bulk carrier is (−0.751).
This study uses the following model of the unit cost of bulk shipping:
where:
is the n-th category of average unit shipping cost of the i-th bulk carrier size;
is the i-th size of bulk carrier expressed in terms of a guide deadweight (dwt);
is the intercept parameter for n-th cost category;
is the elasticity of the average unit shipping cost for n-th cost category;
is a random component for n-th cost category model.
The estimates are calculated for the following costs categories: (
c1i) other operating costs (manning, insurance, repairs and maintenance, stores and lube oil, administration), (
c2i) capital costs (capital repayments and interest), and fuel (
c3i). The estimated results of the model are presented in
Table 6, where parameter
is the mean elasticity of the
n-th category of the unit shipping cost.
Cost savings resulting from the increase in bulk carrier size exist for all unit shipping cost types. The greatest effects were obtained because of the decreases in other operating costs (−0.804), fuel costs (−0.757), and capital costs (−0.713).
5. Measurements and Results for Container Shipping Costs
The relation of the daily shipping costs of a container ship to its deadweight can be described by the following power model:
where:
Ki denotes the average daily shipping cost of the container ship;
DWTi denotes the i-th size of container ship expressed as guide deadweight (dwt);
are structural parameters of the model; and
Ui is a random component.
Using statistical data for daily and unit shipping costs (
Table 2 and
Table 4) and inputs estimates for daily and unit shipping costs for container ships (
Appendix B), the container ship-daily cost model derived by regression and with estimated parameters using OLS takes the following functional form [
7]:
where:
118.65 is parameter of the cost model;
0.552 is parameter , that is, the mean elasticity of the ship-day operation cost in relation to the i-th container ship deadweight.
The parameters are statistically significant, while the standard errors are presented between parentheses. The mean value of elasticity of the daily shipping cost in relation to the growing size of the container ship is 0.552.
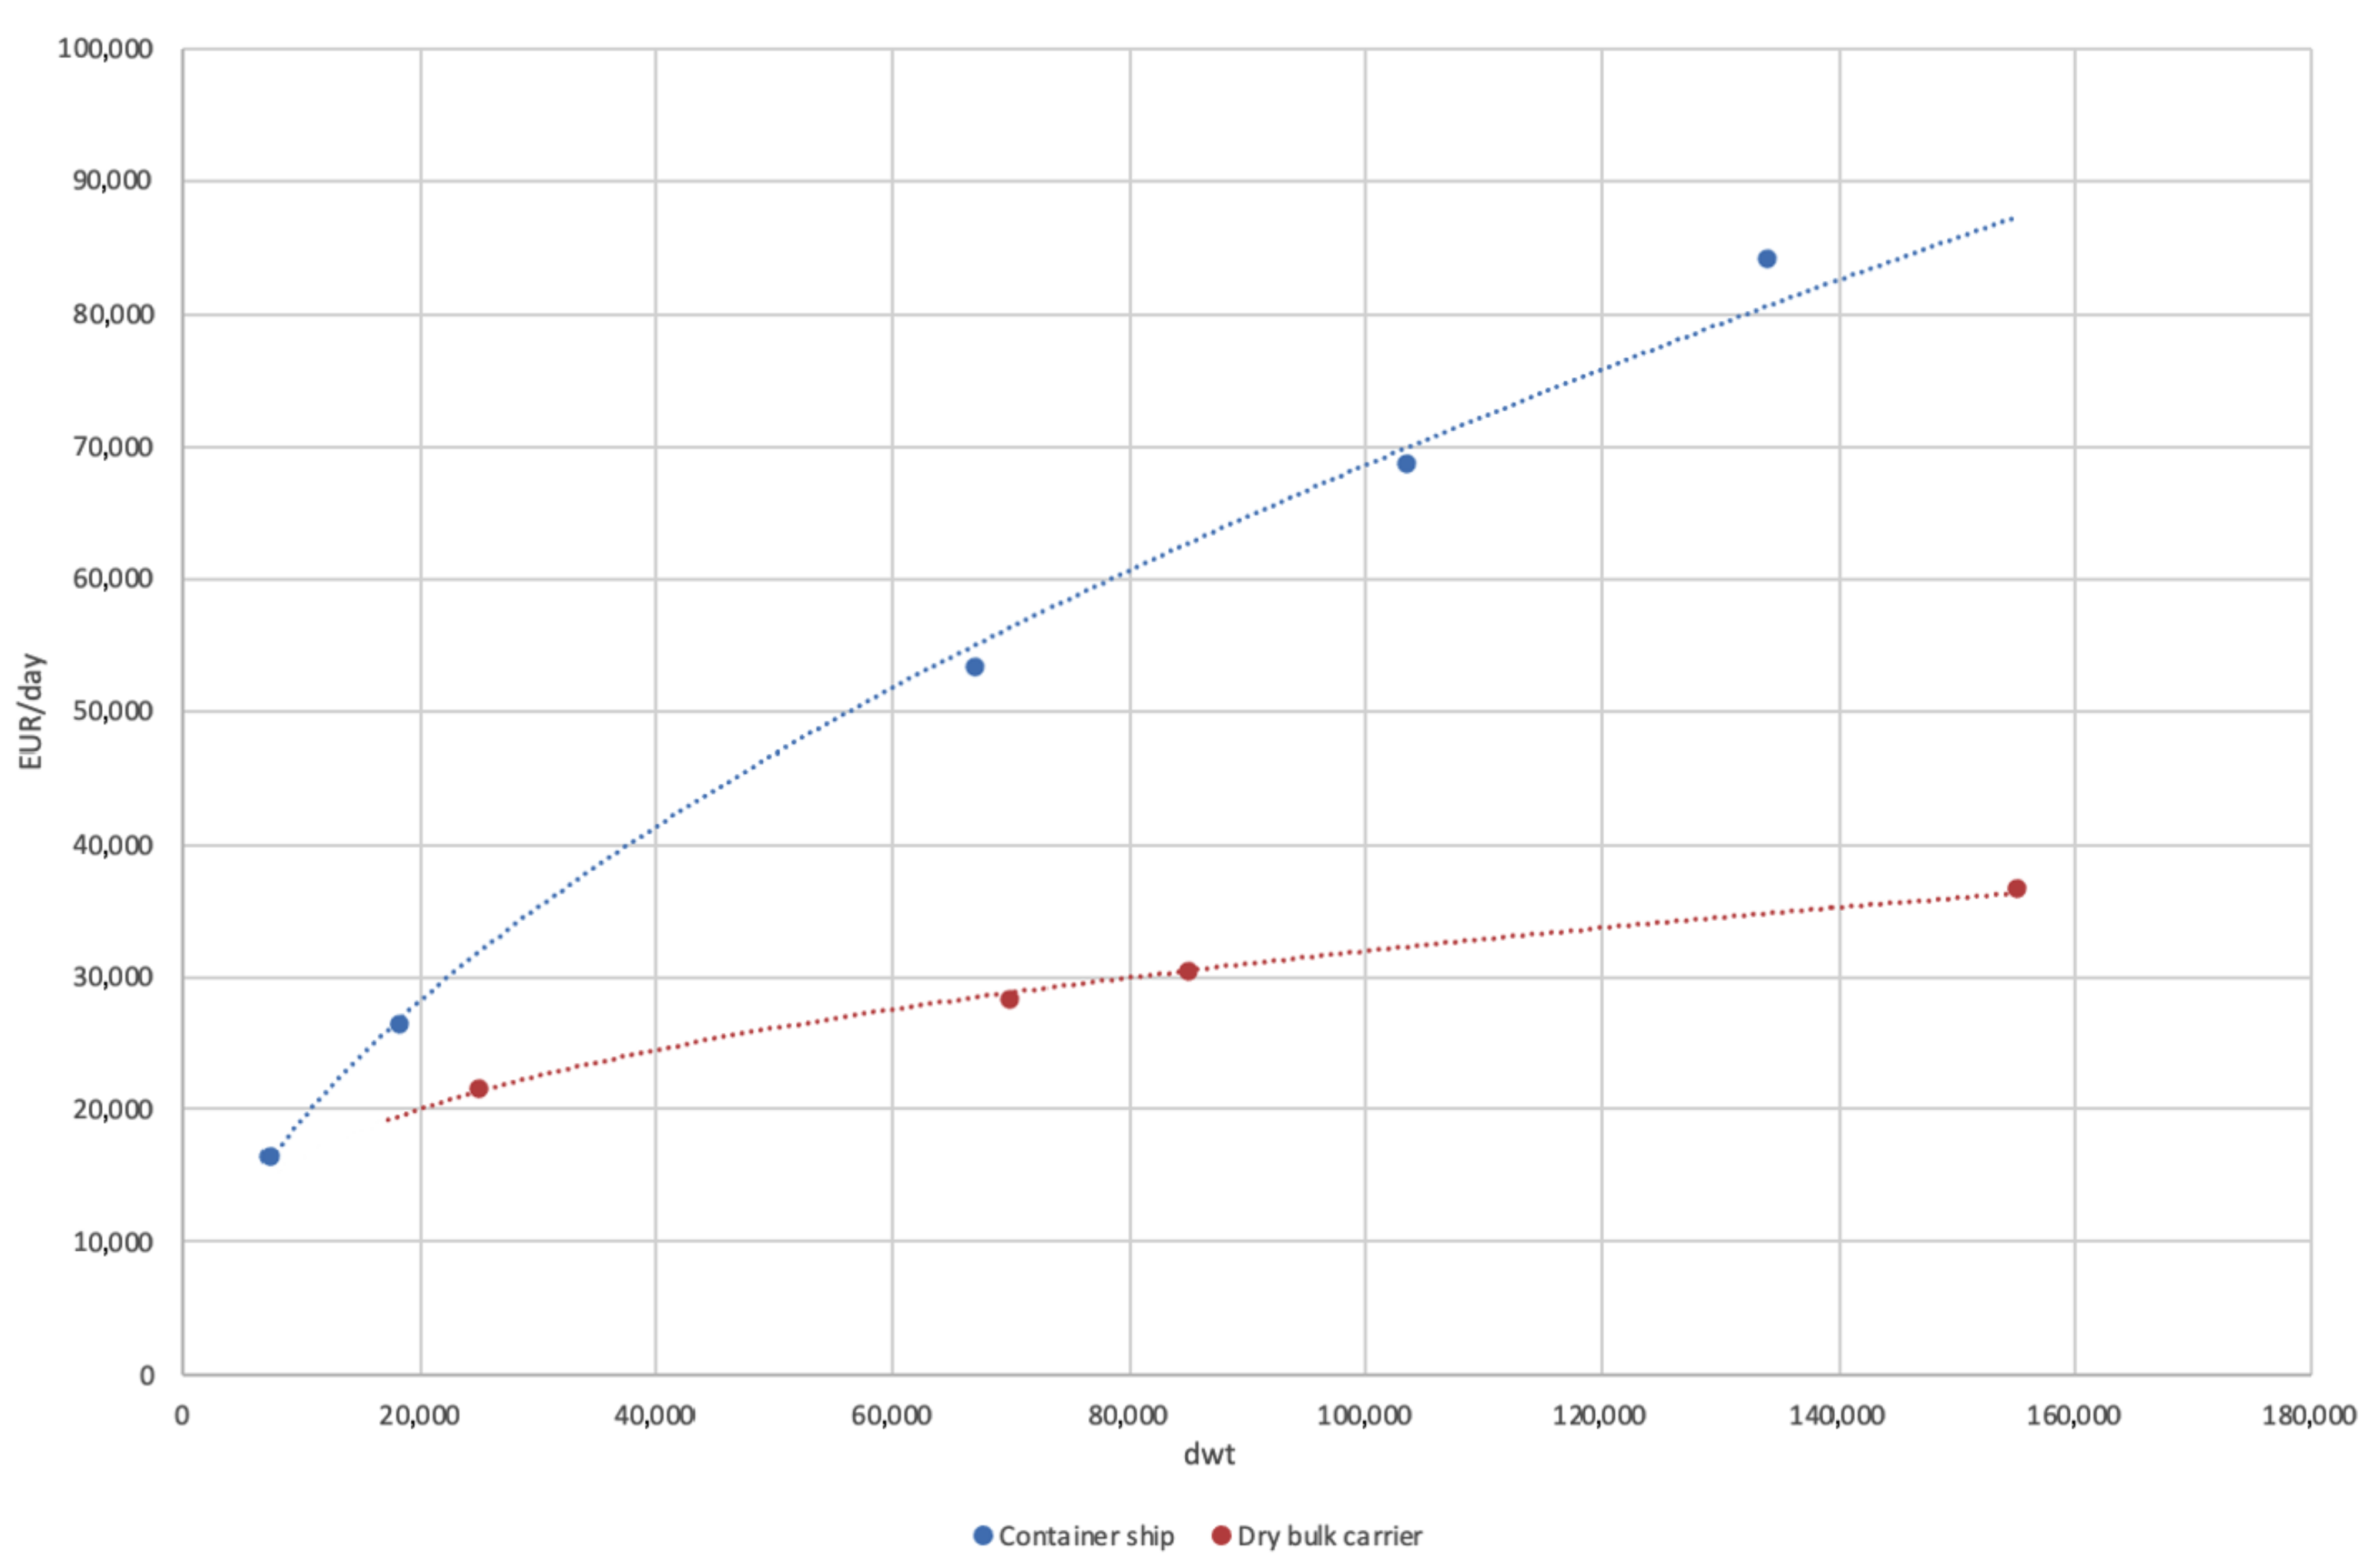
A comparison of the total daily costs for dry bulk and container shipping is depicted in
Figure 1.
For estimating the individual types of daily costs, the following functional form is applied:
where:
denotes the m-th category of average daily shipping cost of the i-th container ship size;
denotes the i-th container ship size in terms of the guide deadweight tonnage (dwt);
denotes an intercept parameter for m-th cost category;
denotes the elasticity of the average daily shipping cost for the m-th cost category; and
is a random component for the m-th cost category model.
Using the model of the daily cost of container shipping, estimations for the following cost categories are made: (
K1i) other operating costs (manning, insurance, repairs and maintenance, stores and lube oil, administration), (
K2i) capital costs (capital repayments and interest), and (
K3i) fuel costs. The estimated results are presented in
Table 7, where parameter
is the mean elasticity of the
m-th category of daily shipping cost.
For other operating costs (labor cost included), for capital, and fuel costs, the respective values amount to 0.382, 0.765, and 0.462, meaning that cost economies are substantial.
The relationship between the unit operating cost of a container ship and its deadweight has been described using the following power model:
where:
is the average total unit shipping cost of the i-th container ship size;
is the i-th size of container ship expressed as guide deadweight (dwt);
b1, b0 are structural parameters of the model; and
is a random component.
The model of the total unit cost for container shipping in relation to the ship deadweight, derived by the regression and parameters estimated with the OLS method, is given as follows:
where:
0.6512 is the estimate of parameter of the cost model;
−0.553 is the estimate of parameter that is, the mean elasticity of the average total unit shipping cost in relation to the i-th ship deadweight (dwt).
The value of elasticity of the total unit shipping cost with respect to container ship deadweight tonnage is (−0.553).
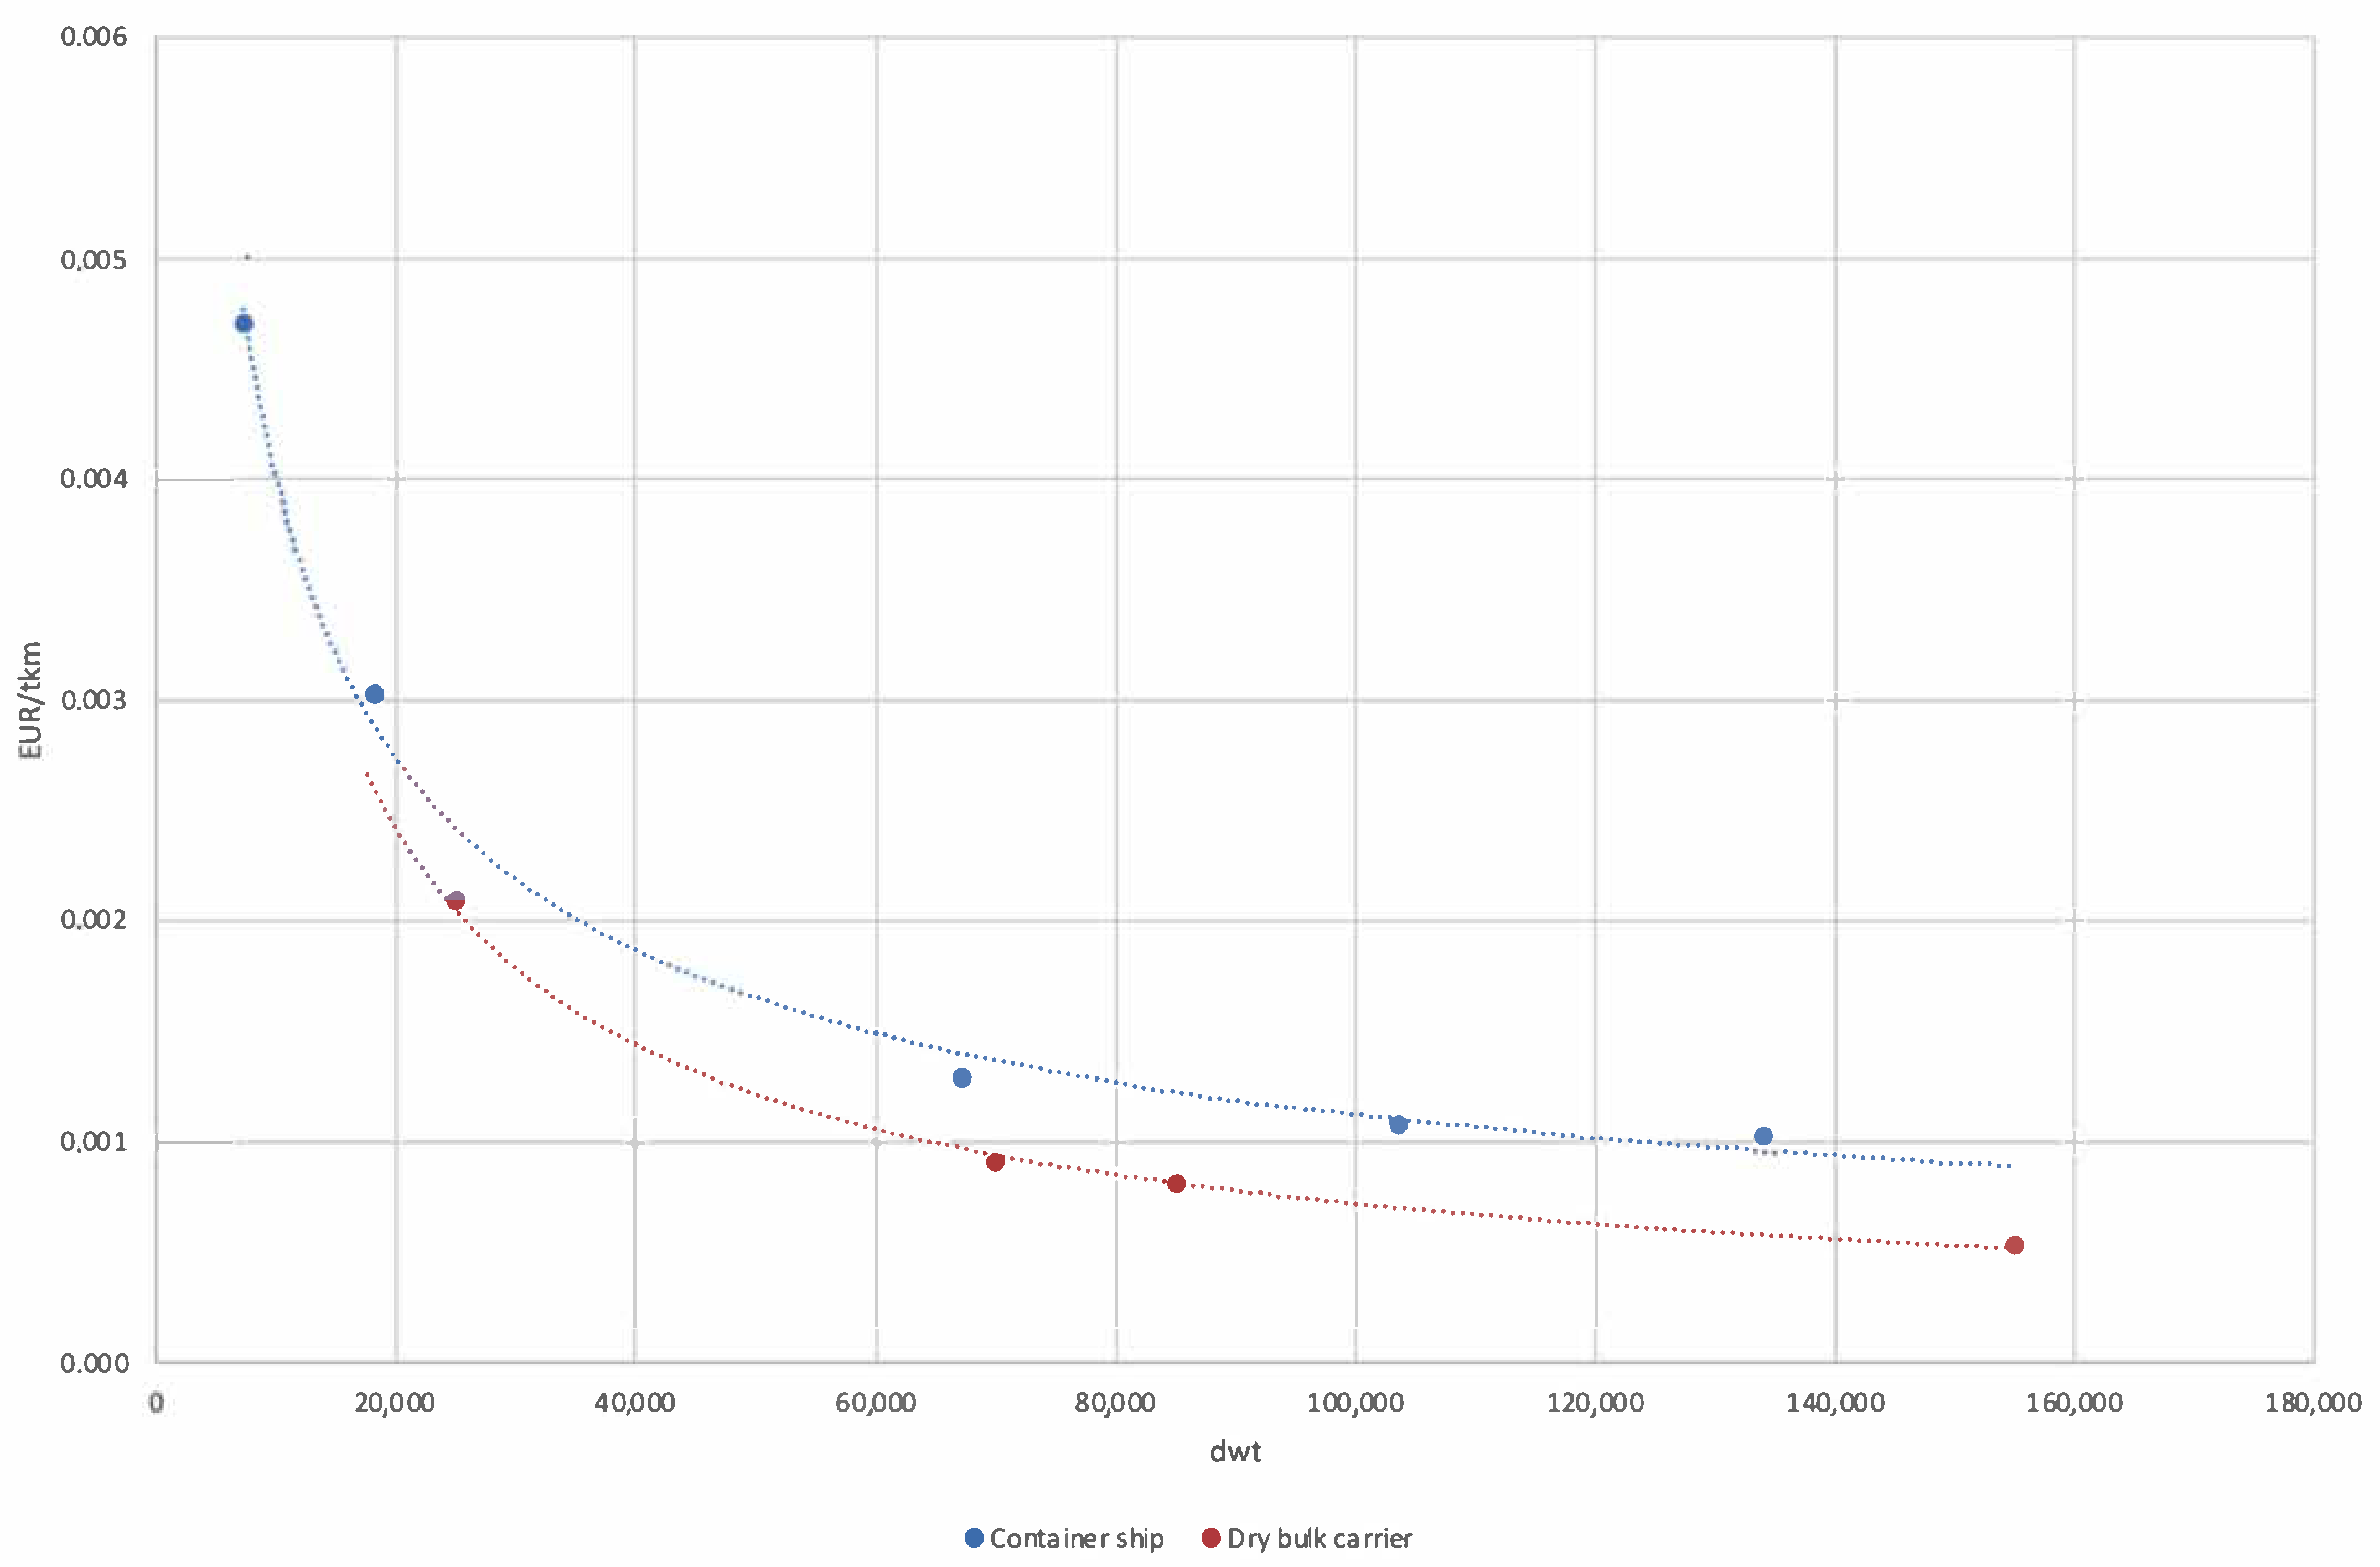
A comparison of the total unit shipping costs for dry bulk and container shipping and indexed for year 2019 is depicted in
Figure 2.
I then use the model of the unit cost of container shipping below:
where:
is the n-th category of average unit shipping cost of the i-th container ship size;
is the i-th size of container ship expressed in terms of a guide deadweight (dwt);
is the intercept parameter for the n-th cost category;
is the elasticity of the average unit shipping cost for n-th cost category;
is a random component for n-th cost category model.
Estimates are calculated for the following costs categories: (
k1i) other operating costs (manning, insurance, repairs and maintenance, stores and lube oil, administration), (
k2i) capital costs (capital repayments and interest), and (
k3i) fuel. The estimated results of the model are presented in
Table 8, where parameter
is the mean elasticity of the
n-th category of the unit shipping cost.
Manning (labor) costs, as well as the costs related to the administration and management of a ship, which make up other operating costs, show through elasticity (−0.782) a significant decrease in relation to the increasing deadweight of a container ship.
An important effect related to the scale of a container ship are the savings in the cost of marine fuel (−0.702), whereby the cost benefits grow in importance with the increase in fuel prices, the restrictions on exhaust emissions to the atmosphere in shipping, and the internalization of related external costs. The increase in container ship size leads to savings in unit capital costs (−0.399).
6. Discussion and Conclusions
The comparison of the results on the values of elasticity of daily shipping costs in relation to ship sizes is presented in
Table 9.
In the seminal study [
27], an analytical framework based on multiplicative relationships between shipping cost categories, such as capital, labor, energy, and ship size, were developed. Scholars did several regression analyses for tankers, bulk carriers, and container ships. They conclude that the ship capital costs are proportional to the two-thirds power of the ship size while for other operating costs (with labor cost included but fuel cost excluded) and fuel cost elasticities values amounted respectively 0.43 and 0.72.
The elasticity of capital daily costs for dry bulk carriers, in our calculations 0.329, is significantly lower than these values estimated in other studies, respectively 0.67 for tramps, and 0.7 for dry bulk carriers, and 0.6 for various types of vessels. Previous studies used cost data from the 1960s (Thorburn, 1960) and the 1970s (Goss and Jones, 1971), and the 1980s (Jansson and Shneerson, 1987), which justifies updating them. In our calculation only capital repayments and interest costs are considered, where in other studies they consist of interest costs and the depreciation of the ship [
47] or are set equal to the capital recovery factor (annuity) based on the interest rate and the ship’s economic lifetime, where the interest rate is the weighted average of the return on equity and loans [
33,
40]. This research results also reflect modern shipbuilding and shipbuilding financing conditions. All these factors may be the source of differences in the value of the elasticity of dry bulk carrier’s capital costs as compared with the historical calculations. For bulk carriers, lower daily capital cost elasticities indicate that prices for increasingly larger bulk carriers are increasing less today than in the past.
In the recent studies on scale economies in container shipping, the capital costs size elasticities are 0.759 (Cullinane and Khanna, 1999), 0.70 (Tran and Hassis, 2015) and 0.766 (Veldman, 2011), and these values are close to our estimates 0.785. For container ships, an increase in ship size requires increasingly higher expenditure on construction and equipment, which is reflected in the increase in the elasticity value of daily capital costs.
Large differences appear in the values of fuel cost elasticity, which in my calculations are clearly lower for bulk carriers than those estimated in the previous studies [
6,
22,
27]. The values of fuel cost elasticities for a bulk carrier range between 0.80 and 0.72, while in this research amount only to 0.289. However, in the case of container shipping in the latest research on fuel cost elasticities (Tran and Hassis, 2015; Veldman 2011) values are estimated on 0.51 and in the range between 0.607 and 0.417, what corresponds to our estimate 0.462. In shipping energy savings come from technology, i.e., ever growing ship scale, technical progress in the field of ship propulsion, and enhanced efficiency in fuel consumption. Fuel consumption savings also result from optimizing the speed of ships as a function of their size and distance travelled. These are nowadays the main reasons for the lower values of elasticity in fuel costs.
The lower elasticities of other operation costs, i.e., 0.238 for bulk carriers and 0.328 for container ships, versus values in former studies in the range of 0.43–0.40 result mainly from the increasing savings in labor costs caused by the technical progress and work automation. Thus, the number of crew for increasingly larger bulk carriers and container ships is subject to slight changes.
The results of the analysis on the elasticity value of daily shipping costs for bulk carriers and container ships are summarized in
Table 10.
The economies of scale measured by the elasticity of total operating costs are greater for bulk carriers than for container ships. This is mainly due to technical reasons and the rules of ship operation, as bulk carriers are easier to build and require less equipment as compared to container ships, whose holds consist of a system of multiple chambers for the transport of containers. The commission and operation of bulk carriers with increased deadweight requires correspondingly lower material and personnel expenditures. Bulk carriers are employed in non-regular shipping and are designed to carry full ship cargoes, while container ships are operated in regular shipping and carry general cargo in containers for different shippers. This approach has an impact on the volume of transport shipment and on the use of ship deadweight, which are greater for bulk carriers than for container ships.
In relation to the increasing ship size, other operation costs also decline, including manning (labor) costs and costs related to the administration and management of a ship. Compared to container ships, the elasticity values for the considered cost group are lower for bulk carriers. Greater economies of scale for bulk carriers are because their operation is based on efficient technological solutions, so that as their size increases, the labor input changes to a lesser extent than for container ships. Similarly, the administration and management of bulk carriers is much simpler than for the container ships operating in complex hub and spoke transport networks.
Comparing the elasticities of capital costs shows that the prices of new ships and the costs of financing their purchase are increasing significantly for the ever-larger container ships than for bulk carriers. This is due to the increase in the costs associated with equipping large ships with more powerful marine engines and the increased steel consumption for the construction of large container ships [
49]. Conversely, larger bulk carriers require less expenditure per deadweight unit for their construction.
The unit operating cost for bulk carriers and container ships have been updated for 2019 with the use of the nominal GDP indexation of the EU-28 countries. This approach is widely used (e.g., 37) while such estimates have great policy implications in decision-making or are used to determine the impact of scale in maritime transport on the remaining links of the transport system (ports, hinterland transport). Even if some operating costs are quite volatile (e.g., fuel costs), while others tend to increase at an inflationary rate (e.g., crewing and administration costs), by applying indexing, it gives plausible unit shipping costs values.
The results for the elasticity values of unit shipping costs for increasing bulk carrier and container ship sizes are summarized in
Table 11.
Using the values of elasticity of total operating unit cost for dry bulk carriers (−0.751) and for containerships (−0.599), this study confirms the substantial decrease in unit shipping costs with the increase in vessel size. The unit cost reductions for bulk carriers are large for all types of operating costs, while for container ships the largest savings being in other operation costs, also in fuel and capital costs. These results confirm the greater decrease in unit capital costs for bulk carriers than for container ships.
The increase in the size of a container ship leads to an increase in the duration of a ship’s stay in a port. It should be emphasized that the disadvantages of scale in sea ports are currently limited by the increase in the efficiency of transshipment operations and the efficient handling of ships to such an extent that the duration of stay in a port of large container ships has not been significantly extended. Shipowners deciding to put into service ever larger container ships assume that cost benefits associated with the operation of ships at sea will exceed the disadvantages of scale in seaports, and thus the average voyage costs of large ships will be further reduced. In the case of bulk shipping, the flexibility of port costs in relation to large bulk carriers is small, as the transshipment technology based on a system of continuous operation equipment allows for a flexible increase in efficiency depending on the size of a ship, so the duration of stay of larger bulk carriers in sea ports does not change significantly.
The developed model of unit shipping cost can be used to research the microeconomic effectiveness of infrastructure investments in seaports, as well as for the cost calculation of sea–land transportation systems. The primary factor enabling the achievement of the cost benefits related to the increase in the size of a sea-going vessel is the sufficiently high transport accessibility from sea to a seaport. The accessibility to the port for sea-going vessels is determined by the depth of the fairways and the port water area (port canals and basins, depths at the quays). Increased depths in seaports enable the handling of large ships. The estimated function for the unit cost of carriage can be used to calculate the shipping cost savings caused by dredging a port water area. Therefore, research using the sea transport unit cost model allows estimating the savings in shipping costs resulting from handling larger ships in seaports, which is an important factor in the calculation of port investment effectiveness, as well as the analysis of competition between ports.
For example, at present, a port of regional importance may be called by ships with a draft of 9.15 m. When fully loaded, these are bulk carriers with a deadweight of up to 20,000 tons and container ships with a capacity of up to 1000 TEU. In the case of dredging of the fairway and the port water areas, ships with the draft of up to 11.05 m will be able to call at a given port. This means the increase in the size of a fully loaded bulk carrier to 40,000 tons and the increase in the capacity of a container ship to 1800 TEU. The average costs of transport for a bulk carrier with a deadweight of 20,000 tons and a deadweight of 40,000 tons calculated with the use of the developed model are 0.0029 EUR/tkm and 0.0017 EUR/tkm, respectively. The average costs of transport for a container ship with a capacity of 1000 TEU (about 12,180 dwt) and one with a capacity of 1800 TEU (about 21,924 dwt) calculated using the proposed model are 0.0042 EUR/tkm and 0.0030 EUR/tkm, respectively. In this case, for sea shipping, the savings in the unit cost of dry bulk cargo transportation reach 41%, while they amount to nearly 29% for container transportation.
The cost-effectiveness of sea transport, supplemented by an analysis of transport time costs, determine the transportation chains and the competitiveness of transport systems. The developed model makes it possible to calculate the unit cost of sea transport depending on the size of a single delivery. Additionally, in the comparative analyses of transport systems, this type of variable can be used to determine the impact of scale in maritime transport on the remaining links of the system (ports, hinterland transport), as well as on transport systems and their modal configurations.
The limitations of this study stem from the data on operating costs, which represent average values for four bulk carrier and five container ship size sub-ranges. Additionally, average cost has been assigned to the leading load capacity in each sub-range. Consequently, the estimates include mean elasticities for the entire group of vessel sizes and not for the various sizes of that given ship type. Further research should focus on elaborating a model for analyzing the operating cost incurred by various ship capacities. In this case, it is indispensable to have shipping cost data for individual ship sizes.


