1. Introduction
Detecting the key factors of renewable and non-renewable energy consumption is an essential research topic for developing and developed economies because energy consumption has great importance for the environment. To combat the upsurge in threats of environmental change throughout the world, and to alleviate the emissions of greenhouse gas, several economies have dedicated efforts and committed international agreements like Paris Agreement and Kyoto protocol [
1]. Conventional energy consumption has a direct and indirect effect on global warming [
2]. One way to combat the emissions of greenhouse gasses is that reduces the consumption of fossil fuels and utilizes renewable energy as a source of energy. Although renewable energy and clean energy are key sources of a clean environment, but due to a lack of domestic financial resources, it is not becoming the helping source of clean energy [
3]. Consequently, foreign capital inflow has resolved the problem of inadequate domestic capital. Thus, foreign capital is considered the main engine for clean energy in developing and emerging economies [
4].
In theory, the foreign capital inflows–non-renewable energy consumption nexus can be disintegrated into the technique, scale, and composition effects. The scale effect states to the upsurge in non-renewable energy consumption carried by lively economic activity fueled by foreign capital inflows. Conflicting, the technique effect states a negative link between foreign capital inflows and non-renewable energy consumption that stems from foreign investors improving energy efficiency. Lastly, the nature of the composition effect is not clear as it differs on the sector-wise distribution of foreign capital inflows as well host country level of economic development. Doytch et al. [
5] noted that the concentration of foreign capital inflows in the tertiary sector of an advanced country inspires a negative nexus between foreign capital inflows and non-renewable energy, while such concentration in the secondary sector of an emerging country encourages a contradictory effect.
The evaluation of foreign capital inflows—non-renewable energy consumption nexus can be traced from financial sector development. As Sadorsky [
6] suggests that a well-functioning and efficient financial market permits offer credit that raises non-renewable energy consumption as well economic growth. Meanwhile, reasonable credit enables households and firms to purchase consumer and producer-related items that also enhance non-renewable energy consumption [
6]. However, if the financial sector offers a lowers cost of borrowing, thus it increases households and firms to access energy-conserving technology innovation that reduces non-renewable energy consumption in the long run [
7]. As foreign capital inflow is one of the additional sources of financing in the economy. The first study of Mielnik and Goldemberg [
8], who noted that foreign capital inflows have reduced non-renewable energy consumption in developing countries. In contrast, Tang [
9] reasons that foreign capital inflows mostly increase non-renewable energy consumption through escalating economic activity in the manufacturing, industrialization, transportation sectors and reported the scale effect. To date, the present empirical literature offers mixed findings on the nexus of foreign capital inflows and energy consumption. For instance, Doytch and Narayan [
5] found a negative link between foreign capital inflows and non-renewable energy consumption for a group of countries, while Sadorsky [
6] and Lee [
10] noted that foreign capital inflows improve the non-renewable energy consumption of host economies. On the other bulk of studies shows the insignificant effect of foreign capital inflows on non-renewable energy consumption among developing countries [
11]. Thus nexus between foreign capital inflows and non-energy consumption is important in literature but gives us mixed empirical findings [
12].
A main lack of the aforementioned empirical studies is that they have mostly ignored the effect of foreign capital inflows on renewable energy consumption. Paramati et al. [
11] address this gap by examining the influence of foreign capital inflows on clean energy consumption in emerging economies. They report a positive association between foreign capital inflows and clean energy consumption in the long run. Meanwhile, Doytch and Narayan [
5] and Ma et al. [
13] suggest that foreign capital inflows encourage and aggregate renewable energy consumption. Foreign capital inflows are also vital for renewable energy consumption. Foreign capital inflows improve the host countries’ technology spillovers that enrich renewable energy by taking a large amount of technology and funds from foreign [
5,
14]. This is one of the direct impacts of flows on renewable energy consumption via technology and funds [
15]. Also, foreign capital inflows have indirect effects on renewable energy consumption via economic growth. A similar analysis is conduct by Kutan et al. [
16] for emerging economies and found that foreign capital inflow exhibits a significant positive effect on renewable energy use. The findings of Yilanci et al. [
17] reported that foreign capital inflow has a positive and significant impact on clean energy use in Russia, while it has insignificant impacts in South Africa and China.
Past studies are also noted two types of proposition, as first proposition named “pollution haven hypothesis” claims that due to loose environmental regulations, a specific portion of foreign capital inflows to the developing economies. Polluting industries such as non-ferrous metals, steel, and iron, industrial chemicals shift away from developed economies that have stringent environmental rules to the developing economies with weaker environmental rules [
18]. Conversely, the second proposition named the "pollution hallo hypothesis" claims that the inflow of capital upsurges the quality of the environment of the host economy through the transfer of technology. Consequently, the firms of host countries can achieve benefits from the spillover influences of the firms of foreign, and the domestic economy promotes quality of environment [
19,
20]. The BRICS countries’ total net inflow of FDI has 307.79 billion U.S. dollars and it has become 16.5% of net FDI inflow to the globe. From 2001 to 2011, CO
2 emissions of the BRICS economies share rose from 27.35% to 37.78%, while the share of greenhouse gas emissions of the BRICS economies has 41.3% and 40% of energy consumption in the globe [
21]. Thus we selected the BRICS regions for analysis. The share of FDI, energy consumption, and CO2 emissions are too high, and thus nexus can be important of energy and environment policies. The new analysis is conduct for a group of five economies namely Brazil, Russia, India, China, and South Africa. It is well-accepted fact that BRICS economies are experiencing higher inflows of capital and these are going to be considered as the engine of growth in the world [
22]. The BRICS economies receive a total inflow of FDI worth about 308.76 billion US dollars according to the data of the World Bank. In this regard, it appeals much attention to examine the influence of inflows of capital on the consumption of energy. Our study aims to examine the non-linear impact of foreign capital inflows on the consumption of renewable and non-renewable energy for BRICS economies from 1991 to 2019. We employed the non-linear ARDL approach for each economy separately because it addresses the issue of aggregation bias. This econometric approach examines the impact of positive and negative shocks of foreign capital inflows on renewable and non-renewable energy. Nowadays, NARDL methodology is a workhorse in the context of energy and the environment.
This study contributes to the literature by examining the dynamic effect of foreign capital inflows on renewable and non-renewable energy consumption through fresh econometric methods. There is also room for a new contribution to the literature because previous literature assumes the linear relationship between foreign capital inflows and renewable and non-renewable energy consumption. This study is clear the literature direction of impacts by analyzing the foreign capital inflows–energy nexus by using the nonlinear Autoregressive Distributed Lag (NARDL) approach. This study also resolves the problem of aggregation bias due to panel data via country-specific analysis.
2. Methodology and Data Acquisition
Previous empirical studies have assessed the linear impact of foreign capital inflows on energy consumption and gathered considerable attention from scholars [
17,
23]. Based on previous theoretical and empirical studies, we noted that foreign capital inflow is influenced dynamically by energy consumption [
24]. To this end, we follow the Doytch and Narayan [
5] empirical model and construct their notations in model forms as
This model is expressed from the BRICS perspective and both models include foreign capital inflows (FCI) as a proxy of foreign direct investment (FDI) that is a focused variable in our analysis. To that end, if FCI is to increase non-renewable energy consumption, we assume an estimate of
to be positive. Finally, the FCI could have positive effects on renewable energy consumption and estimate of
to be positive, while remittances, GDP, and trade are control variables. The second phase in developing the econometric models is to include the short-term dynamics adjustment process in Equations (1) and (2). So we also follow Pesaran et al. [
25], who argued that short-run dynamics are also estimated along with long-run elasticities.
Equations (3) and (4) give us the short-run coefficient estimates attached to “delta” variables with long-run coefficient estimates of
−
. However, for the validity of long-term estimates, cointegration must be established via F-test and ECM or t-test. The linear model uses the Pesaran et al. [
25] tabulated new critical values for both tests. However, Haug and Ucal [
26] and Qamruzzaman and Jianguo [
24] argued that FCI behaves asymmetrically to renewable and non-renewable energy consumption. Finally, Yang et al. [
27] point out nonlinearities in the link between FCI and renewable and non-renewable energy consumption. Similarly, Shin et al. [
28] modify the linear specifications and decompose the FCI variable into two new variables where one will signify only an increase in FCI and the other one will represent declines in FCI. Thus the partial sum econometric approach is employed to create the new variables as follows:
where,
represents the positive shocks, reflects an increase in FCI variable and
represents the negative shocks, reflects decreased in FCI variable. In the next equation, we shift the partial sum variables into the linear model and the extended model is
Equations (7) and (8) are generally referred to and known as a nonlinear or asymmetric ARDL model, whereas Equations (2) and (3) are mentioned as the linear or symmetric ARDL model. Shin et al. [
28] also used the same estimation method and similar diagnostic tests. The conventional ARDL diagnostic tests are also applied in the asymmetric model. For nonlinear ARDL, we also test a few additional asymmetry hypotheses. First, if the foreign capital inflows are to adjust at a different speed to increased foreign capital inflows versus decreased foreign capital inflows, so two partial sum indicators have different lag orders in the short term, which is a signal of short-term asymmetry. Second, at similar lags in two partial sum series, any given lag order p, if coefficient estimates are different which confirm the short-run asymmetry through the Wald test. Finally, the response of the RE and NRE to foreign capital inflows changes will be nonlinear in the long run if the Wald test nullified the hypothesis of
/
=
/
Data Description
This study examines the dynamic relationship between FCI and energy consumption for BRICS economies over the time between 1991 and 2019. The selection of data span is based on the availability of the dataset. In this way, the study covers the annual dataset for analysis. The data used in this analysis are renewable energy (RE) and non-renewable energy (NRE), both are dependent variables in our models and measured in quad BTU. The dependent variables are determined by following Sohail et al. [
12]. We used the proxy of FCI as a proxy of FDI that is the percent of GDP. Three factors, remittances (REM), GDP growth (GDP), and trade openness (Trade) are our control variables in our both model. The data source of the RE and NRE is the Energy Information Administration (EIA) and the remaining variables data source is World Development Indicators (WDI) given by World Bank. We have converted FCI into logarithmic for better coefficient estimates. The data definitions and abbreviations of all the variables are reported in
Table 1.
3. Results and Discussion
Before estimating the model, as a preliminary analysis, stationarity properties of the data have been tested by using unit root without break test and unit root with break test. Results for both tests confirm mixed order of integration as few variables are stationary at the level and few of them are stationary at I(1) in
Table 2. However, none of the variables is stationary at I(2). Both unit root tests have been used in time series modeling in the preliminary analysis [
29]. For the empirical task, we have used the nonlinear ARDL estimation technique. The NARDL analysis attempts to investigate whether the effects of FCI on renewable energy consumption and non-renewable energy consumption are asymmetric or not.
Table 3 provides short-run and long-run coefficient estimates of the renewable energy consumption model including diagnostic tests for BRICS economies. However,
Table 4 displays short-run and long-run coefficient estimates of non-renewable energy consumption models for BRICS economies including diagnostic tests. The short-run results reveal that coefficient estimates of foreign capital inflows are negative and statistically significant for positive shocks of foreign capital inflows (FCI_POS) in the case of India and South Africa; however, in the case of Brazil, Russia, and China the coefficient estimates are statistically insignificant. The positive components of foreign capital inflow significantly decrease renewable energy consumption that is a one percent upsurge in the positive component of foreign capital inflow will result in decreasing renewable energy consumption by 0.39 percent in India and 0.01 percent in South Africa.
However, the coefficient estimates of foreign capital inflows are positive and statistically significant for negative shocks of foreign capital inflows (FCI_NEG) in the case of India and China and negative and statistically significant in Brazil. However, the coefficient estimates are statistically insignificant in the case of Russia and South Africa. These findings confirm asymmetric relationships between foreign capital inflows and renewable energy consumption in India, China, and Brazil. The findings for negative components of foreign capital inflows significantly decrease renewable energy consumption in Brazil that is a one percent increase in the negative component of foreign capital inflows will result in decreasing renewable energy consumption by 0.41 percent in Brazil. However, a one percent increase in the negative component of foreign capital inflows results in an upsurge of renewable energy consumption by 0.65 percent in India and 2.34 percent in China.
Along with investigating the effect of foreign capital inflows on renewable energy consumption, the study has also investigated the influence of remittances, GDP, and trade on renewable energy consumption in BRICS economies. The coefficient estimate of remittance is statistically significant only in the case of Russia. The inflow of remittance does not cause any significant influence on renewable energy consumption in BRICS economies except Russia. This implies that the inflow of remittance has an insignificant impact on renewable energy consumption in Russia. The findings reveal that due to a one percent increase in the inflow of remittances the renewable energy consumption in Russia increases by 0.13 percent. In the case of D(GDP), the coefficient estimate suggests that due to a one percent increase in D(GDP) renewable energy consumption significantly increases by 0.07 percent in Brazil and 0.07 percent in India. However, no significant influence of D(GDP) is found in the case of Russia, China, and South Africa. The coefficient estimates of the trade variable suggest that as a result of a one percent increase in D(Trade) the renewable energy consumption increase by 0.03 percent in India, 0.01 percent in South Africa. However, consumption of renewable energy decreases by 0.03 percent in Brazil due to a one percent increase in trade. In the case of Russia and China, the coefficient estimates of trade variables are statistically insignificant.
The NARDL results for long-run estimates also confirm an asymmetric relationship between foreign capital inflows and renewable energy consumption. The coefficient estimates on foreign capital inflows for positive shocks are positive and statistically significant in Brazil, India, and South Africa. The results imply that a one percent increase in foreign capital inflow results in increasing renewable energy consumption by 0.22 percent in Brazil, 0.14 percent in India, and 0.04 percent in South Africa. These findings are also consistent with Anton and Nucu [
30], who noted that foreign capital inflows lead to raises renewable energy and reduces non-renewable energy consumption in host countries in long run. The positive change in foreign capital inflow exhibit a positive impact on renewable energy consumption, as noted by Qamruzzaman and Jianguo [
24] worldwide. They are reported asymmetric nexus between foreign capital inflow and renewable energy consumption. This finding also infers that foreign investors normally utilize cheap renewable energy during production activities, thus FDI improves the renewable consumption in the host economy. This outcome also revealed that FDI-related activities are mostly clean via renewable energy. This finding is also consistent with Usman et al. [
29], who noted that foreign capital is an efficient approach to energy conservation, in return, enhances renewable energy consumption. Foreign capital also increases renewable energy consumption in the host country through technology innovation in the domestic economy. Our study finding is also quite reliable with Yilanci et al. [
17], foreign direct investment has a favorable influence on clean energy consumption in Russia.
However, the coefficient estimates on foreign capital inflows for negative shocks are negative and statistically significant in all BRICS economies except Russia. The results of negative shock imply that a one percent increase in foreign capital inflow results in decreasing renewable energy consumption by 0.37 percent in Brazil, 0.37 percent in India, 6.56 percent in China, and 0.03 percent in the case of South Africa.
As far as other variables are concerned, in the case of remittance, the coefficient estimates suggest that as a result of a one percent upsurge in the inflow of remittances the renewable energy consumption increases by 0.26 percent in Russia and it decreases by 0.63 percent in India. The coefficient estimates of GDP suggest that as a result of a one unit increase in GDP the renewable energy consumption increases by 0.07 percent in Brazil and 0.50 percent in China. In the end, the coefficient estimates of trade reveal that trade positively affects renewable energy consumption in India, however, it results in decreasing renewable energy consumption in Brazil and China. The findings show that as a result of a one percent increase in trade the renewable energy consumption in Brazil decreased by 0.04 percent and in China, it decreases by 0.09 percent, however, in the case of India it increases by 0.02 percent.
In
Table 3, panel C presents the results of diagnostic tests for the NARDL model. The F-statistics is statistically significant for NARDL that suggests the existence of cointegration among the variables. The ECM term is negative and statistically significant and 1 percent level for Brazil, Russia, and India. However, it is negative and statistically significant at a 10 percent level for China and South Africa. The Lagrange Multiplier (LM) test is used for the detection of autocorrelation and the RESET test for model misspecification. The results of the LM test are qualified in NARDL estimation for all BRICS economies except Russia and Ramsey RESET is also qualified in NARDL estimation for all economies except South Africa. Findings of CUSUM and CUSUM-2 confirm the stability of models denoted by “S” in the case of all BRICS economies. The short-run and long-run asymmetries between foreign capital inflows and renewable energy consumption are investigated using the Wald test. That is, foreign capital inflows have an asymmetric association with renewable energy consumption in the mostly long run in BRICS economies.
Figure 1 provides a multiplier graph for foreign capital inflows and renewable energy consumption, respectively.
Figure 1 depicts the asymmetries in both positive and negative shocks in foreign capital inflows during the adjustment process.
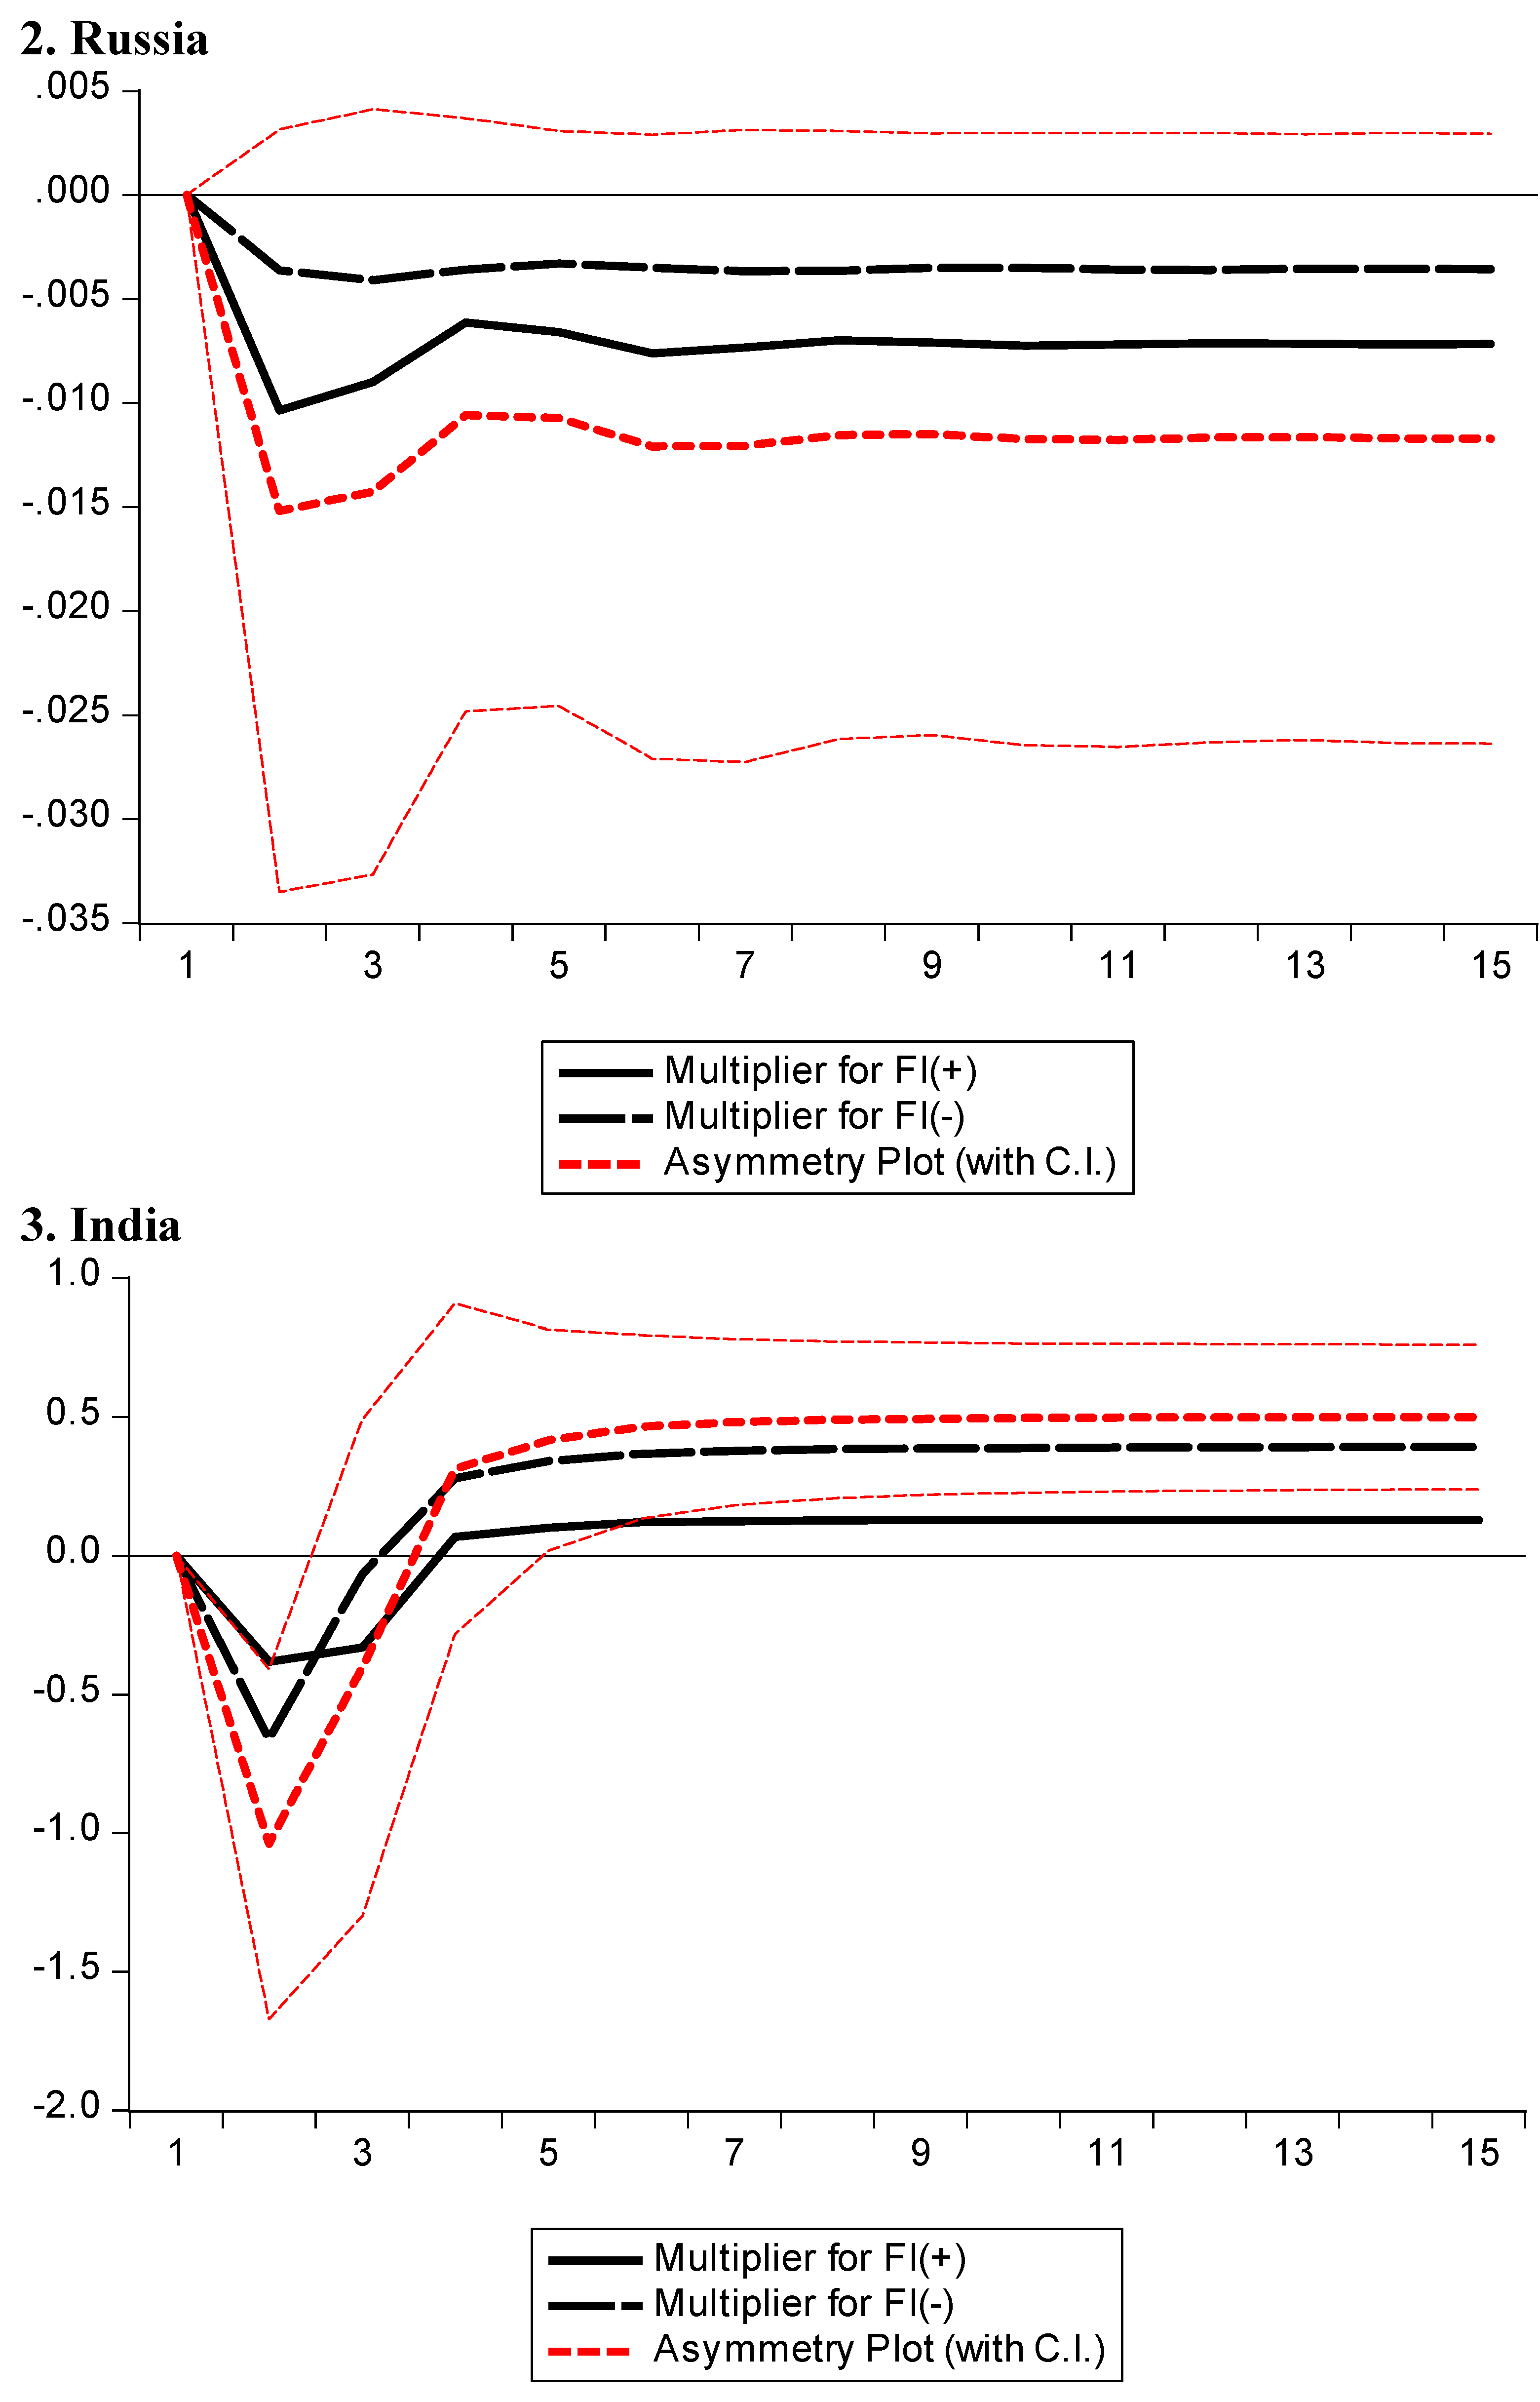
Table 4 gives us NARDL estimates of non-renewable energy consumption. In
Table 4, panel A reveals that short-run coefficient estimates of foreign capital inflows are positive and statistically significant for positive shocks of (FCI_POS) in the case of China only, however, in the case of all other economies the coefficient estimates are statistically insignificant. The positive components of foreign capital inflows significantly increase non-renewable energy consumption in China that is a one percent upsurge in the positive component of foreign capital inflows will result in increasing non-renewable energy consumption by 1.42 percent. However, the coefficient estimates of foreign capital inflows are positive and statistically significant for negative shocks of foreign capital inflows (FCI_NEG) in the case of Brazil and India and negative and statistically significant in the case of Russia and China. The findings for negative components of foreign capital inflows significantly decrease non-renewable energy consumption in Russia and China that is a one percent increase in the negative component of foreign capital inflow will result in decreasing non-renewable energy consumption by 1.14 percent in Russia and 5.71 percent in China. However, a one percent increase in the negative component of foreign capital inflow results in an upsurge of non-renewable energy consumption by 0.38 percent in Brazil and 6.22 percent in India. The coefficient estimate of remittance is statistically significant only in the case of Russia. The finding reveals that due to a one percent increase in the inflow of remittances the non-renewable energy consumption in Russia decreases by 5.12 percent in Russia. In the case of D(GDP), the coefficient estimate suggests that due to a one percent increase in D(GDP) non-renewable energy consumption significantly increases by 0.09 percent in Brazil, 0.17 percent in India, and 0.58 percent in case of India. The coefficient estimates of the trade variable suggest that as a result of a one percent increase in D(Trade) the non-renewable energy consumption increase by 0.15 percent in India and 0.22 percent in China.
The long-run coefficient estimates of NARDL show that the positive component of foreign capital inflow (FCI_POS) increases non-renewable energy consumption in all BRICS economies except India. The coefficient estimates show that a one percent increase in foreign capital inflow enhances non-renewable energy consumption by 0.32 percent in Brazil, 2.27 percent in Russia, 3.93 percent in China, and 0.10 percent in South Africa. These findings are also consistent with Sadorsky [
31] and Salim et al. [
23], who noted that foreign capital inflows raise non-renewable energy consumption in the host countries. This finding is consistent with Shahbaz et al. [
32], who noted that foreign capital inflow increases macroeconomic activities and encourages economic growth and thus more energy consumption is obvious in the economy.
However, the negative component of foreign capital inflow (FCI_NEG) decreases non-renewable energy consumption in Brazil, India, and South Africa but, it increases non-renewable energy consumption in China. However, the effect is insignificant in the case of Russia. The coefficient estimates reveal that due to a 1 percent increase in the negative component of foreign capital inflow the non-renewable energy consumption decreases by 0.98 percent in Brazil, 8.44 percent in India, and 0.06 percent in South Africa. However, in the case of China, as a result of a 1 percent increase in negative shock of foreign capital inflow the non-renewable energy consumption increases by 2.79 percent.
As far as other variables are concerned, in the case of remittance, the coefficient estimates suggest that the influence is statistically significant in the case of only India. The finding suggests that as a result of a one percent upsurge in the inflow of remittances the non-renewable energy consumption decreases by 4.09 percent in India. The coefficient estimates of GDP suggest that as a result of a one unit increase in GDP the non-renewable energy consumption decreases by 0.55 percent in Brazil and it increases 3.93 percent in China. In the end, the coefficient estimates of trade reveal that trade positively affects non-renewable energy consumption in India, however, it results in decreasing non-renewable energy consumption in Brazil and China. The findings show that as a result of a one percent increase in trade the non-renewable energy consumption in Brazil decreased by 0.02 percent and in China, it decreases by 0.88 percent, however, in the case of India it increase by 0.14 percent.
In
Table 4, panel C presents the results of diagnostic tests for the NARDL model. The F-statistics is statistically significant for NARDL that suggests the existence of cointegration among the variables. The ECT term is negative and statistically significant and 1 percent level for Russia, China, and South Africa. However, it is negative and statistically significant at a 10 percent level for Brazil. The results of the LM test are qualified in NARDL estimation for all BRICS economies except China. The findings of the heteroskedasticity test and RESET are also qualified in NARDL estimation for all economies. Findings of CUSUM and CUSUM-2 confirm the stability of models denoted by “S” in case of all BRICS economies except Brazil is unstable in case of CUSUM-2. The short-run and long-run asymmetries between foreign capital inflows and non-renewable energy consumption are investigated using the Wald test. That is, foreign capital inflows have an asymmetric association with non-renewable energy consumption in the mostly long run in all BRICS economies except India.
Figure 1 provides a multiplier graph for foreign capital inflows and renewable energy consumption, while
Figure 2 provides a multiplier graph for foreign capital inflows and non-renewable energy consumption, respectively. The black dotted (solid black) lines show the non-linear adjustment of renewable and non-renewable energy consumption to the negative (positive) shocks. The difference between both shocks is portrayed by the red dotted line and infers mostly asymmetries in positive and negative shocks in
Figure 1 and
Figure 2.
4. Conclusions and Policy Proposals
In the literature, the nexus between foreign capital inflow, renewable consumption, and non-renewable energy consumption are not well-documented asymmetrically [
17,
24]. No doubt BRICS is an attractive group for foreign capital inflow. Therefore, this study scrutinizes the dynamic links between foreign capital inflow and renewable and non-renewable energy consumption for BRICS during the period 1991–2019. Using the asymmetric approach the empirical findings expose cointegration among these variables in both models.
The results show that a positive change in foreign capital inflow has a positive influence on renewable energy consumption in Brazil, India, and South Africa, but a negative change in foreign capital inflow has a negative significant effect on renewable energy consumption in Brazil, India, China, and South Africa. Thus foreign capital inflow has a significant asymmetric effect on renewable energy consumption in long run. The empirical findings also indicate that positive shock to foreign capital inflow has reduced renewable energy consumption in South Africa and India. A decreasing foreign capital inflow has positively affected renewable energy consumption in India and China, while it has a negative impact on renewable energy in Brazil in the short run. Thus, an upsurge in foreign capital inflow has also a favorable impact on non-renewable energy consumption in BRICS except India while a decrease in foreign capital inflow has a deteriorating impact on non-renewable energy consumption in Brazil and India in long run. However, a negative change in foreign capital inflow has a significantly positive impact on non-renewable energy consumption in China in long run. The asymmetric relationships also hold between foreign capital inflow and non-renewable energy consumption in mostly BRICS economies in the short run. In crux, all our control variables have also country-specific results in renewable and non-renewable energy consumption models in the short and long run.
Several implications have emerged from our robust findings. These findings show some implications for authorities and policymakers to take several precautionary measures in the consumption of energy and to redesign effective green economic policies. So, authorities should use the device of environmental regulations to reduce fossil fuel energy consumption rather than clean energy consumption. Particularly, governments need to attract foreign investors which make investments in clean energy production and domestic firms may get environmental-friendly technology via the spillover effects of FDI in BRICS. Besides, authorities should subsidize the usage of R&D activities in clean energy sectors and facilitate the foreign investors by reducing the taxes. Authorities should formulate regulatory policies to increase public awareness of renewable energy and a clean environment. FDI can be an engine for renewable energy consumption such as geothermal, wind, and solar; policymakers should reduce fossil fuel energy consumption without compromising its economic growth.
Our study is not free of limitations. First, the analysis uses a limited number of factors determining non-renewable and renewable energy consumption. Future empirical research should add other variables that influence non-renewable and renewable energy consumption as soon as data is available for other regions for a long data span. Upcoming panel data studies are conduct analysis for country-specific analysis to draw more clear policy recommendations. Employing similar methodologies to the other factors of renewable and non-renewable energy consumption to get more reliable findings to redesign more effective policies.


