Abstract
A maximum power point tracking (MPPT) controller was used to make the photovoltaic (PV) module operate at its maximum power point (MPP) under changing temperature and sunlight irradiance. Under partially shaded conditions, the characteristic power–voltage (P–V) curve of the PV modules will have more than one maximum power point, at least one local maximum power point and a global maximum power point. Conventional MPPT controllers may control the PV module array at the local maximum power point rather than the global maximum power point. MPPT control can be also implemented by using soft computing methods (SCM), which can handle the partial shade problem. However, to improve the robustness and speed of the MPPT controller, a hybrid MPPT controller has been proposed that combines two SCMs, the Genetic Algorithm (GA) and Ant Colony Optimization (ACO). Matlab was used in a simulation of a GA-ACO MPPT controller where four SunPower SPR-305NE-WHT-D PV modules with a maximum power of 305.226 W connected in series were used under conditions of partial shade to investigate the performance of the proposed MPPT controller. The results obtained were analyzed and compared with others obtained under perturb and observe (P&O) MPPT and conventional ACO MPPT controllers were observed.
1. Introduction
Solar energy is the most valuable of all renewable energy sources, it is permanent and unlimited. There is about 1.8 × 10¹⁸ kWh of solar energy every year from the sun to the earth, this is about 10 thousand times more than global energy consumption [1]. By the end of 2015, the solar energy used by the United States ranked fourth in the world and by the end of 2016, a 40 GW photovoltaic power system was installed. This was almost double that of 2015 [1]. From February 2016 to January 2017, utility-scale photovoltaic power systems generated energy up to 35.5 TWh, which is 0.92% of the total electricity demand of the United States [1].
Photovoltaic systems convert radiated energy from the sun directly into electrical energy. In this system, there are two curves, which represent the characteristics of the PV system, the I–V and P–V curves. There is a key point on these curves, the maximum power point (MPP), at which the whole PV system works most efficiently and produces its maximum power. To achieve the MPP, the system needs to be tracked. The algorithm used to track the MPP is the maximum power point tracker (MPPT). An MPPT is one of the most important components of PV systems and is used to maintain the PV operating point at its maximum power under many different conditions.
MPPT controllers can be implemented using a conventional method (CM) or combined with soft computing methods (SCM) [2]. The commonly used CMs for MPPT controllers are perturb and observe (P&O), incremental conductance (INC) and hill climbing (HC) [3]. These CMs are capable of tracking the MPP efficiently under normal conditions. However, they cannot handle the problem of partial shading.
Numerous MPPTs dependent on SCM have tried to solve the problem because they can handle nonlinear current–voltage (I–V) or power–voltage (P–V) functions and deal with partial shading [4]. SCM has other benefits in the implementation of MPPT algorithms, they are versatile, robust and fault-tolerant. These SCMs can be classified as artificial intelligence methods (AIM) or bio-inspired methods (BIM). The Artificial Neural Network (ANN), the Fuzzy Logic Controller (FLC) and the Genetic Algorithm (GA) are examples of AIM. Ant Colony Optimization (ACO), Particle Swarm Optimization (PSO), and the Cuckoo Search Algorithm (CSA) are examples of BIM. MPPT controllers can be implemented in many different ways, such as GA [5,6,7,8], ACO [9,10,11,12], ANN [13,14,15,16], PSO [17,18,19,20], and others.
Hadji, Gaubert and Krim [5], proposed a novel, simple and efficient GAs-based MPPT method. The same parameters were used in this study and the concordance of the simulations and experimental results showed the advantage of the proposed MPPT method for a stable and rapid display of the PV module output power. This stability was provided by maximizing the fitness function, whereas the conventional methods search for a minimum. In addition, GAs use a global search for an optimum, which is useful for partial shading.
Titri et al. [9] used MPPT for PV systems under partially shaded conditions and solved the problem using ant colony optimization. The method proposed in the present study was then analyzed and compared to the well-known conventional method, the P&O MPPT controller and to the intelligent controller’s ANN-based MPPT, FLC-based MPPT, adaptive neuron fuzzy inference system (ANFIS)-based MPPT, and PSO based MPPT. The results showed that the proposed ant colony optimization with a new pheromone update (ACO-NPU) MPPT controller gave the best performances in terms of convergence speed, accuracy, stability and robustness. The ACO-NPU MPPT controller can track the MPP quickly and accurately, and there is no oscillation around the MPP in a steady state, this was true for both standard test conditions and for rapidly changing climatic conditions.
Benhala and Ahaitouf [21] studied the hybridization of two metaheuristic techniques, GA and ACO, for dealing with the optimal sizing of analog circuits. These two hybrid algorithms were applied to optimize the performances of two circuits: a CMOS second-generation current conveyor and an operational amplifier. Optimal parameters (transistor width and length), were obtained and the GA, ACO, ACO-GA and GA-ACO algorithms were used to simulate the two CMOS circuits. The viability of the techniques was proved using SPICE simulations. The optimization results showed that the GA-ACO algorithm offered better results in terms of objectives and robustness than the ACO-GA technique. From this, it can be concluded that the GA was well adapted to diversification while the ACO was better for intensification. It was also found that GA-ACO offered the same optimal values as the ACO technique in less time.
Zhao et al. [22] described a novel fused algorithm that employed a GA and ACO for the supplier selection problem. It provided the advantages of a GA and ACO and effectively avoided their defects. Each part of the fused algorithm was improved, and the rational integration of these two algorithms was carefully designed. Three separate instances of a supplier selection problem were implemented for the GA, ACO, and the new fused algorithm to test feasibility and effectiveness. The results showed that the new algorithm was faster than its competitors, and delivered an optimal known value as a solution.
2. Shading Effects of Photovoltaic Module Arrays
The output of any array of solar panels fluctuates with changes in the weather. The shading of any of the cells in a large array will affect the total output because parts of the array are always connected in series [23,24]. Even a drop in the output of a single series-connected cell will affect the current output by the entire system.
The electrical parameter specifications of the SunPower SPR-305NE-WHT-D modules used in this simulation are presented in Table 1. MATLAB software was used to simulate the characteristic output curves. Figure 1 shows the simulated P–V and I–V characteristic curves of a photovoltaic module in standard test conditions (irradiation: 1000 W/m2, air mass: 1.5 and temperature: 25 °C) without shade or with different percentages of shade.

Table 1.
SPR-305NE-WHT-D photovoltaic module specifications.
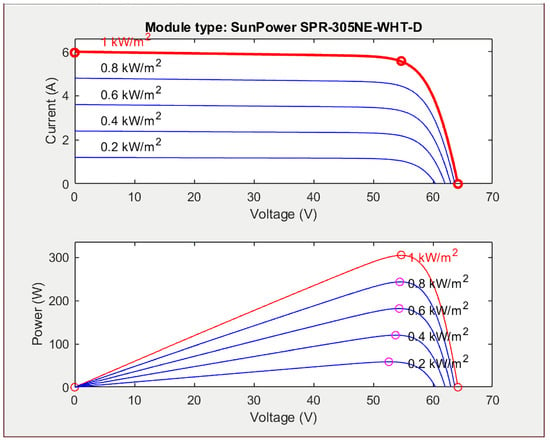
Figure 1.
Current–voltage (I–V) and power–voltage (P–V) characteristic curve of a single photovoltaic module under different percentages of shade.
Figure 2 illustrates the P–V and I–V characteristic curves of a four photovoltaic module array with one module under 50% shade. Consequently, two peaks appear in the P–V characteristic curve of the PV module array and there is a considerable decrease in the maximum power output as shown in the P–V characteristic curve. The marked point is the global maximum power point (GMPP), which has a power value of 907.9 W at 162.5 V. The other peak is the local maximum power point.
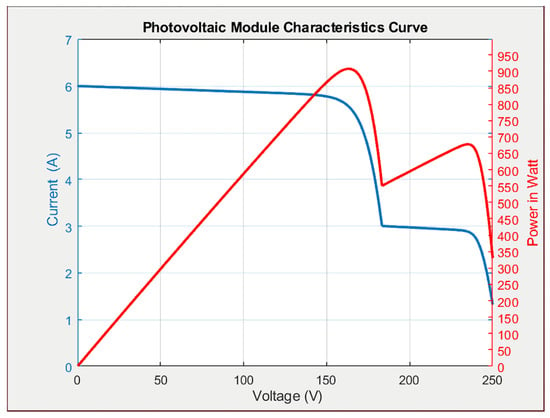
Figure 2.
P–V and I–V characteristic curves of the photovoltaic module array with four series and one parallel structure and with one module under 50% shade.
3. The Proposed MPPT Method
To improve performance, a hybrid MPPT controller based on the GA and the ACO is proposed. GA and ACO are population-based search algorithms that maintain a population of structures as key elements in the design and implementation of problem-solving algorithms. It has both the advantage of GA and the ability to find feasible solutions and avoid premature convergence of ACO. It can search over the subspace and move out of local optima [21].
3.1. The Genetic Algorithm
The Genetic Algorithm (GA) mimics the process of evolution that takes place in living organisms [22]. Searching is performed using a method that is very similar to that proposed by Darwin in his book “On the Origin of Species”, written in 1859, it is similar to the natural selection that happens in all life. The algorithm is based on the chromosome and is coded as such: they are copied, they cross over and they mutate as in life. A gene pool is simulated in the GA and changes over time in response to external pressure. Optimization is based on all biological processes involving chromosomes. This is the “survival of the fittest”. The GA is self-organized, adapted and has an excellent search ability. The GA has no constraints and no mathematical limits. Optimization is global and is free of the problems that limit many other methods. However, GAs do not have a useful method of feedback. They are not very efficient and waste a lot of time making unnecessary iterations even when the solution is within a narrow scope [25]. When there is a lot of data, a GA can take a long time to complete a search [26].
3.2. Ant Colony Optimization
ACO mimics the behavior of a swarm of ants [22]. Real ants leave a trail of pheromones behind them to mark the path along which they are moving. When followers reach a position where those before them have moved in different directions they will take the path with the highest concentration of pheromones, leaving more behind them, this will cause reinforcement. When an ant comes to a place where there is no detectable pheromone it will take another path at random, leaving a new trail. All the foraging ants are affected by the trails of pheromone and their behavior is influenced by the behavior of those that went before them, so is not always random. Ants will follow the highest concentration of pheromone as long as it lasts. This is positive feedback [11]. ACO is one of the BIM and has a number of advantages: it offers parallel computing, self-learning, and good feedback. However, the early stage of an ACO search convergence can be very slow because there is not much information available.
3.3. The Proposed GA-ACO Algorithm for MPPT
In this proposed hybrid GA-ACO MPPT controller, a GA-ACO from Zhao et al. [22] was adopted. GA was used to obtain the best population from their fitness. Every population has several solutions to the global maximum power point. After the best population is selected by using the crossover and mutation method from GA, it is used for an initial solution of ACO. ACO will find the global maximum power point from a population that has the better solutions given by the crossover and mutation from GA. To be a hybrid MPPT controller, the GA and ACO were simplified, respectively, from the reference; this was so that the algorithm was simple enough for MPPT that the calculation time was reduced. Conventional GA and conventional ACO were used for the proposed method, and then both are combined. Reference [22] used self-adaptive crossover and mutation of GA, and used a new updating mechanism of the pheromone in ACO. The reference’s self-adaptive crossover and mutation means that the crossover probability and mutation probability of this GA is changed over time depends on the condition of the generation. Afterward, a new updating mechanism of the pheromone means that the algorithm only updates the optimal solution pheromone. Thus, the algorithm used to update this pheromone is the self-adaptive method.
Furthermore, the proposed method of this paper has a different way to combine GA and ACO compare with the method in [22]. GA and ACO were combined in every loop of the iterations for the proposed method in this paper. After initiating parameters and creating a new generation, select two populations to be parents and reproduce a new population (offspring) by using crossover and mutation. A new population was included in the generation, thus find the best population from the generation. The optimal population was used as the initialization of the ACO. ACO chose one solution from the population based on their pheromone and used it to be an output, then went back to the parent selection step.
On the other hand, Zhao et al. [22] separated the GA loop and ACO loop and then combined them by using the dynamic strategy. The GA loop was stopped and the ACO loop was started depending on the conditions. After initiating parameters and creating a new generation, select two populations to be parents and reproduce a new population (offspring) by using self-adaptive crossover and mutation. The new population was compared with its parents. The best population was included in the generation. Thereafter, the step went back to the parent selection step. The loop was repeated until the maximum iteration is reached or the evolutionary rate was invariant with the early generation. After either was true, the new generation was used as the initialization of the ACO. Thus, the ACO found the optimal solution by using some iterations, which were defined in the initialization parameters at the beginning.
All of those steps will be repeated until the iterations are completed, then the proposed MPPT algorithm is finished. Figure 3 shows the flow chart of the proposed method.
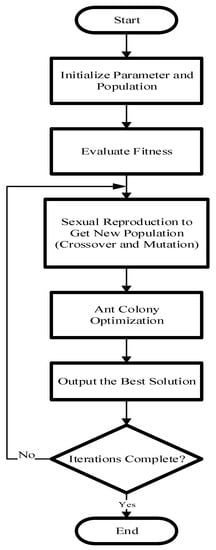
Figure 3.
Flowchart of the GAACO MPPT controller.
- Step 1.
- The parameters for GA and ACO are initialized. The parameters of GA are: the number of iterations (MaxIt), the number of solutions in every population (K), the population size (nPop), crossover percentage (pc), the extra range factor for crossover (gamma), mutation percentage (pm), mutation rate (mu) and tournament size (ts). The parameters for ACO are: the number of ants (Ant), the number of solutions (K), the length of a jump (dx) and the evaporation rate (ρ). After that, the populations are initialized. Every population has K solutions. To initialize the populations, every solution is filled at random by a voltage from zero to a maximum, which is the open-circuit voltage of PV (Voc).
- Step 2.
- All the populations are also calculated by the fitness functions to obtain the cost function of every population.
- Step 3.
- From nPop populations, several populations (based on the ts) will be selected at random. These populations will be compared and the best population will be selected as a parent. A second parent is selected in the same way and thus, both parents crossover and produce offspring that are better than themselves. The number of offspring depends on the pc. Then, in the same way as a crossover, the populations mutate and the number of mutated populations depends on the pm. All of the offspring and mutated populations are used to calculate the cost functions of every new population. The new populations will eliminate the inferior populations and join the next generation. The best populations are selected as an archive of solutions and one will be selected by ACO.
- Step 4.
- To initialize ACO, all solutions from the archive will be used to calculate the fitness. As seen from step 1, all of the solutions from the archive are voltage (Vpv). The fitness of every solution is the power (Ppv) of each voltage (Vpv). The best solutions in the archive are selected, and a pheromone initialization for each solution is performed as follows [9]:
- 1.
- Calculate the distances Di between each Vi solution among the selected solutions (i = 1, …, K) and the best solution Vbest. Vbest is one of the V from the solution which has maximum power point;Di = |Vi − Vbest|
- 2.
- To calculate the pheromone value of each solution, firstly, compute each solution using Gaussian equation φi. By using the Gaussian equation, all of the distances from the shortest to the farthest are revealed. The shortest distance, which is the best solution, will have Gaussian value close to one, whereas the farthest distance which is the worst, will have the Gaussian value close to zero;where t is the standard Gaussian deviation (usually t = 0.5).
- 3.
- The value of the pheromone is computed as follows:
The movement of ants is conditioned by pheromone values τi previously calculated for each solution of the archive. The higher the pheromone value is, the higher probability of the solution will be to attract the ant. The evaporation rate will balance all the pheromone values of each solution from the archive so that the ant will be attracted not only by the highest pheromone, but also by the other solutions. The probability that an ant is attracted to the kth solution is τk.
where Vi is the solution vector of the kth ant at iteration t; Vk (t − 1) is the selected best solution in the solution archive (reference point); dx is a randomly generated variable in [−α, α] to determine the length of the jump.
For each value of voltage Vi, the corresponding value of duty cycle di, which is generated to be an output and is used to control the system, is computed as follows:
- Step 5.
- Steps 3 and 4 are repeated depending on the MaxIt. After iterations have been completed, the MPPT system is finished.
The circuit diagram in Figure 4 shows an implementation of the proposed GA-ACO MPPT method. Four SunPower SPR-305NE-WHT-D PV modules with a maximum power 305.226W connected in series were used. All of the PV modules were given different amounts of irradiation with each simulation to simulate partially shaded conditions. The modules were connected to the DC/DC boost converter, which was controlled by the output PWM from the GA-ACO MPPT controller.
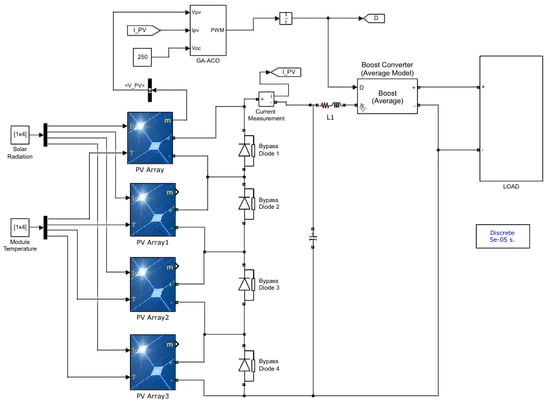
Figure 4.
Circuit diagram of the proposed GA-ACO MPPT controller.
4. Simulation Results
MATLAB was used to simulate the performance of the GA-ACO MPPT controller algorithm and PV modules, and the results obtained were compared with the performance of the P&O MPPT and conventional ACO MPPT methods. The implementation was carried out with four PV modules and with different cases of irradiance, as shown in Table 2. The PV modules were connected in series and the temperature was constant and the same in every case. Each case showed a different number of peaks and the performance of the proposed method was demonstrated clearly in several different cases. The performance was also tested by the changing conditions of the curve in the middle. The results show how many iterations each algorithm needed to reach the global maximum power point (GMPP). The fewer the number of iterations, the better performance will be.

Table 2.
Shade conditions in the four selected test cases.
4.1. Case 1: No Shading
Figure 5 illustrates the P–V and I–V characteristic curves of four PV modules with a maximum power of 305.226 W connected in series without shading. When PV modules are connected in series the voltages are added up and so is the power. Therefore, the voltage and maximum power, as shown in Figure 5, are about four times that of one PV module: 218.9 V and 1217 W. Figure 6 displays the simulation results from the proposed GA-ACO MPPT compared with those from the P&O and conventional ACO MPPTs. The results show that all three MPPT methods could obtain the MPP. However, the proposed GA-ACO MPPT was the first to reach the GMPP, needing only one iteration to reach GMPP while the conventional ACO and the P&O were much slower.
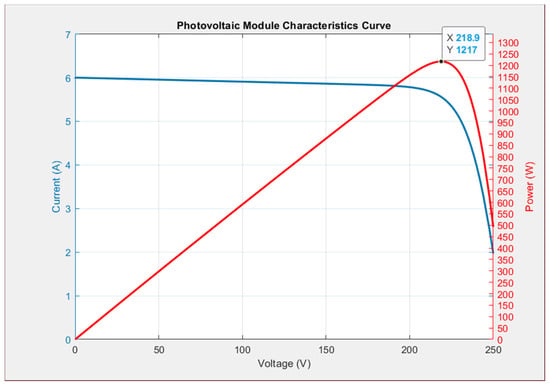
Figure 5.
Simulated P–V and I –V characteristic curve for Case 1.
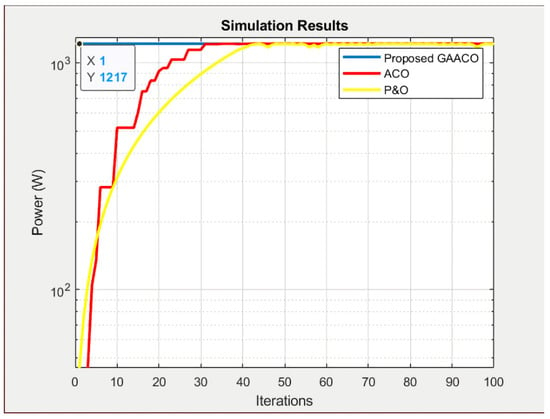
Figure 6.
A comparison of simulation of the proposed GA-ACO MPPT with those from the P&O and conventional ACO MPPTs in Case 1.
4.2. Case 2: 0% Shade + 0% Shade + 20% Shade + 20% Shade
Figure 7 illustrates the P–V and I–V characteristic curves of four PV modules connected in series with two 40% shaded. It also shows that the real maximum power point was the peak 1018 W at 224.7 V. Figure 8 shows that GA-ACO also reached GMPP in only one iteration. The conventional ACO and the P&O methods needed many more iterations.
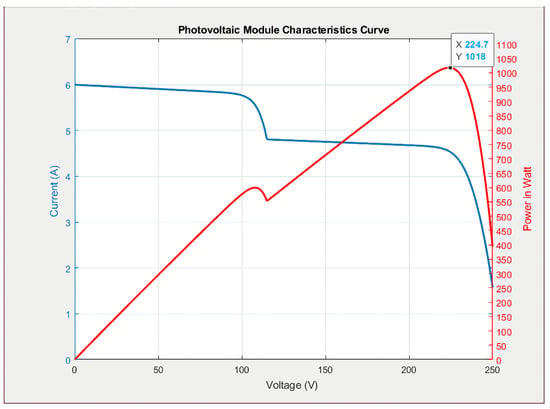
Figure 7.
Simulated P–V and I–V characteristic curves for Case 2.
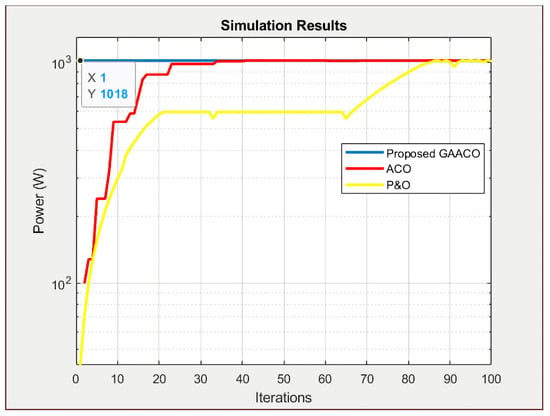
Figure 8.
GA-ACO MPPT simulation results compared with those from the P&O and conventional ACO MPPTs in Case 2.
4.3. Case 3: 0% Shade + 0% Shade + 20% Shade + 70% Shade
Figure 9 shows the simulated P–V and I–V characteristic curves for Case 3. Here, one module was under 20% shade, one under 70% shade and others were not shaded. The result was that the characteristic curve showed three peaks. The real maximum power point (774.1 W) was at 169.4 V. Figure 10 displays the simulation results of MPPT when applying the proposed ACO algorithm, and the P&O and conventional ACO algorithms. The figure depicts very clearly that the GA-ACO reached GMPP in the shortest time. This was true even in the case with three peaks on the P–V curve (see Figure 9), the proposed method needed only two iterations. The conventional ACO and P&O both needed more.
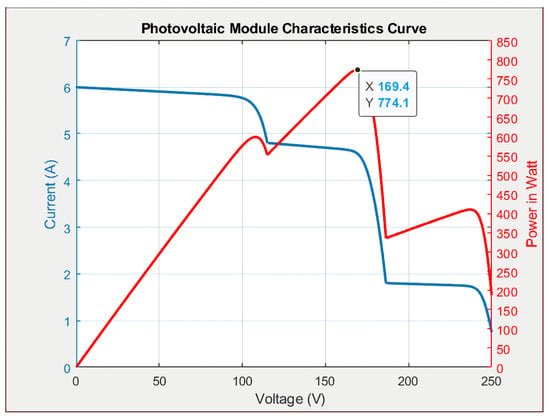
Figure 9.
Simulated P–V and I–V characteristic curve for Case 3.
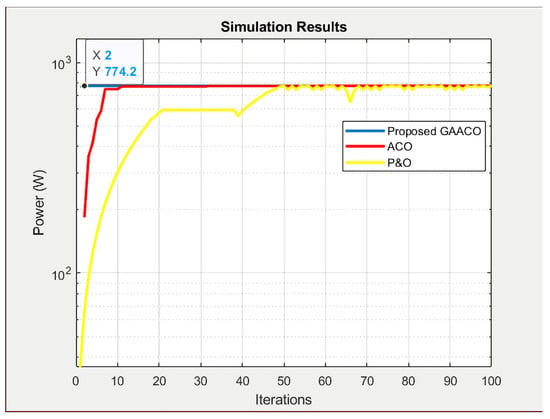
Figure 10.
Simulation results of the proposed GA-ACO MPPT compared with P&O and conventional ACO MPPTs in Case 3.
4.4. Case 4: 0% Shade + 20% Shade + 50% Shade + 70% Shade
Figure 11 displays the simulated P–V and I–V characteristic curves for Case 4 with one module under 20% shade, one under 50% shade, one under 70% shade and the last not shaded. Consequently, there are four peaks in the P–V and I–V characteristic curves. The value of the two are almost the same, 501.7 W and 495 W. This showed that Case 4 was a difficult enough test to determine the robustness of the proposed GA-ACO MPPT and the other two algorithms. Figure 12 shows GA-ACO reached a GMPP value in a short time while the other two algorithms tested could not obtain a GMPP value at all, they were only able to reach local PV module power maxima.
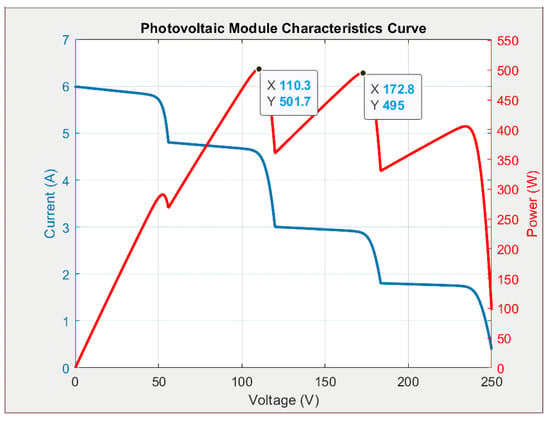
Figure 11.
Simulated P–V and I–V characteristic curves for Case 4.
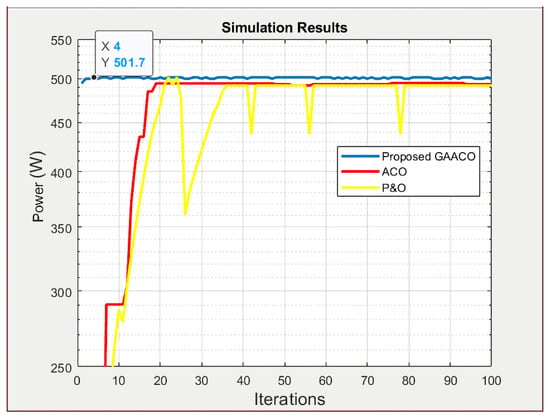
Figure 12.
Simulation results of the proposed GA-ACO MPPT compared with P&O and conventional ACO MPPTs in Case 4.
4.5. Case 5: Case 4 Changed to Case 2
Figure 13 is the simulation results when the changing condition has occurred in the middle. The shading condition is changed from Case 4 to Case 2. The early condition (iteration 1–49) is when Case 4 has occurred to the PV modules. Therefore, the P–V curve of the early condition is the same as the Figure 11. Then, the other condition (iteration 50-100) is when Case 2 has occurred to the PV modules, which means that the P–V curve of the other condition is the same as the Figure 7. As shown in Figure 13, the performance of the proposed GA-ACO MPPT is still the fastest compared with the other two algorithms. In only three iterations, the proposed MPPT could reach the GMPP. In the changed condition (iteration 50–100), the proposed MPPT could reach the GMPP at the first iteration when the ACO MPPT reached the GMPP at the 19th iteration and P&O MPPT at the 27th iteration.
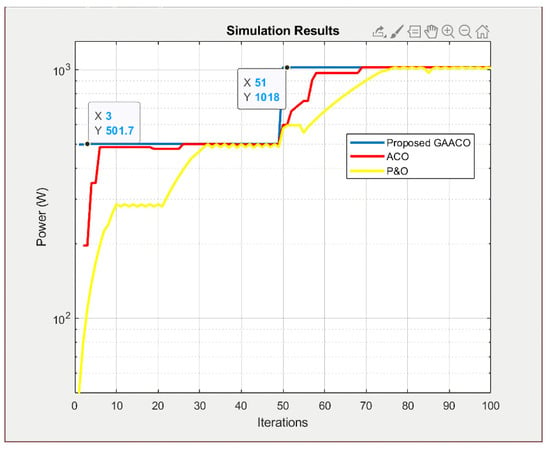
Figure 13.
Simulation results of the proposed GA-ACO MPPT compared with P&O and conventional ACO MPPTs in Case 5 (Case 4 changed to Case 2).
The simulation results showed that the proposed GA-ACO controller method was clearly ahead of both ACO and P&O. The GA-ACO method approached the GMPP at the second iteration in every case. The conventional ACO method needed many more iterations to even approach the GMPP, and the P&O method was stuck at the local maximum power point and could not reach the GMPP at all in some cases. However, as a matter of fact, the more complex the algorithm is, the slower calculation will be. As we conclude from the calculation time comparison table as shown in the Table 3, the proposed GA-ACO MPPT has the slowest calculation time. Meanwhile, the ACO MPPT is faster than P&O MPPT. This calculation time is how long each algorithm takes to finish 100 iterations.

Table 3.
The calculation time comparison.
To compare the proposed hybrid method and different hybrid MPPT controller, the combined particle swarm optimization (PSO) and artificial bee colony (ABC) by Chao, et al. [27] was referred to. The comparison between the proposed hybrid MPPT and existing hybrid MPPT [27] is shown in Table 4. The partial shading conditions that were tested in [27] were one peak, two peaks, three peaks, and four peaks of the P–V curve peaks, yet they were using different PV specifications and different exact irradiances. Their results were compared with the proposed hybrid MPPT, as shown in Table 4. The proposed method is better than the ABC-PSO MPPT method [27] in Case 1 and Case 2. In Case 1 and Case 2, the proposed method is one iteration faster, and two iterations faster, respectively, than the MPPT method proposed in [27]. However, in Case 3, both performances are the same, and the ABC-PSO MPPT [27] is better than the proposed MPPT of this paper in Case 4.

Table 4.
The hybrid MPPT comparison.
In addition, to distinguish the performance of three different MPPT methods, here is the table of performance to conclude all of the simulated algorithms, as shown in Table 5. P&O MPPT is oscillating in every case. The proposed MPPT has ever been oscillating in Case 4, but it is the only algorithm that could reach the GMPP. However, the proposed GA-ACO MPPT has the most complex algorithm compared with the others tested, so the proposed algorithm was the slowest algorithm with almost five times slower compare with the ACO MPPT algorithm, which is the fastest algorithm. Even though the proposed GA-ACO MPPT is the slowest to calculate, the total time of this algorithm to reach the GMPP is the fastest one. As concluded from Table 5, the proposed GA-ACO MPPT was proven to improve the conventional MPPT algorithm.

Table 5.
The performance conclusion comparison.
5. Conclusions
In this study, a hybrid GA-ACO MPPT controller was proposed that had distinct advantages over the existing GMPP of PV modules in use. This proposed method combined two population-based search algorithms to obtain the advantages of both. GA can find viable solutions and avoid hasty convergence. ACO searches subspace and can move out of local optima. The proposed hybrid MPPT controller GA-ACO, based on GA and ACO, proved to be better than the others tested in cases of variations in the percentage of shading.
The GA-ACO MPPT controller was clearly the fastest and approached GMPP at the first iteration in some cases. More than 20 iterations were needed by P&O MPPT and ACO MPPT to reach a solution, and they could not even reach the GMPP at all. Only 10 iterations were needed by GA-ACO MPPT. Sometimes it only needed fewer iterations. GA-ACO MPPT is much faster than the other two algorithms by at least 50%. It is accurate, stable and robust, and reaches the GMPP in a short time, even in the most difficult cases.
Author Contributions
K.-H.C., planned the project and performed the writing, editing and review. He also conducted the analysis and optimized the intelligent algorithm. M.N.R. was responsible for data curation, software and experimental corroboration. K.-H.C., administered the project. All authors have read and agreed to the published version of the manuscript.
Funding
The authors gratefully acknowledge the support and funding of this project by Ministry of Science and Technology, Taiwan, under the Grant Number MOST 108-2622-E-167-018–CC3.
Institutional Review Board Statement
Not applicable.
Informed Consent Statement
Not applicable.
Data Availability Statement
This study did not report any data.
Conflicts of Interest
The authors of the manuscript declare no conflict of interest.
Nomenclature
| Acronyms | |
| MPPT | maximum power point tracking |
| PV | photovoltaic |
| MPP | maximum power point |
| P–V | power–voltage |
| I–V | current–voltage |
| SCM | soft computing method |
| GA | genetic algorithm |
| ACO | ant colony optimization |
| P&O | perturb and observe |
| CM | conventional method |
| INC | incremental conductance |
| HC | hill climbing |
| AIM | artificial intelligence method |
| BIM | bio-inspired method |
| ANN | artificial neural network |
| FLC | fuzzy logic controller |
| PSO | particle swarm optimization |
| CSA | cuckoo search algorithm |
| ANFIS | adaptive neuron fuzzy inference system |
| ACO-NPU | ant colony optimization with new pheromone update |
| GMPP | global maximum power point |
| Symbols | |
| MaxIt | the number of iterations |
| K | number of solutions in every population |
| nPop | population size |
| pc | crossover percentage |
| ts | tournament size |
| Ant | number of ants |
| dx | length of a jump |
| ρ | evaporation rate |
| Voc | open-circuit voltage of PV |
| Vpv | voltage value of all the solutions from the archive |
| Ppv | the fitness of every solutions, also the power value of every solutions |
| Di | distances between each Vi solution among the selected solutions (i = 1 … K) |
| Vi | solution from the archive (i = 1 … K) |
| Vbest | one of the V from the solution which has maximum power point |
| Φi | Gaussian value |
| t | standard Gaussian deviation |
| τi | pheromone value |
| Vk (t − 1) | the selected best solution in the solution archive (reference point) |
| α | variable to determine dx |
| di | the corresponding value of duty cycle |
References
- Precup, R.; Kamal, T. Solar Photovoltaic Power Plants; Springer: Singapore, 2019. [Google Scholar]
- Kashif, I.; Zainal, S. A review of maximum power point tracking techniques of PV system for uniform insolation and partial shading conditions. Renew. Sust. Energy Rev. 2013, 19, 475–488. [Google Scholar]
- Islam, H.; Mekhlief, S.; Shah, N.B.M.; Soon, T.K.; Seyedmahmousian, M.; Horan, B.; Stojcevski, A. Performance evaluation of maximum power point tracking approaches and photovoltaic systems. Energies 2018, 11, 365. [Google Scholar] [CrossRef]
- Ali, A.; Almutairi, K.; Malik, M.Z.; Irshad, K.; Tirth, V.; Algarni, S.; Zahir, M.d.H.; Islam, S.; Shafiullah, M.; Shukla, N.K. Review of online and soft computing maximum power point tracking techniques under non-uniform solar irradiation conditions. Energies 2020, 13, 3256. [Google Scholar] [CrossRef]
- Hadji, S.; Gaubert, J.P.; Krim, F. Real-time genetic algorithms-based MPPT: Study and comparison (theoretical and experimental) with conventional methods. Energies 2018, 11, 459. [Google Scholar] [CrossRef]
- Kumar, P.; Jain, G.; Palwalia, D.K. Genetic algorithm based maximum power tracking in solar power generation. In Proceedings of the 2015 International Conference on Power and Advanced Control Engineering (ICPACE), Bangalore, India, 12–14 August 2015; pp. 1–6. [Google Scholar]
- Badis, A.; Mansouri, M.N.; Boujmil, M.H. A genetic optimized MPPT controller for a PV system with DC-DC boost converter. In Proceedings of the 2017 International Conference on Engineering & MIS (ICEMIS), Monasir, Tunisia, 8–10 May 2017; pp. 1–6. [Google Scholar]
- Daraban, S.; Petreus, D.; Morel, C. A novel MPPT (maximum power point tracking) algorithm based on a modified genetic algorithm specialized on tracking the global maximum power point in photovoltaic systems affected by partial shading. Energy 2014, 74, 374–388. [Google Scholar] [CrossRef]
- Titri, S.; Larbes, C.; Youcef Toumi, K.; Benatchba, K. A new MPPT controller based on the ant colony optimization algorithm for photovoltaic systems under partial shading conditions. Appl. Soft Comput. 2017, 58, 465–479. [Google Scholar] [CrossRef]
- Ramasamy, S.; Vishnuram, P.; Bindu, D.H.; Divya, A. Ant colony optimization based maximum power point tracking (MPPT) for partially shaded standalone PV system. Int. J. Eng. Tech. 2016, 9, 8125–8133. [Google Scholar]
- Rajalashmi, K.; Carolin, C. Maximum power point tracking using ant colony optimization for photovoltaic system under partially shaded conditions. Int. J. Eng. Advan. Tech. 2018, 8, 82–87. [Google Scholar]
- Priyadarshi, N.; Ramachandaramurthy, V.K.; Padmanaban, S.; Azam, F. An ant colony optimized MPPT for standalone hybrid PV-wind power system single cuk converter. Energies 2019, 12, 167. [Google Scholar] [CrossRef]
- Bouselham, L.; Hajji, M.; Hajji, B.; Bouali, H. A new MPPT-based ANN for photovoltaic system under partial shading conditions. Energy Procedia 2015, 111, 924–933. [Google Scholar] [CrossRef]
- Quoc, D.P.; Dinh, K.L.; Lee, H.; Phuong, L.M.; Vu, N. The new MPPT algorithm using ANN-based PV. In Proceedings of the 2010 International Forum on Strategic Technology (IFOST), Ulsan, South Korea, 13–15 October 2010; pp. 402–407. [Google Scholar]
- Rizzo, S.A.; Scelba, G. ANN based MPPT method for rapidly variable shading conditions. Appl. Energy 2014, 145, 124–132. [Google Scholar] [CrossRef]
- Sedaghati, F.; Nahavandi, A.; Badamchizadeh, M.A.; Ghaemi, S.; Fallah, M.A. PV maximum power point tracking by using artificial neural network. Math. Prob. Eng. 2012, 2012, 506709. [Google Scholar] [CrossRef]
- Chao, K.H.; Lin, Y.S.; Lai, U.D. Improved particle swarm optimization for maximum power point tracking in photovoltaic module arrays. Appl. Energy 2015, 158, 609–618. [Google Scholar] [CrossRef]
- Kashif, I.; Zainal, S.; Muhammad, A.; Saad, M. An improved particle swarm optimization (PSO) based MPPT for PV with reduced steady state oscillation. IEEE Trans. Power Electron. 2012, 27, 3627–3638. [Google Scholar]
- Abdulkadir, M.; Yatim, A.H.M.; Yusuf, S.T. An improved PSO-based MPPT control strategy for photovoltaic systems. Int. J. Photoen. 2014, 7, 1–11. [Google Scholar] [CrossRef]
- Alshareef, M.; Lin, Z.; Ma, M.; Cao, W. Accelerated particle swarm optimization for photovoltaic maximum power point tracking under partial shading conditions. Energies 2019, 12, 623. [Google Scholar] [CrossRef]
- Benhala, B.; Ahaitouf, A. GA and ACO in hybrid approach for analog circuit performance. In Proceedings of the International Conference on Multimedia, Computing and Systems (ICMCS), Marrakesh, Morocco, 14–16 April 2014; pp. 1590–1595. [Google Scholar]
- Zhao, F.T.; Yao, Z.; Luan, J.; Song, X. A novel fused optimization algorithm of genetic algorithm and ant colony optimization. Math. Prob. Eng. 2016, 2016, 2167413. [Google Scholar] [CrossRef]
- Eekpenyong, E.E.; Anyasi, F.I. Effect of shading on photovoltaic cell. IOSR J. Electric. Electron. Eng. 2013, 8, 1–6. [Google Scholar]
- Teo, J.C.; Rodney HGTan Mok, V.H.; Vigna, K.R.; Tan, C. Impact of partial shading on the P-V characteristics and the maximum power of a photovoltaic string. Energies 2018, 11, 1860. [Google Scholar] [CrossRef]
- Peng, P.F. Improvement and simulation of ant colony algorithm based on genetic gene. Comput. Eng. Applicat. 2010, 46, 43–45. [Google Scholar]
- Zhu, Q.; Chen, S. A new ant evolution algorithm to resolve TSP problem. In Proceedings of the 6th International Conference on Machine Learning and Applications (ICMLA), Cincinnati, OH, USA, 13–15 December 2007; pp. 62–66. [Google Scholar]
- Chao, K.H.; Hsieh, C.C. Photovoltaic Module Array Global Maximum Power Tracking Combined with Artificial Bee Colony and Particle Swarm Optimization. Electronics 2019, 8, 603. [Google Scholar] [CrossRef]
Publisher’s Note: MDPI stays neutral with regard to jurisdictional claims in published maps and institutional affiliations. |
© 2021 by the authors. Licensee MDPI, Basel, Switzerland. This article is an open access article distributed under the terms and conditions of the Creative Commons Attribution (CC BY) license (https://creativecommons.org/licenses/by/4.0/).