Abstract
Electricity transmission in a grid-connected system provides an effective solution to promoting clean energy accommodation. However, with arbitrary determination in current operation models, the clean energy utilization ratio (CEUR) is not satisfactory largely due to the lack of electricity curtailment (the electricity equivalent of clean energy curtailment) cost-dependent optimization. In this study, a curtailment cost-dependent multi-objective operation (CCMO) model was proposed to complementarily operate a grid-connected hybrid energy system, identify optimal CEUR, and thus maximally reduce electricity curtailment. The CCMO model centers on coupling the punishment cost of electricity curtailment with the multi-objective function defined as the total cost of each grid component. The CCMO model was solved to derive the optimal equilibrium solution determined based on multiple non-dominated solutions. A grid-connected hybrid energy system including the Yunnan, Guangdong, and Guangxi Power Grids was used to test the model performance. The results showed that the CCMO model’s CEUR was up to 100% at hourly scale and 96.9% on daily average, which were both significantly higher than those in the current operation models. Furthermore, the CCMO’s optimal equilibrium solution, i.e., respective minimum total cost of each grid component, can also identify optimal transmission schemes of the daily channel utilization to make the peak utilization hours largest.
1. Introduction
As the global demand for energy continues to rise, we are facing increasing pressure on both energy and environment [1,2]. Traditional power generation relies heavily on fossil fuel, which deteriorates the environment and results in resource shortages. In recent decades, it has become increasingly important to develop clean energy and reduce fossil energy consumption, so as to slow down global warming [3,4]. Clean energy is defined as non-carbohydrate energy mainly including hydro energy, solar energy, and nuclear energy, which does not emit or rarely emits greenhouse gases and pollutants [5,6]. Renewable energy plays an important role in the transition to clean energy, and its deployment has seen continuous improvement worldwide throughout the last few decades. Renewable energy provided 18% of the European Union’s gross energy consumption in 2018 [7], and about 11.4% of the total energy consumption of the U.S. in 2019. Furthermore, China’s power generation capacity of renewable energy had reached 706 GW by the autumn of 2018 with a year-on-year increase of 12%. It was reported that China’s energy structure would gradually shift to clean power generation [8].
Since electricity is the major form of energy transmission, power grids are the focus of clean energy accommodation. With the development of hydropower generation and new energy technology, a greater number of countries have formulated clean energy development goals [9]. Although clean energy has the advantages of low operating cost and zero pollution, substantial electricity curtailment (referring to the electricity equivalent of clean energy curtailment) frequently occurs in power grids, due to the feature of difficult storage in clean energy accommodation. It is challenging to solve the accommodation problem in power generation systems for two main reasons [10]. First, wind and solar power plants are characterized by randomness, intermittence, and fluctuation, yet extra clean energy often has to be abandoned due to the lack of storage equipment [11]. Second, hydropower plants frequently serve as peak regulation plants, due to their features of flexible start-stop controlling and simple state transformation. Peak regulation of hydropower plants during flood periods results in substantial electricity curtailment in the off-peak power load, when the inflow water is abundant [12]. The electricity curtailments related to water, wind, and solar energy in China in 2019 were approximately 30, 169, and 46 billion kWh, respectively. Overall, the clean energy utilization ratio (CEUR) in hybrid energy systems is expected to improve.
Generally, hybrid energy systems are classified into stand-alone and grid-connected types [13]. The former generates and stores energy to use for local demand, whereas the latter can transmit electricity among power grids to satisfy external demand. Accordingly, traditional approaches to improving the CEUR primarily rely on local and grid-connected utilization approaches. In the local utilization approach, power plants in each power grid are separately operated [14,15]. For example, by optimizing the operation mode of pumped storage power plants, Liu et al. [16] reduced the hydropower curtailment related to peak regulation during flood periods and thus enhanced the water utilization efficiency. Furthermore, Liu et al. [17] developed a mid-to-long-term optimal operation model, taking minimizing hydropower curtailment as the operation objective in order to improve the power energy where affluent hydropower exists. Although the above studies improved the CEUR by optimizing the operation mode of power plants to some extent, the operation was limited in the same power grid.
Transmission outside the local grid serves as the other way to improve the CEUR, which is achieved by transferring surplus clean energy to other power grids via transmission channels [18,19]. The grid-connected power system is an important framework in energy interconnection and provides an effective way to promote the accommodation of clean energy [20,21,22]. Related operation models were used in previous studies. Saiprasad et al. [23] and Perez et al. [24] analyzed grid-connected photovoltaic technology for a case in Australia. Ahmet and Aktas [25] conducted operational decisions of a hybrid energy system by considering profit obtained from system operations and the renewable energy utilization ratio in load demand satisfaction. Nevertheless, the highly simplified representation of these optimal operation models cannot depict the real operation state of grid-connected systems, and thus limits their capacity in improving the CEUR [26,27]. For example, these models only consider the energy system to include one sending-end and one receiving-end, whereas there may be multiple sending- or receiving-ends in practice. In addition, the difference between the power generation for sending-ends and the loading for receiving-ends has not been taken into account for various typical days, which makes these models only available for mid-to-long-term but not short-term modeling.
Overall, current investigation on technologically facilitating clean energy accommodation primarily focuses on complementary operation models with simplified structure to determine the utilization schemes of low electricity curtailment. However, these models do not explicitly consider the link between the clean energy curtailment and the optimization operation and thus cannot identify the optimal accommodation operation frequently, especially in some special circumstances in practice. For example, these models are invalid when the receiving-end grid requires stable transmission to offset the base load of power, and/or peak regulation to relieve the initial pressure. By contrast, only concentrating on the demand of receiving-ends is also impractical, caused by the lack of power transmission capacity of sending-ends. Consequently, in the context of grid-connected hybrid energy systems, a satisfactory complementary operation model to obtain the optimal CEUR should be coupled with the electricity curtailment cost-dependent operation strategy, which takes the transmission capacity of both the sending- and receiving-ends and the quantitative CEUR into account.
To address the problem above, this study aimed to establish an innovative short-term curtailment cost-dependent multi-objective operation (CCMO) model for optimizing the CEUR in grid-connected hybrid energy systems. The CCMO model explicitly coupled the electricity curtailment cost into the multi-objective function, defined as the total cost of each power grid component. It also greatly improved the search space of cost-based object variables by introducing the dynamic decision variable of the spinning reserve constraint. To match the complexity of the multi-objective function, the model was solved using the state-of-the-art Niche Multi-Objective Particle Swarm Optimization (NMOPSO) algorithm, and diagnosed by the multi-attribute decision-making Technique of Order Preference by Similarity to an Ideal Solution (TOPSIS). The proposed model is promising in the complicated grid-connected hybrid energy system owing to its compatibility to any numbers of power grid and receiving/sending ends, as well as optimal transmission channel power. Typically, the model would be useful to facilitate the CEUR via optimally operating multiple power grids in the West-to-East Power Transmission Project of China. The outline of this paper is as follows. The construction, optimization scheme, and decision-making scheme of the CCMO model are described in Section 2, Section 3 and Section 4, respectively. Next, our case study is described and analyzed in Section 5. Finally, the primary conclusions are given in Section 6.
2. Construction of the CCMO Model
The model structure complies with the power balance principle and is represented by the programming model. The structure and solution of the CCMO model are displayed in the flowchart in Figure 1. The structure of the proposed model was achieved with two modules, which contain the objective function and the constraint conditions. In the objective function, the punishment cost associated with electricity curtailment was coupled with the multi-objective function, i.e., the total power generation cost of each power grid component, so as to ensure the priority of clean energy accommodation. In addition, the solution process included optimization and decision steps.
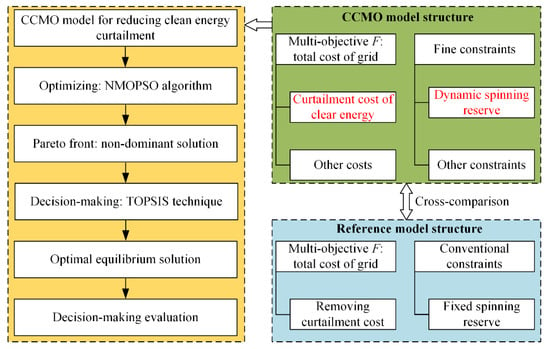
Figure 1.
Flowchart of constructing and solving the curtailment cost-dependent multi-objective operation (CCMO) model (text in red color highlights the modification of the improved operation model; F represents the multi-objective function).
2.1. Multi-Objective Function Coupled with Punishment Cost of Electricity Curtailment
In the model construction, it was assumed that each power grid in a system complies with the minimum total cost principle, as different power grids are subject to different requirements. Therefore, the total cost of each power grid component contributes to one of the object variables. The optimization problem of clean energy accommodation existing in a grid-connected system is a typical multi-objective optimization and decision-making problem. This is because the complexly high-dimensional and non-linear relationship between sending- and receiving-end grids is inherent in the total cost since the generated output is non-linearly and negatively correlated with the cost of the sending- or receiving-end grid. Specifically, to understand the non-linear relationship above, two conflicts constrained by the cost and power generation were taken as examples. First, for the receiving-end grid, transmitting electricity into other grids cannot only increase the CEUR, but also produce electricity benefits, thereby indirectly reducing the total cost. However, persistently increasing the transmission rate of power will not always benefit the entire system, as it may force fossil fuels to be used for power generation and the resulting cost will increase. Therefore, the power generation output of the receiving-end has one or more critical thresholds. Second, for the sending-end grid, the access to clean energy provides an alternative to the sending-end plant for regulating peaks or basic loads, which significantly reduces the power generation and cost of highly energy-wasting plants. However, if taking the power price into consideration, the power generation jointed into other grids needs to be paid as the market price, and may indirectly increase the total cost. Thus, the optimal ratio of clean energy to total energy in the sending-end also has one or more critical thresholds.
The multi-objective function used in the CCMO model, which can theoretically be used for the grid-connected power system with any number of power grids, is introduced as follows:
where fi is the total cost for the ith power grid, i = 1, 2, …, G, and G denotes the number of power grid components connected with others; fi can be calculated from the punishment cost of electricity curtailment , the cost of fossil () and pumped storage () power plants, the expenditure for input from the sending-end grid (), and the income by selling power generation transmitted to the receiving-end () (see Equation (2)). The cost of conventional hydropower and new energy power plants has been ignored here, and the cost of nuclear power plants has also been ignored due to their limited capacity in peak regulation, fixed cost related to restrict operation regulation mode, and low optimization flexibility of power generation. Each item on the right side of Equation (2) can be further partitioned into detailed cost calculations according to their individual characteristics.
(1) Punishment cost of electricity curtailment
To quantitatively link the clean energy accommodation and the cost of power grids, punishment due to electricity curtailment was explicitly considered in the multi-objective function. The punishment was identified using the cost in order to maintain the dimensional consistency of the multi-objective function. It is worth noting that the clean energy associated with curtailment just includes hydropower, solar, and wind energy, and these types of energy are frequently abandoned due to their power generation features in the context of complementary operation with arbitrary determination for CEUR. The punishment cost contributes to the multi-objective function as follows:
where l = 1, …, Ji, n = 1, …, Ni, and m = 1, …, Mi, which represent the number of power plants in the ith power grid, respectively; , , and denote the generated output of the lth normal hydropower plant, nth wind power plant, and mth solar power plant, respectively; and are the predicted maximum generated output of the nth wind power plant that is related to the forecasted wind speed and mth solar power plant that is related to the forecasted solar radiation intensity, respectively; is the available electricity during the operation period; , , and denote the punishment coefficients of unit electricity curtailment related to water, wind, and solar energy, respectively; and T denotes the number of time steps.
Next, the CEUR, used to evaluate the clean energy accommodation, is defined as the ratio of identified optimal average clean energy amount transformed into electricity to the theoretical maximum value under complete accommodation.
(2) Operation cost of thermal power plant
Although characterized with non-clean energy, the thermal power plant has not been completely replaced by clean energy due to its conventional and longstanding role in energy supply. Thus, in practical operation, thermal power, whose operational cost can be written as Equation (4), is reserved as a necessary component of hybrid energy.
where , , and denote the cost related to burning coal or gas fuel for thermal power, the punishment cost of carbon emission and pollution emission, and the cost of starting and stopping equipment, respectively.
(3) Operation cost of pumped storage power plant
As a kind of battery equipment, the pumped storage power plant was taken into consideration in the Guangdong Power Grid in this study. It was used to regulate the peak and basic loading of the thermal power plant, which can save more cost compared with that of the hydropower plant. The operation cost of a pumped storage power plant can be expressed as
where ppu represents the operation cost of unit pumped water for a pumped storage power plant; is the pumping power of the hth pumped storage power plant in the ith power grid during time interval t; and Hi denotes the number of pumped storage power plants.
(4) Expenditure cost related to purchasing electricity
The expenditure cost related to purchasing electricity is
where and are the unit price purchasing electricity and purchased total electricity during operating period, respectively; and is the receiving power of the yth channel connected with other power grids in the ith power grid during time interval t.
(5) Income related to selling electricity
The income related to selling electricity is
where and are the unit price for selling electricity and the total electricity transmitted outside during the operating period; and denotes the sending power of the yth channel connected with other power grids in the ith power grid during time interval t.
2.2. Constraints of the CCMO Model Using Dynamic Spinning Reserve
Constraints of the operation model reflect the assumptions, which determine to what extent the developed model is reasonable and available. Compared with other contemporary models, the assumptions in the present study were highly softened by introducing a dynamic decision variable into the spinning reserve constraint. Thus, the constructed model was improved with enhanced applicability so that it supports a wider search space of cost-based object variables for quantifying the optimal CEUR. The constraints can be classified into system constraints and power plant constraints.
- (1)
- Constraints related to the system
- Power balance constraint
The power balance constraint is expressed as
where , , , , and represent the generated output of the lth regular hydropower plant (out of a total of Ji), kth nuclear power plant (out of a total of Ki), nth wind power plant (out of a total of Ni), mth solar power plant (out of a total of Mi), and hth pumped storage power plant in the ith power grid.
b. Spinning reserve constraint
The dynamic spinning reserve constraint is expressed as
where and represent the capacity demand of positive and negative spinning reserves of the ith power grid during the time interval t, respectively; , , and denote the upper generated output limit of the jth thermal power unit, lth hydropower plant, and hth pumped storage power plant, respectively, and and are the lower generated output limit of the jth hydropower plant and hth pumped storage power plant, respectively. In previous studies, the spinning reserve was constrained to fixed constants which were determined by the proportion of installed capacity of the thermal power, hydropower, and pumped storage power plants. The operation model with fixed spinning reserve constraint used in previous studies was taken as the reference model in the present study.
c. Channel capacity constraint
The channel capacity constraint is expressed as
where and , respectively, denote the lower and upper power limit of the yth channel in the ith power grid, respectively.
- (2)
- Constraints related to the power plants
- Constraints of thermal power plants
First, the generated output constraint is the primary constraint of a power plant, which can be expressed as for the thermal power plants. Si,j,t was used to label the start-stop state of thermal power units, with 0 for stopping state and 1 for starting state. The climbing constraint reflects the gradient of power generation change in time:
where and , respectively, denote the increasing and decreasing slopes of the jth thermal power unit in the ith power grid.
Second, the minimal persistent time constraint of start-stop states is used to guarantee the minimum running time once a thermal power unit starts and the minimum non-operation time once a unit stops. To simplify the subsequent searching difficulty in the optimization step, the minimum running or non-operation time is set to integral multiples of the unit time step of the operation period.
Third, the upper limit constraint of power generation from thermal power exists due to the limitation of coal or gas reserves, and it can be expressed with the formula , where is the upper limit of the jth thermal power unit in the ith power grid.
b. Constraints of hydropower plants
First, for hydropower plants, the generated output constraint can be written as .
Second, the available power generation constraint exists because the hydropower plant is constrained by inflow, reservoir capacity, and water head conditions. The available power generation is frequently identified by the inflow forecast of the next day, which can be predicted by the maximum power generation model. Thus, the actual electricity is subject to , with denoting the available electricity during the operation period of the lth hydropower plant in the ith power grid.
c. Constraints of nuclear power plants
First, for nuclear power plants, the generated output constraint is , where and , respectively, denote the maximal and minimal generated output of the kth nuclear power plant in the ith power grid.
Second, the peak regulation constraint is another key constraint. Nuclear power plants are characterized using base load regulation most of the time and not allowing for drastic fluctuations, since their generated output largely depends on the reactors. Thus, the peak regulation capability is very limited, with the following format:
where and are, respectively, the maximal and minimal generated output of the kth nuclear power plant in the ith power grid during the operation period t, and is the maximal peak regulation ratio of the kth nuclear power plant.
Third, the actual power generation constraint is another key condition. Since the nuclear power plants do not allow for flexible operation, they are operated strictly according to the power generation planning. The power generation constraint for nuclear power plants can be written as , where is the planning of the kth nuclear power plant in the ith power grid.
d. Constraints of pumped storage power plants
For pumped storage power plants, the generated output constraint is similar to the other plants mentioned above. Furthermore, the pumped water is constrained by the reservoir capacity, which is associated with the pumped water constraint. In addition, the energy transformation constraint is related to the energy loss in the operation, which is related to the energy transformation constraint.
e. Constraint of new energy plants
The generated output constraint is the main constraint of new energy plants, which can be expressed as , where and denote the maximum generated output of the nth wind power plant and mth solar power plant, respectively, in ith power grid; and and denote the corresponding minimum values.
3. Optimizing the CCMO Model Based on NMOPSO Algorithm
The CCMO model is high-dimensional, nonconvex, and nonlinear. Therefore, traditional algorithms, including both linear and nonlinear programing, and dynamic programing, are unable to solve the model. To solve this problem, we introduced the NMOPSO algorithm in this study to search the object variable space of CCMO to simulate the grid-connected hybrid energy system. NMOPSO was developed very recently with the advantages of simple calculation, fast convergence, and easy realization, and thus is frequently used to solve the traditional optimal operation problems in power grid systems [28,29]. In the implementation of NMOPSO, the constraints were defined as punishment functions, which would be added into the original objective function when the constraints were violated. The detailed construction steps of NMOPSO are listed as follows.
Step 1: Construct the decision vector using the generated output over all power plants and all power grids during a time period. In the vector, i and n are subscripts of the power grid and power plants or unit; Ni denotes the number of units in the ith power grid; Xi,n is the generated output over all time steps in the ith power grid. Defining t as the tth time step out of a total of T time steps during the peak regulation period, Xi,n can be further decomposed in the temporal scale with .
It is worth noting that in this step, it is unnecessary to set the start-stop states of units and the channel power as decision variables. This is because the start-stop states can be derived from the generated output of a unit, with zero for stop state and non-zero for start state, and the channel power can be derived according to the power balance of each power grid (Equation (13)). In addition, the total output power and total input power cannot be positive/negative at the same time, since it is impossible in practice for a power grid to simultaneously send output into and receive input from other grids.
where and , respectively, represent the total sending power and total receiving power during time t in the ith power grid.
Step 2: Initialize population. Generate the initial particle population using the uniform design method in order to distribute the particles uniformly in the solution space.
Step 3: Initialize calculation, including estimating initial objective matrix, initial non-dominated solutions among various particles, external archive for the initial non-dominated solution sets, and current optimal position of each particle pbest.
Step 4: Calculate the ratio of adaptive values S(Yii,jj) (see Equation (14)) that belongs to the non-dominated solutions using the sharing fitness function O(Yi, Yj) (see Equation (15)) for N non-dominated solutions.
where N, ii, and jj are the subscripts used for non-dominated solutions, denotes the Euclidean distance between any two non-dominated solutions, and r is the niche radius. In addition, select the non-dominated solution under a probabilistic condition, using the roulette method to randomly select a position in the external archive as the current optimal position gbest.
Step 5: Update the speed and position of the current particle.
Step 6: Calculate the object vector for each particle, and mix the current particle population with the external archives to quantify the non-dominant solution. Next, update the external archives, in which the number of non-dominant solution is denoted as N.
Step 7: Quantify the adaptive value of the non-dominant solution in external archives.
Step 8: According to the non-dominant principle, update the current optimal position of the particle, pbest.
Step 9: If the iterative number s < the upper limit smax, return to Step 4. Otherwise, the optimization is achieved, and the results are output.
4. Optimal Equilibrium Solution Decided Based on TOPSIS
The non-dominated solutions obtained by solving the CCMO model can be regarded as the approximate Pareto front, i.e., the mapping from the Pareto solution to the objective space. To further derive the optimal equilibrium solution, TOPSIS, a technique of multi-attribute decision-making was introduced and exploited in this study to select the optimal equilibrium solution and make a decision. The compromised solution concept was used to implement TOPSIS, which implies having to make a concession to reach an agreement. The weighting coefficients play an important role in the decision making, but they are difficult to configure due to their subjectiveness. To reduce the influence from the preference of decision makers, the entropy weight method was applied to determine the weighting coefficients of evaluation indices related to the model objectives constructed in Section 2.1. The application steps of TOPSIS were as follows.
Step 1: Construct the evaluation matrix using the approximate Pareto fronts generated by solving the CCMO model.
where fm,i is the value of the ith index of the mth evaluation individual; and G and M denote the power grid number (i.e., the objective or index number) and the non-dominated solution number in approximate Pareto fronts (i.e., the individual numbers to evaluate), respectively.
Step 2: Normalize the evaluation matrix using the formula in Equation (18), considering that the objectives in the model belong to cost indices, and lower values indicate better performance.
Accordingly, the normalized evaluation matrix can be expressed as
Step 3: Calculate the weighting coefficient of each index using the entropy weight method. The entropy value and weight can be written as Equations (20) and (21), respectively.
Step 4: Determine the value matrix (VM,G) via the weight matrix (W).
Step 5: Determine the positive and negative ideal solutions using Equations (23) and (24), from which the Euclidean distance of each evaluation individual () can be derived.
Step 6: Derive the relative proximity degree (PD) of evaluation individuals as follows.
The solution that has maximum PD is the final optimal equilibrium solution.
5. Case Study
A scaled-down grid-connected hybrid energy system (see the schematic in Figure 2) was considered as a prototype for applying the established CCMO model combined with optimization and decision algorithms to identify the optimal CEUR. The hybrid energy consisted of six energy components. Except for one thermal power component, the other five components were all clean energy, including nuclear power, hydropower, pumped storage power, wind power, and solar power. To improve the CEUR, the thermal power plant was operated to decrease and was limited by a theoretical minimum constraint. The case study of a grid-connected system containing one sending-end and two receiving-ends, as introduced in Section 5.1, was explored to concisely verify the performance of the CCMO model.
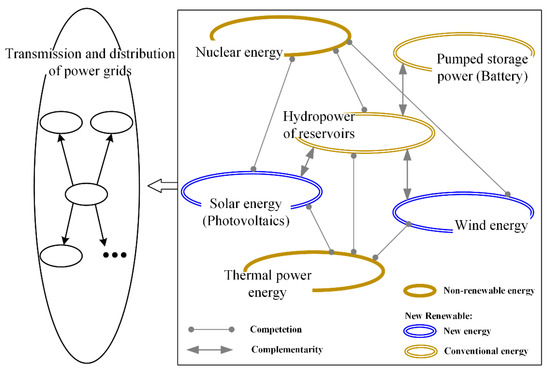
Figure 2.
Schematic of the grid-connected hybrid energy system.
5.1. Data Sources
Yunnan Province, located in Southwest China, is one of the country’s biggest adopters of clean energy. The installed capacity of hydropower plants and new energy plants contributes approximately 70% and 12% of the total installed capacity in this province, respectively. Although incorporating clean energy into the power grid benefits the development of green power as well as energy conservation and emission reduction, substantial electricity curtailment exists. It was reported that the hydropower curtailment for Yunnan Province in 2017 was up to 28.7 billion kWh [30,31]. In accordance with the power regime revolution of the Develop-the-west Strategy in China, the power generated in western areas has been increasingly transmitted into eastern areas. As the primary base of the West-to-East Power Transmission Project, Yunnan Province not only transports persistently clean energy but also alleviates the problem of insufficient utilization of local clean energy. Thus, a local power grid in the central area of Yunnan, from which power is transmitted into power grids of Guangdong and Guangxi Provinces, was taken as the study case.
5.2. Data and Parameter Description
The three-power-grid hybrid energy system in the case study includes a sending-end, i.e., Yunnan Power Grid (YnPG), and two receiving-ends, i.e., Guangdong Power Grid (GdPG) and Guangxi Power Grid (GxPG). To understand the operational condition of these three power grids, we summarized and analyzed some of their main operating parameters. First, the diurnal dynamics of their initial loads before grid-connected operation are depicted in Figure 3a in terms of a typical day located in a flood period. Measured on an hourly scale, the GdPG exhibited a significantly higher load during a day than GxPG and YnPG. All three of the grids reached two peaks during a day and fluctuated in ranges of 13,860–21,000 MW, 22,050–35,000 MW, and 15,200–20,000 MW for GdPG, GxPG, and YnPG, respectively. For comparison, the typical daily output dynamics of new energy plants are plotted in Figure 3b. The generated wind power output of YnPG fluctuated more dramatically than that of GdPG, with the global trough occurring at 13:00 and 14:00 for YnPG and GdPG, respectively. By contrast, the generated solar power output of YnPG was within a lower range compared to wind power, and the output curve reached its peak at 13:00. The brief calculation information of hydropower, nuclear power, and pumped storage power plants is presented in Table 1 and Table 2.
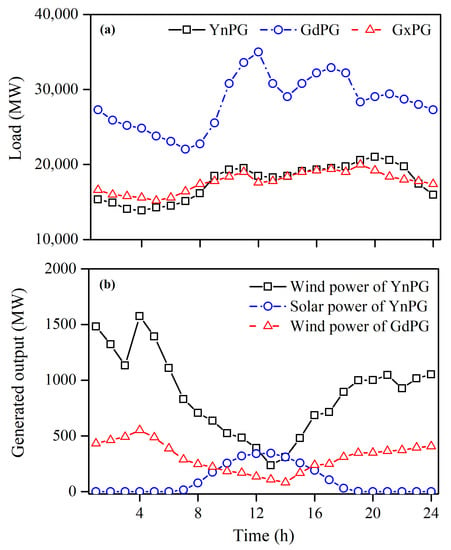
Figure 3.
(a) Diurnal load of three power grid components and (b) generated output of wind and solar power.

Table 1.
Configuration information of power plants in each power gird component.

Table 2.
Summary of parameter in the model optimization.
The upper limits of transmission power from YnPG to GdPG (denoted as Channel I) and from YnPG to GxPG (denoted as Channel II) were set to 10,000 MW and 4000 MW, respectively. Furthermore, the population number used in the NMOPSO algorithm and the upper limit of external archives were both set to 100, and the iteration number was 300.
5.3. Results and Discussion
5.3.1. Optimal Results of the CCMO Model
The approximate Pareto front derived from NMOPSO is displayed in Figure 4, in which 100 non-dominated solutions are provided for the total cost of each power grid, including YnPG, GdPG, and GxPG. From among the 100 optimal cost schemes, representing the individual total cost of three power grid components and identified from 30,000 solution sets (100 × 300), it cannot be determined which is best based only on the theory in NMOPSO due to the multiplicity feature of solving a multi-objective problem. Thus, we focus on the solution range covered by the set of Pareto-optimal solutions. It was observed that the range of YnPG was negative, indicating the profit of total cost, whereas the ranges of GdPG and GxPG were positive, indicating the expenditure of total cost. The approximate Pareto front provides decision-makers with the flexibility to choose satisfactory solutions based on specific requirements. In the trade-off section between the total cost of the three power grids, the profit of YnPG increased by 61.3% from 13.43 to 34.70 million Yuan, whereas the expenditures of GdPG and GxPG nonlinearly increased by 9.22% from 127.56 to 140.52 million Yuan and by 5.47% from 59.48 to 62.92 million Yuan, respectively.
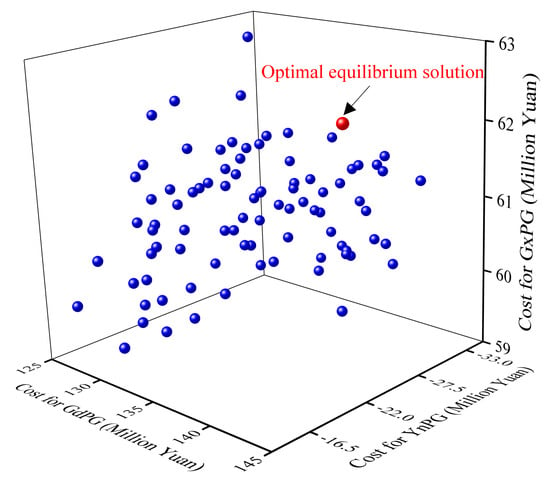
Figure 4.
Approximate Pareto front composed of non-dominated solutions.
Afterward, the decision-making experiment was conducted using the TOPSIS technology to further evaluate the performance of Pareto-optimal solutions. Thus, for 100 non-dominant solutions, the distribution of the proximity degree, i.e., PD index (Equation (25)), was determined and plotted in Figure 5. Solution No. 70 was found to be the optimal equilibrium solution, with the highest PD value of 0.89. In addition, this optimal equilibrium solution corresponded to the red dot in the approximate Pareto front scatters of Figure 4, with total costs of −31.21, 131.29, and 61.56 million Yuan for YnPG, GdPG, and GxPG, respectively. In this case study, the aim was to choose a solution to make it closest to the positive ideal solution (optimal solution) and farthest to the negative ideal solution (inferior solution). However, the satisfactory candidates were not unique. In other words, the decision maker can select different optimal equilibrium solutions, by modifying the weighting coefficient or decision attributes to fit various clean energy allocation circumstances [32].
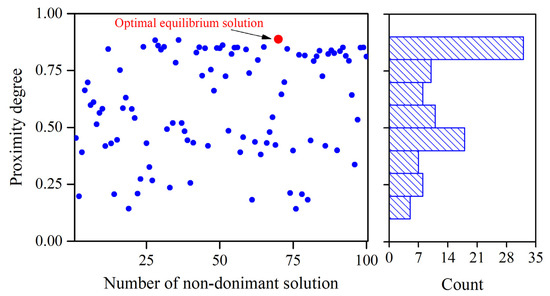
Figure 5.
Scatter plot of proximity degree derived from non-dominated solutions.
Figure 6 and Figure 7 further exhibit the temporal dynamic for each clean energy component within the balance of electric power and energy. It can be clearly observed that, as the sending-end in the grid-connected system, YnPG had abundant hydropower and new energy resources, and thus it transmitted some surplus power outside to GdPG and GxPG in addition to its steady base loading output and peak shaving output, on the basis of supplying its own balance of electric power and energy. As the receiving-ends, GdPG and GxPG received a base loading generated output of 3815 MW and 384 MW, respectively, while receiving maximal generated outputs for peak shaving of 6185 MW and 3616 MW (Figure 7). Both the base load and peak regulation output could reduce the total operation cost for the receiving-end power grids. The base load output transmitted into the receiving-ends provided an alternative to thermal power, and the peak regulation output substituted that obtained from the local power grid. Neither the total load nor the clean energy load was significantly correlated with the load of outside transmission. This demonstrated that the outside transmission power cannot be decided by simple linear relationships to realize the efficient utilization of clean energy and confirmed the need to exploit the multi-objective operation model in this context and similar complex non-linear power generation systems [33,34].
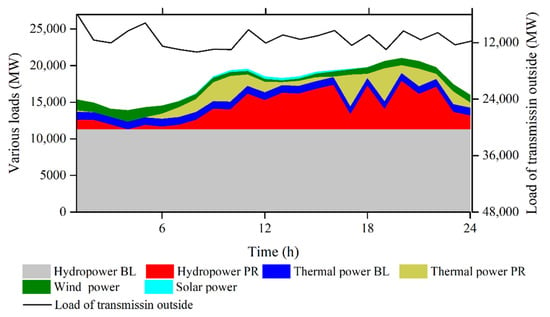
Figure 6.
Diurnal dynamic of various loads under the power balance condition in the optimal equilibrium solution for YnPG as sending-end of the grid-connected hybrid energy system.
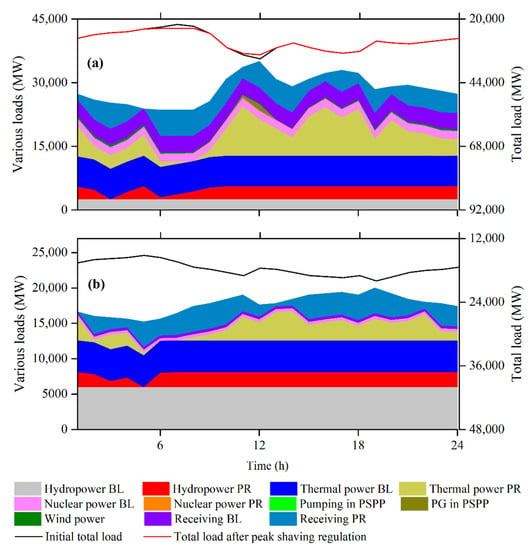
Figure 7.
Diurnal dynamic of various loads under the power balance condition in the optimal equilibrium solution for (a) GdPG and (b) GxPG as sending-ends of the grid-connected hybrid energy system.
5.3.2. Analysis of the Optimal Equilibrium Solution
To verify the advantage of the optimal equilibrium solution, i.e., the optimal solution scenario, it was compared with three solutions having minimum total cost for only one power grid, which were named extreme solution scenarios I, II, and III for YnPG, GdPG, and GxPG, respectively. The daily average of supplied and received electricity and electricity curtailment, as well as other indices, is listed in Table 3. First, in extreme solution scenario I (i.e., the extreme solution of YnPG), the total cost of YnPG was lower, compared to the optimal equilibrium solution. Although the zero-electricity curtailment and 100% CEUR for YnPG existed in both extreme solution scenario I and the optimal equilibrium solution, the electricity curtailments for GdPG and GxPG in the optimal equilibrium solution were lower than that in extreme solution scenario I, and the CEURs of GdPG and GxPG in the optimal equilibrium solution were higher. This suggested that the optimal equilibrium solution could more significantly reduce the electricity curtailment of the receiving-end (GdPG and GxPG) and increase the whole CEUR, under a relatively high supplying ratio.

Table 3.
Comparison of optimal equilibrium solution and extreme solution.
In extreme solution scenario II (i.e., the extreme solution of GdPG), GdPG had a lower total cost compared with the optimal equilibrium solution. Similar to extreme solution scenario I, extreme solution scenario II exhibited considerable electricity curtailment and lower CEUR for YnPG than the optimal equilibrium solution, although it had a slightly lower electricity curtailment and higher CEUR for GdPG and GxPG. In addition, there was no electricity curtailment accompanying 100% CEUR for YnPG in the optimal equilibrium solution, whereas there was no electricity curtailment with 100% CEUR for GdPG in extreme solution scenario II. This contrast between the two scenarios may have resulted from the fact that the optimization placed emphasis on decreasing the total cost since it is necessary to pay for receiving electricity. It was assumed that the receiving-end would receive electricity and energy only when consuming enough local clean energy. Therefore, the received electricity and energy of GdPG were relatively low, leading to too much electricity and energy remaining in YnPG to consume and large electricity curtailment. In general, the optimal equilibrium solution was superior to extreme scenario II, as the latter violated the principle of increasing the utilization rate of clean energy.
Finally, in extreme solution scenario III (i.e., the extreme solution of GxPG), GxPG had a lower total cost compared with the optimal equilibrium solution. There was no electricity curtailment with 100% CEUR for YnPG in the optimal scenario, whereas there was no electricity curtailment with 100% CEUR for GxPG in extreme solution scenario III. This indicated that receiving electricity and energy from other power grids on the basis of preferentially using the local clean energy reduced the total cost. However, this strategy resulted in a decrease in the received amount of electricity and energy, which further led to too much electricity and energy remaining in the YnPG to accommodate. Thus, the electricity curtailment of YnPG was larger in extreme scenario III than that in the optimal scenario, which went against the clean energy utilization principle. Overall, the optimal equilibrium solution was superior to extreme solution scenario III.
The daily utilization time of channels I and II in the four scenarios specified above is plotted in Figure 8. Among the four scenarios, the daily utilization time of both channels I and II was largest in the optimal scenario. This demonstrated that the optimal scenario can not only improve the CEUR, but also increase the utilization of channels used to connect various grids. Through high utilization of channels, the optimal scenario made full use of the available resources, which further verified the reasonability of the optimal scenario.
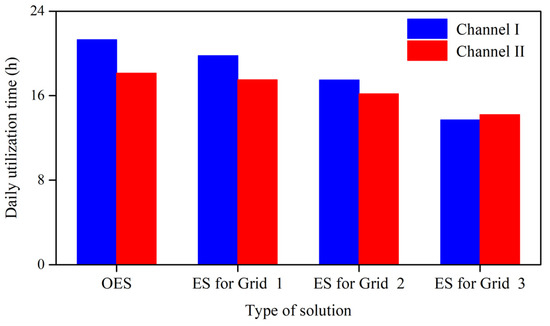
Figure 8.
Daily utilization time derived from one optimal equilibrium solution (OES) and three extreme solutions (ES) of Channels I and II connecting YnPG with GdPG and GxPG, respectively.
5.3.3. Upper-Limit Impact of the Transmission Channel Power
Figure 9 presents the co-evolution of key indices related to clean energy accommodation with the upper-limit power of channels I and II. As the upper limits of channels I and II increased, the CEUR of YnPG increased from 92% to 100% (Figure 9a). This is because the increase of the upper limit of channel power improved the supplying ability of the sending-end YnPG. The daily utilization time of channels I and II gradually decreased with the increasing upper limit of channel power. In addition, to improve the clean energy utilization capability of the sending-end and ensure the full use of channels, the critical value of channel power was identified (gray dotted line in Figure 9a; in the area to the right of this line, the CEUR of YnPG is always 100%). In contrast to the critical value, the average daily utilization time of channels I and II was maximum when the upper power was 10,000 and 3920 MW for channels I and II, respectively, and thus this was the optimal combination scheme of two channels connecting to receiving-end grids.
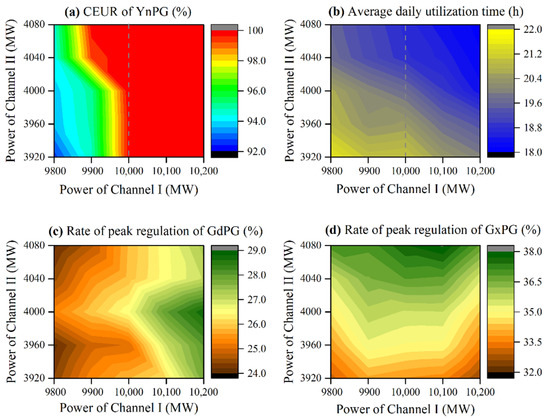
Figure 9.
Optimal results including (a) clean energy consumption ratio (CEUR) of YnPG, (b) average daily utilization time of Channels I and II, and (c,d) peak regulation ratios of power generation of GdPG and GxPG received from YnPG with changing Channels I and II.
The peak regulation rates of electricity for GdPG and GxPG are exhibited in Figure 9c,d to depict the rate of peak regulation capacity obtained from receiving electricity to the total demand of peak regulation capacity. The rate of peak regulation for GdPG significantly rose with the increase of the upper power limit of channel I, whereas there was no significant correlation between this rate and the change in channel II’s upper power. The rate of peak regulation for GxPG had the opposite pattern with the change in the two channels, with a positive correlation with channel II and no apparent trend with channel I. The patterns discussed above demonstrated that the increase of upper power for grid-connected channels contributed to the increase in the maximum of indices estimating the transmission processes, including utilization rate, daily utilization time, and peak regulation range.
5.3.4. Comparison of the CCMO Model with Reference Models
To verify the improvement of CCMO related to the punishment cost of clean energy curtailment, two reference models, namely, a version removing a curtailment cost-dependent module but using the dynamic spinning reserve constraint (abbreviated as RI) and a version using curtailment cost-dependent module and a fixed spinning reserve constraint (abbreviated as RII), were compared with CCMO. For these two operation schemes, the diurnally generated outputs of clean energy in the three-grid-connected system are compared. The curves of generated outputs when the system was operated using the RI model (mean value: 37,414 MW) and RII model (mean value: 37,535 MW) were mostly lower than that when the system was operated using CCMO (which considered the curtailment cost and dynamic spinning reserve constraint; mean value: 39,029 MW). Although the difference of generated outputs derived using RI/RII and CCMO only accounted for approximately 4% ((39,029–37,414)/39,029 ≈ (39,029–37,535)/39,029 ≈ 4%) of the CCMO-based generated output, the difference in electricity which integrates the generated output over a long time, was considerable. The generated outputs operated with the RI and RII models fluctuated more dramatically than those with CCMO. In addition, the optimal total costs summarizing all three power grid components were 317 and 335 million Yuan for the RI and RII models, respectively, which were larger than that for the CCMO model (285 million Yuan). The daily average CEURs based on the RI and RII models were 92.9% and 93.2%, respectively, which were significantly lower than the CCMO-based CEUR (96.9%). Thus, it was demonstrated that the developed CCMO model coupling the curtailment cost with the dynamic spinning reserve constraint performed significantly better in terms of obtaining higher generated output, lower total cost, and higher CEUR.
The total power generation cost, established previously for various power grid operation models, is frequently taken as the object variable since electricity prices can resolve the mismatch between energy generation and accommodation by fluctuating with market supply and demand [35]. In this study, we further considered both total cost and clean energy utilization to obtain economic benefits as well as achieve high CEUR. The modification demonstrated a theoretical framework for using price trajectories to develop clean energy technologies and build technological roadmaps for clean energy accommodation.
6. Conclusions
It is challenging to promote clean energy accommodation and make related decisions in the operation and planning of grid-connected hybrid energy systems, due to the complicated interaction and compensation process among various power grids and types of energy. In this study, we proposed a novel multi-objective operation model called CCMO to complementarily operate grid-connected hybrid energy system. To identify the optimal scheme with a high CEUR, the punishment cost of electricity curtailment was considered in the multi-objective function of the developed model, and the dynamic spinning reserve decision variable was used in the constraints to support a flexible space of cost-based object variables to search for the optimal CEUR. A three-grid-connected system with one sending-end (YnPG) and two receiving-ends (GdPG and GxPG) was studied as an example. The following conclusions can be drawn.
- (1)
- The daily average CEUR derived from the CCMO model was 96.9%, whereas the daily averaged CECR of the reference models RI (without the consideration of curtailment cost) and RII (using the fixed spinning reserve constraint) were 92.9% and 93.2%, respectively. This demonstrated that the curtailment-cost-based operation provided a more practical representation of the hybrid energy system connecting multiple power grids together and made full use of clean energy, thus performing better than the reference models.
- (2)
- The optimal equilibrium solution which was derived by solving CCMO, provided not only an improved CEUR (up to 100% at hourly scale) but also the optimal daily utilization time of the transmission channels (with optimal upper limits of 10,000 MW and 3920 MW for the channel transmitting power from YnPG to GdPG and to GxPG, respectively) linking the sending-end to the receiving-ends.
Overall, the developed model is deemed to be a practical complementary operation tool to facilitate clean energy accommodation in grid-connected hybrid energy systems. The contribution of our study focuses on coupling the punishment cost of curtailment energy with the total cost to achieve a higher clean energy utilization ratio. In future work, the measurement and prediction uncertainties in hydro-wind-solar resources associated with complex hydro-meteorological conditions will be further analyzed for the proposed curtailment-focused model.
Author Contributions
Conceptualization, Q.M. and Y.Z. (Yanke Zhang); methodology, Q.M.; formal analysis, Y.Z. (Yawei Zhao) and Q.M.; investigation, Q.M.; writing—original draft preparation, Q.M. and Y.Z. (Yanke Zhang); writing—review and editing, C.J. and B.M.; supervision, Y.Z. (Yanke Zhang) and C.J.; funding acquisition, Q.M. All authors have read and agreed to the published version of the manuscript.
Funding
This study was financially supported by the China Postdoctoral Science Foundation, grant number 2020M680487, the Fundamental Research Funds for the Central Universities, grant number 2020MS026, and the National Natural Science Foundation of China grant number 51709105.
Institutional Review Board Statement
Not applicable.
Informed Consent Statement
Not applicable.
Data Availability Statement
Not applicable.
Acknowledgments
All the authors gratefully acknowledge Yunnan, Guangdong, and Guangxi Power Grids for providing grid operation data. We would like to thank the handling editors and the anonymous reviewers for their time spent reviewing our text.
Conflicts of Interest
The authors declare no conflict of interest.
References
- Saliminezhad, A.; Bahramian, P. Clean energy consumption and economic growth nexus: Asymmetric time and frequency domain causality testing in China. Energy Sources Part B Econ. Plan. Policy 2020, 15, 1–12. [Google Scholar] [CrossRef]
- Gielen, D.; Boshell, F.; Saygin, D.; Bazilian, M.D.; Wagner, N.; Gorini, R. The role of renewable energy in the global energy transformation. Energy Strategy Rev. 2019, 24, 38–50. [Google Scholar] [CrossRef]
- Momete, D.C. Analysis of the potential of clean energy deployment in the European Union. IEEE Access 2018, 6, 54811–54822. [Google Scholar] [CrossRef]
- Herran, D.S.; Tachiiri, K.; Matsumoto, K. Global energy system transformations in mitigation scenarios considering climate uncertainties. Appl. Energ. 2019, 243, 119–131. [Google Scholar] [CrossRef]
- Lee, J.W. The contribution of foreign direct investment to clean energy use, carbon emissions and economic growth. Energy Policy 2013, 55, 483–489. [Google Scholar] [CrossRef]
- Wang, Z. A predictive analysis of clean energy consumption, economic growth and environmental regulation in China using an optimized grey dynamic model. Comput. Econ. 2015, 46, 437–453. [Google Scholar] [CrossRef]
- Office, E.P. Share of renewables in energy consumption in the EU reached 18% in 2018. Eurostat News Release 2020, 23, 1–3. [Google Scholar]
- Li, M. World Energy 2017–2050: Annual Report; Department of Economics, University of Utah: Salt Lake City, UT, USA, 2017. [Google Scholar]
- Liu, S.; Lin, Z.Z.; Zhao, Y.; Liu, Y.; Ding, Y.; Zhang, B.; Wang, Q.; Yang, L.; White, S.E. Robust System Separation Strategy Considering Online Wide-area Coherency Identification and Uncertainties of Renewable Energy Sources. IEEE Trans. Power Syst. 2020, 35, 3574–3587. [Google Scholar] [CrossRef]
- He, Y.; Xu, Y.; Pang, Y.; Tian, H.; Wu, R. A regulatory policy to promote renewable energy consumption in China: Review and future evolutionary path. Renew. Energ. 2016, 89, 695–705. [Google Scholar] [CrossRef]
- Cárdenas, B.; Swinfen-Styles, L.; Rouse, J.P.; Hoskin, A.; Xu, W.; Garvey, S.D. Energy Storage for a High Penetration of Renewables. In Proceedings of the 2019 Offshore Energy and Storage Summit (OSES), Brest, France, 10–12 July 2019; pp. 1–10. [Google Scholar]
- De Decker, K. Reorienting the Economy to the Rhythms of Nature: Learning to Live with Intermittent Energy Supply. Am. J. Econ. Sociol. 2020, 79, 877–905. [Google Scholar] [CrossRef]
- Kaundinya, D.P.; Balachandra, P.; Ravindranath, N.H. Grid-connected versus stand-alone energy systems for decentralized power—A review of literature. Renew. Sustain. Energy Rev. 2009, 13, 2041–2050. [Google Scholar] [CrossRef]
- Zhang, J.; Liu, J.; Shao, X.; Du, X. The research on power dispatching to improve clean energy utilization. In IOP Conference Series: Materials Science and Engineering; IOP Publishing: Bristol, UK, 2019; Volume 677, p. 42013. [Google Scholar]
- Pu, L.; Wang, X.; Tan, Z.; Wu, J.; Long, C.; Kong, W. Feasible electricity price calculation and environmental benefits analysis of the regional nighttime wind power utilization in electric heating in Beijing. J. Clean. Prod. 2019, 212, 1434–1445. [Google Scholar] [CrossRef]
- Liu, M.; Wang, L.; Li, C.; Wang, B. Analysis on operation of pumped storage power plants for reducing surplus water. J. Hydroelectr. 2016, 35, 45–55. [Google Scholar]
- Liu, Y.; Wang, L.; Tang, Y.; Ji, C.; Zhao, Y. Minimum abandoned hydropower model based on estimation of distribution and successive approximation. China Rural Water Hydropower 2018, 4, 178–184. (In Chinese) [Google Scholar]
- Huh, J.; Otgonchimeg, S.; Seo, K. Advanced metering infrastructure design and test bed experiment using intelligent agents: Focusing on the PLC network base technology for Smart Grid system. J. Supercomput. 2016, 72, 1862–1877. [Google Scholar] [CrossRef]
- Huh, J. Smart Grid Test Bed Using OPNET and Power Line Communication; IGI Global: Hershey, PA, USA, 2017. [Google Scholar]
- Usman, M.; Khan, M.T.; Rana, A.S.; Ali, S. Techno-economic analysis of hybrid solar-diesel-grid connected power generation system. J. Electr. Syst. Inf. Technol. 2018, 5, 653–662. [Google Scholar] [CrossRef]
- Barakat, S.; Samy, M.M.; Eteiba, M.B.; Wahba, W.I. Feasibility study of grid connected PV-biomass integrated energy system in Egypt. Int. J. Emerg. Electr. Power Syst. 2016, 17, 519–528. [Google Scholar] [CrossRef]
- Wang, X.; Chang, J.; Meng, X.; Wang, Y. Short-term hydro-thermal-wind-photovoltaic complementary operation of interconnected power systems. Appl. Energ. 2018, 229, 945–962. [Google Scholar] [CrossRef]
- Saiprasad, N.; Kalam, A.; Zayegh, A. Techno-economic and environmental analysis of hybrid energy systems for a university in Australia. Aust. J. Electr. Electron. Eng. 2018, 15, 168–174. [Google Scholar] [CrossRef]
- Perez, M.; Perez, R.; Rábago, K.R.; Putnam, M. Overbuilding & curtailment: The cost-effective enablers of firm PV generation. Sol. Energy 2019, 180, 412–422. [Google Scholar]
- Aktas, A.; Kabak, M. A goal programming model for grid-connected hybrid energy system operations. SN Appl. Sci. 2020, 2, 71. [Google Scholar] [CrossRef]
- Khodaei, A. Resiliency-oriented microgrid optimal scheduling. IEEE Trans. Smart Grid. 2014, 5, 1584–1591. [Google Scholar] [CrossRef]
- Sun, G.; Chen, S.; Wei, Z.; Chen, S. Multi-period integrated natural gas and electric power system probabilistic optimal power flow incorporating power-to-gas units. J. Mod. Power Syst. Clean Energy 2017, 5, 412–423. [Google Scholar] [CrossRef]
- Li, Y.; Zhou, J.; Qin, H.; Lu, Y.; Yang, J. Adaptive Niche Multi-objective Particle Swarm Optimization Algorithm. In Proceedings of the 2008 Fourth International Conference on Natural Computation, Jinan, China, 18–20 October 2008; pp. 418–422. [Google Scholar]
- Zhang, P.; Yao, H.; Fang, C.; Liu, Y. Multi-objective enhanced particle swarm optimization in virtual network embedding. Eurasip J. Wirel. Comm. 2016, 2016, 1–9. [Google Scholar] [CrossRef]
- Liu, B.; Liao, S.; Cheng, C.; Chen, F.; Li, W. Hydropower curtailment in Yunnan Province, southwestern China: Constraint analysis and suggestions. Renew. Energ. 2018, 121, 700–711. [Google Scholar] [CrossRef]
- Cui, Q.; He, L.; Han, G.; Chen, H.; Cao, J. Review on climate and water resource implications of reducing renewable power curtailment in China: A nexus perspective. Appl. Energ. 2020, 267, 115114. [Google Scholar] [CrossRef]
- Tzeng, G.; Huang, J. Multiple Attribute Decision Making: Methods and Applications; CRC Press: Boca Raton, FL, USA, 2011. [Google Scholar]
- Yang, Z.; Yang, K.; Wang, Y.; Su, L.; Hu, H. Multi-objective short-term hydropower generation operation for cascade reservoirs and stochastic decision making under multiple uncertainties. J. Clean. Prod. 2020, 276, 122995. [Google Scholar] [CrossRef]
- Lu, X.; Zhou, K.; Yang, S.; Liu, H. Multi-objective optimal load dispatch of microgrid with stochastic access of electric vehicles. J. Clean. Prod. 2018, 195, 187–199. [Google Scholar] [CrossRef]
- Liu, Z. Chapter 2—Clean Energy Replacement and Electricity Replacement, Global Energy Interconnection; Elsevier: Amsterdam, The Netherlands, 2016; pp. 65–90. [Google Scholar]
Publisher’s Note: MDPI stays neutral with regard to jurisdictional claims in published maps and institutional affiliations. |
© 2021 by the authors. Licensee MDPI, Basel, Switzerland. This article is an open access article distributed under the terms and conditions of the Creative Commons Attribution (CC BY) license (https://creativecommons.org/licenses/by/4.0/).