Abstract
Increased demand for food production, influenced by the constant growth of population, resulted in the agricultural production systems that are more energy and economy intensive. The aim of this study was to evaluate the energetic and economic efficiency of sugar beet and wheat production. Attention was given to the fertilizer usage and its share in energy consumption since it can amount to 50%. Data show that energy input in wheat production was 5.84 MJ·kg−1 and in sugar beet it was 0.93 MJ·kg−1. The highest share of energy input both in wheat and sugar beet was observed for fertilizers, 52.45% and 46.70%, respectively. Economic analysis has shown that wheat production is a low profitable production with a net return of only 20.69 USD·ha−1, in comparison with sugar beet production with a net return of 513.53 USD·ha−1. Costs related to the fertilizer use prevailed in total variable and total production costs. Economic analysis has also shown that the benefit-to-cost ratio was higher in sugar beet production (1.33) compared to wheat production (1.03). Furthermore, it was determined that these economic indicators were less sensitive in sugar beet production than in wheat production regarding the variation of fertilizer.
1. Introduction
Production of sufficient quantities of food and industrial raw materials, both for the existing population and for generations to come, is one of the most important tasks of the society [1]. Therefore, the development of agriculture, its sustainability, and continuous improvement are crucial for humanity [2,3]. Agriculture is one of the most important sectors in the Serbian economy and it is one of the largest job providers. The most important crops produced in this region are maize, wheat, sunflower, soybean, and sugar beet [4].
Sugar beet products are used for human and livestock nutrition and for industrial needs. Sugar beet is mainly used for sugar production as 25% of the world’s sugar production comes from sugar beet [5]. On the other hand, sugar beet is also used for ethanol fuel production. The total world sugar beet production is estimated to be 271.6 million metric tons [6]. In Serbia, sugar beet is produced on 65,979.4 ha with an average yield of 47.82 t·ha−1 [7]. Wheat is one of the most important food sources in human nutrition. Its share in total area under cereal crops in the world is 25% [8] with the average yield of 2.7 t·ha−1. In Serbia, wheat is cultivated on 615,735.6 ha with an average yield of 3.96 t ha−1 [8]. Recent statistics have shown that the demand for wheat is increasing and that in 2020 it will be between 840 and 1,050 Mt [9]. This means that yield should be increased to 3.8 t·ha−1 in a short period.
In order to increase the yield, modern and energy–intensive technologies are being applied [10] leading to the 300–400% increase in the energy demand [11]. Therefore, the relationship between energy and agriculture becomes even more important [12]. Efficient use of energy is one of the principal requirements of sustainable agriculture [13,14]. Energy consumption in agriculture is increasing as a response to the increasing population, limited supply of arable land and a need for the higher living standards [5]. It is said that the share of energy consumed in agriculture is very high, ranging in some countries up to 5% of total energy consumption in the country [15,16]. Apart from agriculture, energy is a fundamental component of economic development because it provides essential services maintaining the economic activity and enhancing the quality of human life [17].
Today’s agricultural practices still lack energy optimization measures, leading to high energy consumption [18]. One way to optimize energy consumption is to determine the efficiency of methods and techniques used [19]. It is important to recognize the input elements and recommended methods to control them [8]. Energy inputs in plant production can be classified as direct and indirect energy inputs [14,19,20,21,22]. Direct energy is most easily recognized as fuel and electricity. Indirect energy recourses include fertilizers, plant protection chemicals, water for irrigation, human labour, and technical systems.
Chemical fertilizers are widely used in agricultural crops and require high rates of direct energy for their production, mainly in the nitrogen fertilizer industry [17]. Energy use by fertilizers represents the major part of the total energy use in crop production and amounts up to 50% [21]. This is one of the key reasons for devoting the additional research and pursuing its rationalization with the aim of not only economically viable [23] but also environmentally effective production [22,24,25,26]. However, contemporary crop production cannot be imagined without the use of fertilizers, especially in sense of better utilization of plant biological yield [27,28,29,30]. If fertilizers were not used, the yield of crops would be significantly reduced regardless of the application of other technology operations carried out such as tillage, crop protection, irrigation, etc.
In current agricultural practices, the nutritive value of fertilizers is evaluated on the basis of their impact on crop yield increase and the possibility of improving yield quality [15,16]. However, with the advancement of all sectors, including agriculture, more and more analyses are dedicated to the energy flow in fertilizer production and application, analysing the processes such as transport, storage, and handling of fertilizers.
The aim of this study was to estimate the energy input and output in sugar beet and wheat production and to analyse the distribution of different energy input utilized in the production. With these data it was possible to evaluate the influence of the energy input through the fertilizer on overall production energy efficiency. Together with the energy efficiency analysis, the economic analysis of the wheat and sugar beet production was carried in order to estimate the influence of the certain energy input on the total economic efficiency of the production.
2. Materials and Methods
Energy consumption is defined thorough the energy input in sugar beet and wheat production from the moment of soil tillage and preparation for sowing until sugar beet roots and wheat grain leave the field [8]. This means that energy inputs for storage and post-harvest processes are not included in the energy balance calculation. The data were collected during the three-year field trials (2016/18) on the estate of PKB Corporation (Agricultural Corporation Belgrade) "7 July" Farm in Jakovo (Belgrade region, 44°43′06.42″ N; 20°15′37.68″ E, Serbia). The estate has 4011 ha of arable land that is used for crop production and animal husbandry. As for the seeding structure, the estate is oriented to wheat (535 ha), maize (1472 ha), maize hybrids (109 ha), silage maize (374 ha), oat (200 ha), soybean (553 ha), sunflower hybrids (10 ha), alfalfa (290 ha), sugar beet (400 ha), and meadows (68 ha). Crop production is carried out on plots that comprise the soil types of Humic Gleysols and aluvijum Dystric Fluvisols soil. This property was selected as a representative one since it is on the type of soil that is most common type of soil in Vojvodina region that is the largest agricultural production region in Serbia where most of the wheat and sugar beet are produced.
Wheat production technology consisted of primary tillage (ploughing, 18–20 cm working depth), secondary tillage with seedbed preparation (5–10 cm working depth), seed transport, sowing, transportation and application of mineral fertilizer (two times within the vegetation period), transport of water, weed control, transport of water and disease control (two times within the vegetation period), harvest with the Class Lexion 450 combine harvester as well as grain and straw transport.
Regarding sugar beet production, soil tillage included using disc harrows (two times, 15–18 cm working depth) and ploughing (35 cm working depth) prior to seedbed preparation. The seed was transported to the plots and after that fertilizers were transported and applied (three times within the vegetation period) and transportation of water and weed control provided (two times within the vegetation period). The combine harvester Holmer Terra Dos was used for harvesting. The tractor–trailer aggregate was used for transporting beet roots of the plots.
In order to determine the energy efficiency of crop production, energy inputs (direct, indirect) and energy outputs were identified. The number and duration of operations, technical systems used, fuel consumption, sowing rate, plant protection chemicals and fertilizer application rates, and amount of human labour were investigated using questionnaires [5,17,20,21,31] and personal interviews with farm managers having the inside look at the daily operator working diaries, product storage details (fertilizers and chemicals that were released from the storage).
The method used for energy efficiency analysis [18,19,31,32] is based on the definition of direct and indirect energy inputs, calculation of the energy output for given plant production. Based on these data in wheat and sugar beet production specific energy input, energy output–input ratio, energy productivity and net energy gain were estimated as follows:
where: EI is the specific energy input (MJ·kg−1), EIP is the energy input in the production (MJ·ha−1), Y is yield (kg·ha−1), EOP is the energy output of the production (MJ·ha−1), EP is energy productivity (kg·MJ−1), and NEG is net energy gain (MJ·ha−1).
NEG = EOP − EIP
The energy inputs were calculated by multiplying the material input by the referent energy equivalent [5,20]. The quantities of the material input were obtained directly from the farm managers. The input energy was classified into direct, indirect, renewable and non-renewable [17,33]. Human labour and diesel used were classified as direct energy inputs while indirect energy inputs included energy embodied in seeds, fertilizers, pesticides, and water [5]. In other words, nonrenewable energy includes diesel, chemical, and fertilizers and renewable energy consists of human labour [5].
Economic analysis was used to determine the economic benefits of sugar beet and wheat production. The basic unit for all analysis was one hectare. The production cost of sugar beet and wheat included both variable and fixed costs. The variable costs of production included costs such as seed, fertilizers, pesticides, fuel, and all other costs that varied depending on a farm production volume. The fixed costs of production included all costs which tended to remain the same regardless of production output. Variable and fixed costs comprised the total cost. The production output used for economic analysis included only major product which for sugar beet included the root yield and for wheat it included the grain yield. All prices of the input and output were average prices over the analysis period. Economic analysis includes the analysis of gross and net returns, benefit-to-cost ratio and productivity [34].
where: GR is the gross return (USD·ha−1), GVP is the gross value of the production (USD·ha−1), VCP represents the variable cost of production (USD·ha−1), NR is the net return (USD·ha−1), TCP stands for the total cost of production (USD·ha−1), BCR is the benefit-to-cost ratio and P is productivity.
GR = GVP − VCP,
NR = GVP − TCP,
In this paper, economic efficiency of energy [12] was calculated based on GR and NR (Equations (5) and (6)) and it is in accordance with the methodology given by Falcone et al. [12].
Also, the sensitivity analysis of the impacts of different fertilizer prices on economic indicators was carried out. The sensitivity analysis started from the assumption that the fertilizer purchase prices can vary within the range of ±20%, reflecting the changes that often occur in practice [35].
The same method of analysis was used to determine changes in fertilizer prices (in percentage), which led to net return equalling zero.
3. Results
3.1. Energy Inputs and Outputs in Wheat and Sugar Beet Production
Energy inputs and energy outputs in wheat and sugar beet production are shown in Table 1. The values represent the average values of data collected within the three-year period. As it can be seen, average energy consumption was 22,339 MJ·ha−1 in wheat and 27,848.92 MJ·ha−1 in sugar beet.

Table 1.
Energy inputs and output in wheat and sugar beet production.
Most of the energy in wheat production, 12,099.10 MJ·ha−1, was used through the fertilizer application (Table 1). This energy represents 52.45% of the total energy used for wheat production. Seeding material within energy input had its share of 20.94% in total energy consumption. The fuel energy ranked third with a share of 19.48%.
In the case of sugar beet, energy consumption through the fertilizers was 13,675.18 MJ·ha−1 having a share of 46.7% in the total energy flow (Table 1). The second intensive energy source in sugar beet production was fuel, with a share of 28.91%, followed by herbicides, with the 11.78% share in the total energy consumption. This pattern can be explained by the production technology since sugar beet is a very intensive crop in terms of plant protection measures and fertilizer use [36].
The three-year average yield of wheat grain was 4.32 t·ha−1 giving the energy output of 63,499.6 MJ·ha−1. Sugar beet had the three year average yield of 48.16 t ha−1 with the energy output of 809,044 MJ·ha−1. Parameters of the energy efficiency of wheat and sugar beet production for three production seasons are given in Table 2.
Table 2.
Energy parameters for wheat and sugar beet production.
3.2. Economic Parameters of Sugar Beet and Wheat Production
In sugar beet production, approximately 74.61% of the total production costs were variable costs, whereas fixed costs comprised 25.39%. In wheat production, variable costs made 70.48% of the total production costs, whereas fixed costs constituted 29.52%.
The results of the conducted economic analysis show that wheat production was a low profitable agricultural production with a net return of only 20.69 USD·ha−1 in the analysed period, in comparison with sugar beet production with a net return of 513.53 USD·ha−1 (Table 3).
Table 3.
Economic analysis of the sugar beet and wheat production systems.
Therefore the value of other indicators was significantly higher in sugar beet production except for gross return per kg which was higher in wheat production. It is important to note that the gross return and net return per MJ (economic efficiency of energy) were three- and 20-times higher in sugar beet production, respectively.
The benefit-to-cost ratio for the sugar beet and wheat production systems was 1.33 and 1.03, respectively (Figure 1).
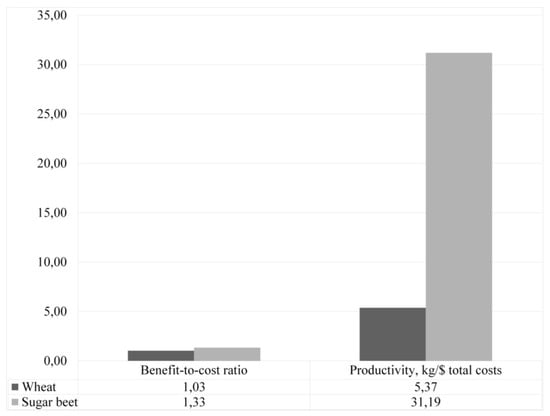
Figure 1.
Main economic indicators of the sugar beet and wheat production system.
Productivity indicates the amount of sugar beet and wheat produced per dollar spent on the production of sugar beet and wheat, and was only 5.37 kg·USD−1 for the wheat production system and 31.19 kg·USD−1 for the sugar beet production system.
4. Discussion
4.1. Energy Efficiency Analysis
Concerning the results of the energy needed per production area, Canakci et al. [21] reported similar results for wheat production. The other researchers [37,38] reported higher values for energy consumption, ranking from 35,605 MJ·ha−1 to 38,360 MJ·ha−1. As for the sugar beet production, similar results were reported for Germany [36] and for New Zealand [8]. Reineke et al. [39] calculated energy balance parameters for sugar beet production on commercial farms in Germany. Total energy input (median) was 17,300 MJ·ha−1. In Turkey, energy consumption in sugar beet production was reported to be 20,567 MJ·ha−1 [36], 34,201.75 MJ·ha−1 [31], and 59,685 MJ·ha−1 [5].
The energy use pattern for cultivating wheat shows that only 1/5 of the total energy consumption included directly used energy (Table 4). The other 4/5 of the total energy input comprised indirect energy dominantly used through fertilizers and seeds. The similar energy distribution pattern, in wheat production, was reported by Canakci et al. [21]. Other researchers also reported an intensive share of fertilizer in the total energy consumption. For the provinces in Iran, fertilizers participated in the total energy consumption with 38.45% and 47.30%, respectively [35,38]. Even though lower energy input in the wheat production was reported in Morocco (7480 MJ·ha−1) [40], the share of fertilizer in the energy pattern was 40.50%.
Table 4.
Total energy input in the form of direct, indirect, renewable, and non-renewable energy for wheat and sugar beet production.
The energy use pattern in sugar beet production (Table 4) shows that little less than 1/3 of the total energy consumption represents the direct energy used via fuel. The other 2/3 of the energy inputs represent the indirect energy input, mainly fertilizers. A similar energy use pattern was reported by Baran and Gokdogan [31] for the Kirklareli province in Turkey, where the share of fertilizer was ranked first with 41.97%, followed by diesel fuel (21.16%) and irrigation (11.97%). Similar, results for sugar beet production also in Turkey, but in the Tokat province, reported by Erdal et al. [5] show the highest share of the fertilizer in the energy input in sugar beet production (49.33%) that was followed by diesel fuel (24.16%). In Iran, in the Khorasan Razavi province the total energy input for sugar beet production system was 42,231.9 MJ·ha−1. Direct energy input had its share of 56.9%. As for the total energy input energy of fertilizers had the highest share (29%) [17]. Erdal et al. [5] reported that in sugar beet production, 82.43% of total energy input resulted from non-renewable and 12.82% from renewable energy. They also reported that 29.62% of energy input came from direct energy and 65.64% was indirect energy [5]. The intensity of non-renewable energy consumption resulted from fertilizer, diesel fuel, and machinery used in production. Baran and Gokdogan [31] also reported that the share of non-renewable energy was 80.95% while the share of renewable energy was 19.05%. In addition, they reported a higher share of direct energy input compared to the indirect energy use (51.55% vs. 48.45%). The similar situation is observed in Serbia where non-renewable energy resulted in the share of 96.93%, mainly due to fertilizers and diesel fuel.
The energy efficiency of wheat and sugar beet production was defined by energy parameters (i.e., specific energy input, energy ratio, energy productivity, and net energy gain).
The specific energy input gives the data about how much energy is spent on the yield obtained. Concerning the wheat and sugar beet yields, it was expected to have a lower overall specific energy input in wheat production. The three-year average specific energy input in wheat production was 5.84 MJ·kg−1 (Table 2). In the Turkish region grain yield of 3.56 t·ha−1 was reported [21] while in the conditions of New Zealand the national average yield was 8.5 t·ha−1 [8]. The differences probably arise from different precipitation, different production technologies and management. Nevertheless, the average yield reported in this paper is still higher than the global average of 2.8 t·ha−1 [8]. In the case of sugar beet production, 0.93 MJ·kg−1 of energy was needed to produce one kilogram of the product (Table 2). Similar values for sugar beet yield were reported for the region of Turkey [36]. Higher yields, around 60 t·ha−1, were reported by Ortiz-Canavate and Hernanz [19], Erdal et al. [5] and 68 t·ha−1 [31]. As for the Iranian region, the sugar beet energy output was 56,3645.4 MJ·ha−1 [17]. The lower value of specific energy output, 0.5 MJ·kg−1, was reported for the Kirklareli province in Turkey [31]. Asgharipour et al. [17] reported the specific energy input of 1.3 MJ·kg−1. Generally, more energy was needed for sugar beet production on the unit area, but when the obtained yield was taken into account it was observed that it was more energy feasible to grow intensive crops like sugar beet.
As for the energy ratio, it is stated [41] that if it is higher than one, the system will earn energy, whereas if it is less than one, the system will lose energy. The three-year average energy ratio in wheat and sugar beet production shows the values higher than one, so both systems earned the energy. The average energy ratio in wheat production was 3.12 (Table 2). Regarding the region of Turkey, the value of 2.80 was reported [21]. As for the sugar beet production, the average energy ratio was 26.45. Similar values were obtained for the region of Turkey, 25.75 [5]. Lower values (20) were reported by Stephen and Jackson [42], then 19.15 [43], 11.5–15.1 for the region of New Zealand [8] and 15.4 [39]. Significantly lower values were reported by Baran and Gokdogan [31] (8.35) and Yaldiz et al. [36] (5.04) where the reason for such low value can be searched, if compared to the other authors, in the lower sugar beet yield of 44.6 t·ha−1 [36]. Yields of sugar beet have changed in the last 10 years, thanks to the more intensive production technologies and more intensive sugar beet hybrids, so the ultimate analysed results [36,42] have to be taken more carefully in the analysis. The average yield of sugar beet in the previous decade was similar both in Europe and in the world in total, and it amounted to 59.6 t·ha−1 [6].
EP gives a fair idea about how much product is produced per unit of input energy. EP and ER are in direct relation: their ratio is the calorific value of the product. EP is specific for each agricultural product, location, and time [16]. It can be used as an evaluator of how efficiently energy is utilized in different production systems. To improve EP in a process, it is possible either to reduce the energy sequestered in the inputs or to increase the yield of the product. Asgharipour et al. [17] reported the value of the sugar beet energy productivity of EP 0.8 kg·MJ−1 with an average yield of 33.55 t·ha−1. Ortiz-Canavate and Hernanz [19] reported the value of 1.82 kg·MJ−1 having the yield of sugar beet of 60 t·ha−1. In Serbia, the average value of the energy productivity in sugar beet production was 1.57 kg·MJ−1 with the sugar beet yield of 48.16 t·ha−1 (Table 2). In the case of the Turkish province of Kirklareli, Baran and Gokdogan [31] reported that the energy productivity was 1.98 kg·MJ−1 and sugar beet yield amounting to 68 t·ha−1 The results confirm that energy productivity increases with the yield increment.
In the case of wheat, the value of NEG was 41,160.58 MJ·ha−1 while in sugar beet production, the value of NEG was 781,195.40 MJ·ha−1 (Table 2). In case of sugar beet production in Turkey the reported the values were 982,090.5 MJ·ha−1 [5] and 251,398.25 MJ·ha−1 [31] while in wheat production the reported NEG was 33,695.3 MJ·ha−1 [21].
4.2. Economic Analysis of the Sugar Beet and Wheat Production
Results reported in this paper show that in both wheat and sugar beet production, the variable cost had the share of more than 70% in the total costs. A similar cost distribution pattern was reported in wheat production [44]. Also, these authors reported a high share of fertilizer’ cost in the wheat production costs. The exclusion of fertilizers from crop production would significantly reduce the yields of grown crops. According to Stewart et al. [45], the average percentage of yield attributable to fertilizer ranges from about 40% to 60% in the USA and England. Under tropic conditions, this value tends to be much higher [45]. Thus, costs related to fertilizers had a very high participation in variable costs and total production costs of wheat and sugar beet (Figure 2).
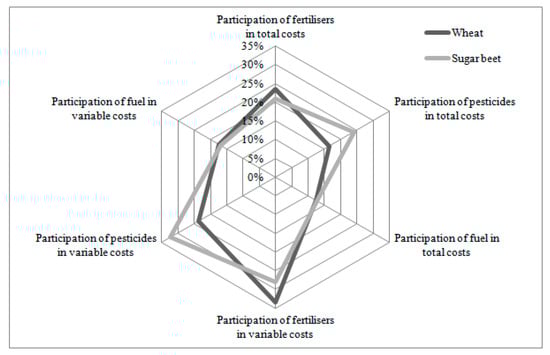
Figure 2.
The most important elements of variable costs and total costs.
Participation of fertilizer costs in variable and total costs was higher in wheat production comparing to sugar beet production despite the fact that the amount of applied fertilizers was higher in sugar beet production. This is due to the fact that crop protection costs also have a significant share in sugar beet production. This can be explained by the production technology since sugar beet is a very intensive crop as for plant protection measures and fertilizer use. Fuel costs, contrary to the previous two groups of costs had almost equal participation in variable and total costs of both production despite the fact that the amount of fuel used was is almost twice as high in the sugar beet production (comparing to wheat production) due to intensive use of agricultural machinery. As we can see, sugar beet production was characterized by high input use, especially fertilizers, pesticides, and fuel.
It is a well-known fact that fertilizers are raw materials whose price to a large extent depends on the energy price in the world market. Therefore, the analysis of the impacts of different fertilizer prices on various economic indicators was carried out. A set of present graphs has been designed in such a way that the abscissa shows the percentage change in purchase prices of fertilizers, whereas the ordinate reads how much it (expressed in per cent) will affect gross return and net return (Figure 3).
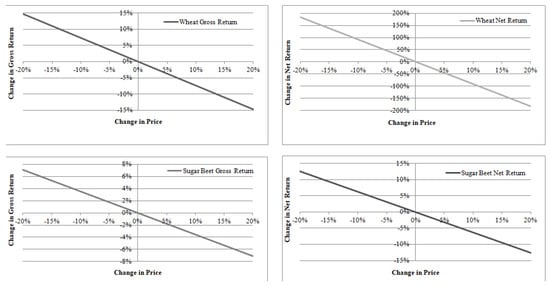
Figure 3.
Changes in gross return and net return in wheat and sugar beet production depending on the change in the fertilizers’ prices.
The same method of analysis was used to determine changes in fertilizer prices (in percentage) that would provide information when the net return equalled zero. It is determined that the increase in fertilizers’ costs in wheat production only for 10.91% led to a net return equalling to zero. On the other hand, if fertilizers’ costs increased by 158.91% then the net return would equal to zero in sugar beet production. Accordingly, the net return in wheat production was much more sensitive to fertilizers’ price changes than to the net return in sugar beet production. The impact of the 1% change of the fertilizers’ price on the percentage change in the gross return and net return in wheat and sugar beet production can be seen in Table 5.
Table 5.
The impact of the percentage change of the fertilizers’ prices on the percentage change in the gross return and net return in wheat and sugar beet production.
As it can be seen, in both productions, the net return was more sensitive to fertilizers’ price changes compared to the gross return. In addition, both indicators were more sensitive to fertilizers’ price changes in wheat production than in sugar beet production.
As for the benefit-to-cost ratio, the study results were not consistent with the findings of other authors, i.e., 1.17 for sugar beet [5] and 2.56 for dry-land wheat [34]. This non-consistency of the results with the findings of other authors (although the same approach for economic analysis has been used) could be explained by a different level of use of certain inputs, different prices of inputs and outputs, as well as a general characteristic of production units in various countries.
5. Conclusions
In this study, the energy input–output relationship in wheat and sugar beet production were analysed regarding the specific energy input, energy ratio, energy productivity, and net energy gain. Together with the energy, economical analysis of these productions was also conducted in order to see if certain energy input can influence the total economical efficiency of the production.
Total energy consumption in wheat was 22,339.00 MJ·ha−1 while in sugar beet it was 27,848.92 MJ·ha−1. The energy input for wheat production was higher (5.84 MJ·ha−1) when compared to sugar beet production (0.93 MJ·ha−1). The energy ratio was 3.12 for wheat and 26.45 for sugar beet. The energy productivity of wheat production was 0.21 kg·MJ−1 while of sugar beet it was 1.57 kg·MJ−1. The net energy gain was significantly higher in the case of sugar beet (781,195.40 MJ) compared to wheat (41,160.58 MJ). This means that even though more energy was required in sugar beet production still, concerning the yield and energy embodied, sugar beet production remained more energy efficient compared to wheat production. Furthermore, results show that 20% of total energy input in wheat production stemmed from renewable sources, whereas in sugar beet production, only 3% represented the energy obtained from the renewable energy sources. In wheat production, energy input structure of 80.52% was directly used energy while in sugar beet production, a direct energy input share was 70.29%.
It was determined that by all criteria (gross return, net return, cost-to-benefit ratio, and productivity) sugar beet production had better economic results than wheat production. The analysis of production costs indicated that variable costs prevailed over fixed costs in both productions. The most important category of costs included costs related to fertilizers. Therefore, a sensitivity analysis was carried out to determine how the change in costs of fertilizers would influence the gross return and net return. Based on the obtained results it can be concluded that these indicators were less sensitive in sugar beet production than in wheat production regarding the variation of fertilizer prices.
Author Contributions
Conceptualization, Z.M., M.G. and S.I.; Methodology, A.D., Z.M. and S.I.; Software, S.T.; Validation, M.G. and R.M.; Formal Analysis, M.G., Z.M., A.D. and S.I.; Investigation, M.G., R.M., Z.M., A.D. and S.I.; Resources, R.M., and Z.M.; Data Curation, A.D., Z.M., S.I. and S.T.; Writing-Original Draft Preparation, A.D. and S.I.; Writing-Review & Editing, Z.M., S.I., S.T. and A.D.; Visualization, S.T. and Z.M.; Supervision, S.I., R.M. and A.D.; Project Administration, Z.M.; Funding Acquisition, Z.M., R.M., S.I. and S.T. All authors have read and agreed to the published version of the manuscript.
Funding
This research received no external funding.
Acknowledgments
The authors are grateful to the Ministry of Education, Science and Technological development, Republic of Serbia, for financing the TR 31051 and OI 179028 research projects.
Conflicts of Interest
The authors declare no conflict of interest.
References
- Ferraro, D.O. Energy use in cropping systems: A regional long-term exploratory analysis of energy allocation and efficiency in the Inland Pampa (Argentina). Energy 2010, 44, 490–497. [Google Scholar] [CrossRef]
- Jankowski, K.; Jankowska, J.; Ciepiela, G.A.; Sosnowski, J.; Wiśniewska-Kadżajan, B.; Kolczarek, R. The Efficiency of Nitrogen Fertilizers in Orchard Grass Cultivated in Pure Sowing or with the Legumes. Rom. Agric. Res. 2014, 31, 1–7. [Google Scholar]
- Wang, Y.W. Sustainable agricultural practices: Energy inputs and outputs, pesticide, fertilizer and greenhouse gas management. Asia Pac. J. Clin. Nutr. 2009, 18, 498–500. [Google Scholar] [PubMed]
- Sokolović, D.; Radović, J.; Tomić, Z. Perennial forage grasses, from breeding to healthy ruminant feed. Biotechnology in Animal Husbandry 2011, 27, 599–614. [Google Scholar] [CrossRef]
- Erdal, G.; Esengün, K.; Erdal, H.; Gündüz, O. Energy use and economical analysis of sugar beet production in Tokat province of Turkey. Energy 2007, 1, 35–41. [Google Scholar] [CrossRef]
- FAO Statistics. Available online: http://www.fao.org/faostat/en/#data (accessed on 3 April 2020).
- Available online: www.data.stat.gov.rs (accessed on 2 April 2020).
- Safa, M.; Samarasinghe, S.; Mohssen, M. A field study of energy consumption in wheat production in Canterbury. New Zealand. Energy Convers. Manag. 2011, 7, 2526–2532. [Google Scholar] [CrossRef]
- Rosegrant, M.W.; Agcaolli-Sombilla, A.; Perez, N. Global Food Projections to 2020: Implications for Investment; International Food Policy Research Institute: Washington, DC, USA, 1995. [Google Scholar]
- Lal, B.; Rajput, D.S.; Tamhankar, M.B.; Agarwal, I.; Sharma, M.S. Energy use and output assessment of food-forage production systems. J. Agron. Crop Sci. 2003, 189, 57–62. [Google Scholar] [CrossRef]
- Pathak, B.S. Energy management in agriculture. In Proceedings of the International Conference on Managing Natural Resources for Sustainable Agricultural Production in the 21st Century, New Delhi, India, 14–18 February 2000; p. 41. [Google Scholar]
- Falcone, G.; Stillitano, T.; De Luca, A.I.; Di Vita, G.; Iofrida, N.; Strano, A.; Gulisano, G.; Pecorino, B.; D’Amico, M. Energetic and Economic Analyses for Agricultural Management Models: The Calabria PGI Clementine Case Study. Energies 2020, 13, 1289. [Google Scholar] [CrossRef]
- López-Vázquez, A.; Cadena-Zapata, M.; Campos-Magaña, S.; Zermeño-Gonzalez, A.; Mendez-Dorado, M. Comparison of Energy Used and Effects on Bulk Density and Yield by Tillage Systems in a Semiarid Condition of Mexico. Agronomy 2019, 9, 189. [Google Scholar] [CrossRef]
- Ilyas, H.M.A.; Safa, M.; Bailey, A.; Rauf, S.; Khan, A. Energy Efficiency Outlook of New Zealand Dairy Farming Systems: An Application of Data Envelopment Analysis (DEA) Approach. Energies 2020, 13, 251. [Google Scholar] [CrossRef]
- Lupu, C.; Lupu, G. Influence of Fertilization and Bacterization on Soybean Production and Biological Peculiarities. Rom. Agric. Res. 2000, 13–14, 67–79. [Google Scholar]
- Malnou, C.S.; Jaggard, K.W.; Sparkes, D.L. Nitrogen fertilizer and the efficiency of the sugar beet crop in late summer. Eur. J. Agron. 2008, 28, 47–56. [Google Scholar] [CrossRef]
- Asgharipour, M.; Mondani, F.; Riahinia, S. Energy use efficiency and economic analysis of sugar beet production system in Iran: A case study in Khorasan Razavi province. Energy 2012, 44, 1078–1084. [Google Scholar] [CrossRef]
- Abrishambaf, O.; Faria, P.; Vale, Z.; Corchado, J.M. Energy Scheduling Using Decision Trees and Emulation: Agriculture Irrigation with Run-of-the-River Hydroelectricity and a PV Case Study. Energies 2019, 12, 3987. [Google Scholar] [CrossRef]
- Ortiz-Cañavate, J.; Hernanz, J.L. Energy analysis. In CIGR Handbook of Agricultural Engineering; Kitani, O., Ed.; American Society of Agricultural Engineers: Michigan, MI, USA, 1999; Volume 3, pp. 13–42. [Google Scholar]
- Aggarwal, G.C. Fertilizer and irrigation management for energy conservation in crop production. Energy 1995, 20, 771–776. [Google Scholar] [CrossRef]
- Canakci, M.; Topakci, M.; Akinci, I.; Ozmerzi, A. Energy use pattern of some field crops and vegetable production: Case study for Antalya Region, Turkey. Energy Convers. Manag. 2005, 46, 655–666. [Google Scholar] [CrossRef]
- Ozkan, B.; Akcaoz, H.; Fert, C. Energy input–output analysis in Turkish agriculture. Renew. Energy 2004, 29, 39–51. [Google Scholar] [CrossRef]
- Cociu, A.I. Tillage System Effects on Input Efficiency of Winter Wheat, Maize and Soybean in Rotation. Rom. Agric. Res. 2010, 27, 81–87. [Google Scholar]
- Alluvione, F.; Moretti, B.; Sacco, D.; Grignani, C. EUE (energy use efficiency) of cropping systems for a sustainable agriculture. Energy 2011, 36, 4468–4481. [Google Scholar] [CrossRef]
- Roberts, T. Improving nutrient use efficiency. Turk. J. Agric. For. 2008, 32, 177–182. [Google Scholar]
- Ryan, J. A perspective on balanced fertilization in the Mediterranean region. Turk. J. Agric. For. 2008, 32, 79–89. [Google Scholar]
- Dawson, C.J.; Hilton, J. Fertilizer availability in a resource-limited world: Production and recycling of nitrogen and phosphorus. Food Policy 2011, 36, S14–S22. [Google Scholar] [CrossRef]
- Sãulescu, N.N.; Ittu, G.; Mustãþea, P.; Simion, G. Improved Nitrogen Response as an Objective in Wheat Breeding. Rom. Agric. Res. 2005, 22, 1–5. [Google Scholar]
- Zengin, M.; Gṏkmeni, F.; Yazici, M.A.; Gezgin, S. Effects of potassium, magnesium, and sulphur containing fertilizers on yield and quality of sugar beets (Beta vulgaris L.). Turk. J. Agric. For. 2009, 33, 495–502. [Google Scholar]
- Klikocka, H.; Kasztelan, A.; Zakrzewska, A.; Wyłupek, T.; Szostak, B.; Skwaryło-Bednarz, B. The Energy Efficiency of the Production and Conversion of Spring Triticale Grain into Bioethanol. Agronomy 2019, 9, 423. [Google Scholar] [CrossRef]
- Baran, F.M.; Gokdogan, O. Determination of energy balance of sugar beet production in Turkey: A case study of Kirklareli Province. Energy Effic. 2016, 9, 487–494. [Google Scholar] [CrossRef]
- Soni, P.; Soe, M.N. Energy balance and energy economic analysis of rice production systems in Ayeyarwaddy Region of Myanmar. Energy Effic. 2016, 16, 223–237. [Google Scholar] [CrossRef]
- Yılmaz, I.; Akcaoz, H.; Ozkan, B. An analysis of energy use and input–output costs for cotton production in Turkey. Renew. Energy 2005, 30, 145–155. [Google Scholar] [CrossRef]
- Ghorbani, R.; Mondani, F.; Amirmoradi, S.; Feizi, H.; Khorramdel, S.; Teimouri, M. A case study of energy use and economical analysis of irrigated and dryland wheat production systems. Appl. Energy 2011, 88, 283–288. [Google Scholar] [CrossRef]
- Ivanović, S.; Todorović, S.; Nastić, L. Impact of energy prices on income of labour on field crop operations. Econ. Agric. 2012, 59, 195–206. [Google Scholar]
- Yaldiz, O.; Ozturk, H.H.; Zeren, Y.; Bascetincelik, A. Energy usage in production of field crops in Turkey (Turkiye’de tarla bitkileri uretiminde enerji kullanımı). In Proceedings of the V. International Congress on Mechanization and Energy in Agriculture, Kusadası, Turkey, 12–14 October 1993; pp. 527–536, [in Turkish]. [Google Scholar]
- Kardoni, F.; Parande, S.; Jassemi, K.; Karami, S. Energy Input-output Relationship and Economical Analysis of Wheat Production in Khuzestan Province of Iran. Int. J. Agron. Plant Prod. 2013, 4, 2187–2193. [Google Scholar]
- Shahin, S.; Jafari, A.; Mobli, H.; Rafiee, S.; Karimi, M. Effect of Farm Size on Energy Ratio for Wheat Production: A Case Study from Ardabil Province of Iran. Am. Eurasian J. Agric. Environ. Sci. 2008, 3, 604–608. [Google Scholar]
- Reineke, H.; Stockfisch, N.; Märländer, B. Analysing the energy balances of sugar beet cultivation in commercial farms in Germany. Eur. J. Agron. 2013, 45, 27–38. [Google Scholar] [CrossRef]
- Ramah, M.; Baali, E.H. Energy balance of wheat and barley under Moroccan conditions. In Proceedings of the International Conference of Agricultural Engineering CIGR-AgEng2012, Valencia, Spain, 8–12 July 2012; p. C-0822. [Google Scholar]
- Conforti, P.; Giampietro, M. Fossil energy use in agriculture: An international comparison. Agric. Ecosyst. Environ. 1997, 65, 231–243. [Google Scholar] [CrossRef]
- Stephen, K.; Jackson, F.H. Sugar beet. In Encyclopaedia of Agricultural Science; Academic Press Inc.: New York, NY, USA, 1995; Volume 4. [Google Scholar]
- Haciseferogullari, H.; Acaroglu, M.; Gezer, I. Determination of the energy balance of the sugar beet plant. Energy Sources 2013, 25, 15–22. [Google Scholar] [CrossRef]
- Todorović, S.; Filipović, N. Economic analysis of wheat production on family farms. J. Agric. Sci. 2010, 55, 79–87. [Google Scholar] [CrossRef][Green Version]
- Stewart, W.M.; Dibb, D.W.; Johnston, A.E.; Smyth, T.J. The Contribution of Commercial Fertilizer Nutrients to Food Production. Agron. J. 2005, 97, 1–6. [Google Scholar] [CrossRef]
© 2020 by the authors. Licensee MDPI, Basel, Switzerland. This article is an open access article distributed under the terms and conditions of the Creative Commons Attribution (CC BY) license (http://creativecommons.org/licenses/by/4.0/).