Article

Geometry Design Optimization of a Wind Turbine Blade Considering Effects on Aerodynamic Performance by Linearization

Faculty of Wind Energy Engineering, Jeju National University, 102 Jejudaehakno, Jeju 63243, Korea
Energies 2020, 13(9), 2320; https://doi.org/10.3390/en13092320
Submission received: 3 April 2020 / Revised: 3 May 2020 / Accepted: 4 May 2020 / Published: 7 May 2020
(This article belongs to the Special Issue Design, Fabrication and Performance of Wind Turbines 2020)

Abstract

:
For a wind turbine to extract as much energy as possible from the wind, blade geometry optimization to maximize the aerodynamic performance is important. Blade design optimization includes linearizing the blade chord and twist distribution for practical manufacturing. As blade linearization changes the blade geometry, it also affects the aerodynamic performance and load characteristics of the wind turbine rotor. Therefore, it is necessary to understand the effects of the design parameters used in linearization. In this study, the effects of these parameters on the aerodynamic performance of a wind turbine blade were examined. In addition, an optimization algorithm for linearization and an objective function that applies multiple tip speed ratios to optimize the aerodynamic efficiency were developed. The analysis revealed that increasing the chord length and chord profile slope improves the aerodynamic efficiency at low wind speeds but lowers it at high wind speeds, and that the twist profile mainly affects the behaviour at low wind speeds, while its effect on the aerodynamic performance at high wind speeds is not significant. When the blade geometry was optimized by applying the linearization parameter ranges obtained from the analysis, blade geometry with improved aerodynamic efficiency at all wind speeds below the rated wind speed was derived.

Graphical Abstract

1. Introduction

The purpose of a wind turbine is to produce a large amount of electrical energy by extracting as much energy as possible from the wind. To this end, the efficiency of each component is optimized in the wind turbine design procedure. In this design procedure, the wind turbine blade geometry is optimized first to maximize the aerodynamic performance of the turbine [1]. The optimized blade shape allows greater use of wind energy, and the aerodynamic performance of a wind turbine is an important factor in its design. When a wind turbine is designed, however, its weight, load, and manufacturability must also be considered. Consequently, wind turbine designers have attempted to find blade geometry optimization methods to achieve maximum power and minimum manufacturing cost. Although proper compromises have been found on practical levels, research on the best blade geometry design method is still required [2].
Studies on wind turbine blade design have been continuously conducted based on the aerodynamic performance analysis theory of aircraft propellers established by Glauert [3]. Wilson et al. proposed a performance prediction method for vertical and horizontal axis wind turbines by applying the Glauert method to wind turbine blades [4,5]. Based on this work, a blade element momentum (BEM) theory for wind turbine geometry design was established, and studies on various blade design methods and performance analysis have been conducted using this theory [6,7,8,9,10]. Furthermore, generalized wind turbine rotor blade design procedures based on the BEM theory are now available [1,2]. However, these procedures deal with ideal blade geometry, and the ideal design obtained from the BEM theory is heavy and difficult to manufacture due to the nonlinear chord profile. Therefore, the chord and twist profile are linearized considering manufacturability and weight. In the blade linearization process, the actual aerodynamic efficiency is inevitably lower than that of the ideal blade geometry. Consequently, an optimal linearization method is required to minimize the aerodynamic efficiency reduction, and various blade chord and twist profile linearization methods have been proposed.
Manwell et al. [1] developed a linear equation with three coefficients for chord and twist profile linearization. To apply this equation in blade linearization, it is necessary to optimize three coefficients for maximum efficiency. Burton et al. [2] used a straight line that passes through the 70% and 90% positions of the blade span for chord linearization. Maalawi and Badr [11] mentioned that the chord profile must form a tangent at the 75% position of the theoretical blade span and proposed an exponential distribution equation for the twist profile. Liu et al. [12] proposed a linear equation that performs linearization based on the theoretical blade tip chord and twist profile for fixed-pitch, fixed-speed wind turbine blades. Yang et al. [13] linearized the blade chord and twist profile using a Bezier curve that adjusts five control points. Bezier curves are parametric curves that are mainly used for geometric design of products requiring smooth shapes, and the curve geometry is determined by the positions of the control points. Therefore, the coordinates of the control points that maximize the aerodynamic efficiency must be found. Tahani et al. [14] used a method of selecting a line with the highest efficiency among all lines that connect two adjacent points along the theoretical blade span, but this method requires many blade element sections to increase the precision. They performed division into 30 blade section elements. Most of the linearization methods used in previous studies require several parameters for linearization, even though there are also simple methods; thus, it is necessary to find the optimal combination of such parameters.
Most linearization methods are focused on maximizing the aerodynamic efficiency based on the specific design wind speed and design tip speed ratio (TSR). However, blades designed based on particular design wind speeds and design TSRs exhibit maximum efficiency at specific wind speeds [15]. Wind turbines perform control to track the maximum power point, but the ability to respond to the wind, which varies every moment, is limited. Therefore, blade geometry optimization that considers multiple TSRs is required to achieve optimal efficiency at various wind speeds. In addition, as the blade linearization process affects the aerodynamic performance and blade stiffness due to the geometry change, blade design optimization becomes very complicated if the structural stability of the blade is also considered. Therefore, blade geometry optimization, including linearization, must deal with various constraints. To achieve the performance goals of wind turbines, optimization algorithms have been applied to blade geometry design in various studies.
Selig and Coverstone-Carroll [16] performed blade geometry optimization using a genetic algorithm (GA) in which the annual energy production was maximized as an objective function. The blade chord and twist profile linearization was determined based on the 75% position of the theoretical blade span. Fuglsang and Madsen [17] optimized the geometry of a 1.5 MW stall-regulated rotor blade using sequential linear programming and the method of feasible directions. Jureczko et al. [18] performed multi-criterion design optimization using a GA considering the structural conditions, including the aerodynamic load and material of the wind turbine blade. In this research, a finite element model was used, and the focus was on the structural performance of the blade rather than on aerodynamic performance. Mendez and Greiner [19] optimized the blade geometry to maximize the average power dependent on the Weibull wind distribution at a specific site using a GA. Similarly, Polat and Tuner [20] optimized the aerodynamic shape of wind turbine blades using a parallel GA. Further, Tahani et al. [21] determined the blade chord and twist profile as well as the optimal blade section positions for various airfoil types using a GA. Ashuri et al. [22] presented a method for multidisciplinary design optimization at the system level considering integrated aerodynamic and structural design of the rotor and tower simultaneously. Subsequently, Neto et al. [23] performed blade geometry optimization using an evolutionary algorithm to maximize the energy production of wind turbines and to minimize the mass of the blade. In most studies on blade geometry optimization, the rotor blade geometry has been optimized to maximize the wind turbine power or energy. As the blade geometry is determined by the blade chord and twist profiles, the chord and twist linearization, which determine the blade geometry, play important roles in blade geometry optimization.
This study deals with the chord and twist linearization and geometry optimization required for blade geometry design. As the blade linearization process changes the blade geometry, it also affects the aerodynamic performance and load characteristics of the wind turbine rotor. Therefore, it is necessary to understand the effects of the parameters that are used in the linearization process. Some of the abovementioned studies dealt with blade linearization, but there has been no discussion of the effects of the linearization-induced changes in blade geometry on the aerodynamic performance. In this study, the effects of the wind turbine blade linearization parameters on the aerodynamic performance of the wind turbine blade were examined. In addition, an optimization algorithm for linearization and an objective function that applies multiple TSRs to satisfy the optimal efficiency at various wind speeds were established. The linearization effect analysis and blade design optimization using the derived algorithm were conducted for a 5-MW baseline wind turbine developed by the National Renewable Energy Laboratory (NREL), and its aerodynamic performance was verified using FAST (Fatigue, Aerodynamics, Structures and Turbulence) code. In addition, the aerodynamic performance of the blade optimized using the developed algorithm was compared with that of the NREL baseline blade to verify the performance of the proposed optimization algorithm and the suitability of the objective function.

2. Blade Design Procedure and Methodology

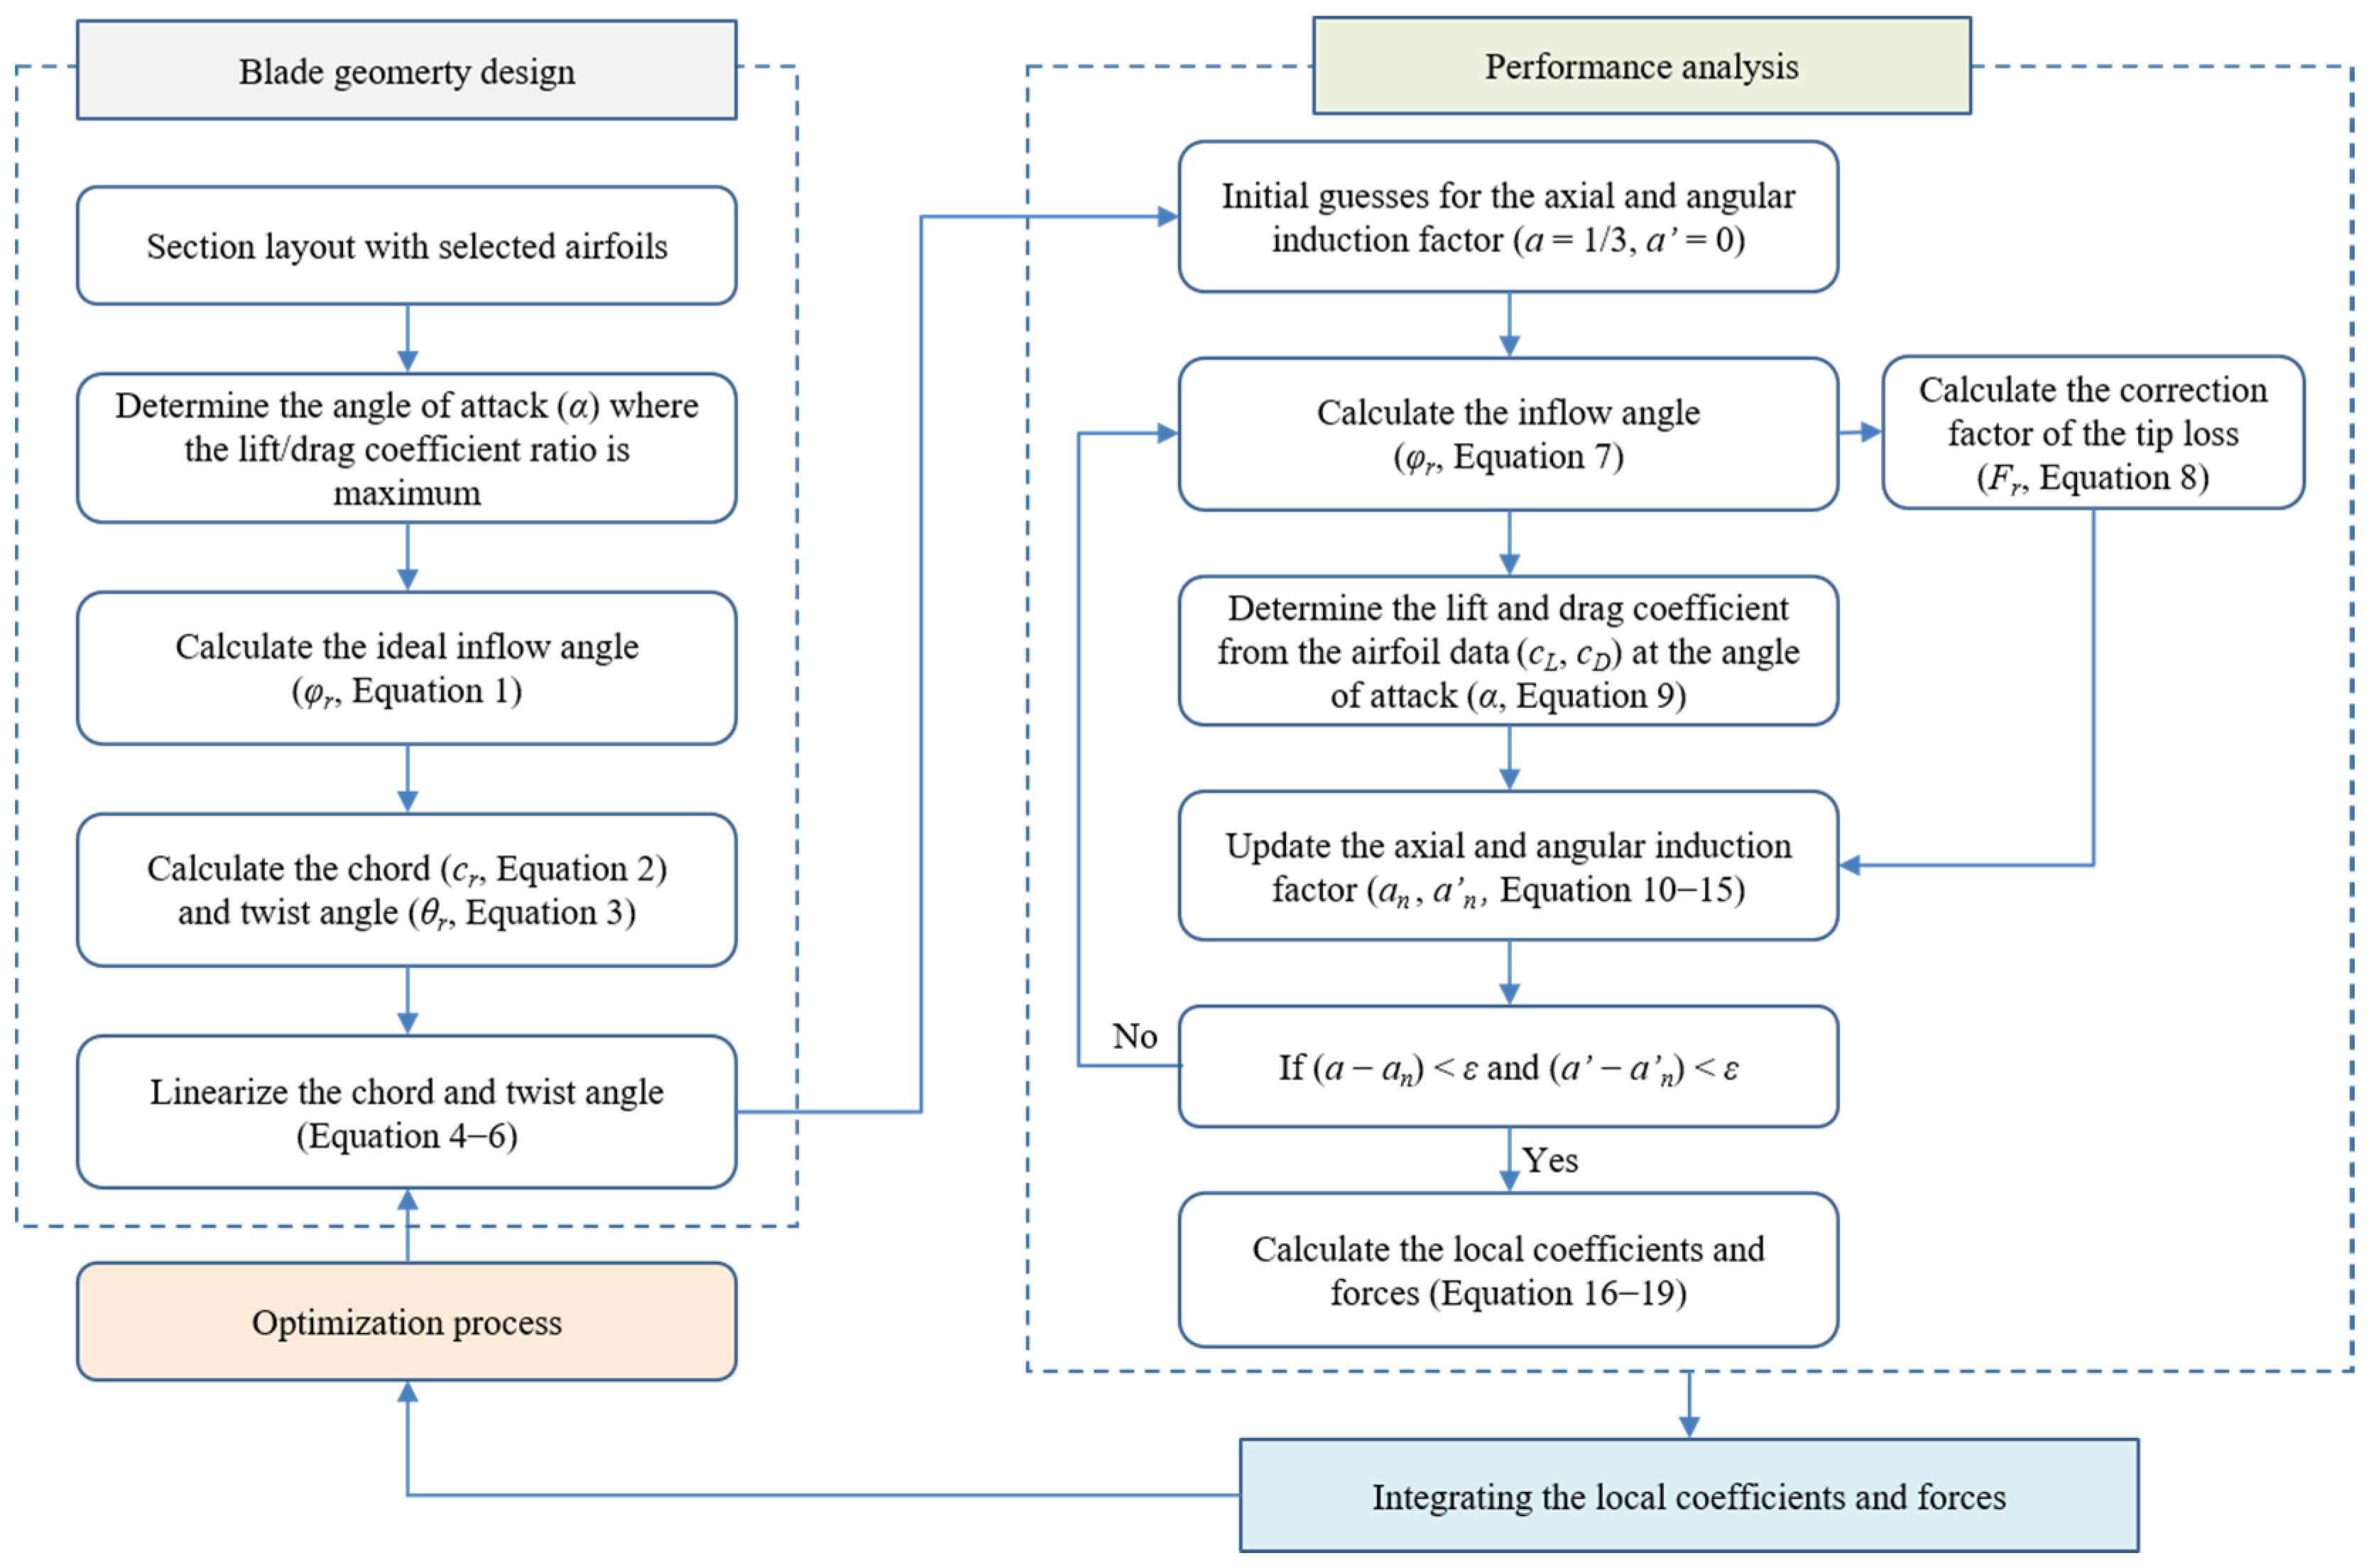
2.1. Blade Design Procedure

Among the methodologies for wind turbine blade design and analysis, the BEM theory has been widely used due to its short calculation time and satisfactory results [24]. This theory combines the blade elements with one-dimensional momentum theory, as detailed in various literature [1,2]. This section presents the BEM theory equations that were used in the optimal blade design procedure in this study, which are summarized in Figure 1. In addition, it describes the overall flow, including the basic blade geometry design, optimization process for chord and twist angle linearization, and aerodynamic performance analysis process.

2.2. Initial Blade Geometry Design

The initial blade geometry design is obtained by referring to the theoretical or ideal geometry and begins with the selection and placement of airfoils along the span of the blade. Initially, the width of all airfoils is set to the same, and then the appropriate airfoil position is determined through optimization. In this study, the selection of airfoils and their positioning are based on the section layout of the NERL baseline blade. After sections are divided along the span of the blade and airfoils are selected, the angle of attack (AoA, α) of each airfoil is determined from the corresponding airfoil data. In addition, the local TSR (λr) is calculated according to the rotor radial position (r) and ideal inflow angle (φr) of the wind for each section (see Figure 2), as follows:
φ r = tan 1 ( 2 3 λ r ) .
Equation (1) assumes a = 1/3 and a’ = 0 in Equation (7), i.e., the Betz limit and no wake rotation. Once the ideal inflow angle has been calculated, the chord length (cr) and twist angle (θr) of each blade section can be calculated as follows:
c r = 8 π r N c L ( sin φ 3 λ r ) ,
θ r = φ r α ,
where N is the number of blades and cL is the lift coefficient to the AoA of the airfoil at section r.
Using the above process, theoretical blade geometry in which the chord length increases toward the blade root section is created, and linearization is performed on the ideal chord and twist distributions. Various linearization methods have been proposed, as mentioned in Section 1, but the linear method with the most common linear slope [1] was used in this study. The linearization equations for the chord and twist distribution are as follows:
c r = a 1 r + b 1 ,
θ r = a 2 ( R r ) ,
where R is the radius of the wind turbine rotor, a1 is the chord profile slope and a2 is the coefficient defining the twist distribution of the blade. b1 is an intercept of the chord linear function and can be calculated using the chord length (TC) at the reference radius (rTC) as follows:
b 1 = T C a 1 r T C .

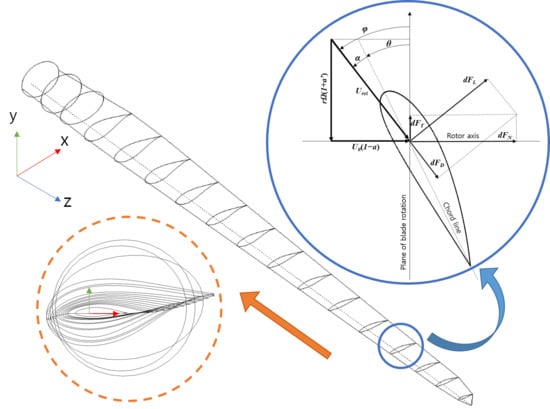
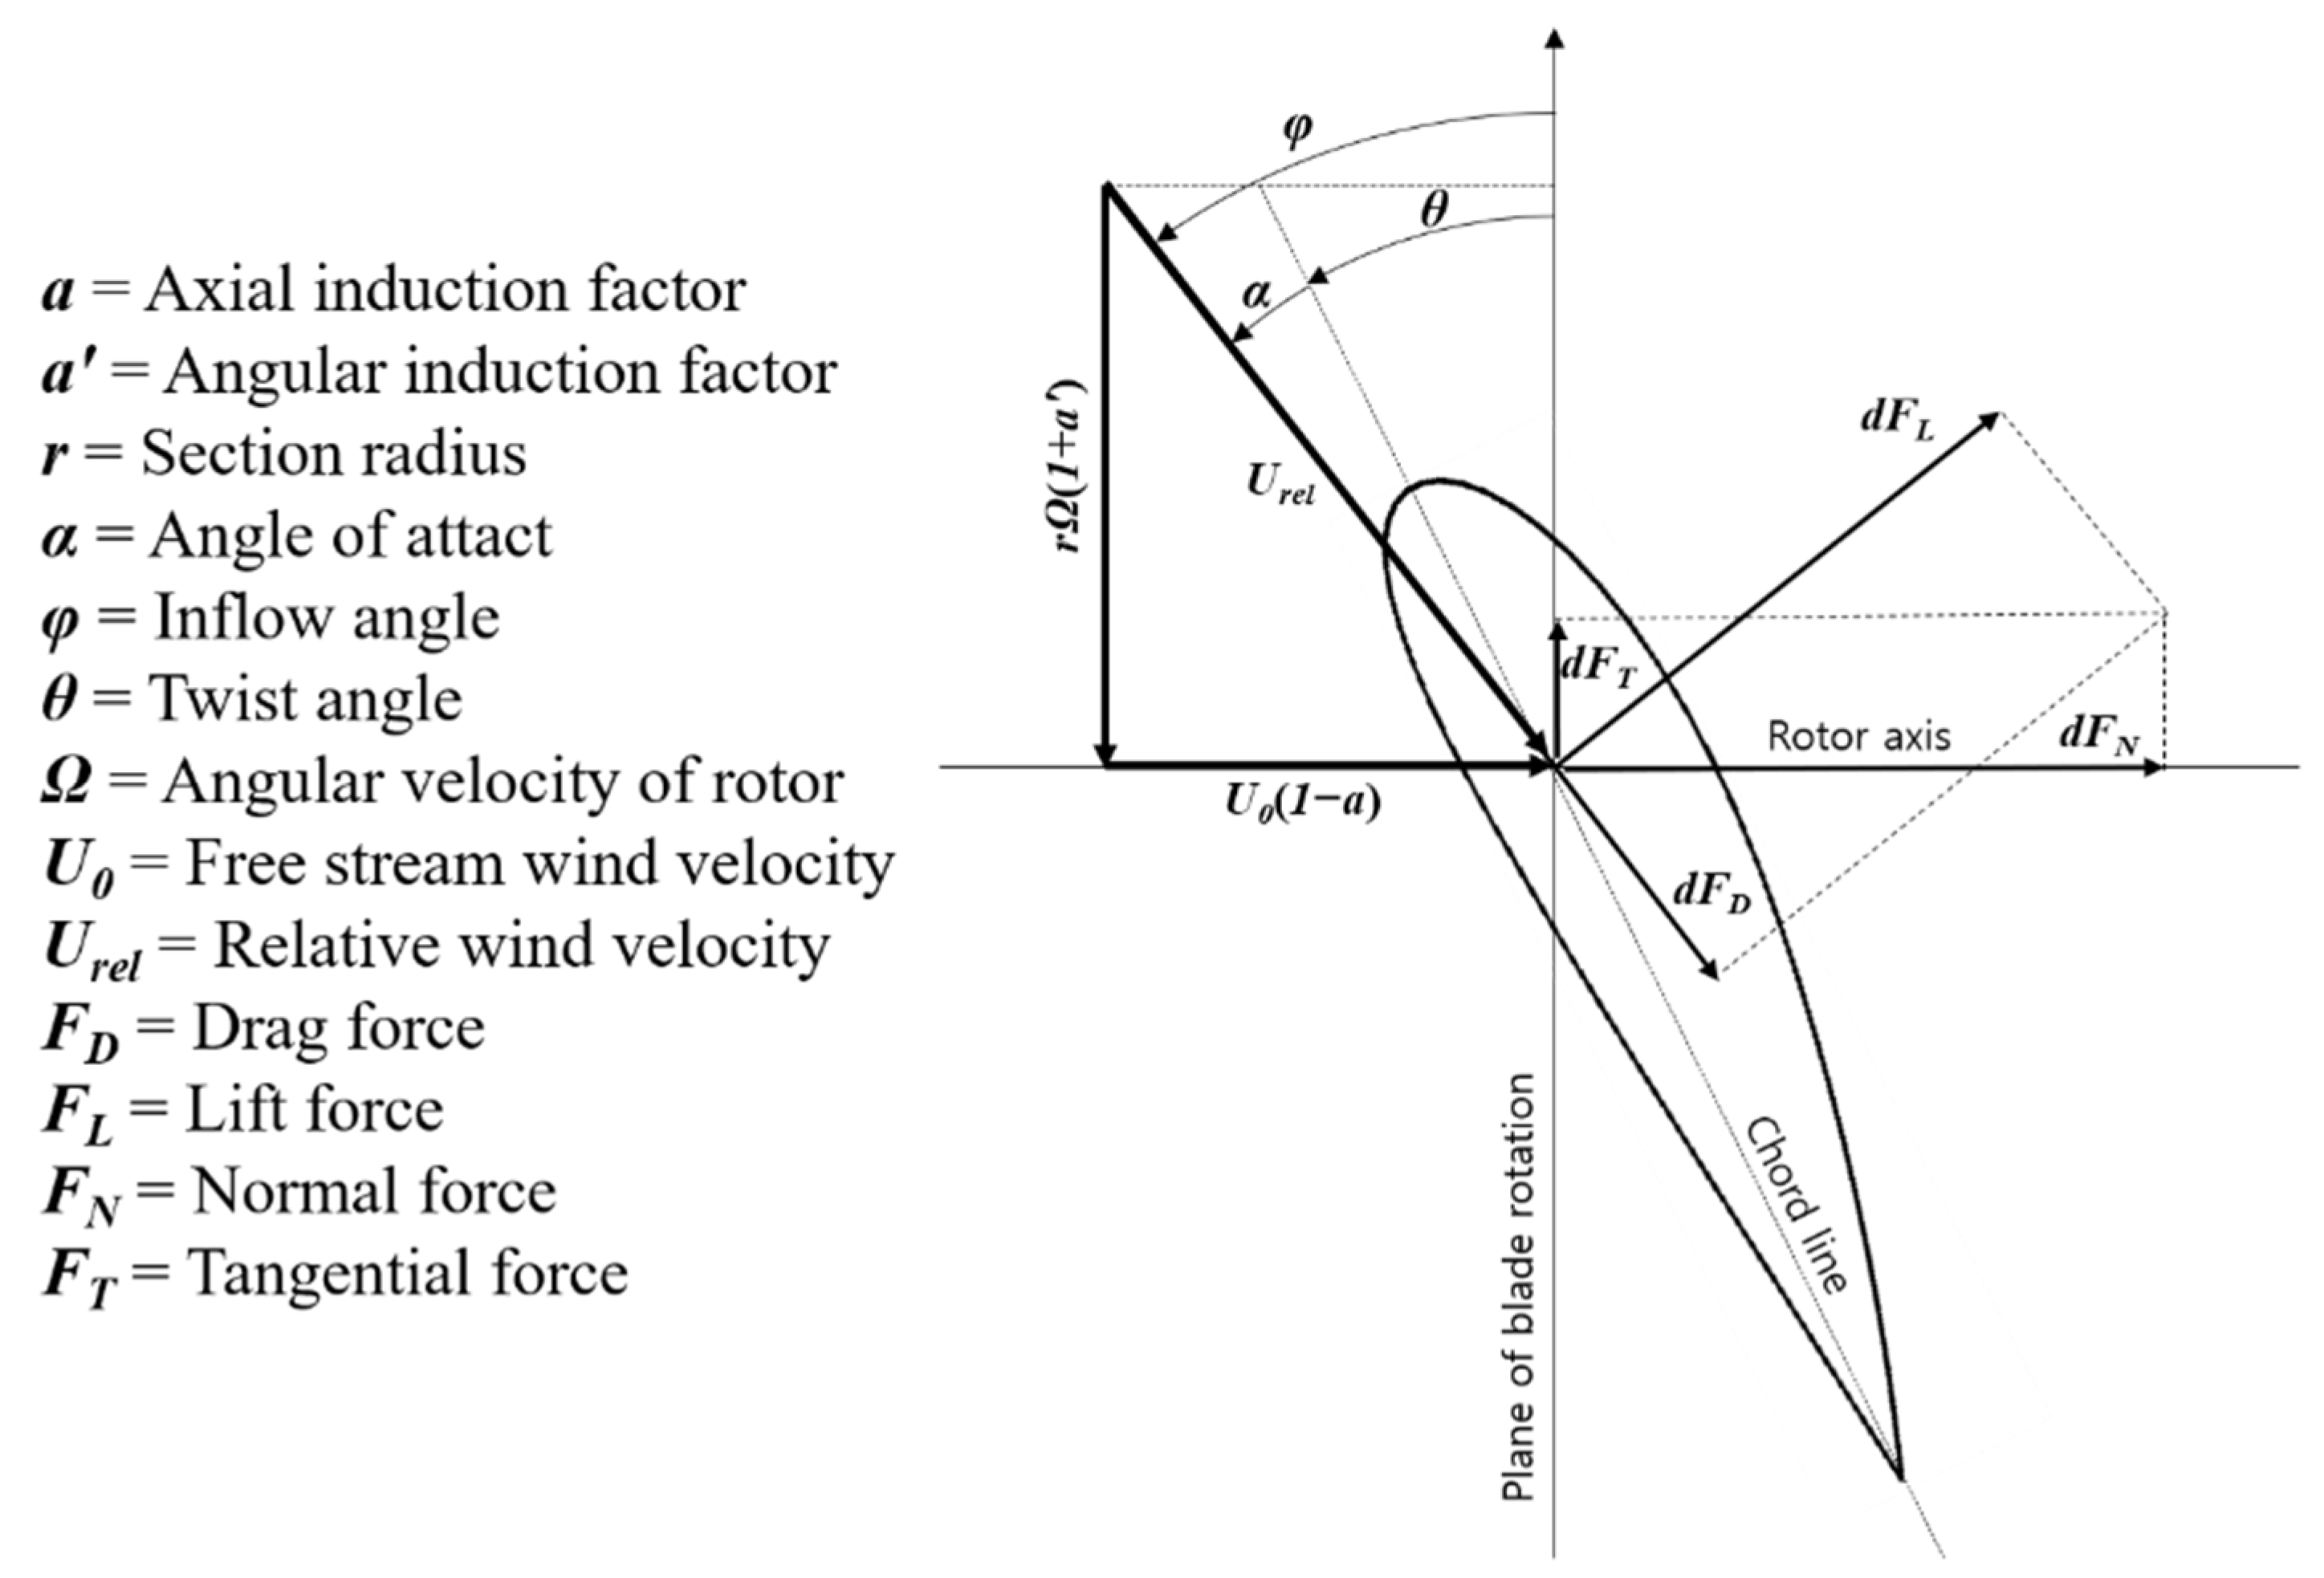
2.3. Blade Performance Analysis

After performing chord and twist profile linearization, the blade geometry is practical. Performance analysis of this blade is also conducted using the BEM theory. The core of the blade performance analysis is obtaining the practical axial and angular induction factors (a, a’) of the designed blade. As a and a’ cannot be calculated analytically, the inflow angle of the wind and the corresponding AoA are calculated first by estimating a and a’, and the induction factor that satisfies the designed blade is obtained while repeating the process of deriving new an and a’n, as shown in Figure 1. For the initial estimate of the induction factors, a = 1/3 and a’ = 0 are generally applied. The inflow angle can be calculated using the axial and angular induction factors as follows:
φ r = tan 1 ( 1 a ( 1 + a ) λ r ) .
The correction factor of the tip loss to reflect the lift force reduction due to airflow around the blade tip is based on Prandtl’s method as follows:
F r = ( 2 π ) cos 1 [ exp ( { N ( R r ) 2 r sin φ r } ) ] .
The AoA of the airfoil is calculated using the inflow angle (Equation (7)) and the twist angle derived from the linearization process above, and cL and cD are determined from the lift and drag data of the airfoil.
α = φ r θ r ,
New an and a’n values are calculated using the calculated inflow angle and correction factor as follows:
a n = 1 ( 1 + 4 F r sin 2 φ r σ r C N ) ,
a n = 1 4 F r sin φ r cos φ r σ r C T 1 ,
where σr is the local solidity (σr = Ncr/2πr), CN is the normal force coefficient and CT is the tangential force coefficient. These quantities can be calculated using the cL and cD values of the airfoil, determined above as follows:
C N = c L cos φ r + c D sin φ r ,
C T = c L sin φ r c D cos φ r .
Once new induction factors (an, a’n) have been calculated, the differences from the induction factors (a, a’) estimated above are examined, and this process is repeated until the error range (ε) desired by the designer is achieved. During this process, the new axial induction factor (an) may exceed the Betz limit. As this situation causes a conflict with the BEM theory, the following correction is performed:
a n = { Equation   ( 10 ) ,   a > 0.2 1 2 [ 2 + K ( 1 2 a ) ( K ( 1 2 a ) + 2 ) 2 + 4 ( K a 2 1 ) ] ,
K = 4 F r sin 2 φ r σ r C N .
When satisfactory induction factors (a, a’) are derived at a given section position, the local power coefficient (Cp,r) and thrust coefficient (Ct,r) can be calculated as follows:
C p , r = 8 λ 2 F r λ r 3 a ( 1 a ) [ 1 ( c D / c L ) cot θ r ] ,
C t , r = σ r ( 1 a ) 2 C N / sin 2 φ r .
The normal force (dFn) and tangential force (dFt) acting on the blade can be calculated from the axial and angular momentum as follows:
d F n = F r ρ U 2 4 a ( 1 a ) π r d r ,
d F t = F r ρ U 4 a ( 1 a ) π r 3 Ω d r ,
where ρ is the air density, U is free stream wind speed, and Ω is the angular velocity of the rotor.

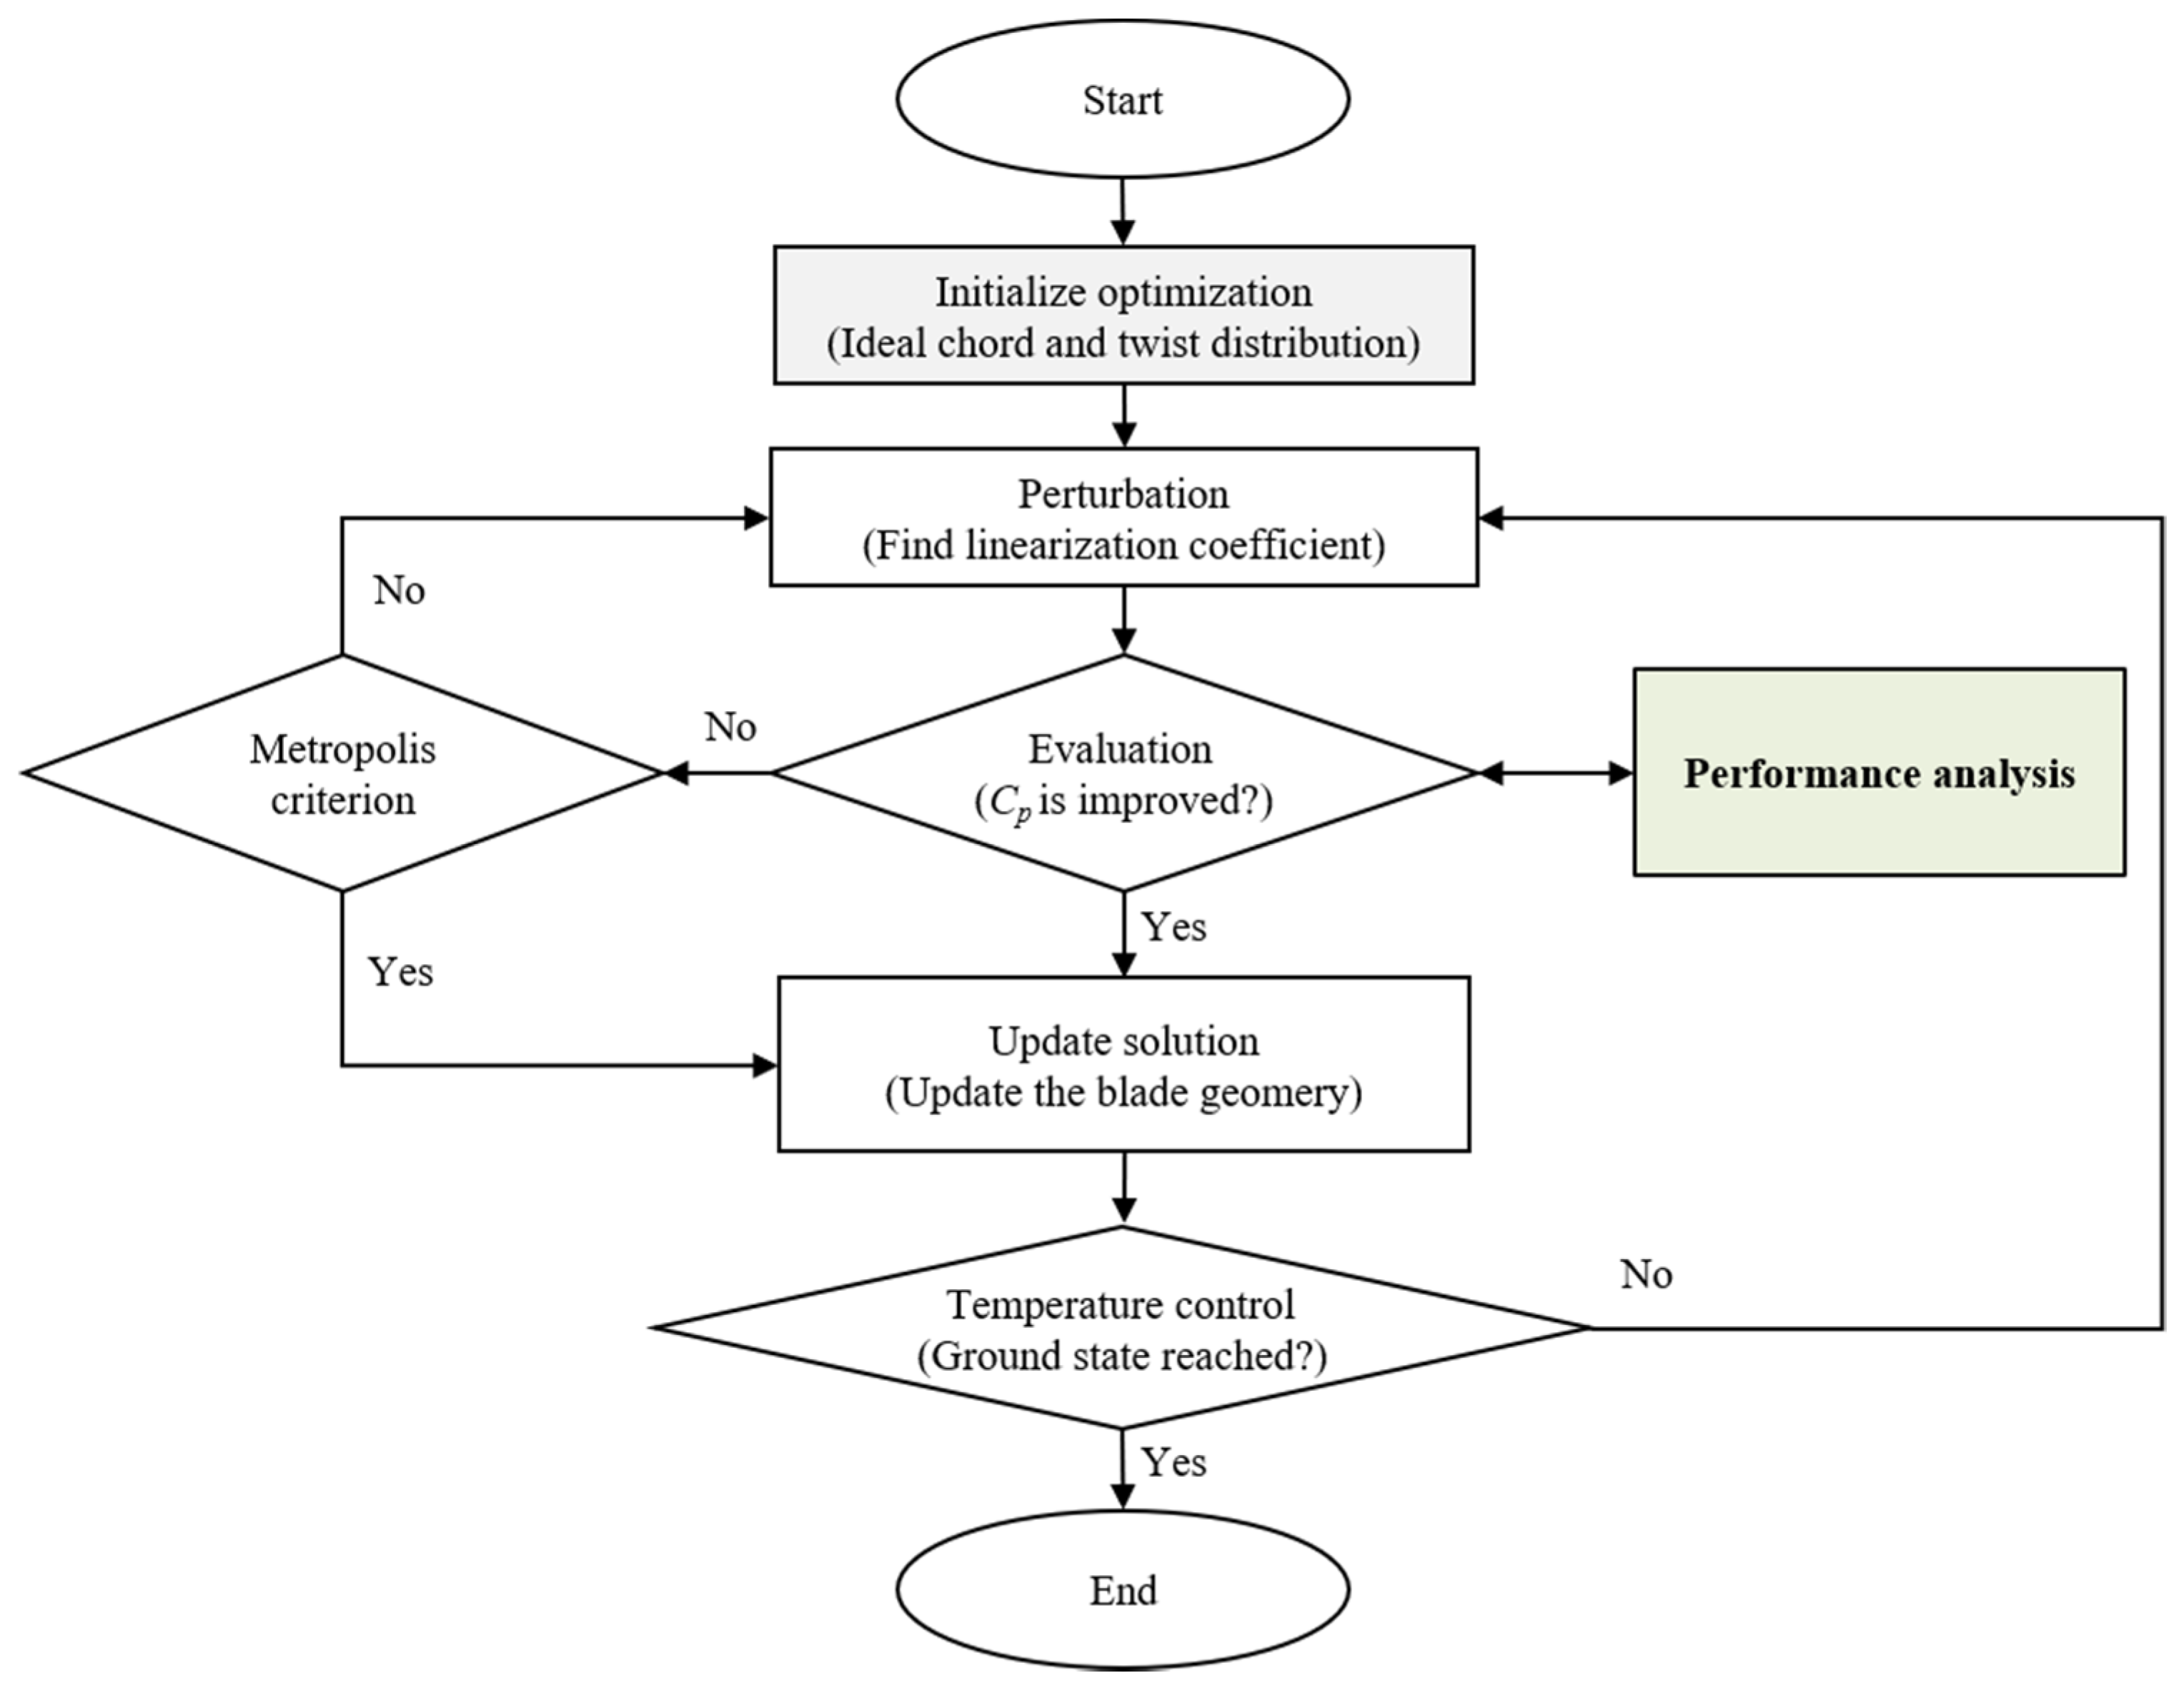
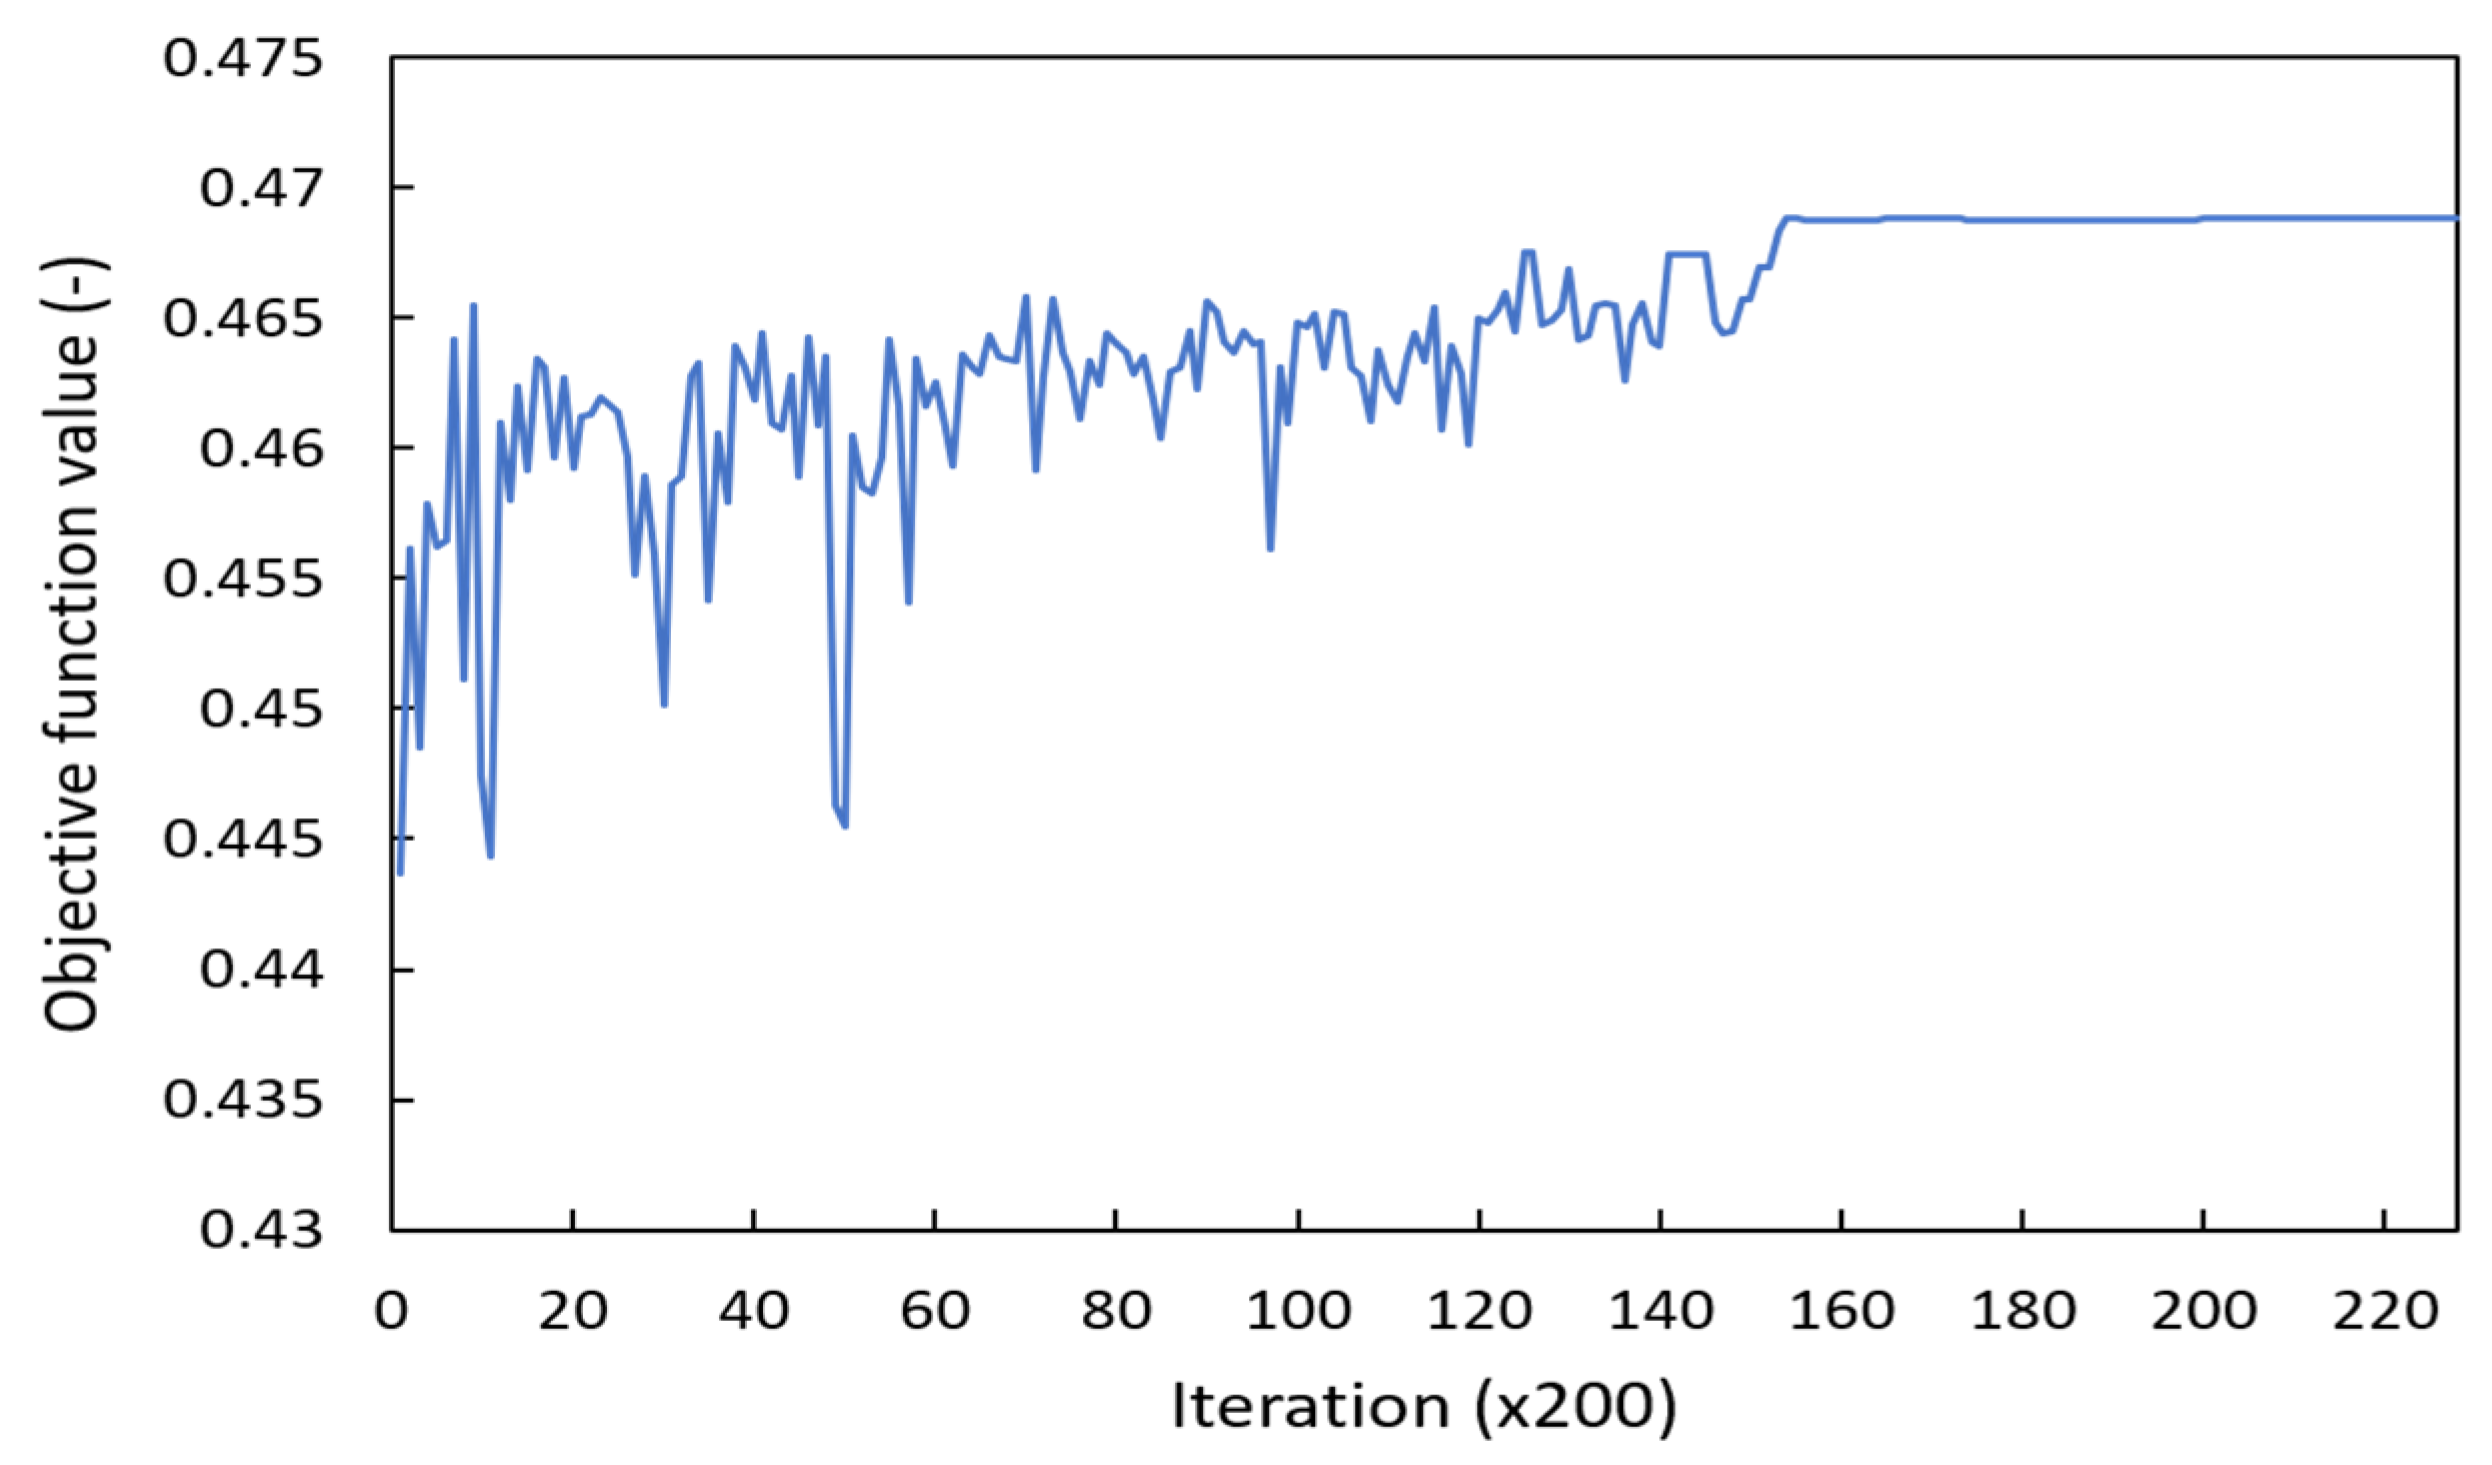
2.4. Optimization Algorithm for Linearization

Wind turbine blade geometry optimization is the process of determining the geometry that can generate the maximum aerodynamic efficiency or maximum energy of the wind turbine. From a technical perspective, it involves determining the linearized optimal chord and twist angle distribution. As shown in Figure 1, the optimization process is applied to the chord and twist angle linearization during blade design. The process of the optimization algorithm is summarized in Figure 3. The optimization algorithm used in this study was a simulated annealing (SA) algorithm. The SA algorithm is among the representative global optimization methods, along with GA, and simulates the annealing process in metallurgy [25].
The main steps in the SA algorithm are initialization, perturbation, and evaluation, and the temperature parameter controls all of these steps. The temperature parameter is not the actual temperature, but rather a computational parameter that controls the solution selection probability in the process of finding an optimal solution in the SA algorithm. As shown in Figure 3, the geometry derived from the theoretical blade design is initialized, and the perturbation process finds the coefficients of the linear functions (Equations (4), (5) and (6)) for the chord and twist distribution. A solution search is performed on a probabilistic basis and controlled by the abovementioned temperature parameter. The initial temperature parameter may be set to 1.0 or lower depending on the characteristics of the problem. The temperature parameter gradually decreases in a manner similar to that in the annealing process for metals. A linearly fast temperature decrease increases the possibility of convergence to local optima, and a logarithmically slow decrease increases the performance time. In the evaluation step, the optimization objective function is evaluated.
The Metropolis criterion is a selection process that determines whether to accept a candidate solution or not. Basically, a candidate solution will be accepted as the current solution if the objective function value improves in the evaluation. However, even a candidate solution (Scandidate) that became worse during the perturbation, depending on the probability of the Metropolis criterion, can be accepted as the current solution (Scurrent). This characteristic of the SA algorithm avoids the possibility of convergence to the local optima. The Metropolis criterion, based on the Metropolis–Hastings algorithm, is as follows:
P m e t r o = exp ( Δ cos t T ) ,
S c u r r e n t = { S c a n d i d a t e ,       if    P m e t r o > P r a n d S c u r r e n t ,          otherwise ,
where Pmetro is a metropolis probability, ∆cost is the difference between a candidate value and the current value, Prand is a probability obtained using the random number generator function, and T is the current temperature parameter.
The parameters of the optimization algorithm were determined based on the preliminary performance. For the initial temperature, 0.3 was applied because the solutions only fluctuated without improvement until approximately 0.3. A high temperature parameter increased the probability of selecting a worse solution. For the stopping temperature, a marginal value in which there is no improvement of the solution even after a long execution time was selected. The related parameters are listed in Table 1.
In this study, the purpose of blade geometry optimization was to maximize the aerodynamic performance, i.e., to maximize the power coefficient. However, the maximum power coefficient varies depending on the design TSR, and a blade design based on a specific design TSR exhibits the maximum efficiency only under the specific corresponding wind conditions. As the wind varies continuously, it is necessary to consider the power coefficient at various operational TSRs to ensure satisfactory blade performance under different wind speed conditions. Therefore, in this study, the following objective function that considers multiple operational TSRs was proposed to consider off-design performance:
F o b j = λ = L 1 L 2 ( λ h λ C p , r ( λ ) d r λ ) ,
where λh is the local speed ratio at the hub. L1 and L2 are the lower and upper limits of the design TSR range. As the blade geometry and performance vary depending on the TSR design range, it is necessary to select a design range that can satisfy the target performance of the blade. Further details are provided in Section 3.

3. Effects of Linearization on Blade Performance

The effects of linearization on the aerodynamic performance of the blade were examined before optimizing the blade geometry. In addition, appropriate ranges of the coefficients of the linear functions (Equations (4)–(6)) to be applied in the blade geometry optimization were selected. If the ranges of the linearization coefficients to be searched by the algorithm are not determined, very large or thin blade geometry may exhibit high efficiency, and, thus, the optimization algorithm may derive unrealistic geometry as the final result. In addition, understanding the effects of changes in the chord and twist profiles caused by linearization on the aerodynamic performance of the blade can be helpful for blade design.

3.1. NREL 5 MW Baseline

The 5 MW baseline wind turbine developed by NREL [26] was used to evaluate the effects of blade linearization and to verify the proposed optimization algorithm. This wind turbine is a utility-scale turbine developed by NREL to support concept studies, and various research has been conducted based on the specifications of this wind turbine. Table 2 shows the specifications of the baseline wind turbine. In this study, the effects of linearization were evaluated by varying the chord and twist distribution based on the basic specifications of the NREL 5 MW baseline turbine blade, and new blade geometry was designed using the proposed optimization algorithm.

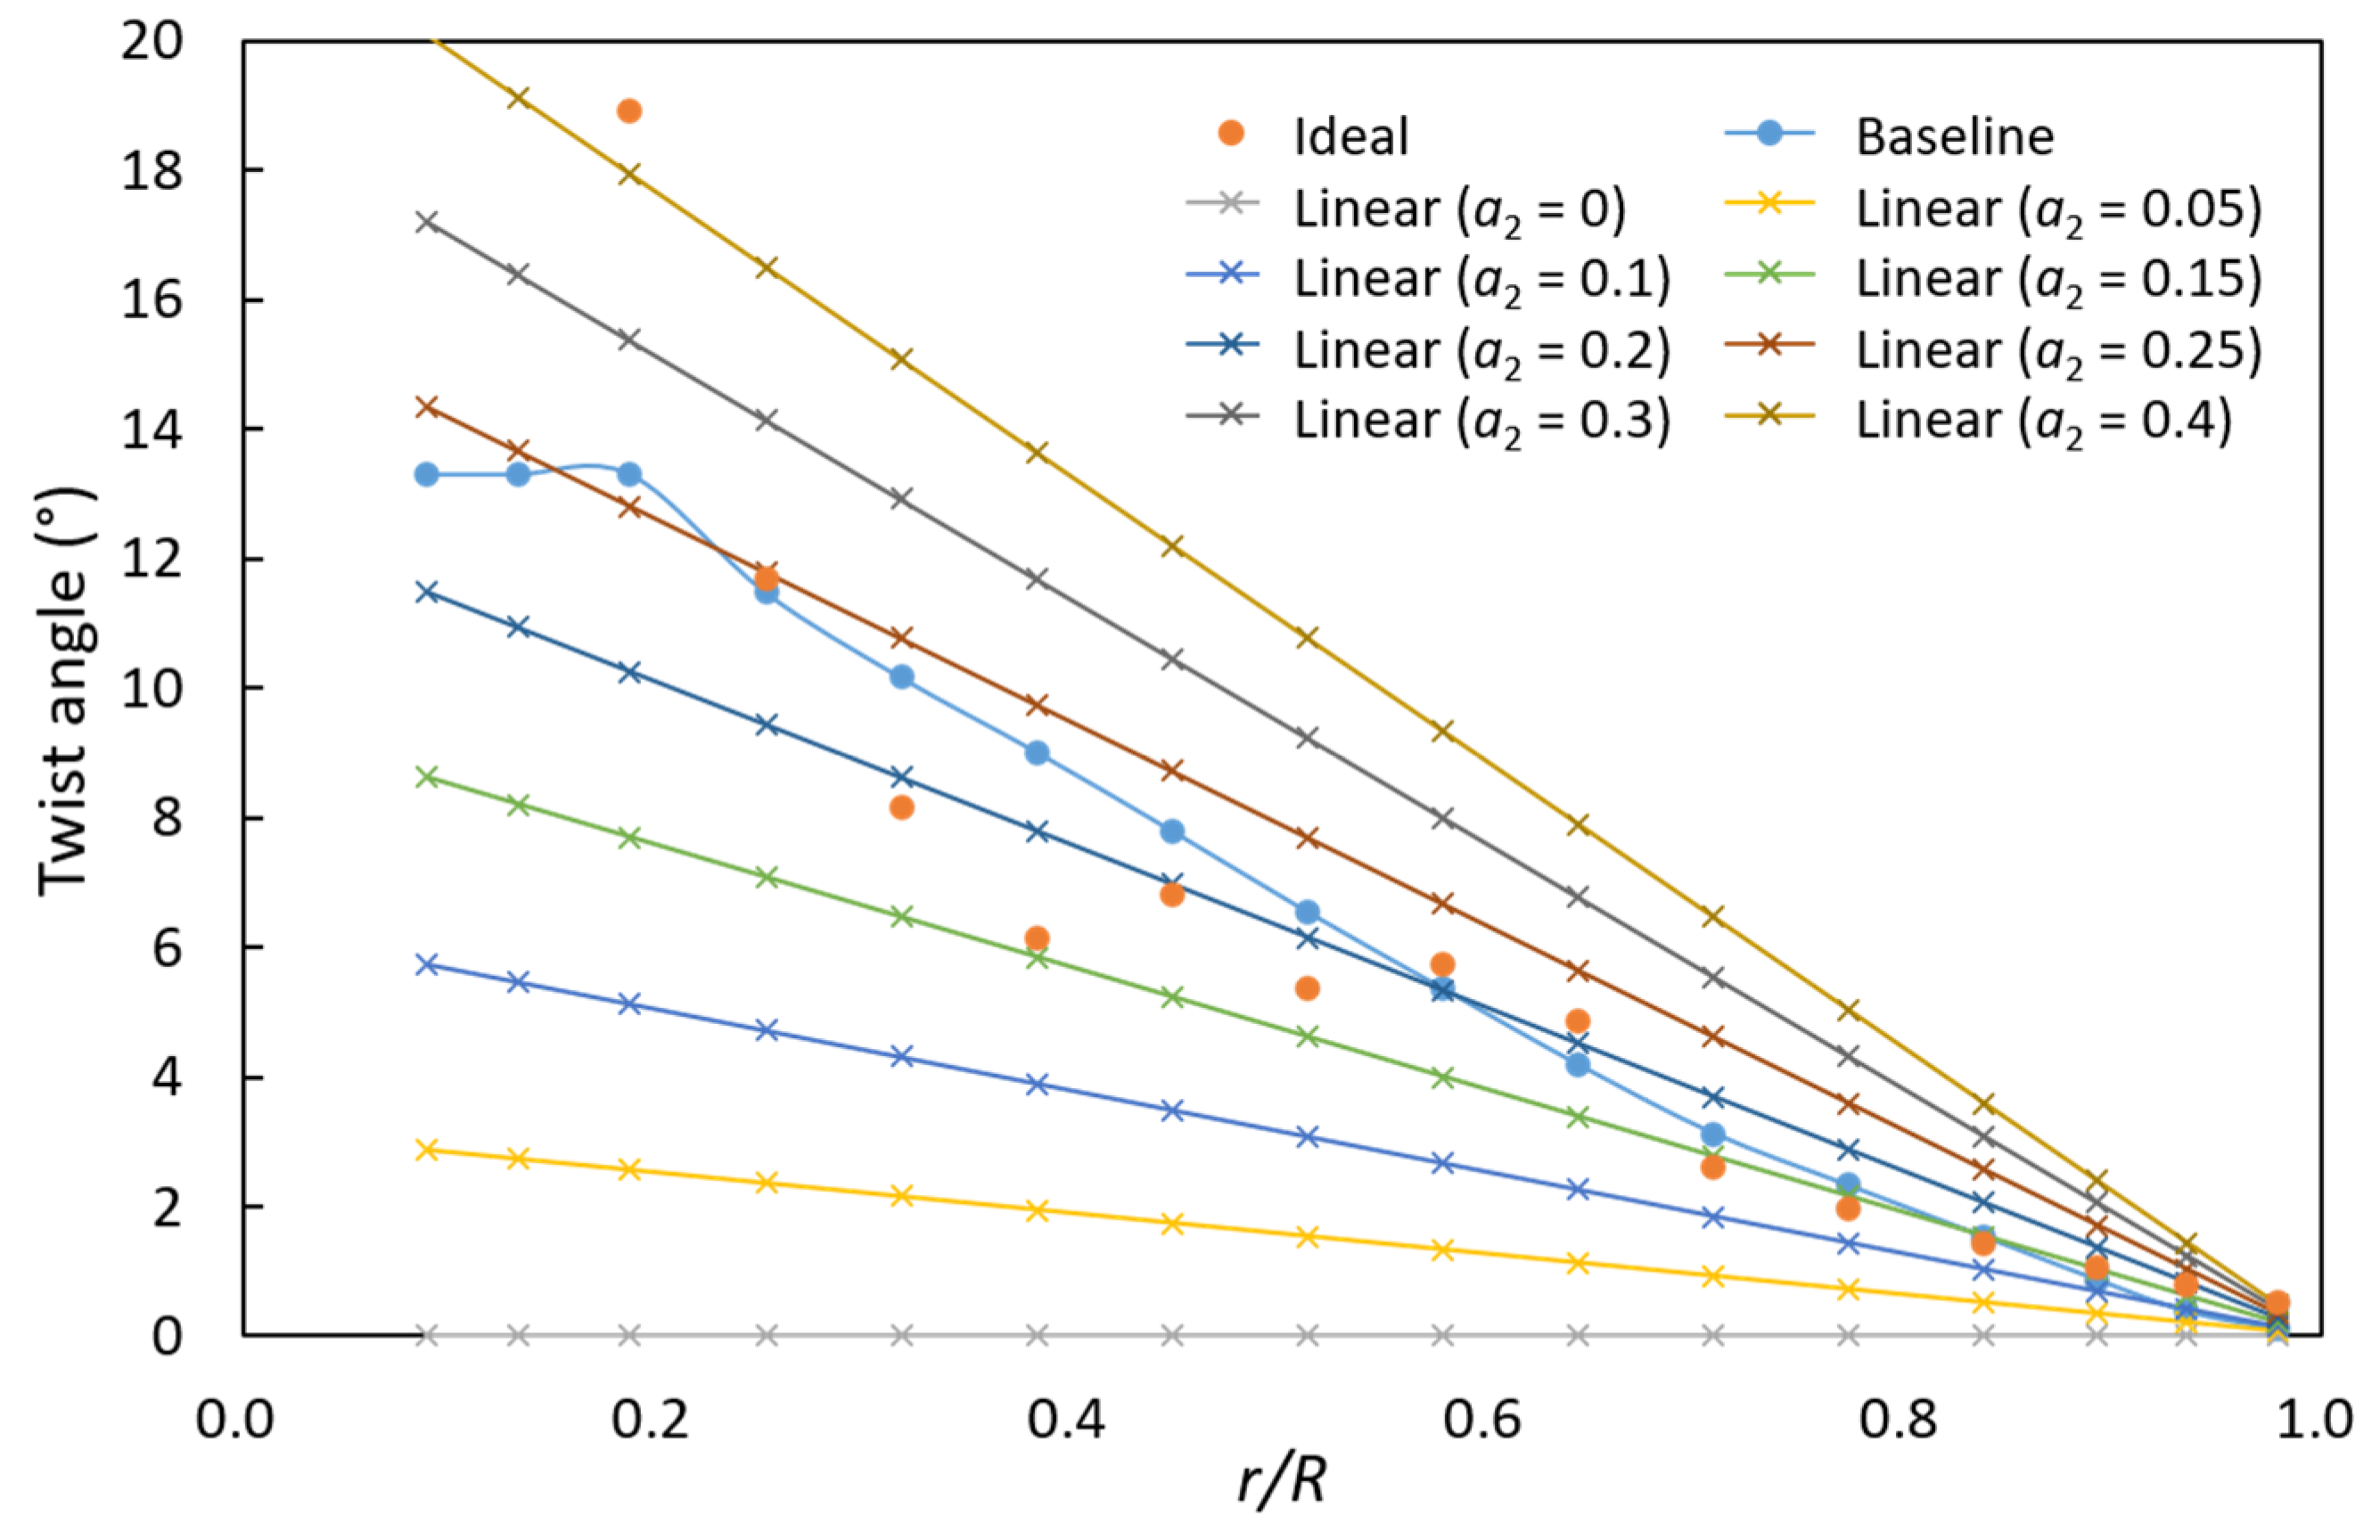
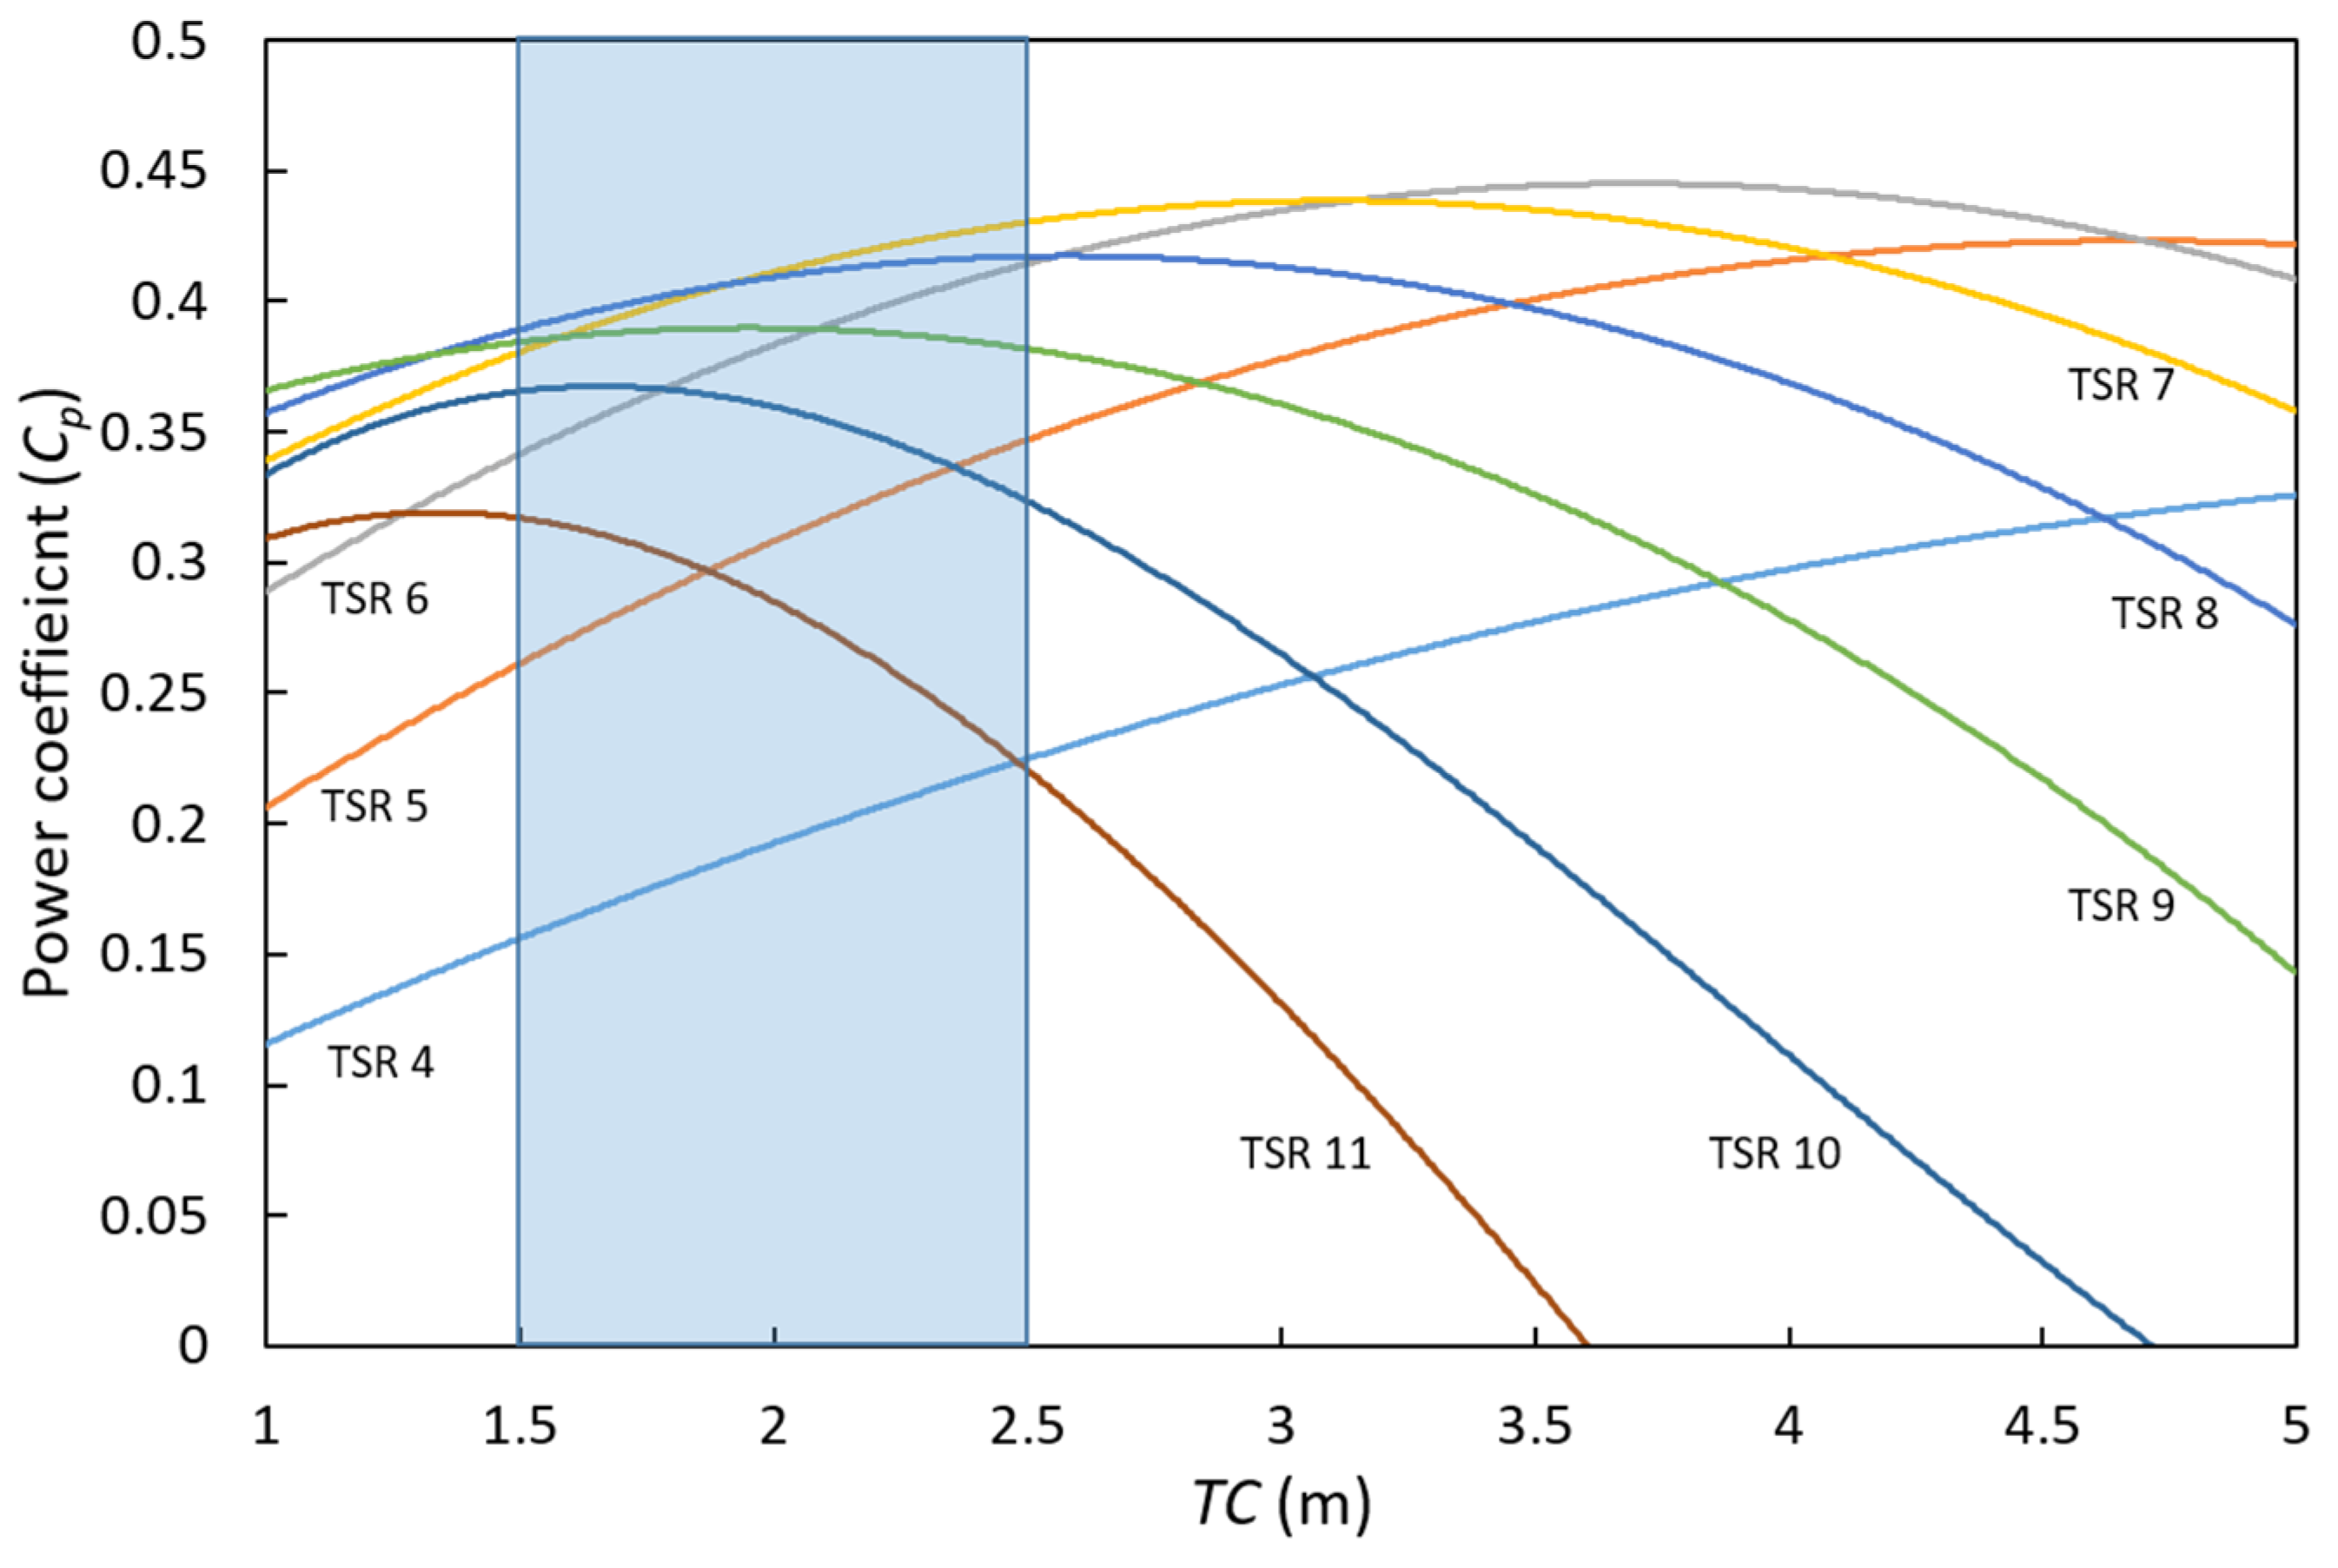
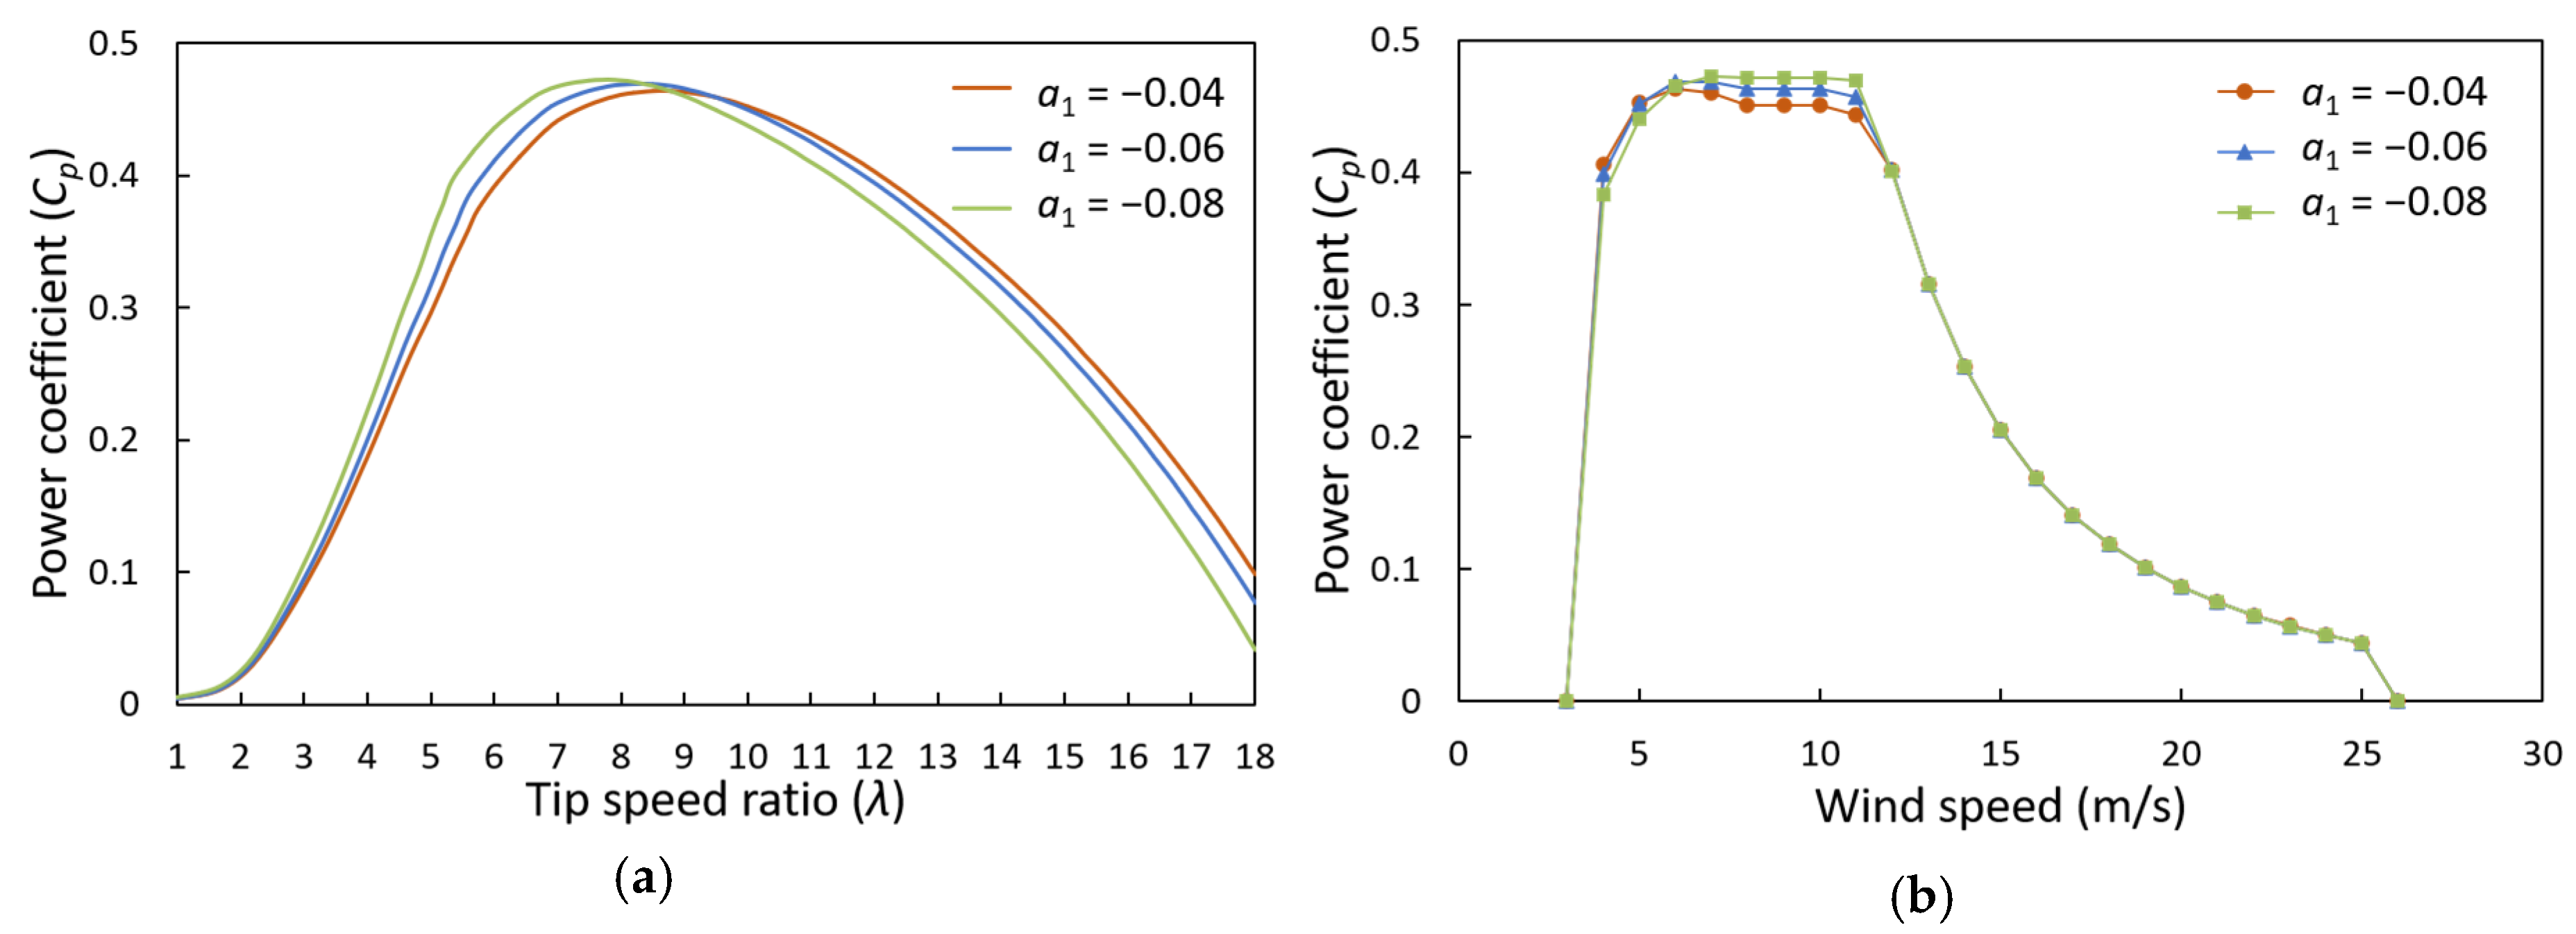
3.2. Effects of Chord and Twist Linearization

The main parameters of the chord distribution that determine the overall blade geometry are the slope (a1), and TC, which determines the intercept (b1) of the linear function (Equation (4)). In this study, between 19% and 93% of the blade length was set as the reference radius in order not to deform the tip geometry of the baseline. In addition, the blade performance was examined according to the TC and slope at the reference radius, as shown in Figure 4.
Various chord profiles to illustrate the effects of the slope of the linear function along with a baseline chord are shown in Figure 5. The ideal chord corresponds to the theoretical chord lengths of the airfoils that constitute the baseline. The chord length significantly increases toward the root section. In addition, the ideal chord values are irregular because the baseline blade was composed of various types of airfoils instead of a single type. In the NREL baseline case, NACA-series airfoils for aerodynamic performance were used in sections close to the tip and DU-series airfoils for structural stability were used toward the root section, considering structural aspects. Figure 6 presents twist profiles to elucidate the effects of twist angle linearization on the aerodynamic performance of the blade. In the case of the twist profiles, the variation of the power coefficient (Cp) was examined while the linearization coefficient (a2) in Equation (5) was varied. The Cp variation due to linearization was examined for each TSR. The TSR, an important parameter in blade design, varies depending on the blade design objective, and the blade geometry varies depending on the TSR. To ensure satisfactory blade performance under various wind speeds considering the off-design performance, it is necessary to understand the changes in aerodynamic performance due to linearization at various TSRs.
The Cp for each TSR, according to the reference chord length (TC = 1–5 m) with the chord profile slope and twist angle profiles fixed (a1 = 0.6, a2 = 0.2), is shown in Figure 7. An increase in TC increases the overall blade size, as shown in Figure 4a. Further, Cp increases at low TSRs (λ = 4–6) but rapidly decreases at high TSRs (λ = 9–11) as the blade size increases. High TSRs can be seen as low wind speed conditions because the wind speed is low compared to the rotor rotation speed. Therefore, the aerodynamic performance may decrease at low wind speeds if the blade size increases. On the other hand, low TSRs correspond to high wind speed conditions, which generally correspond to the rated power region of a wind turbine. As the wind turbine power is limited through pitch control in this region, the TSR range of interest is the high TSR range. For TSR = 7–8 with the highest power coefficient, the maximum Cp is observed when the TC is approximately 3–4 m. The Cp corresponding to high TSRs, however, significantly decreases with increasing TC length. As the overall blade size increases, the blade weight will also increase. Therefore, considering the power coefficient and blade weight at high TSRs that correspond to low wind speeds, the practical design range of the TC appears to be the 1.5–2.5 m section marked in Figure 7. To design other blades, appropriate TC ranges can be set through the same analysis process.
The Cp for each TSR according to the chord profile slope with the reference chord length and twist angle profiles fixed (TC = 2.0, a2 = 0.2) is shown in Figure 8. The blade size increases toward the root section, as shown in Figure 4b. Similar to the Cp variation with the chord length in Figure 7, Cp increases for TSR = 4–6 but decreases for TSR = 9–11 as the slope increases. Compared to the effect of the chord length increase, however, the effect of the slope change is small. For TSR = 7–8, Cp is the highest at a slope of approximately a1 = −0.13, but this situation is not realistic because the maximum chord length close to the root of the blade reaches 8 m. Therefore, a design range from −0.04 to −0.08 appears to be appropriate for the slope of the chord profile.
Next, the aerodynamic performance of the blade according to the twist angle profile was examined for each TSR (Figure 9). As the change in twist profile does not have large effects on the size and weight of a blade, it does not significantly limit the design range. Figure 9 shows the Cp variation patterns differing from those caused by the variations in chord length and slope described above. The Cp increases for TSR = 4–6, but the increment is not large. For TSR = 9–11, Cp rapidly increases and then sharply decreases at approximately a2 = 0.2. Even for TSR = 7–8, where Cp reaches its maximum, Cp slowly increases and then decreases. In the case of the twist profile, the parameter range with a high power coefficient in terms of aerodynamic performance can easily be set using the graph. In this study, the range corresponding to a2 = 0.15–0.25 was set as the design range, as shown in Figure 9.
Summarizing the power coefficient variation for each TSR caused by the linearization parameters, it is evident that the blade geometry has various effects on the power coefficient at each TSR. This finding indicates that the blade performance can be significantly limited if only a specific TSR is considered. Therefore, it is necessary to consider various TSRs, and one role of the objective function proposed in this report is to find the optimal combinations in various TSR ranges.

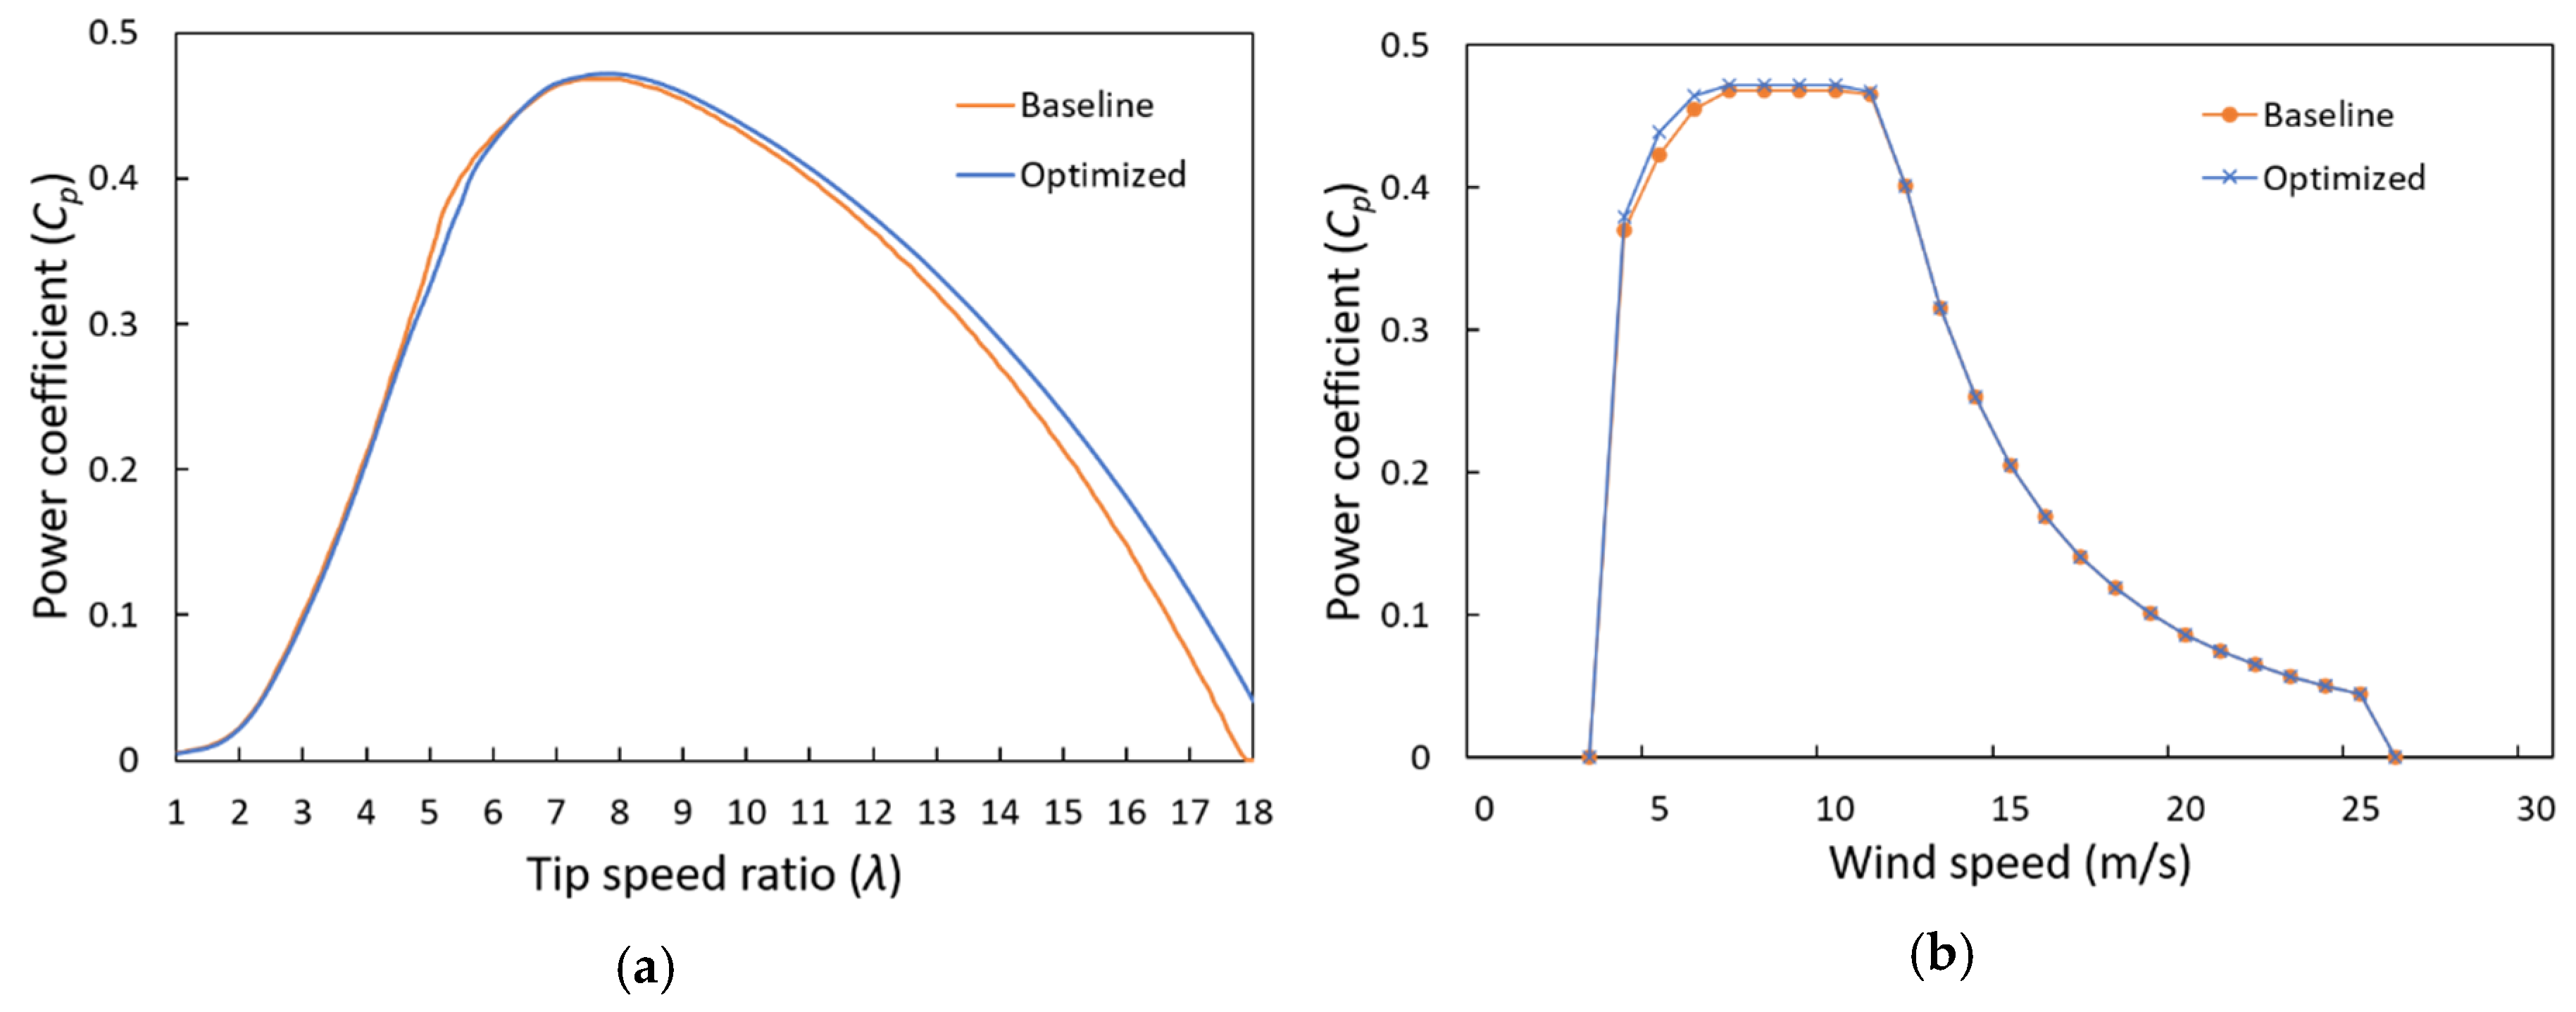
3.3. Comparison of Aerodynamic Performance

To examine the differences in the aerodynamic performance of the wind turbine blades when each blade was designed by utilizing the three linearization design ranges described above (chord length, chord slope, and twist angle profile), power coefficient was compared using FAST code developed by NREL. The comparison included the central values in the design range established in Section 3.2. Each blade was designed by applying lower and higher values with respect to the central values, and power coefficient versus TSR (Cpλ curve) and wind speeds were compared.
The FAST results for three blades with different reference tip chord lengths (TC = 1.5, 2, and 2.5 m) are shown in Figure 10. In Figure 10a, the Cpλ curve is shifted to the right (high TSR) as TC decreases. The graph of Cp versus wind speed in Figure 10b reveals that the smallest TC = 1.5 m has the highest Cp, while TC = 2 and 2.5 m show lower values at low wind speeds of 3–5 m/s. For wind speeds greater than 6 m/s, however, TC = 1.5 m exhibits the lowest Cp. In other words, as the blade chord length decreases, Cp is suitable at low wind speeds but not at high wind speeds. The results are the opposite when TC increases. Therefore, the optimal TC must be found to achieve satisfactory performance at all wind speeds. For wind speeds greater than 12 m/s, there is no difference in Cp because power control is performed for the rated power.
The FAST results for three blades with different chord profile slopes (a1 = 0.04, 0.06, and 0.08) are shown in Figure 11. The variation of Cp with the slope shows patterns similar to those in Figure 10. As an increase in chord slope also increases the blade size; the Cpλ curve is shifted to low TSRs when the chord slope increases (Figure 11a). The slope, however, has less influence than the chord length (Figure 10b and Figure 11b).
The FAST results to illustrate the differences in aerodynamic performance among three blades with different twist angle profiles (a2 = 0.15, 0.2, and 0.25) are shown in Figure 12. The Cpλ curve (Figure 12a) shows that there is no significant difference at low TSRs, and differences are observable at high TSRs. This finding indicates that the twist profile significantly affects the aerodynamic efficiency at low wind speeds. The graph of Cp versus wind speed (Figure 12b) shows that the low twist profile (a2 = 0.15) corresponds to low Cp at low wind speeds (4–7 m/s), but it has similar values at higher wind speeds.

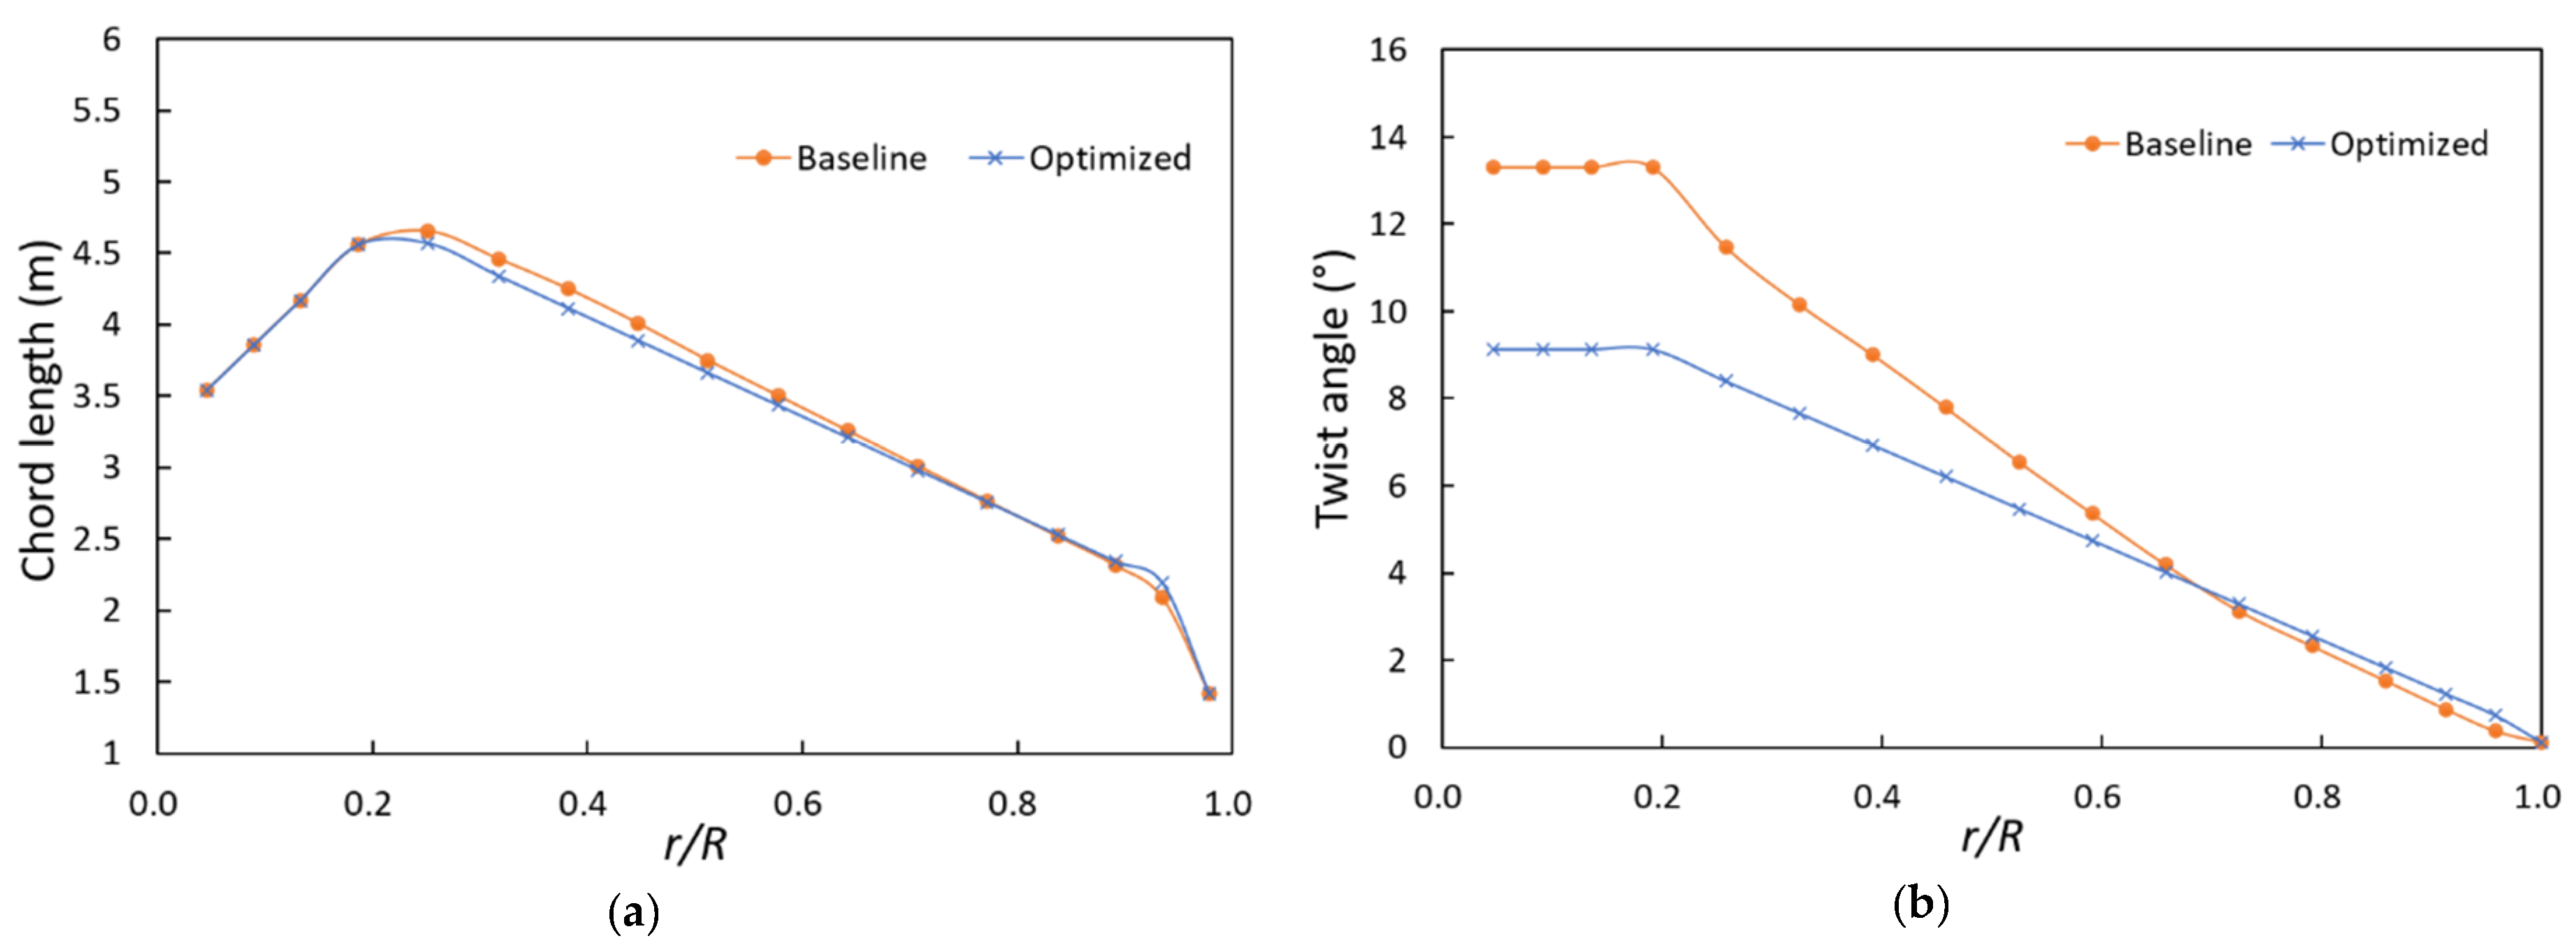
4. Wind Turbine Blade Design Optimization

This section describes the optimal blade linearization performed by applying the design ranges for chord and twist linearization given above. As mentioned above, the blade geometry has various effects on Cp at each TSR. Therefore, the purpose of optimal blade design is to find the blade geometry that can ensure optimal performance in all wind speed ranges in which a wind turbine may operate. To this end, the objective function that considers multiple TSRs, which was proposed in Section 2.4, was introduced. Table 3 summarizes the linearization coefficients selected in Section 3.2, the TSR range, and the optimal coefficients derived through optimization. Regarding the TSR range, TSR = 6–10 was applied to exclude low TSRs that do not significantly affect the aerodynamic performance at the rated wind speeds and considering low wind speeds.
Figure 13 shows the variations of the objective function value in the total performance process of the algorithm. These values improve and converge to a certain value, although they fluctuate frequently in the early stage. This behavior clearly shows the characteristics of the SA algorithm. Figure 14 shows the blade geometry and twisted section airfoil derived through optimization, and Table 4 summarizes the baseline and optimized chords and twist angles.
The chord and twist profiles of the blades derived through optimization with the NERL baseline are shown in Figure 15. In the chord profile (Figure 15a), there is no significant difference from the baseline, but the TC increases by 0.104 m and then slowly decreases toward the root section due to a reduction in the slope parameter b1. As the overall size slightly decreases, it appears that the blade weight is lower than that of the baseline. In the twist profile (Figure 15b), the twist angle decreases by up to approximately 4° toward the root section compared to the baseline. The effects of these differences in geometry on the aerodynamic load of the blade are depicted in Figure 16, which shows the normal load (Figure 16a) and tangential load (Figure 16b) distributions of the optimized blade and baseline in the rotor radial direction. In the optimized case, the aerodynamic load in the tip region is lower than that of the baseline starting at a blade length of approximately 65%, but it is higher in the other sections. As long as the aerodynamic performance is not reduced, decreasing the aerodynamic load is favourable in terms of the structural aspects of the blade.
The aerodynamic performance of the optimized blade with the NREL baseline is shown in Figure 17. The Cpλ curve (Figure 17a) shows that the Cp of the optimized blade is lower at low TSRs of 5–6 but higher when the TSR is 7 or higher. Thus, the wind turbine power can be improved at low wind speeds. The Cp versus wind speed graph (Figure 17b) shows that the optimized blade improves Cp at wind speeds of 4–6 m/s. In addition, the Cp is slightly improved at all wind speeds below the rated wind speed. As the NREL baseline also went through an optimization process in the design procedure, it may be difficult for new optimization to improve the efficiency significantly. However, the proposed optimization algorithm was verified by finding the optimal blade geometry that exhibited improved aerodynamic performance compared to the baseline. In addition, it was confirmed that the proposed objective function can produce blade designs with satisfactory aerodynamic efficiency at the targeted multiple TSRs.

5. Conclusions

In this study, the aerodynamic performance of a wind turbine blade was examined according to the chord and twist linearization parameters, which are required in blade geometry design. In addition, an optimization algorithm for the linearization and an objective function that considers multiple TSRs to satisfy the optimal aerodynamic efficiency at various wind speeds were proposed. The main conclusions drawn by analysing the effects of the blade linearization parameters (chord length, chord profile slope, and twist profile) can be summarized as follows:
(1)
In blade design, increasing the chord length increases the power coefficient at low wind speeds close to the cut-in wind speed but decreases the power coefficient towards higher wind speeds. Therefore, increasing the chord length is favourable for improving the aerodynamic efficiency at low wind speeds, but the design range must be selected considering the power coefficient reduction at high wind speeds and the weight caused by the chord length increase.
(2)
Increasing the chord profile slope has an effect similar to that of increasing the chord length, but its effect on the aerodynamic efficiency is less than that of increasing the chord length.
(3)
The twist profile mainly affects low wind speeds depending on the size of the incremental angle, and its effect on the aerodynamic performance at high wind speeds is not significant.
By applying the linearization parameter design ranges and multiple TSRs, a blade geometry that improved the power coefficient at all wind speeds below the rated wind speed compared to the NREL baseline wind turbine was derived. Therefore, it is necessary to consider multiple TSRs during blade design to satisfy the optimal aerodynamic performance at various wind speeds. As the structural performance of the blade was not addressed in this study, there is a limit to the practical blade design. In the future, based on the results of this study, further research on blade geometry optimization considering blade structural stability for more practical blade design will be conducted.

Funding

This work was supported by the Korea Institute of Energy Technology Evaluation and Planning (KETEP) grant funded by the South Korean government (MOTIE) (NO. 20173010025010 and NO. 20184030202200).

Conflicts of Interest

The author has no conflict of interest.

References

  1. Manwell, J.F.; McGowan, J.G.; Rogers, A.L. Wind Energy Explained: Theory, Design and Application; John Wiley & Sons, Ltd.: Chichester, UK, 2010. [Google Scholar]
  2. Burton, T.; Jenkins, N.; Sharpe, D.; Bossanyi, E. Wind Energy Handbook, 2nd ed.; John Wiley & Sons, Ltd.: Chichester, UK, 2011. [Google Scholar]
  3. Glauert, H. Airplane Propellers, Aerodynamic Theory; Springer: New York, NY, USA, 1963. [Google Scholar]
  4. Wilson, R.E.; Lissaman, P.B.S. Applied Aerodynamics of Wind Power Machines; Oregon State University: Corvallis, OR, USA, 1974. [Google Scholar]
  5. Wilson, R.E.; Lissaman, P.B.S.; Walker, S.N. Aerodynamic Performance of Wind Turbines; Oregon State University: Corvallis, OR, USA, 1976. [Google Scholar]
  6. Johansen, J.; Madsen, H.A.; Gaunaa, M.; Bak, C.; Srensen, N.N. Design of a wind turbine rotor for maximum aerodynamic efficiency. Wind Energy 2009, 12, 261–273. [Google Scholar] [CrossRef]
  7. Vaz, J.R.P.; Pinho, J.T.; Mesquita, A.L.A. An extension of BEM method applied to horizontal-axis wind turbine design. Renew. Energy 2011, 36, 1734–1740. [Google Scholar] [CrossRef] [Green Version]
  8. Dai, J.C.; Hu, Y.P.; Liu, D.S.; Long, X. Aerodynamic loads calculation and analysis for large scale wind turbine based on combining BEM modified theory with dynamic stall model. Renew. Energy 2011, 36, 1095–1104. [Google Scholar] [CrossRef]
  9. Lanzafame, R.; Messina, M. BEM theory: How to take into account the radial flow inside of a 1-D numerical code. Renew. Energy 2012, 39, 440–446. [Google Scholar] [CrossRef]
  10. Yang, H.; Shen, W.; Xu, H.; Hong, Z.; Liu, C. Prediction of the wind turbine performance by using BEM with airfoil data extracted from CFD. Renew. Energy 2014, 70, 107–115. [Google Scholar] [CrossRef]
  11. Maalawi, K.Y.; Badr, M.A. A practical approach for selecting optimum wind rotors. Renew. Energy 2003, 28, 803–822. [Google Scholar] [CrossRef]
  12. Liu, X.; Wang, L.; Tang, X. Optimized linearization of chord and twist angle profiles for fixed-pitch fixed-speed wind turbine blades. Renew. Energy 2013, 57, 111–119. [Google Scholar] [CrossRef]
  13. Yang, Z.; Yin, M.; Xu, Y.; Zhang, Z.; Zou, Y.; Dong, Z.Y. A multi-point method considering the maximum power point tracking dynamic process for aerodynamic optimization of variable-speed wind turbine blades. Energies 2016, 9, 425. [Google Scholar] [CrossRef] [Green Version]
  14. Tahani, M.; Kavari, G.; Masdari, M.; Mirhosseini, M. Aerodynamic design of horizontal axis wind turbine with innovative local linearization of chord and twist distributions. Energy 2017, 131, 78–91. [Google Scholar] [CrossRef]
  15. Yin, M.; Yang, Z.; Xu, Y.; Liu, J.; Zhou, L.; Zou, Y. Aerodynamic optimization for variable-speed wind turbines based on wind energy capture efficiency. Appl. Energy 2018, 221, 508–521. [Google Scholar] [CrossRef]
  16. Selig, M.S. Application of a Genetic Algorithm to Wind Turbine Design. ASME 1996, 118, 22–28. [Google Scholar] [CrossRef] [Green Version]
  17. Fuglsang, P.; Madsen, H.A. Optimization method for wind turbine rotors. J. Wind Eng. Ind. Aerodyn. 1999, 80, 191–206. [Google Scholar] [CrossRef]
  18. Jureczko, M.; Pawlak, M.; Mȩzyk, A. Optimisation of wind turbine blades. J. Mater. Process Technol. 2005, 167, 463–471. [Google Scholar] [CrossRef]
  19. Méndez, J.; Greiner, D. Wind blade chord and twist angle optimization using genetic algorithms. In Proceedings of the 5th International Conference on Engineering Computational Technology, Las Palmas de Gran Canaria, Spain, 12–15 September 2009; Civil-Comp: Stirlingshire, UK, 2009. [Google Scholar]
  20. Polat, O.; Tuncer, I.H. Aerodynamic shape optimization of wind turbine blades using a parallel genetic algorithm. Procedia Eng. 2013, 61, 28–31. [Google Scholar] [CrossRef] [Green Version]
  21. Tahani, M.; Sokhansefat, T.; Rahmani, K.; Ahmadi, P. Aerodynamic optimal design of wind turbine blades using genetic algorithm. Energy Equip. Syst. 2014, 2, 185–193. [Google Scholar]
  22. Ashuri, T.; Zaaijer, M.B.; Martins, J.R.R.A.; van Bussel, G.J.W.; van Kuik, G.A.M. Multidisciplinary design optimization of offshore wind turbines for minimum levelized cost of energy. Renew. Energy 2014, 68, 893–905. [Google Scholar] [CrossRef] [Green Version]
  23. Vianna Neto, J.X.; Guerra Junior, E.J.; Moreno, S.R.; Hultmann Ayala, H.V.; Mariani, V.C.; dos Santos Coelho, L. Wind turbine blade geometry design based on multi-objective optimization using metaheuristics. Energy 2018, 162, 645–658. [Google Scholar] [CrossRef]
  24. Hansen, M.O.L.; Sørensen, J.N.; Voutsinas, S.; Sørensen, N.; Madsen, H.A. State of the art in wind turbine aerodynamics and aeroelasticity. Prog. Aerosp. Sci. 2006, 42, 285–330. [Google Scholar] [CrossRef]
  25. Brownlee, J. Clever Algorithms: Nature-Inspired Programming Recipes; Lulu Press: Morrisville, NC, USA, 2011. [Google Scholar]
  26. Jonkman, J.; Butterfield, S.; Musial, W.; Scott, G. Definition of a 5-MW Reference Wind Turbine for Offshore System Development; National Renewable Energy Lab. (NREL): Golden, CO, USA, 2009.
Figure 1. Optimal blade design procedure using BEM theory and optimization algorithm.
Energies 13 02320 g001
Figure 2. Wind velocities and forces on the airfoil in a blade section [1].
Energies 13 02320 g002
Figure 3. Optimization process for linearization of the chord and twist distributions.
Energies 13 02320 g003
Figure 4. Concept illustration for analysis of the linearization effect: (a) chord length and (b) chord profile slope.
Energies 13 02320 g004
Figure 5. Chord profiles according to the slope for analysis of the linearization effect.
Energies 13 02320 g005
Figure 6. Twist profiles of the blade for analysis of the linearization effect.
Energies 13 02320 g006
Figure 7. Variation of the power coefficient with the reference chord length at each TSR.
Energies 13 02320 g007
Figure 8. Variation of the power coefficient with the chord slope parameter at each TSR.
Energies 13 02320 g008
Figure 9. Variation of the power coefficient with the twist linear parameter at each TSR.
Energies 13 02320 g009
Figure 10. Aerodynamic performance according to the chord length: power coefficient versus (a) TSR and (b) wind speed.
Energies 13 02320 g010
Figure 11. Aerodynamic performance according to the chord profile slope: power coefficient versus (a) TSR and (b) wind speed.
Energies 13 02320 g011
Figure 12. Aerodynamic performance according to the twist profile: power coefficient versus (a) TSR and (b) wind speed.
Energies 13 02320 g012
Figure 13. Variation of the objective function value in the optimization process.
Energies 13 02320 g013
Figure 14. Optimized results: (a) blade geometry and (b) twisted section airfoils.
Energies 13 02320 g014
Figure 15. Chord and twist distributions of the baseline and optimized blades: (a) chord profiles and (b) twist angle profiles.
Energies 13 02320 g015
Figure 16. Aerodynamic load distributions of the baseline and optimized blades at a wind speed of 10 m/s: (a) normal load and (b) tangential load.
Energies 13 02320 g016
Figure 17. Aerodynamic performance of the baseline and optimized blades: power coefficient versus (a) TSR and (b) wind speed.
Energies 13 02320 g017
Table 1. Parameters of the optimization algorithm.
ParameterValue
Initial temperature (−)0.3
Stopping temperature (−)0.001
Temperature control T i = 0.98 T i 1
Iteration at each temperature200
Table 2. Properties of the NREL baseline wind turbine.
PropertyValue
Rated power (MW)5
Number of blades3
Hub height (m)90
Rotor diameter (m)126
Cut-in, rated, cut-out wind speed (m/s)3, 11.4, 25
Cut-in, rated rotor speed (rpm)6.9, 12.1
Rated tip speed (m/s)80
Table 3. Linearization coefficient ranges for blade geometry optimization.
ParameterLower BoundOptimizedUpper Bound
Reference chord length (TC) (m)1.52.192.5
Chord slope coefficient (a1) (−)−0.04−0.0552−0.08
Twist linear coefficient (a2) (−)0.150.1780.25
Design TSR (λ) (−)610
Table 4. Chord and twist distributions of baseline and optimized blades.
r/RBaselineOptimized
Chord (m)Twist (°)Chord (m)Twist (°)
0.053.54213.3083.5429.123
0.093.85413.3083.8549.123
0.134.16713.3084.1679.123
0.194.55713.3084.5579.123
0.254.65211.4804.5678.393
0.324.45810.1624.3407.663
0.384.2499.0114.1146.933
0.454.0077.7953.8886.203
0.513.7486.5443.6615.473
0.583.5025.3613.4354.744
0.643.2564.1883.2094.014
0.713.0103.1252.9823.284
0.772.7642.3192.7562.554
0.842.5181.5262.5301.825
0.892.3130.8632.3411.216
0.932.0860.3702.1900.730
0.981.4190.1061.4190.106

