Article

Effects of Concentration Variations on the Performance and Microbial Community in Microbial Fuel Cell Using Swine Wastewater

1
School of Mechanical Engineering, Nantong University, Nantong 226019, China
2
Graduate School of Advanced Technology and Science, University of Tokushima, Tokushima 770-8506, Japan
*
Author to whom correspondence should be addressed.
Energies 2020, 13(9), 2231; https://doi.org/10.3390/en13092231
Submission received: 12 March 2020 / Revised: 14 April 2020 / Accepted: 26 April 2020 / Published: 3 May 2020
(This article belongs to the Special Issue Wastewater Treatment and Resource Recovery)

Abstract

:
The variation of substrate concentration in anode chamber directly affects the power generation efficiency and decontamination performance of microbial fuel cell (MFC). In this study, three concentrations of swine wastewater with 800 mg/L, 1600 mg/L and 2500 mg/L were selected as substrates, and the performance of MFC and response characteristics of anode microbial community were investigated. The results show that the concentration of a selected substrate is positively correlated with the output voltage of MFC and chemical oxygen demand (COD) removal rate. The microbial community diversity in the anode chamber and the performance of battery can be significantly affected when concentration changes in different ways, which helps to selectively cultivate the adaptable dominant bacteria to enhance the stability and decontamination performance of MFC. The community structure of anodic biofilm is mainly composed of Proteobacteria, Bacteroidetes, Firmicutes, Chloroflexi and Spirochaetae. These findings are meaningful to improve the treatment effects of swine wastewater and can help to find out the mechanism of varying concentration that influences the production of microorganisms in MFC.

1. Introduction

It is well known that the swine industry has been developing rapidly over recent years [1]. However, the improper disposal of most swine wastewater seriously affects the sustainable development of the environment and the economy [2,3]. Currently, the treatment methods of livestock wastewater mainly include the returning farmland mode, the natural mode and the factory mode, which are costly, resource wasting and lead to unavoidable secondary pollution [4]. It is particularly emergent to make swine wastewater profitable at a lower cost due to its abundance.
The advent of microbial fuel cell (MFC) has provided a solution to cope with wastewater and convert chemical energy into electric energy efficiently [5]. By suspending microorganisms in the anode chamber, MFC can degrade the complex organic compounds by the exoelectrogens attached on the anode and produce electrons, which will pass the anode and reach the cathode through the external circuit [6]. The protons produced by this anodic reaction are diffused through the isolation membrane between the anode and cathode chamber, which can combine with the electrons in the cathode chamber from an external loop to generate current [7]. However, the efficiency of MFCs is too low, which prevents it from being used widely in practice [8].
The researches into MFC have paid most attention to the materials or structure, while the microorganisms and operation environment of the MFC has been largely neglected [9,10]. It was found that the chemical oxygen demand (COD) of swine wastewater fluctuated frequently when climate changed through field sampling, which directly affected the microorganism inside MFCs [11]. Feng et al. investigated the effect of substrate concentration on MFC performance by using sodium acetate as wastewater. It was found that when the substrate concentration increased, the anode biomass and COD removal rate decreased, and the power density increased [12]. Wang et al. found that the sustaining time of current generated in MFC by using turmeric water as a substrate decreased with the increase of COD, which means excessive COD may have an inhibitory effect on microorganisms [13]. At present, most of the researches working on the impact of COD on MFC performance did not use the actual wastewater. Moreover, they did not systematically explore the effect of wastewater concentration on microbial community structure, not to mention the influence mechanism of concentration variation on MFC [14]. Therefore, it is critical to investigate the influence of the concentration variation of swine wastewater on the performance of MFC, as well as the microbial community near anode.
In this study, parallel-operated double-chambered MFCs using actual swine wastewater as the substrate were constructed. Based on the field investigation, the concentrations of 800 mg/L, 1600 mg/L and 2500 mg/L were chosen to compare the effects on the performance of MFCs. The influence mechanism of concentration variation on the performance of the battery was analyzed from the perspective of the biological community. The predominant flora of MFC based on swine wastewater under the condition of variable concentration is preliminarily determined. The experimental results could provide guidance for livestock wastewater treatment and MFC performance enhancement. Moreover, the influence mechanism of substrate concentration variation on the production of microorganisms is exhibited.

2. Materials and Methods

2.1. Materials

As shown in Figure 1, four identical double-chambered MFC reactors (250 mL) were fabricated using transparent plexiglass, which were separated by the Nafion 117 proton exchange membranes (50 mm * 50 mm) from DuPont (DuPont China Holding Co., Ltd. Beijing Branch, Beijing, China). All carbon cloth anodes (Φ16 mm, HCP330N, Shanghai Hesen Electric Co., Ltd., Shanghai, China) were first soaked in acetone for 3 h and then rinsed with the ultrapure water to neutrality. Finally, they were dried under 60 °C for spare. The cathode employed the same carbon cloth material as anodes, with 0.35 mg/m2 Pt catalyst distributed on its surface. The two electrodes of MFC were connected by an external titanium conductor with resistance of 1000 Ω to form a closed-loop circuit.
The inoculation solution of anode chamber included anaerobic sludge, swine wastewater and inoculum. Inoculum was arranged as previously described. The solution in cathode chamber was comprised of 0.1 mol/L K3[Fe (CN)6] and 50 mM phosphate buffer [15]. Anaerobic sludge was initially collected from a sewage disposal factory in Nantong, China. After two weeks of anaerobic incubation, it was filled to the anode chamber in MFCs. Swine wastewater was obtained from the supernatant of a pig farm in Nantong before fermentation, and stored in the refrigerator with a temperature of 4 °C.

2.2. Construction and Operation

Each MFC reactor used in the experiment started in fed-batch mode based on 2500 mg/L of swine wastewater, and the anode solution was updated every 48 h. The experiment was divided into 3 phases. Phase 1: two reactors were filled with 800 mg/L (recorded as L) and 2500 mg/L (recorded as H) swine wastewater respectively for 2 cycles, while another two reactors were both filled with 1600 mg/L swine wastewater, which were recorded as M_H_L, and M_L_H, separately. Phase 2: The M_H_L and M_L_H were swapped with 2500 mg/L and 800 mg/L swine wastewater and ran for 2 cycles. The H and L continued to run without replacing the anolyte. Phase 3: the M_H_L and M_L_H were replaced with 800 mg/L and 2500 mg/L swine wastewater, respectively, and operated for another 2 cycles, as shown in Figure 2. All reactors were operated at a temperature of 30 °C. After two weeks of stable operation, the stable voltage profiles, polarization curves, COD removal rates and microbial diversity were measured three times, respectively.

2.3. Statistical Analysis

With the help of the upper computer of LabVIEW, the external voltage of MFC was measured and recorded online using a data acquisition board (NI USB-6343, National Instruments Co., Ltd., Guangdong, China). The detection frequency was 60 times/h. The polarization curve and power density curve were drawn by steady state discharge method [16]. The power density was calculated by the following formula:
P A n = U 2 R e x × S A n
where PAn is power density (MW/m2); U is operating voltage (mV); Rex is external circuit resistance (Ω); SAn is anode electrode surface area (m2).
The sewage samples purified by MFC were filtered by 0.45 μm drainage membrane (Jingteng Experimental Equipment Co., Ltd., Tianjin, China). The COD concentrations were measured by water quality analyzer (DR3900, HACH, CO, USA) and the COD removal rates were calculated.
The PowerSoilTM DNA isolation Kit (MoBio, Carlsbad, CA, USA) was used to extract the DNA of MFC anode biofilm after two cycles of stable operations. The 16S universal primers 338F (5′-ACTCCTACGGGAGGCAGCA-3′) and 806R (5′-GGACTACHVGGGTWTCTAAT-3′) were used to amplify the V3~V4 regions of the 16S rDNA gene. Barcoded 16S rDNA gene polymerase chain reaction (PCR) amplicons were derived in sequence on the Illumina Miseq platform. The qualified sequences were clustered into operational taxonomic units (OTUs) with 97% similarity cutoff by the SRA (Sequence Read Archive, http://www.ncbi.nlm.nih.gov/Traces/sra). In order to analyze microbial community diversity and microbial community at all levels, the results were used to calculate the indexes of Chao, Heip, Shannon and Coverage [17].

3. Results

3.1. MFC Performance

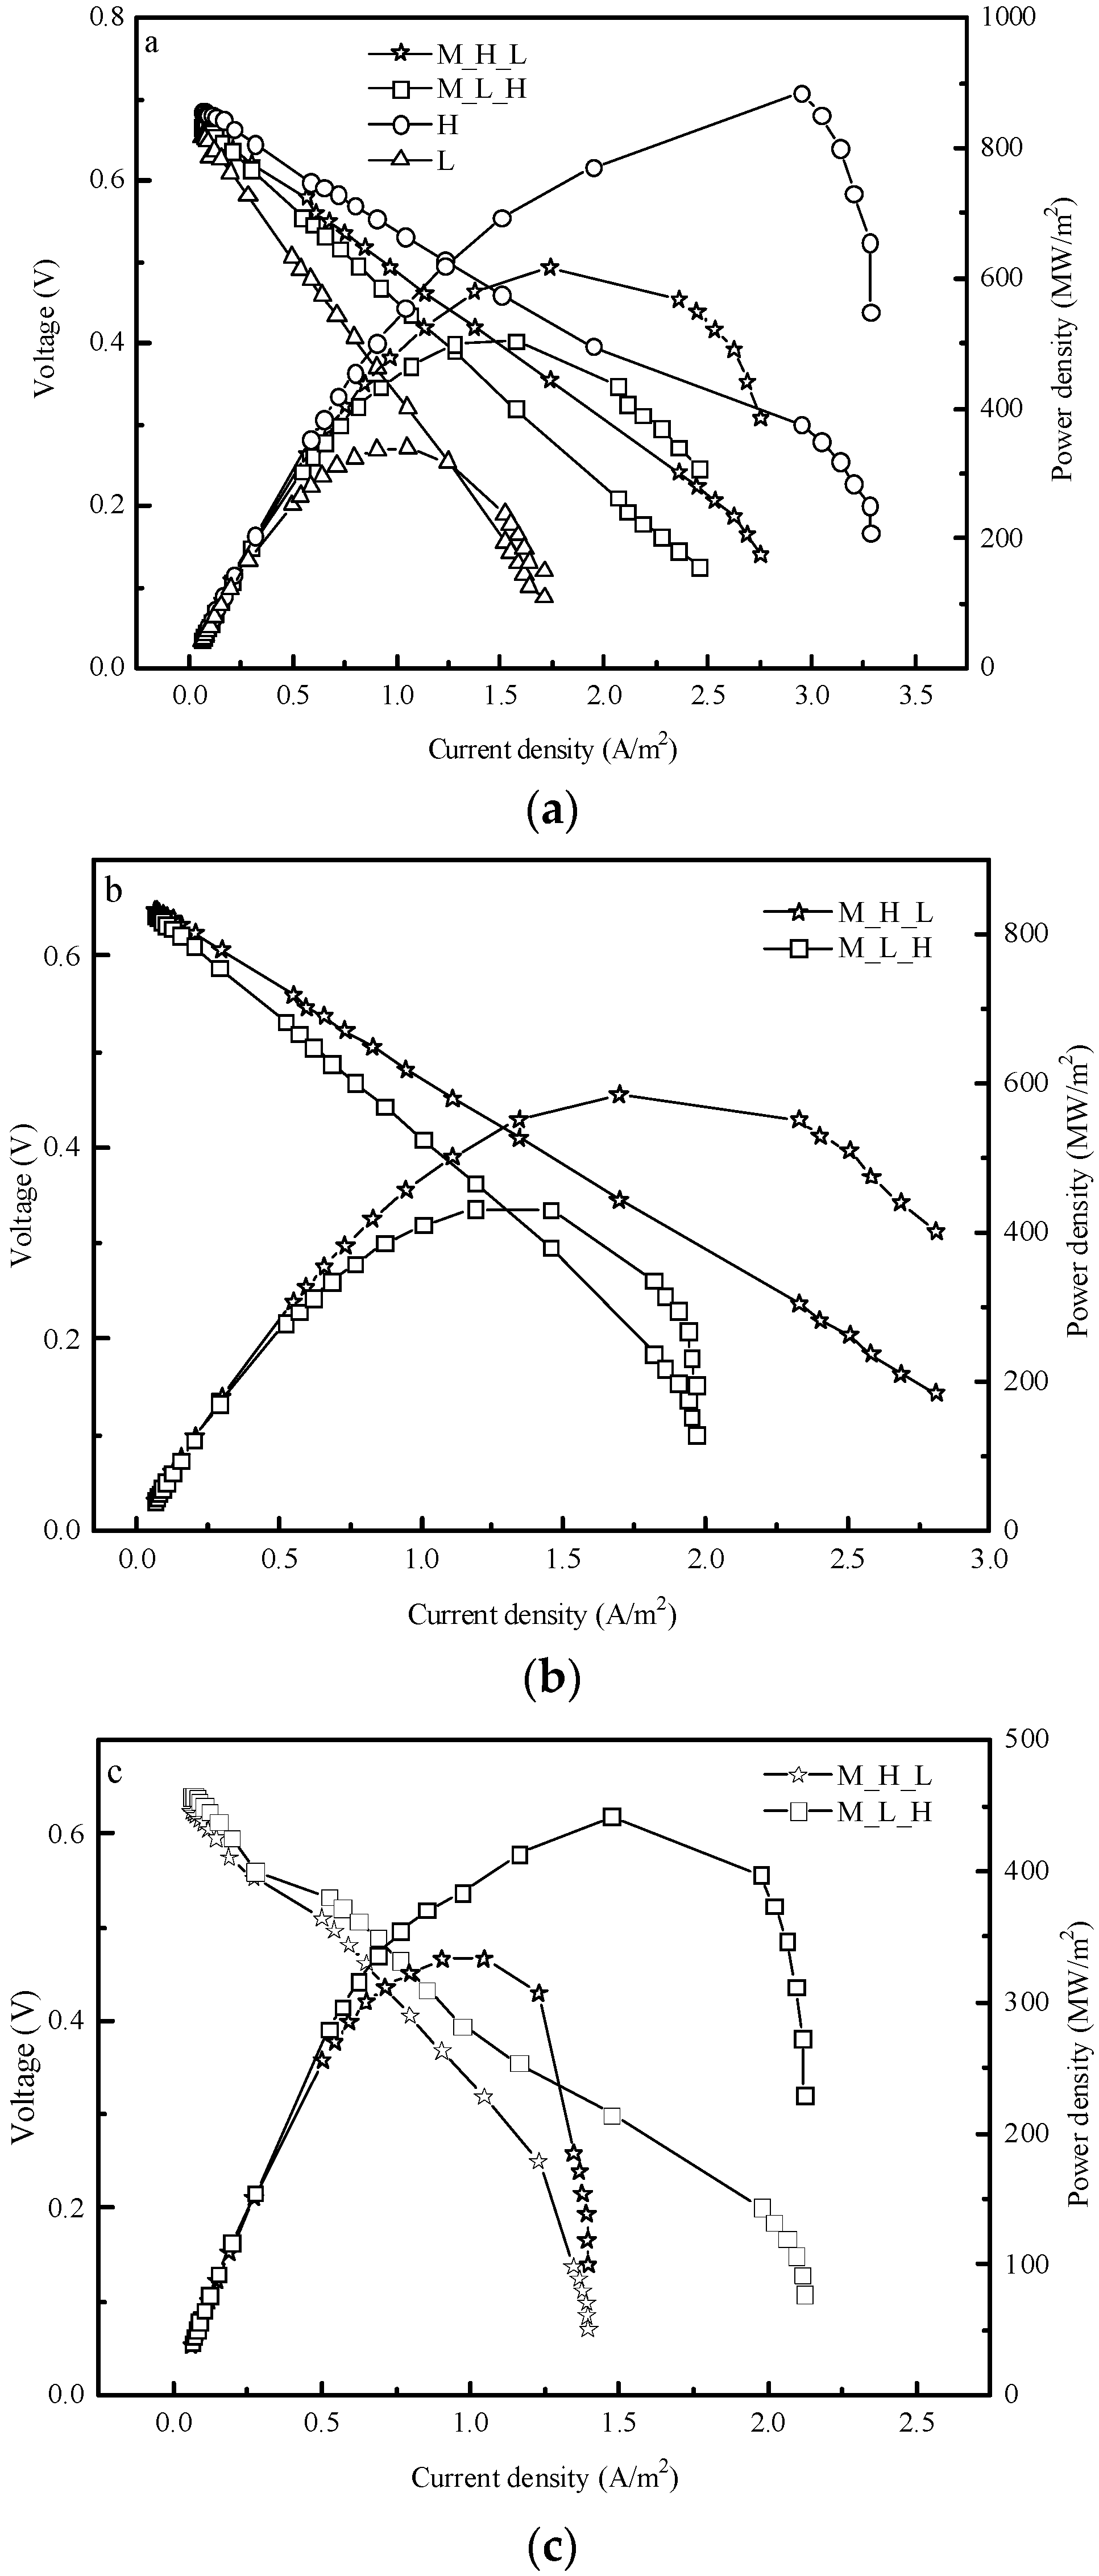
3.1.1. Power Generation Performance

All reactors were started by using the swine wastewater with the same concentration. The mapping voltage variation curve is shown in Figure 3. In Phase 1, the voltage amplitude decrements varied greatly among reactors. Under steady state, the maximum voltage was H (0.61 V), followed by M_H_L, M_L_H and L, indicating that the voltage in Phase 1 was mainly affected by the concentration of wastewater, and they were positively correlated. In Phase 2, the voltage difference in M_H_L and M_L_H was larger than it was in Phase 1, which means the concentration variation of anolyte directly influences voltage recovery. Although the stable voltage in M_H_L was higher than M_L_H, they both were lower than that in Phase 1. The reason may be that microbial community structure affected by concentration could compromise the MFC performance. In Phase 3, both the voltage change rate and stable voltage in M_H_L and M_L_H decreased relatively, which indicated that the concentration variation may choose to cultivate a more adaptable dominant bacteria group. The stable voltage of MFC based on 2500 mg/L and 800 mg/L was lower than that in H and L. No matter how the concentration changed, the maximum stable voltage of MFC was suppressed. The maximum voltage duration in M_H_L and M_L_H was longer than that in L and H, indicating that the change of concentration was beneficial for the stable operation of MFC.
In order to analyze the influence of variable concentration of swine wastewater on the MFC performance, the polarization curves and power density curves were obtained after each replacement of different concentrations of swine wastewater in MFC (Figure 4). The maximum power density of H (770.97 MW/m2), M_H_L (616.11 MW/m2), M_L_H (503.44 MW/m2), and L (317.19 MW/m2) in Phase 1 (Figure 4a) was measured and ranked in turns, as well as the output voltage of MFC. In Phase 2 (Figure 4b), the maximum power density in M_H_L (585.18 MW/m2) was significantly higher than that in M_L_H (430.76 MW/m2), but both were lower than the previous phase. In Phase 3 (Figure 4c), the maximum power density in M_H_L (585.18 MW/m2) was apparently higher than that in M_L_H (430.76 MW/m2), and both were lower than the previous phase. Therefore, the power density of M_H_L or M_L_H had a positive correlation with the concentration of swine wastewater, which was consistent with the previous [18].

3.1.2. Decontamination Performance

The decontamination performance of MFC was evaluated by the COD removal rate (Table 1). Combined with the analysis of MFC electricity production, it was found that the microbial community structure was varied with different concentrations, and the dominant bacteria in a short period (4 days) can adapt to high concentration successfully. The COD removal rate of the final effluent of MFC was positively correlated with COD of swine wastewater in Phase 3. The dominant bacteria capable of effectively resolving pollutants may not survive well in variable concentration of swine wastewater. The microorganisms which were selectively cultured by variable concentrations in the anode chamber could increase the degradation rate of 2500 mg/L and 800 mg/L swine wastewater by 12.5% and 208%, respectively, which is different from the previous report. This result indicates that the substrate used in this experiment was actual swine wastewater with a relatively low concentration range.

3.2. Microbial Community Diversity

In order to analyze the mechanism of variable concentration on cell performance from the perspective of the biological community, the original sequences of raw sludge, 2500 mg/L swine wastewater (Swine) and four experimental groups were optimized by the Illumina sequencing analysis, leading to a total of 226,646 optimized sequences. The sequences were selected by nucleotide identification, where the similarity with operational taxonomic units (OTU) was more than 97%. The species richness and diversity of the environmental communities were analyzed by calculating the indexes of Chao, Heip, Shannon and Coverage (Table 2). Based on the Chao index, the L group was found as the group with the highest species richness, followed by the H, M_H_L, Sludge, M_L_H and Swine groups. The Heip index shows that the species evenness, in descending order, was Swine, Sludge, M_H_L, L, H, and M_L_H. The Shannon index indicates that the order of community diversity was L, Sludge, Swine, H, M_H_L and M_L_H. The values of coverage in Table 2 are converging to one, while all rarefaction curves in Figure 5 tend to be flat, showing that the sequencing data used in the microbial diversity analysis are sufficient to reflect the species diversity in the samples. The results demonstrate that the microbial community diversity is directly affected by the concentration, and the species richness of the biofilm selected by the MFC is higher than that of Sludge and Swine, although the diversity index is slightly lower. Moreover, the diversity index tends to be higher at lower concentrations, and the community diversity of the MFC anode can be reduced by variable concentration, which may improve the performance of electricity generation and pollutant removal [19].

3.3. Microbial Community Structure

The comparison of microbial communities in different samples at phylum level is useful to analyze the function of some special species in MFC. As shown in Table 3, the bacteria are mainly distributed in Proteobacteria (60.45%), Bacteroidetes (18.72%), Firmicutes (4.75%), Chloroflexi (4.73%) and Spirochaetae (4.54%). Proteobacteria and Bacteroidetes are dominant groups in each sample. The relative abundance of Proteobacteria in Sludge or Swine is significantly less than that in the experimental groups, indicating that Proteobacteria are beneficial to improve the MFC performance. The relative abundance of Proteobacteria in the M_H_L or M_L_H groups are higher than that in H or L, showing that Proteobacteria could adapt well to a changing environment, especially one with a variable concentration, which is consistent with previous reports [20]. Compared with the experimental groups, Bacteroidetes occupy a greater proportion in Sludge and Swine, and the highest proportion in H, indicating that Bacteroidetes can effectively improve the electricity generation performance while maintaining the stable operation of MFC. Mei et al. constructed a single-chamber air cathode MFC based on waste water, and found that the Bacteroidetes of anode dominant bacteria could adapt to the changing external micro-ecological environment and improve the performance of MFC [21]. Firmicutes account for 44.56% in Swine, and belong to the dominant groups in M_H_L and M_L_H, which was reported in many dominant electricigens [22]. This finding indicates that Firmicutes in the experimental groups were mainly introduced from the wastewater, and the performance of Firmicutes adapted to variable concentration environment was better than its electricity generation performance. In the experimental groups, Chloroflexi were mainly introduced from the sludge but in a small proportion, indicating that they could not adapt to the variable concentration environment of swine wastewater, which complies with the previous conclusion. At the same time, the relative abundance of Spirochaetes in the experimental groups was lower than that in Sludge and Swine, indicating that the enrichment of Spirochaetes is beneficial to maintain the stable operation of MFC under the variable concentration environment conditions [23,24].
According to Table 3, the dominant bacteria in the MFC anode chamber were mostly obtained from the sludge, but the original dominant bacteria in the swine wastewater, such as Firmicutes, were more useful to maintain the stable operation of the MFC. Variable concentration environments would selectively culture the initial flora, whose species structure is significantly different from that under the constant concentration environment. In the initial flora, Firmicutes and Spirochaetae can enhance the electricity production of MFC and show better adaption to the variable concentration environment, while the adaptability of Actinobacteria, Chloroflexi, Proteobacteria and Synergistetes is relatively poorer.
As shown in Figure 6, the experimental results are different between the groups of Sludge and Swine at the genus level. The community composition of M_H_L is closer to that of M_L_H, while the compositions of H and L are closer to each other, indicating that environmental conditions directly affect the community structure of the anode surface. As shown in Figure 7, the relative abundance that exceeds 1% at the genus level of each sample are Zoogloea (5.79%), Plasticicumulans (4.59%), Bacteroidetes_unclassified (3.55%), Comamonadaceae unclassified (2.81%), Azoarcus (2.71%), Comamonas (2.48%) and Methylomonas (2.43%). Zoogloea was proven to be able to adapt to the temperature change effectively while producing electricity steadily [25]. Tamis et al. found that the accumulation of Plasticicumulans was beneficial to the degradation of acetic acid and other small molecular fatty acids. Moreover, he also proved that the dominant bacteria were not necessarily capable of producing electricity, but they could degrade organic compounds or provide excellent prerequisite substances for the exoelectrogens to assist electricity generation. Azoarcus [26] and Comamonas [27] were the reported bacteria that can degrade sewage effectively, while a small amount of Methylomonas can oxidize methane into carbon dioxide and assist in the production of electricity [28]. The production performance of other unclassified bacteria remains to be further proved.

4. Conclusions

The concentration of wastewater in the anode chamber directly affects the power generation and decontamination performance of the MFC. The concentration of COD is positively correlated with the output voltage and the removal rate of COD. The abrupt change of concentration suppresses the ability of MFC voltage recovery and decontamination. The dominant bacteria in the anode chamber have a stronger environmental adaptability under lower concentrations. Variable concentration environments can reduce microbial diversity to decrease the electricity production of MFC, but the selectively cultured bacteria with a better adaptation capability could enhance the stability and decontamination performance of the MFC. The dominant bacteria in the experimental groups were mainly distributed in Proteobacteria, Bacteroidetes, Firmicutes, Chloroflexi and Spirochaetae, while Zoogloea and Plasticicumulans might be the most important bacteria to enhance the performance of the MFC.

5. Patents

The authors of this paper have carried out research on the microbial fuel cell for many years. Four China invention patents related to this paper have been granted; the patent numbers are CN106784952B, CN106876760B, CN106848361B and CN108075162B. In addition, four China invention patents have been published; the patent numbers are CN110713899A, CN110669644A, CN108101211A and CN108996699A.

Author Contributions

Conceptualization, H.N.; Data curation, X.W. and J.Z.; Formal analysis, H.N., K.W. and L.Z.; Funding acquisition, S.L.; Investigation, S.L.; Methodology, K.W. and S.L.; Resources, H.N.; Software, K.W. and L.Z.; Supervision, H.N.; Validation, X.W.; Visualization, J.Z.; Writing—original draft, K.W.; Writing—review & editing, H.N. All authors have read and agreed to the published version of the manuscript.

Funding

This research was funded by the Priority Academic Program Development of Jiangsu Higher Education Institutions, grant number PAPD; Nantong Applied Research Project, grant number JC2018115 and JC2019129; Ministry of education’s Cooperative Education Project, grant number 201901189019.

Conflicts of Interest

The authors declare no conflict of interest.

References

  1. Zhang, Y.; Zhao, Y.Y.; Zhou, M.H. A photosynthetic algal microbial fuel cell for treating swine wastewater. Environ. Sci. Pollut. Res. 2019, 26, 6182–6190. [Google Scholar] [CrossRef] [PubMed]
  2. Cheng, D.L.; Ngo, H.H.; Guo, W.S. Problematic effects of antibiotics on anaerobic treatment processes in swine wastewater. Bioresour. Technol. 2018, 263, 642–653. [Google Scholar] [CrossRef] [PubMed]
  3. Cheng, D.L.; Ngo, H.H.; Guo, W.S. Microalgae biomass from swine wastewater and its conversion to bioenergy. Bioresour. Technol. 2019, 275, 109–122. [Google Scholar] [CrossRef] [PubMed]
  4. Ma, D.; Jiang, Z.H.; Lay, C.H. Electricity generation from swine wastewater in microbial fuel cell: Hydraulic reaction time effect. Int. J. Hydrog. Energy 2016, 41, 21820–21826. [Google Scholar] [CrossRef]
  5. Li, X.H.; Zhu, N.W.; Li, C. Electricity generation and treatment of swine wastewater. Chin. J. Environ. Eng. 2012, 6, 2189–2194. [Google Scholar]
  6. Doug, A.; Costas, T.; Hamilton, C.Y. Assessment of the Effects of Flow Rate and Ionic Strength on the Performance of an Air-Cathode Microbial Fuel Cell Using Electrochemical Impedance Spectroscopy. Energies 2010, 3, 672–675. [Google Scholar]
  7. Kim, T.; Yeo, J.; Yang, Y. Boosting voltage without electrochemical degradation using energy-harvesting circuits and power management system-coupled multiple microbial fuel cells. J. Power Sources 2019, 410, 171–178. [Google Scholar] [CrossRef]
  8. Li, H.; Tian, Y.; Zuo, W. Electricity generation from food wastes and characteristics of organic matters in microbial fuel cell. Bioresour. Technol. 2016, 205, 104–110. [Google Scholar] [CrossRef]
  9. Escalante-Estrada, V.E.; Garzón-Zúñiga, M.A.; Valle-Cervantes, S. Swine Wastewater Treatment for Small Farms by a New Anaerobic-Aerobic Biofiltration Technology. Water Air Soil Pollut. 2019, 230, 145. [Google Scholar] [CrossRef]
  10. Goto, Y.; Yoshida, N. Scaling up Microbial Fuel Cells for Treating Swine Wastewater. Water 2019, 11, 1803. [Google Scholar] [CrossRef] [Green Version]
  11. Gao, C.Y.; Wu, W.M.; Zhao, Y.H. Response of microbial fuel cell anodic microbial communities to substrate switch of lactate-propionate-lactate. Acta Microbiol. Sin. 2015, 55, 1495–1504. [Google Scholar]
  12. Kondaveeti, S.; Patel, S.K.S.; Pagolu, R. Conversion of simulated biogas to electricity: Sequential operation of methanotrophic reactor effluents in microbial fuel cell. Energy 2019, 189, 116309. [Google Scholar] [CrossRef]
  13. Ma, J.; Ni, H.J.; Su, D.Y. Bioelectricity generation from pig farm wastewater in microbial fuel cell using carbon brush as electrode. Int. J. Hydrog. Energy 2016, 41, 16191–16195. [Google Scholar] [CrossRef]
  14. Nandy, A.; Sharma, M.; Venkatesan, S. Comparative Evaluation of Coated and Non-Coated Carbon Electrodes in a Microbial Fuel Cell for Treatment of Municipal Sludge. Energies 2019, 12, 1034. [Google Scholar] [CrossRef] [Green Version]
  15. Lan, L.H.; Li, J.; Feng, Q. Enhanced current production of the anode modified by microalgae derived nitrogen-rich biocarbon for microbial fuel cells. Int. J. Hydrog. Energy 2019, 45, 3833–3839. [Google Scholar] [CrossRef]
  16. Zhu, Y.; Zhu, Y.Y.; Wang, X.X. Research Progress of Active Components of the Eletrocatalysts for Direct Enthanol Fuel Cell. J. Nantong Univ. 2017, 16, 58–63. [Google Scholar]
  17. Oberauner, L.; Zachow, C.; Lackner, S. The ignored diversity: Complex bacterial communities in intensive care units revealed by 16S pyrosequencing. Sci. Rep. 2013, 3, 1413. [Google Scholar] [CrossRef]
  18. Ma, X.; Feng, C.; Zhou, W. Municipal sludge-derived carbon anode with nitrogen- and oxygen-containing functional groups for high-performance microbial fuel cells. J. Power Sources 2016, 307, 105–111. [Google Scholar] [CrossRef]
  19. Schilirò, T.; Tommasi, T.; Armato, C. The study of electrochemically active planktonic microbes in microbial fuel cells in relation to different carbon-based anode materials. Energy 2016, 106, 277–284. [Google Scholar] [CrossRef]
  20. Mei, X.; Xing, D.; Yang, Y. Adaptation of microbial community of the anode biofilm in microbial fuel cells to temperature. Bioelectrochemistry 2017, 117, 29–33. [Google Scholar] [CrossRef]
  21. Chen, J.; Zhang, L.; Hu, Y. Bacterial community shift and incurred performance in response to in situ microbial self-assembly graphene and polarity reversion in microbial fuel cell. Bioresour. Technol. 2017, 241, 220–227. [Google Scholar] [CrossRef] [PubMed]
  22. Wang, J.; Song, X.; Wang, Y. Bioenergy generation and rhizodegradation as affected by microbial community distribution in a coupled constructed wetland-microbial fuel cell system associated with three macrophytes. Sci. Total Environ. 2017, 607, 53–62. [Google Scholar] [CrossRef] [PubMed]
  23. Tamis, J.; Luzkov, K.; Jiang, Y. Enrichment of Plasticicumulans acidivorans at pilot-scale for PHA production on industrial wastewater. J. Biotechnol. 2014, 192, 161–169. [Google Scholar] [CrossRef] [PubMed]
  24. Ye, Y.Y.; Ngo, H.H.; Guo, W.S. Microbial fuel cell for nutrient recovery and electricity generation from municipal wastewater under different ammonium concentrations. Bioresour. Technol. 2019, 292, 121992. [Google Scholar] [CrossRef] [PubMed]
  25. Sun, Y.; Wei, J.; Peng, L. Microbial community analysis in biocathode microbial fuel cells packed with different materials. AMB Express 2012, 2, 21. [Google Scholar] [CrossRef] [Green Version]
  26. Zhu, J.P.; Wang, J.; Zhang, T.P. Phylogenetic Diversity of Bacterial and Archaeal Communities in Anode biofilm of Sediment Microbial Fuel Cells. Acta Sci. Circumstantiae 2016, 36, 4017–4024. [Google Scholar]
  27. Miran, W.; Jang, J.; Nawaz, M. Mixed sulfate-reducing bacteria-enriched microbial fuel cells for the treatment of wastewater containing copper. Chemosphere 2017, 189, 134. [Google Scholar] [CrossRef]
  28. Pandey, P.; Shinde, V.N.; Deopurkar, R.L. Recent advances in the use of different substrates in microbial fuel cells toward wastewater treatment and simultaneous energy recovery. J. Appl. Energy 2016, 168, 706–723. [Google Scholar] [CrossRef]
Figure 1. The diagram of the microbial fuel cell (MFC): (a) single microbial fuel cell; (b) microbial fuel cell stacks.
Energies 13 02231 g001
Figure 2. Technology roadmap.
Energies 13 02231 g002
Figure 3. Stable voltage profiles of MFCs along with substrate concentration variation.
Energies 13 02231 g003
Figure 4. Polarization curves and power density curves of MFC at different phases:(a) polarization curves and power density curves of M_H_L, M_L_H, H and L in Phase 1; (b) polarization curves and power density curves of M_H_L and M_L_H in Phase 2; (c) polarization curves and power density curves of M_H_L and M_L_H in Phase 3.
Energies 13 02231 g004
Figure 5. Rarefaction curves of operational taxonomic unit (OTU) richness of the anode biofilms in M_H_L, M_L_H, H, L, Sludge and Swine.
Energies 13 02231 g005
Figure 6. Hierarchical clustering tree on genus level in M_H_L, M_L_H, H, L, Sludge and Swine.
Energies 13 02231 g006
Figure 7. Relative ratio of the dominant microbial at genus level in M_H_L, M_L_H, H, L, Sludge and Swine.
Energies 13 02231 g007
Table 1. Chemical oxygen demand (COD) removal rate of swine wastewater.
GroupInfluent COD (mg/L)COD Removal Rate in Phase 1 (%)COD Removal Rate in Phase 2 (%)COD Removal Rate in Phase 3 (%)COD Removal Rate of Effluent (%)
M_H_L160060.5645.21442.38
M_L_H160066.5627.2563.0872.4
H2500---64.36
L800---13.75
Table 2. Alpha diversity analysis.
SampleSeqsOTUChaoHeipShannonCoverage
M_H_L35,458594695 (658,754)0.21244.84 (4.82,4.86)0.9942
M_L_H33,177569627 (604,667)0.19154.69 (4.66,4.71)0.9952
H35,632664783 (739,853)0.19204.85 (4.83,4.87)0.9955
L35,340692798 (758,862)0.21184.99 (4.97,5.02)0.9951
Sludge42,403599674 (641,732)0.23314.94 (4.92,4.96)0.9971
Swine44,636464488 (475,514)0.28294.87 (4.85,4.88)0.9981
Table 3. Comparison of relative abundance of anode microbial community in M_H_L, M_L_H, H, L, Sludge and Swine at phylum level.
PhylumAbundance (Above 0.1%)SEMp-Value
SludgeSwineM_H_LM_L_HHL
Acidobacteria6.69%0.02%0.74%0.40%1.02%2.78%1.03%0.07
Actinobacteria2.32%0.83%1.92%2.31%2.17%2.23%0.23% 0.02
Bacteroidetes17.35%32.25%15.96%15.89%25.63%15.59%2.83%0.17
Chloroflexi23.62%0.00%2.43%1.50%4.54%9.65%3.60% 0.24
Cyanobacteria1.31%0.01%0.17%0.92%0.23%0.67%0.21%0.01
Firmicutes0.97%44.56%7.81%4.44%3.43%3.83%6.80%0.01
Gemmatimonadetes1.81%0.00%0.11%0.01%0.07%0.13%0.29% 0.02
Ignavibacteriae1.43%0.00%0.13%0.03%0.15%0.33%0.22%0.01
Nitrospirae1.26%0.00%0.02%0.01%0.16%0.31%0.19%0.01
Parcubacteria4.82%0.02%0.00%0.01%0.00%0.00%0.80%0.05
Proteobacteria33.17%19.91%66.07%66.55%53.14%58.81%7.76%0.33
Saccharibacteria1.36%0.04%0.34%0.66%0.15%0.34%0.19%0.01
Spirochaetae0.33%0.73%3.54%5.86%6.11%2.53%1.04%<0.01
Synergistetes0.05%0.06%0.29%0.64%1.35%0.55%0.20%<0.01
Verrucomicrobia0.05%0.14%0.03%0.42%0.51%1.31%0.20%<0.01
others3.46%1.43%0.44%0.35%1.34%0.94%0.46%0.03

