Study of Heat Transfer and the Hydrodynamic Performance of Gas–Solid Heat Transfer in a Vertical Sinter Cooling Bed Using the CFD-Taguchi-Grey Relational Analysis Method

Abstract
1. Introduction
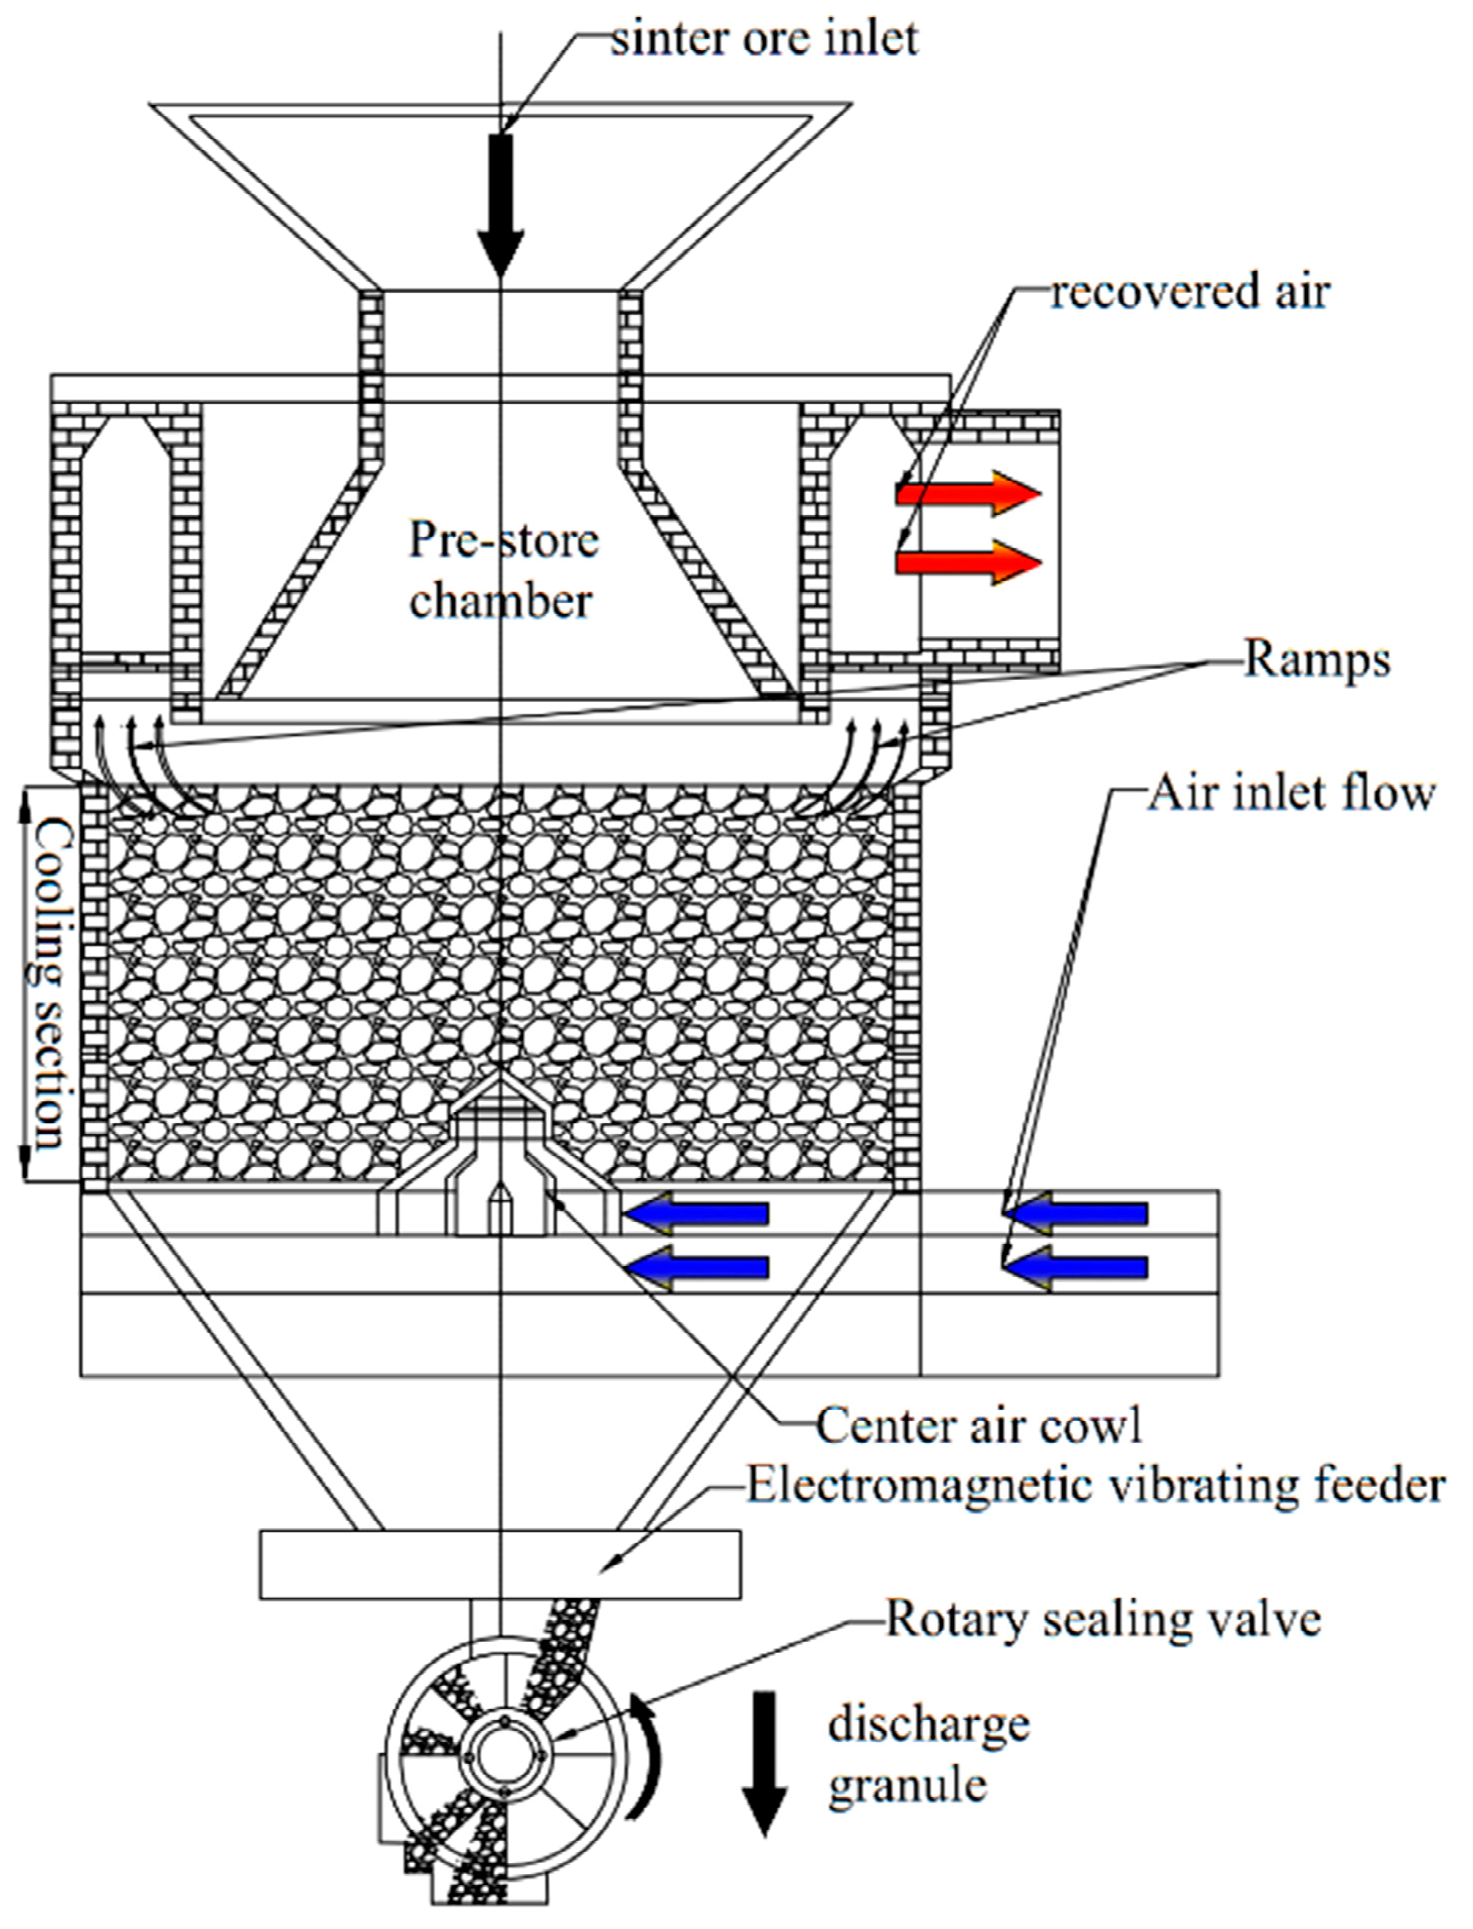
1.1. Vertical Sinter Cooling Bed (VSCB)
1.2. Studies of the Heat Transfer Performance of the VSCB
1.3. Studies of the Statistical Analysis Method
2. Computational Method and Boundary Condition
2.1. Mathematical Description within the CFD
- The sinter granules maintain the mass flow pattern in the cooling section, which is the precondition to ensure steady operation.
- The sinter granules are deemed a homogenous and isotropic bulk solid material.
- The heat dissipates at the outer wall of the VSCB is insulated by the insulation material.
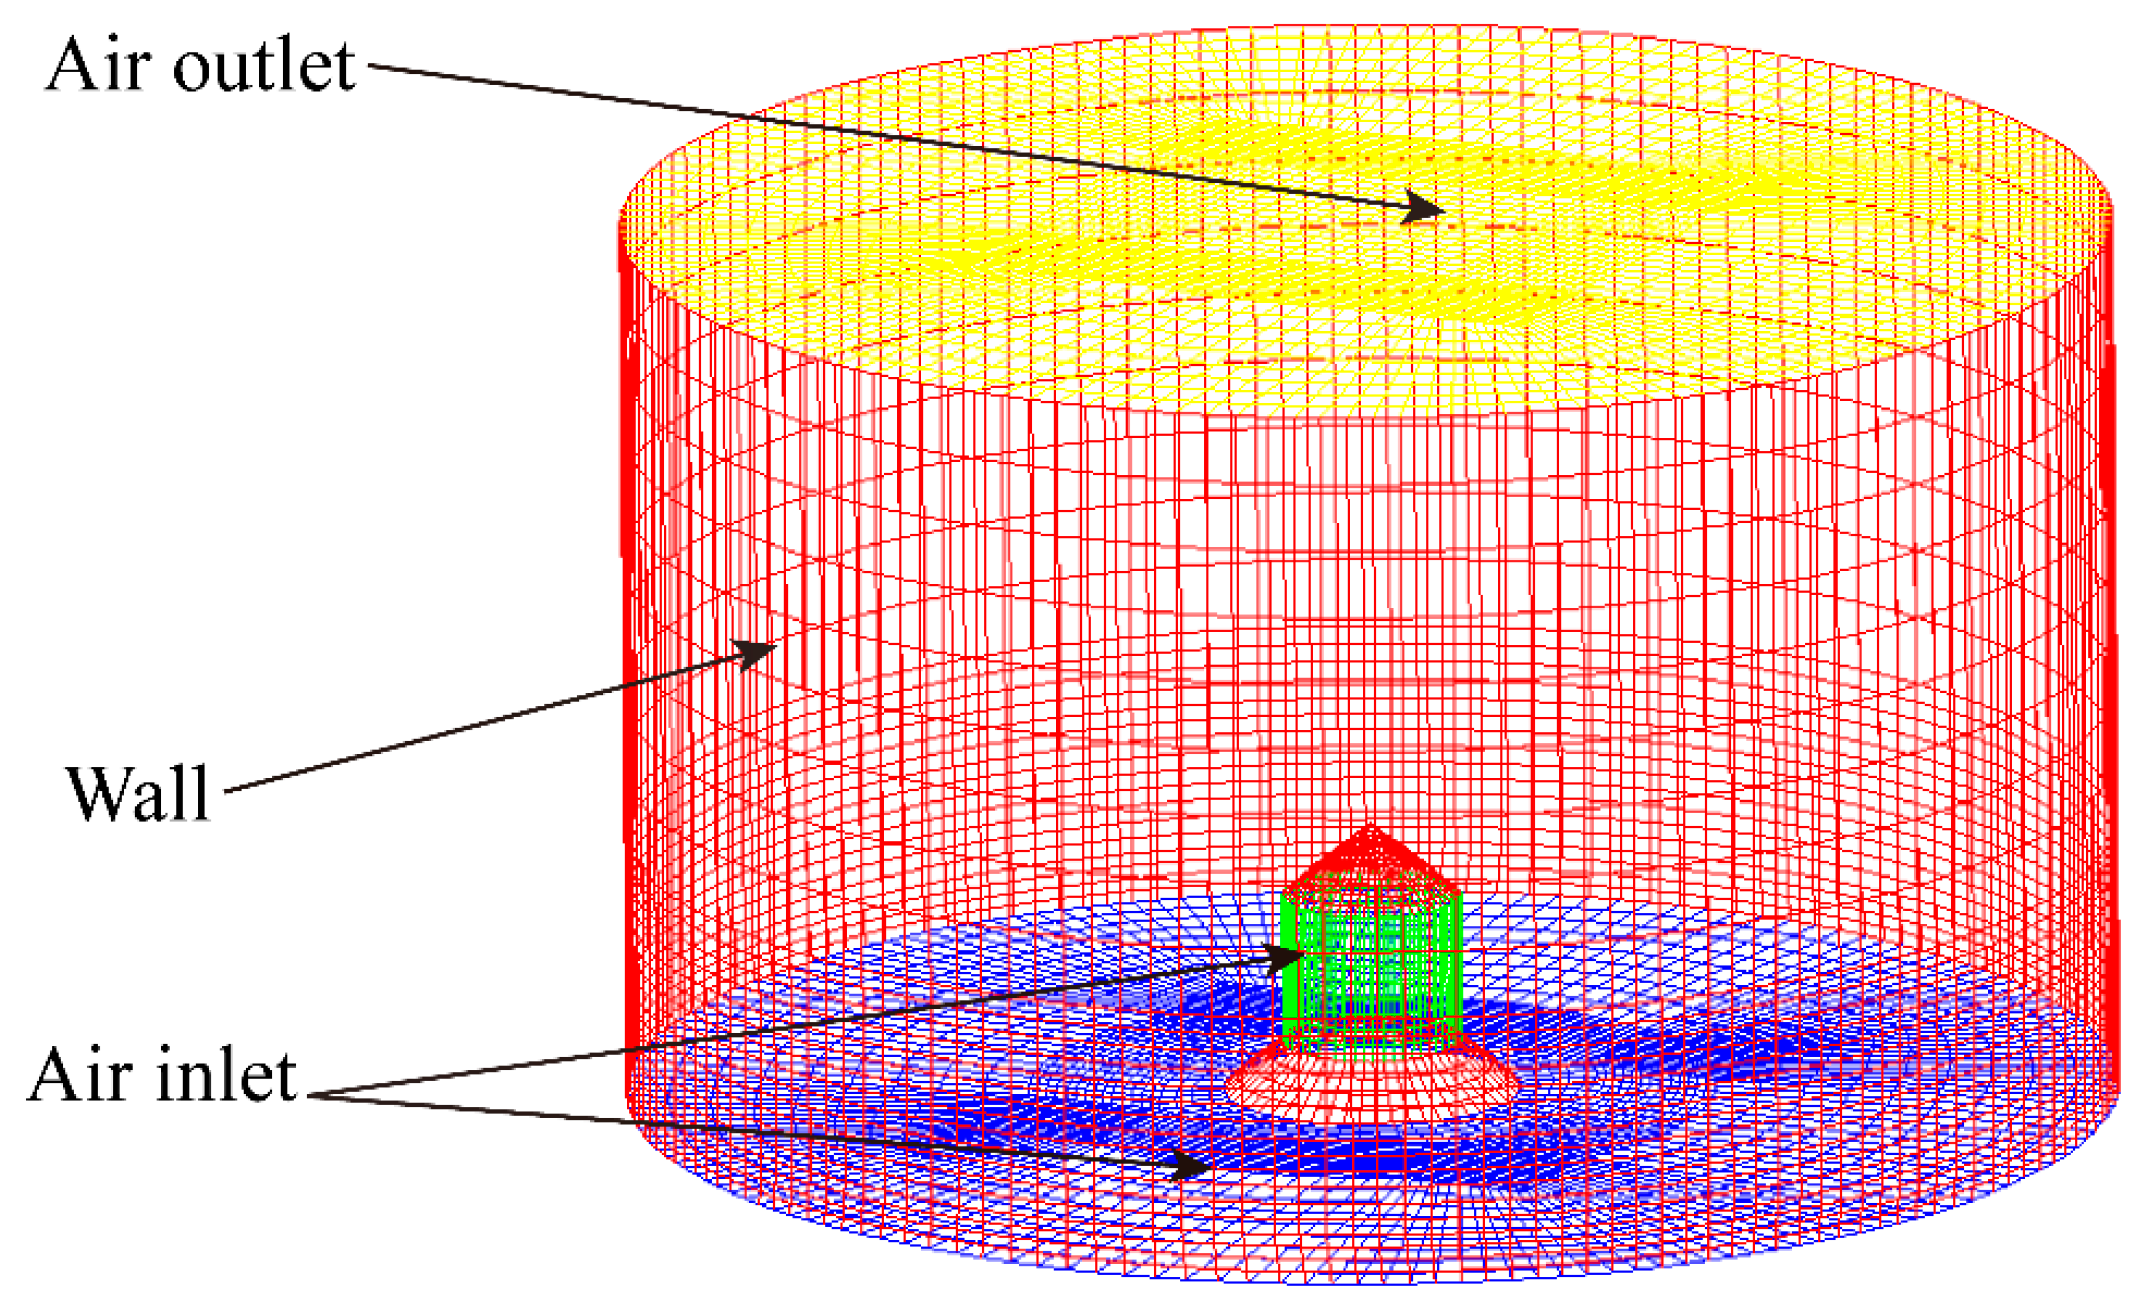
2.2. Determination of the Grid Generation and Boundary Condition
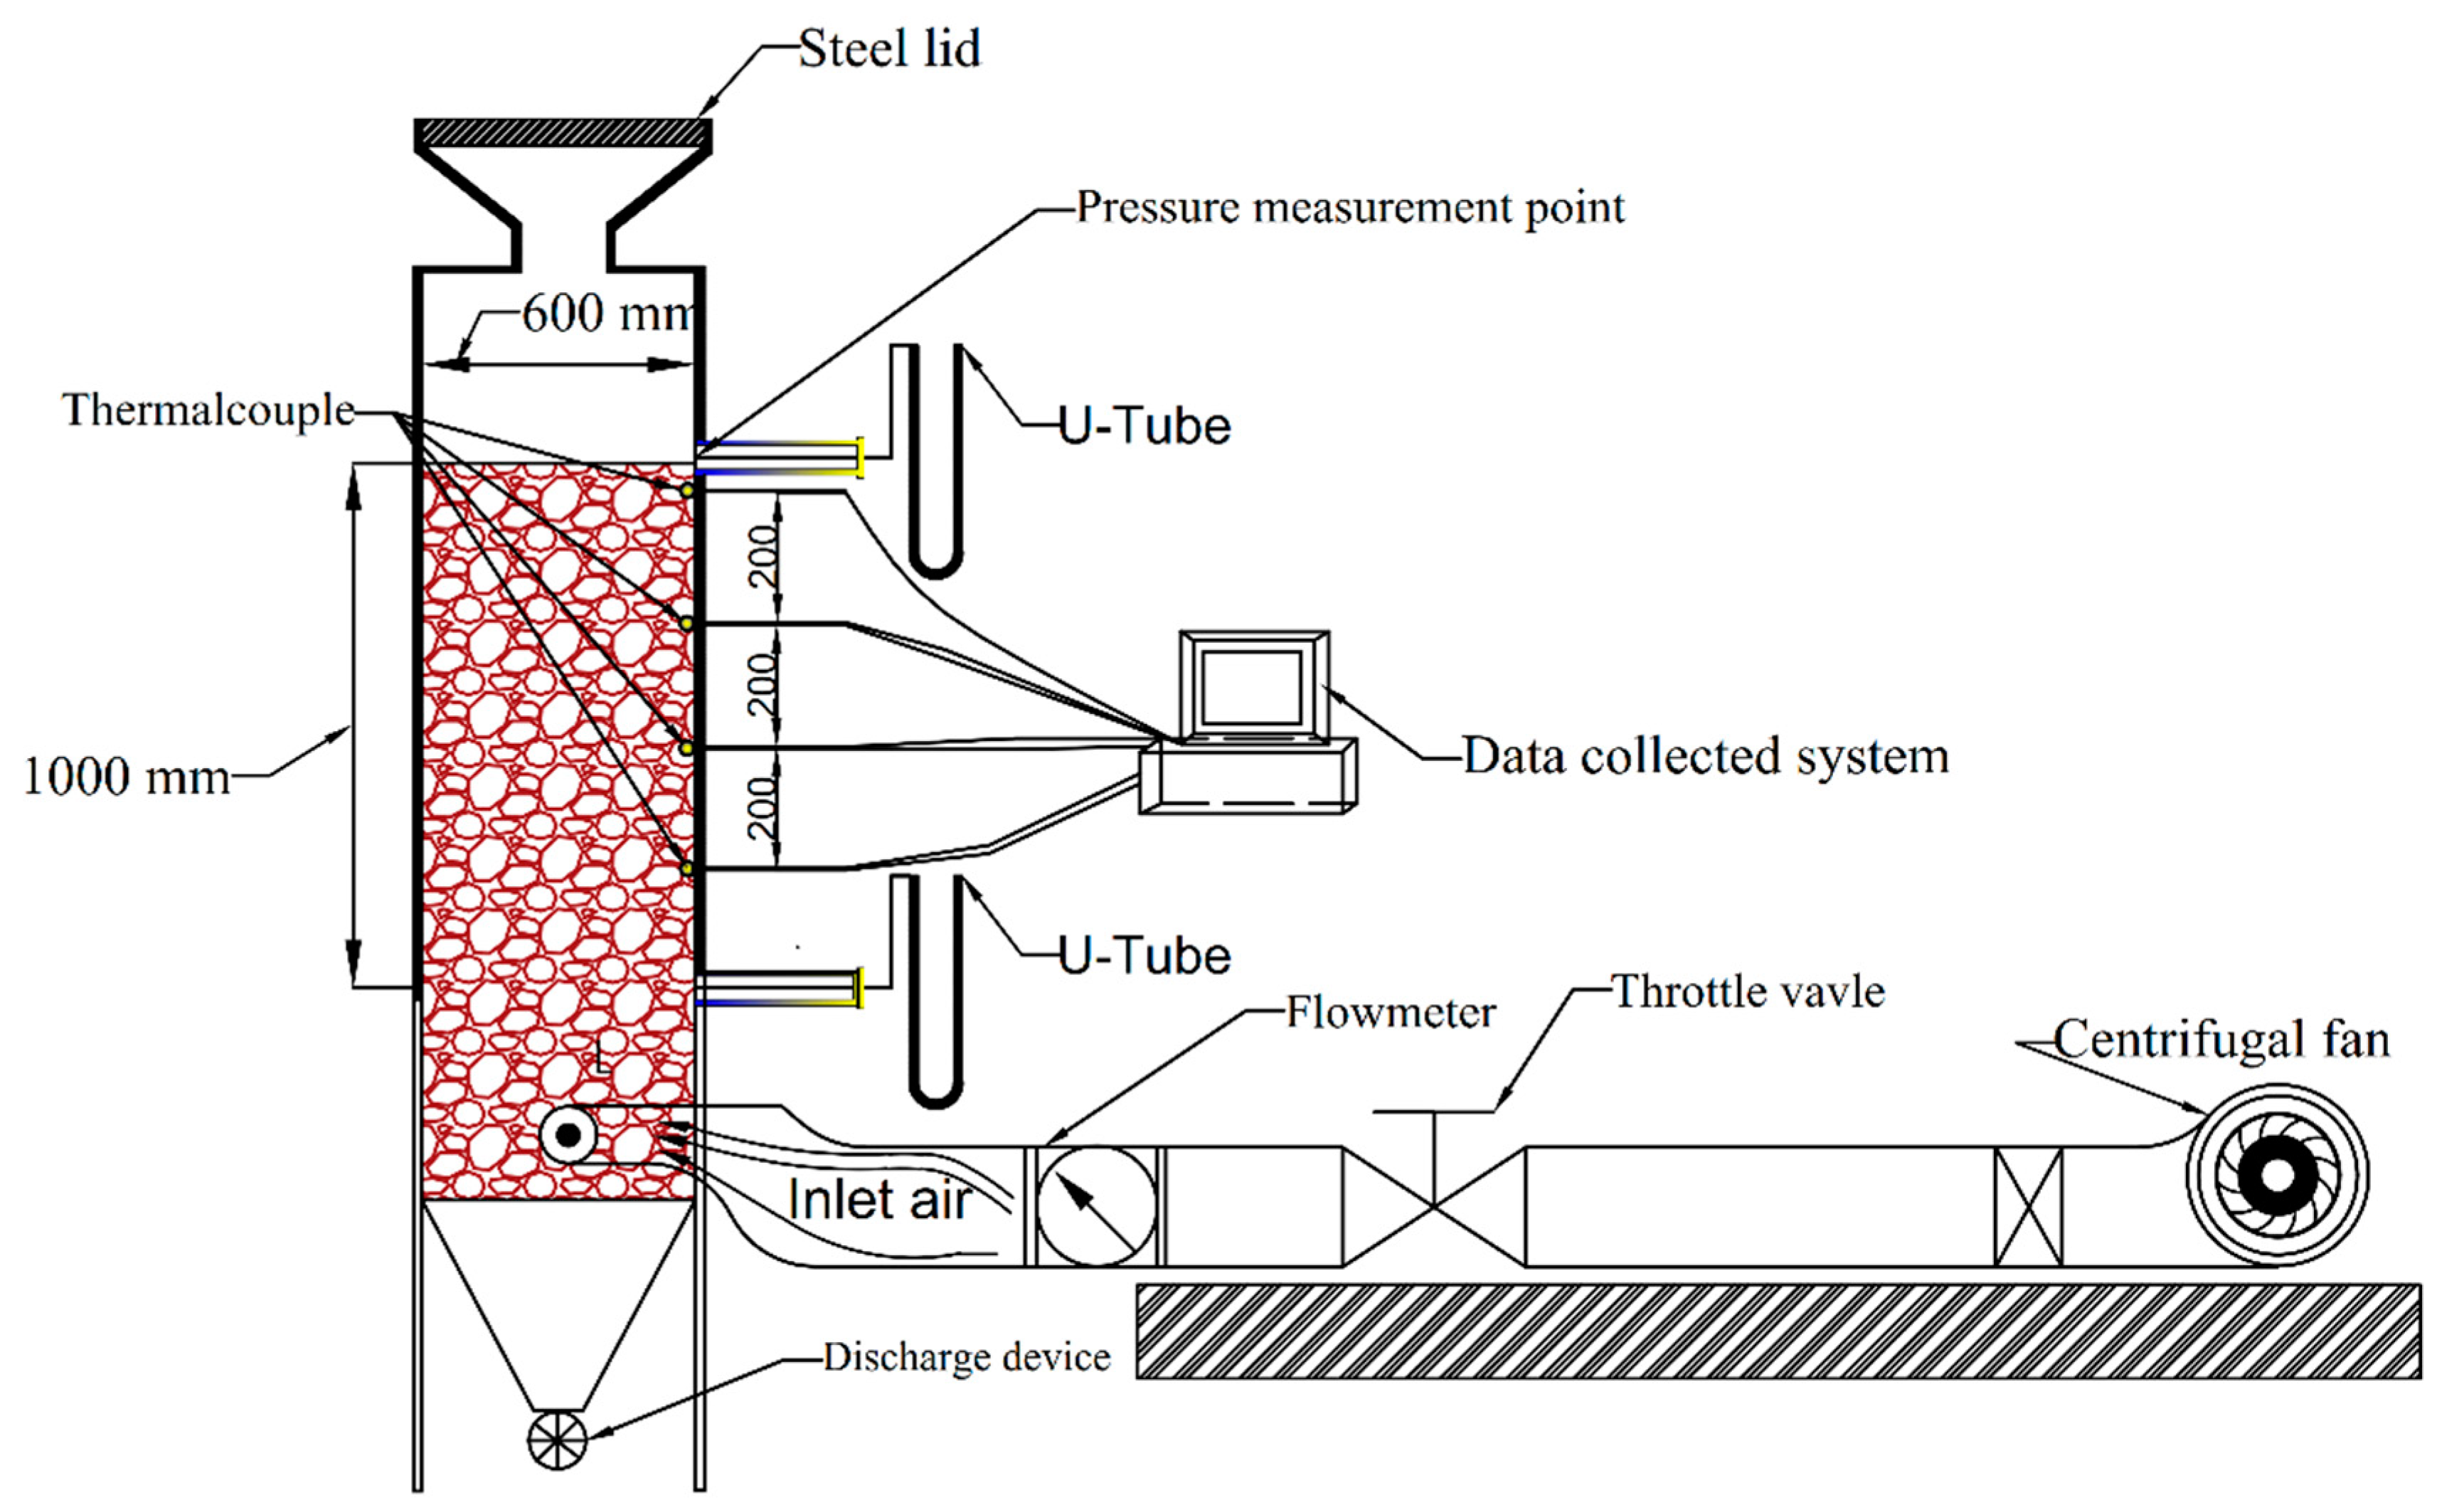
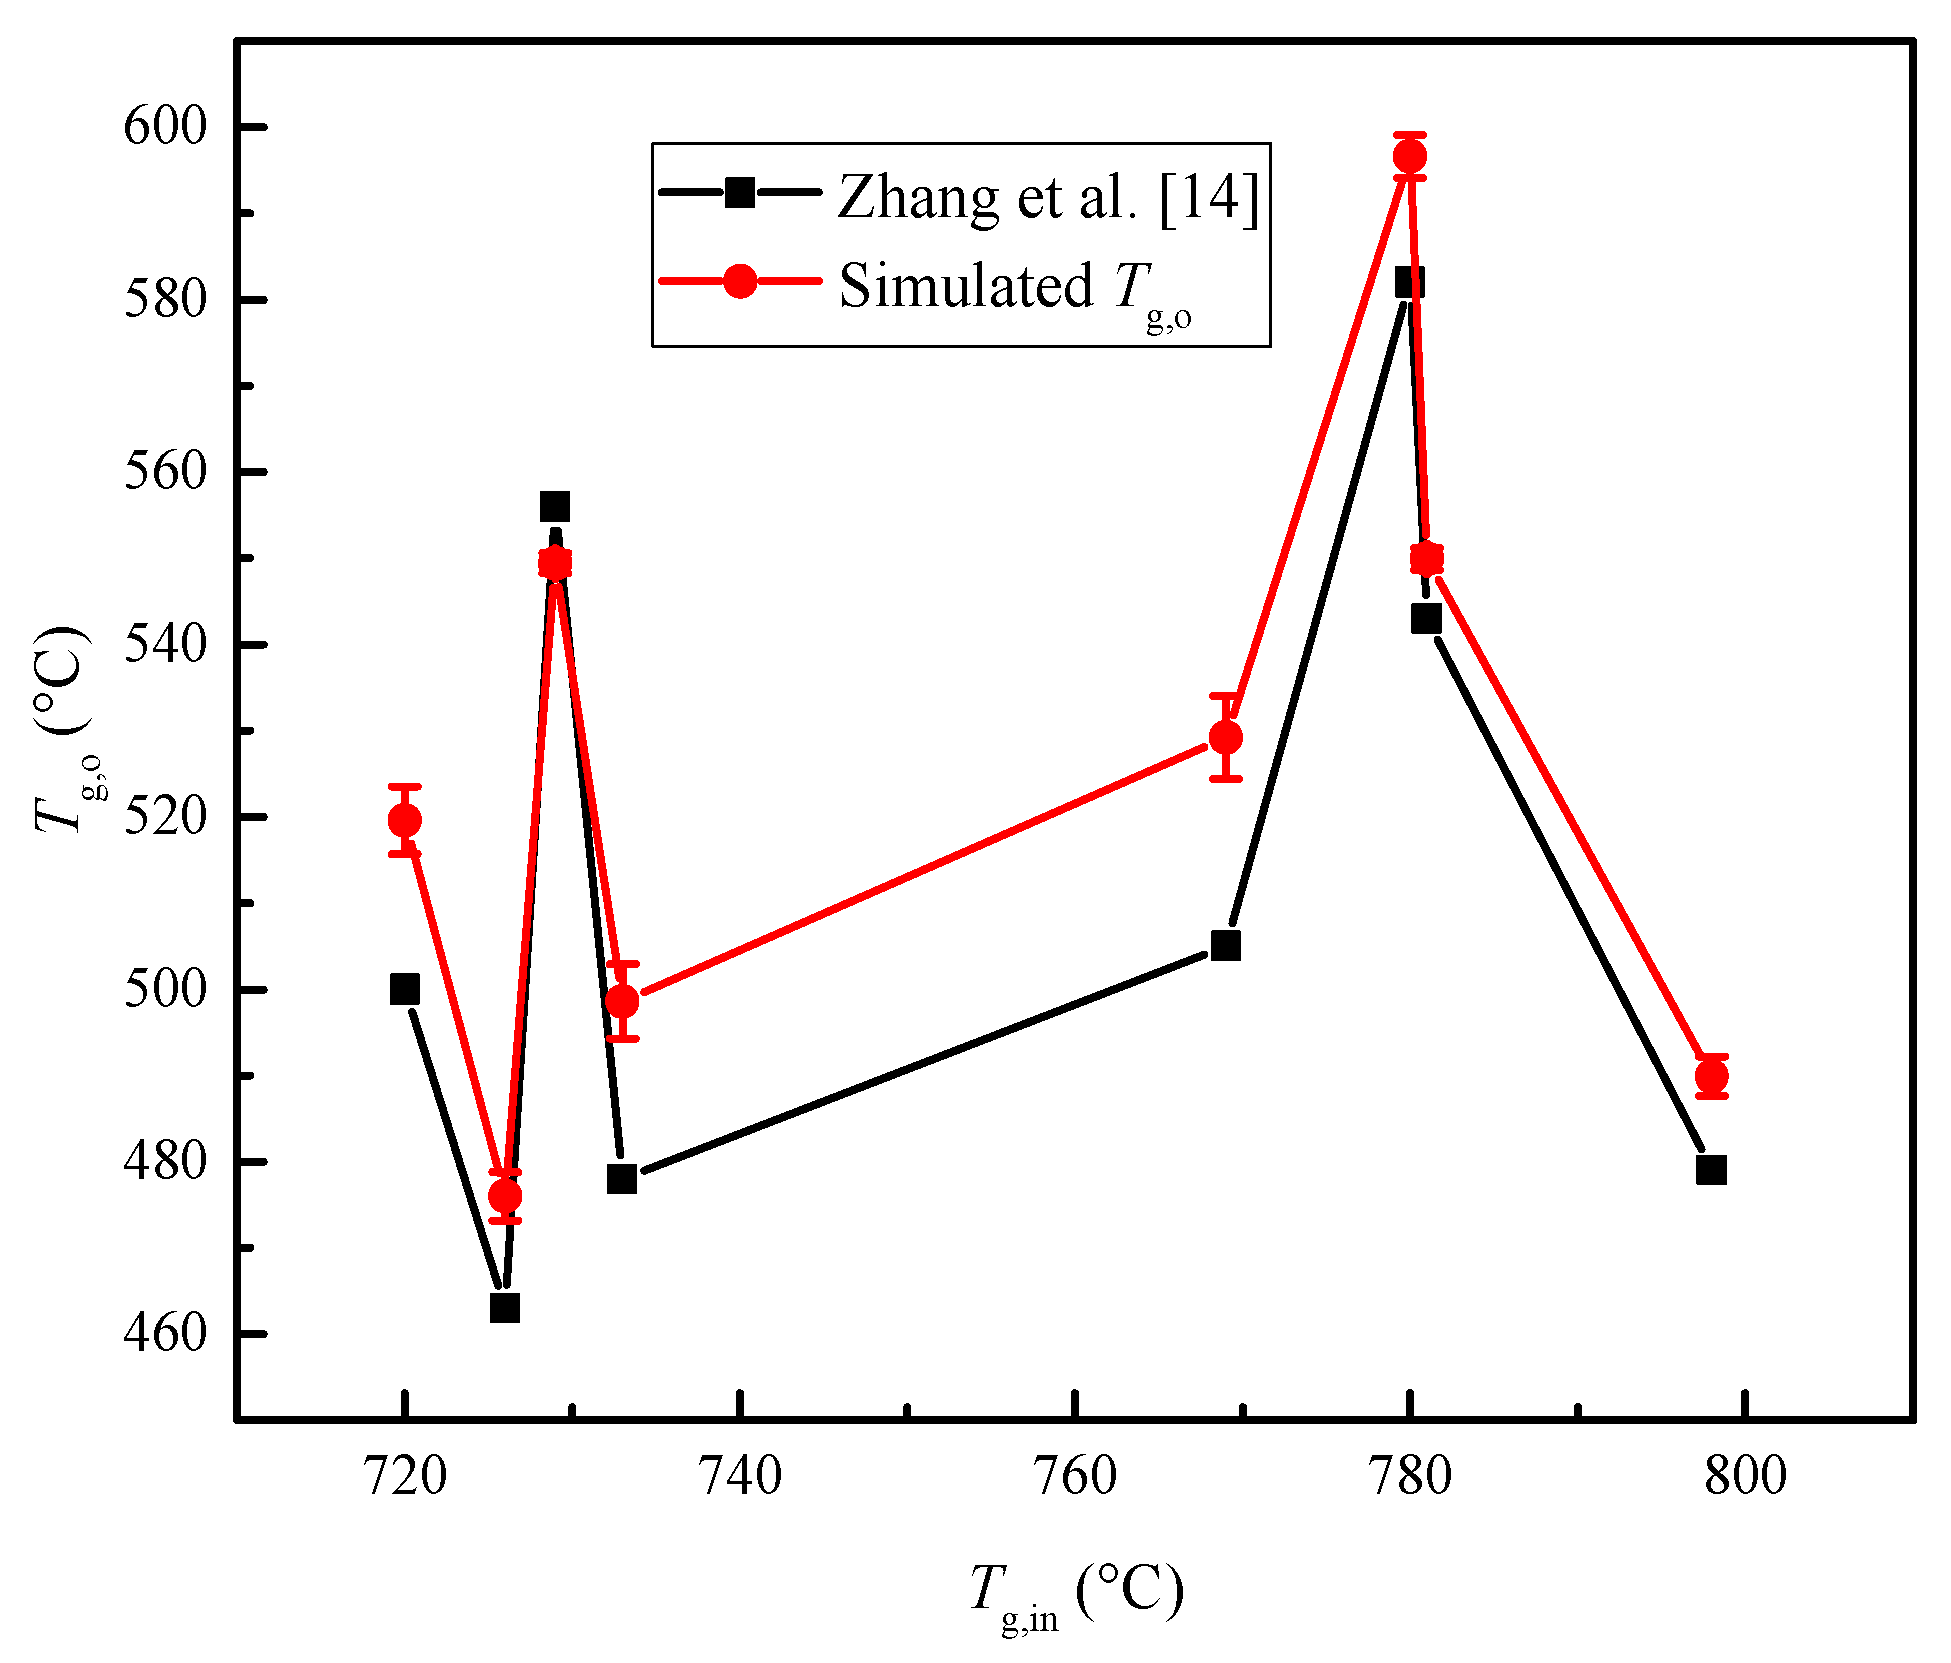
2.3. Grid Independence Test and Model Validation
3. Results and Discussion
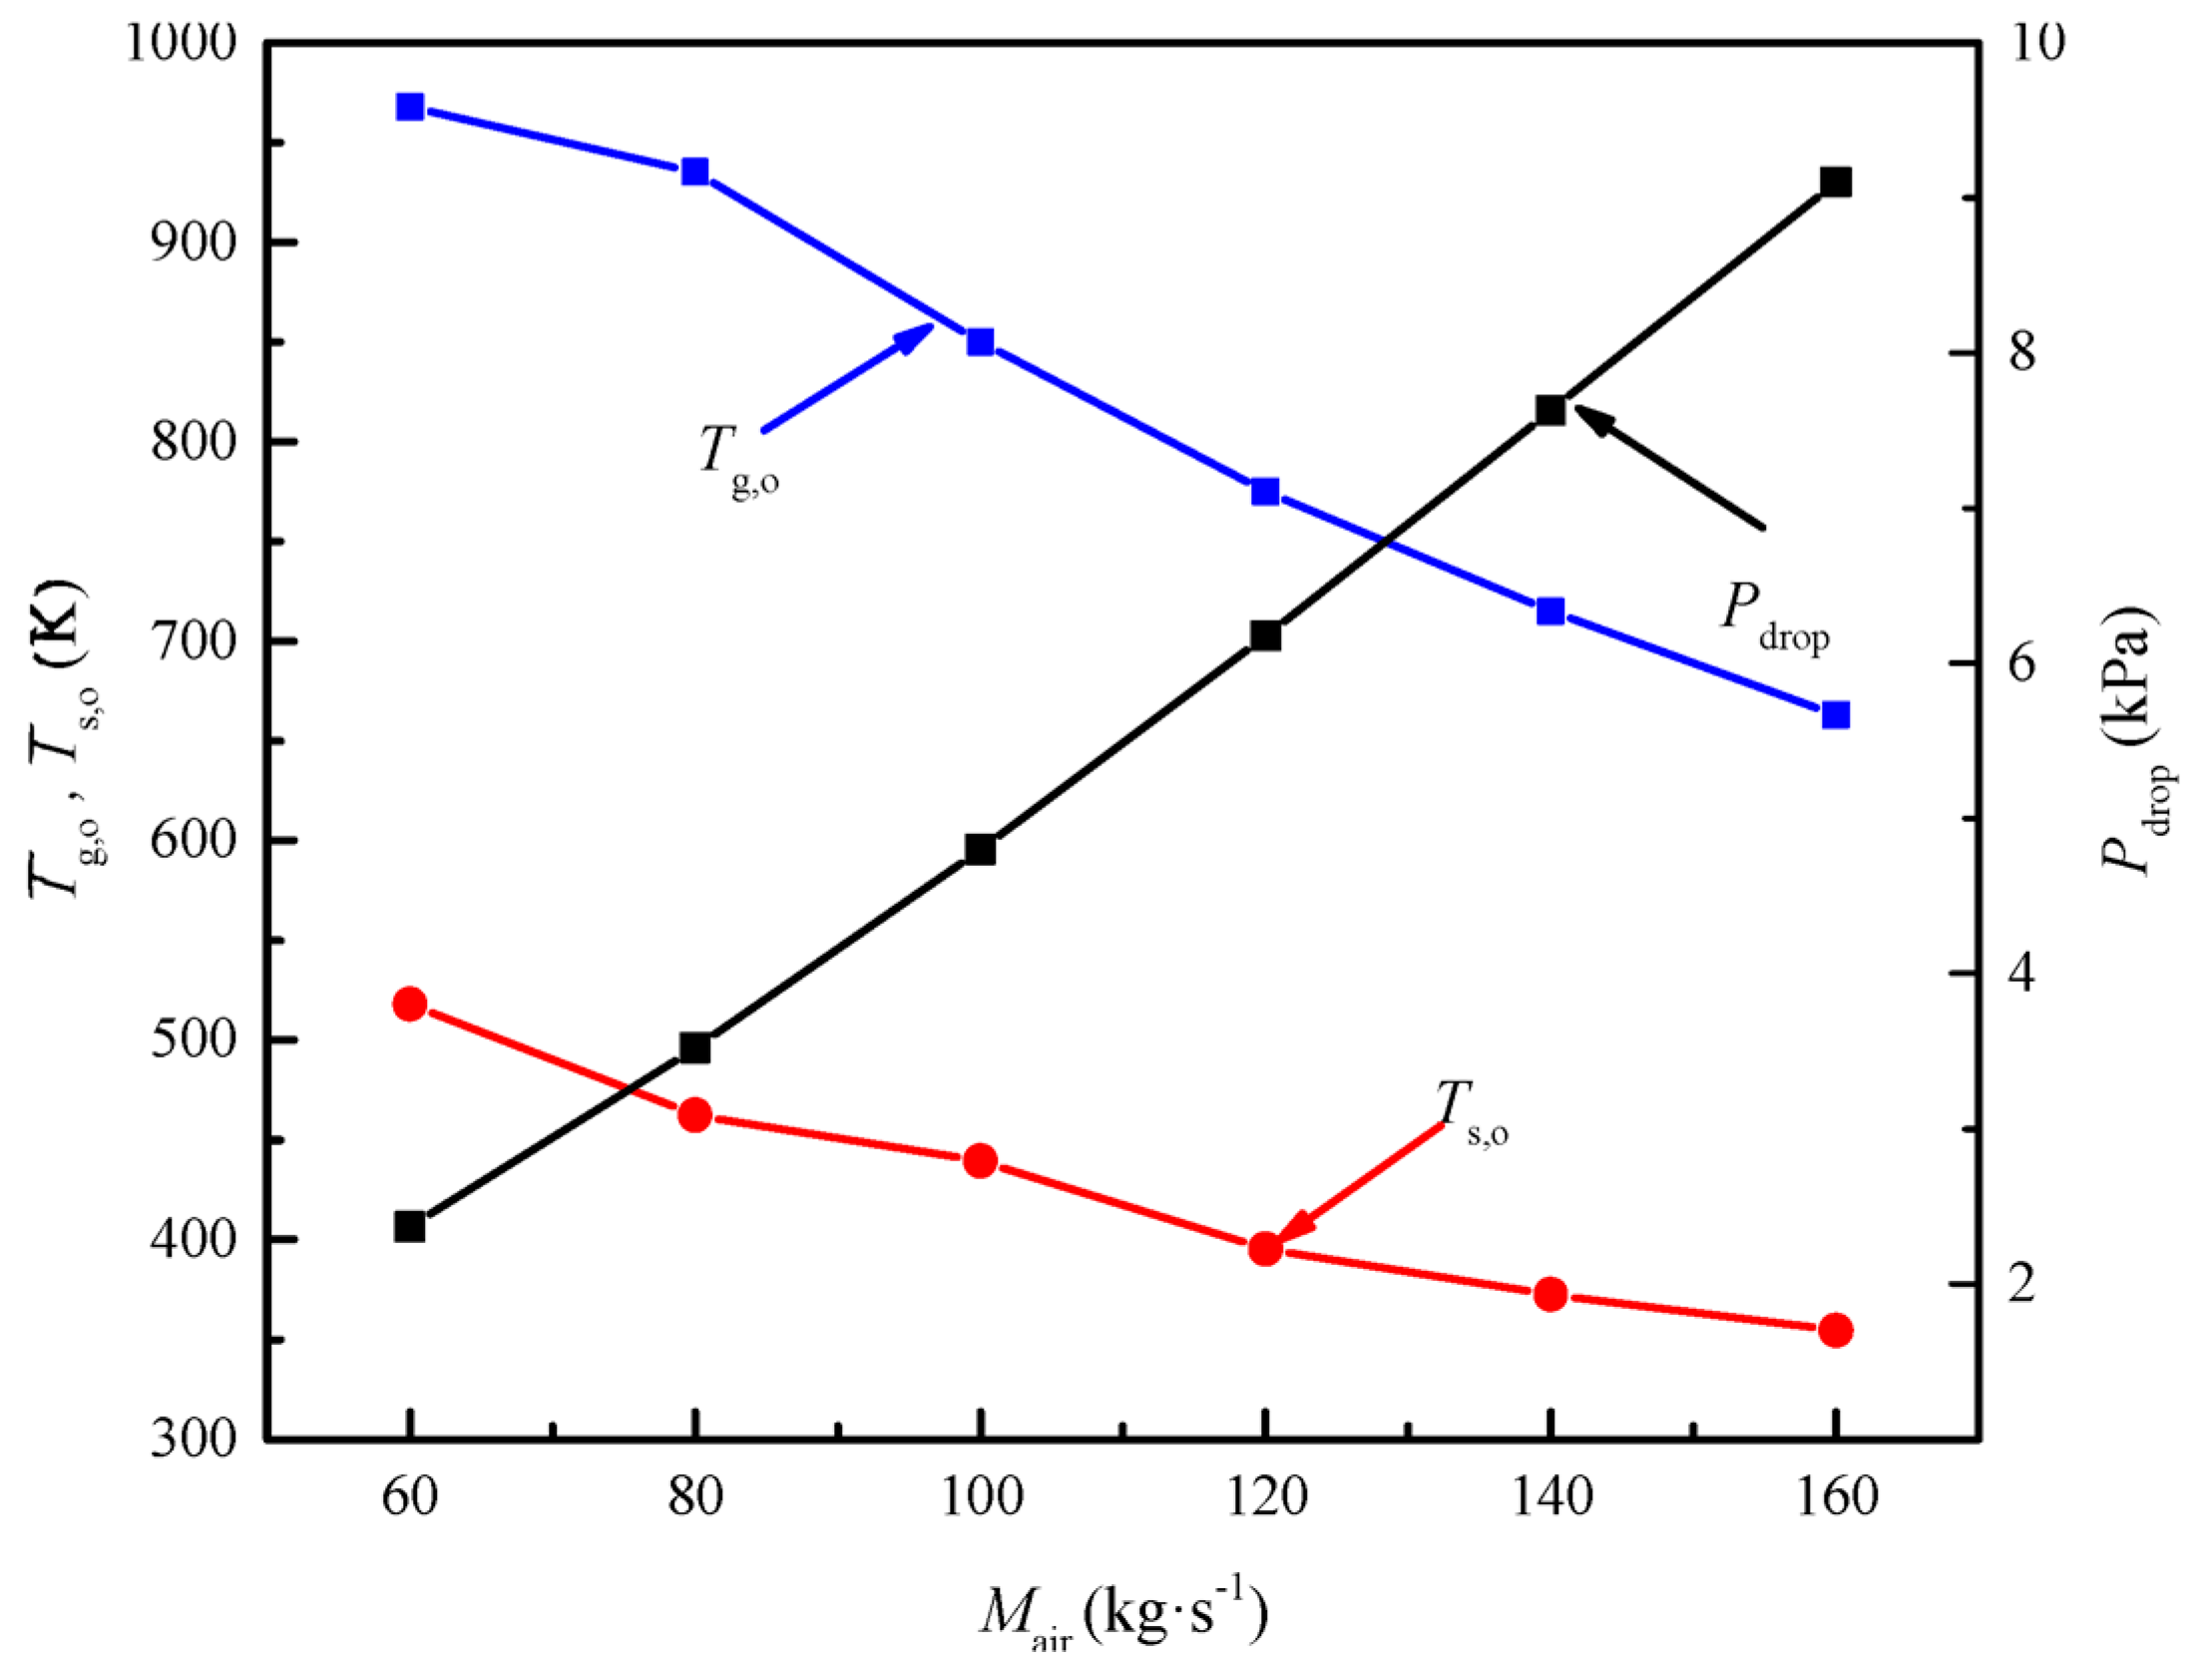
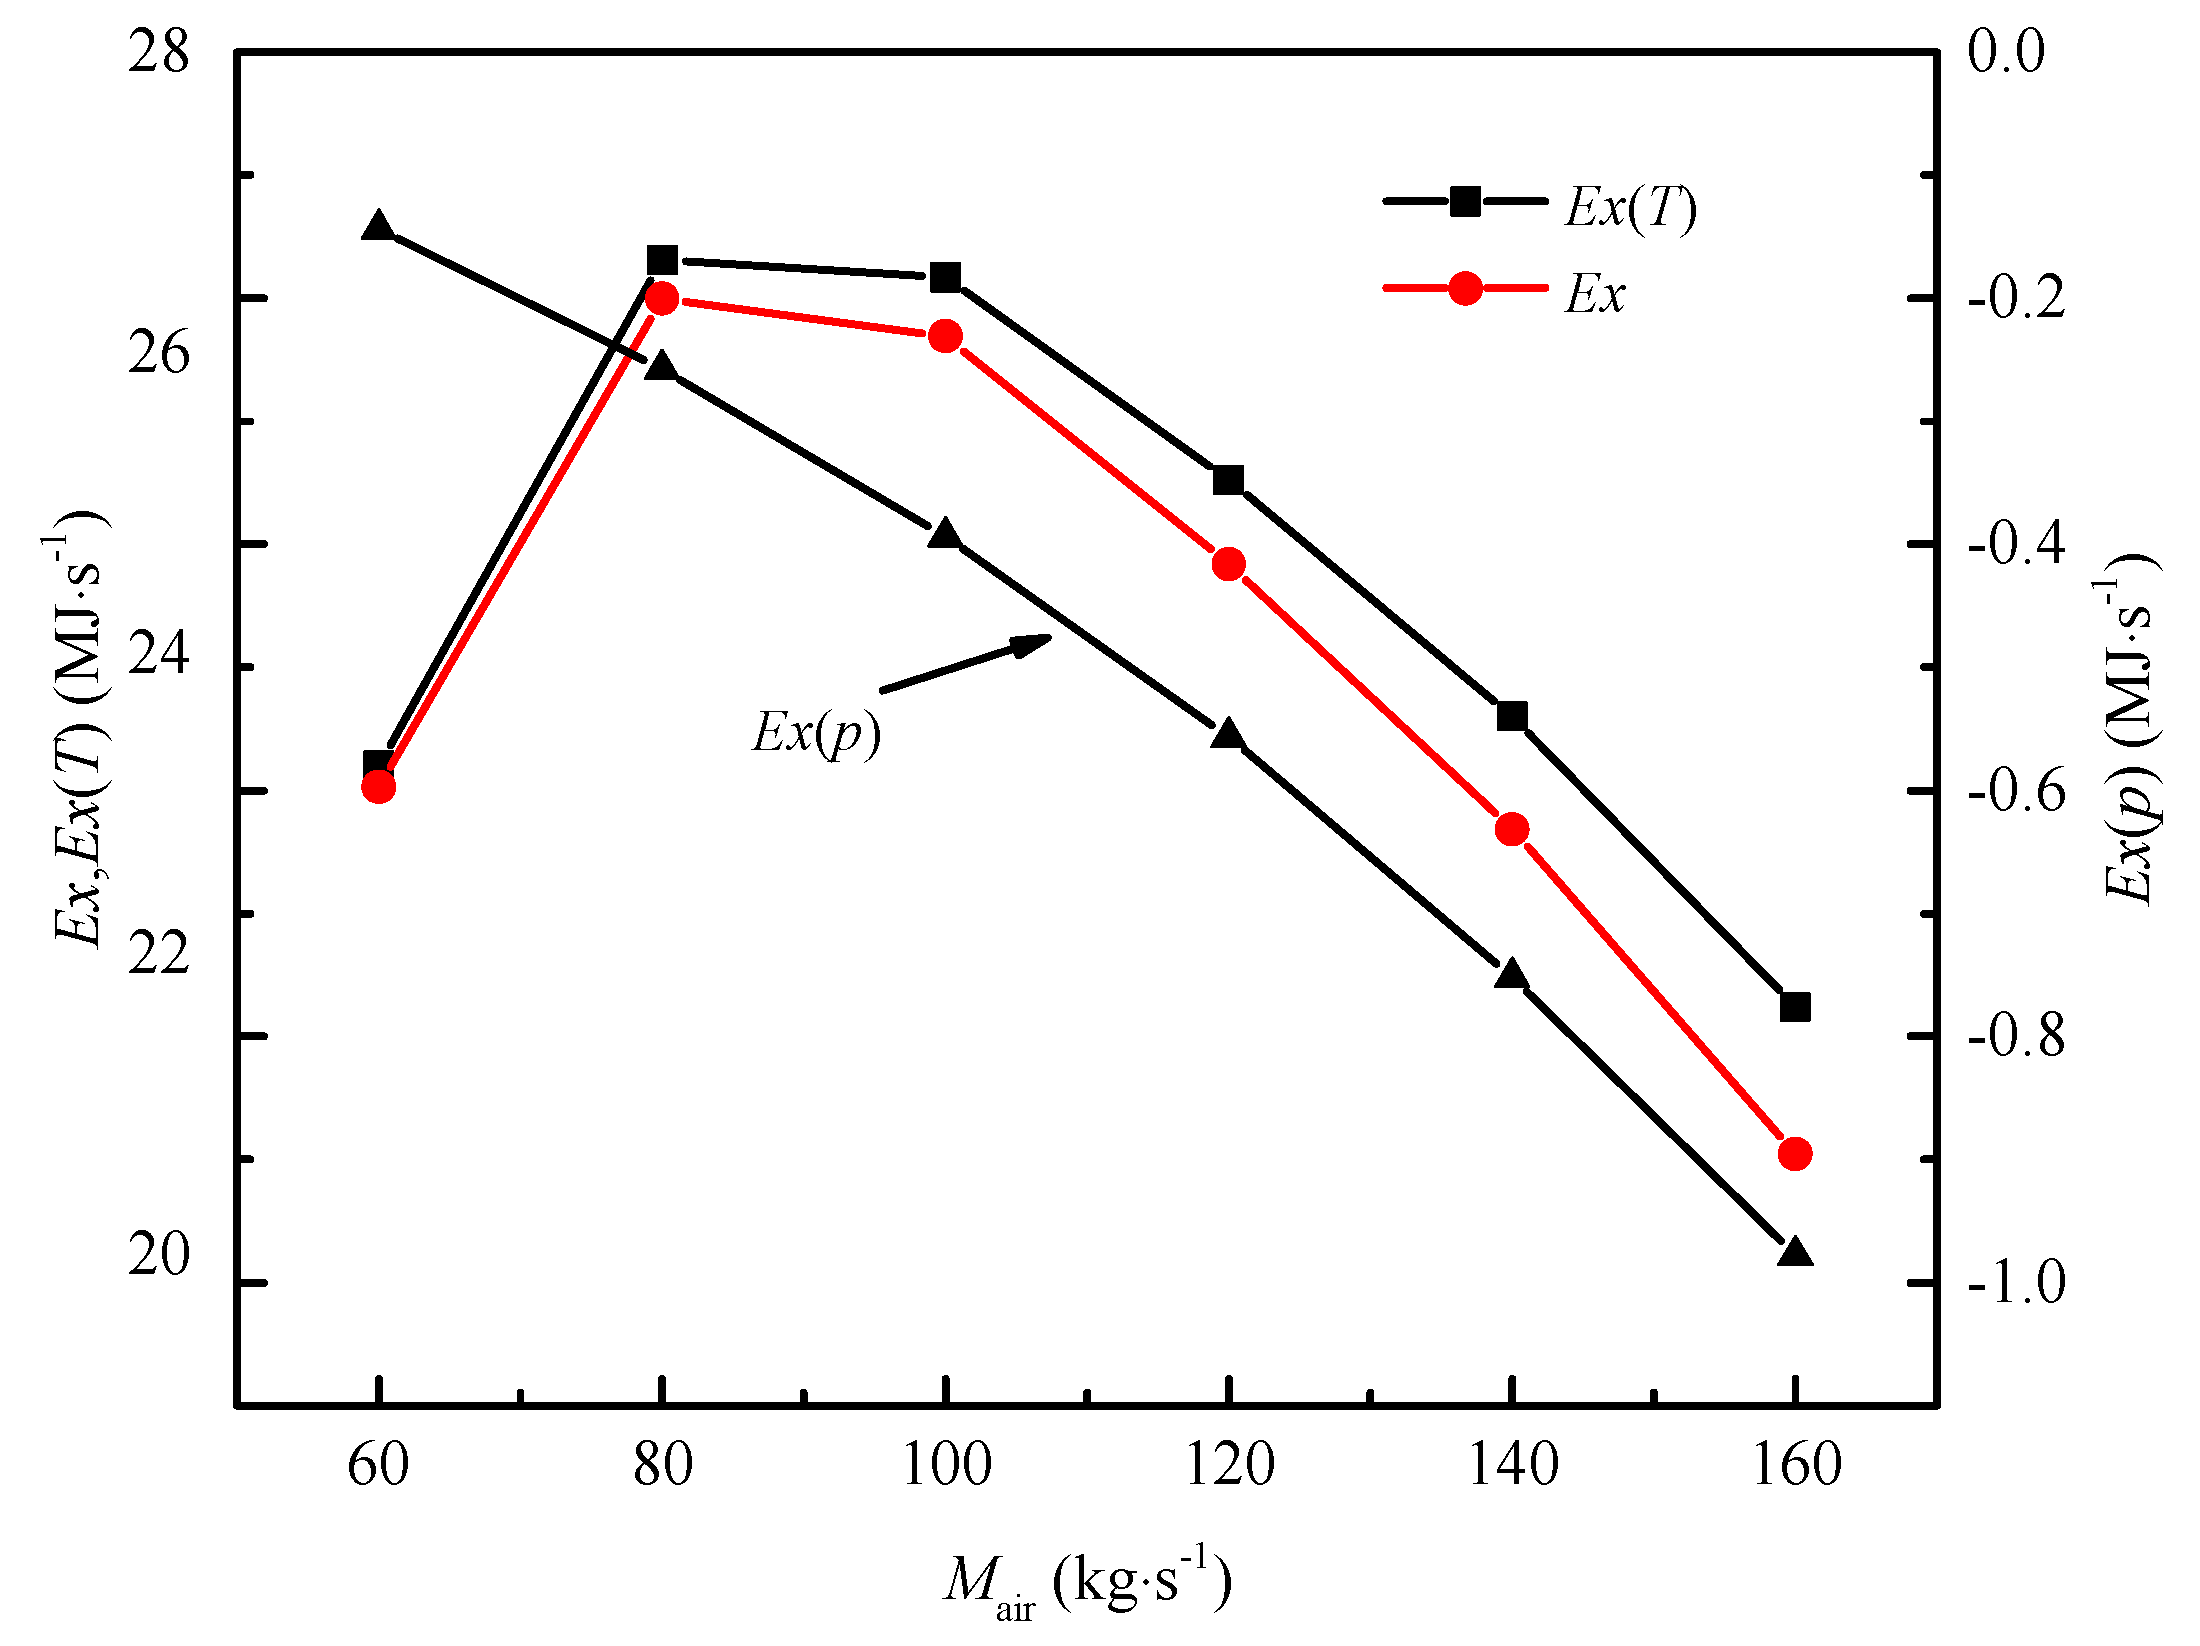
3.1. Effect of the Mass Flow Rate of Air
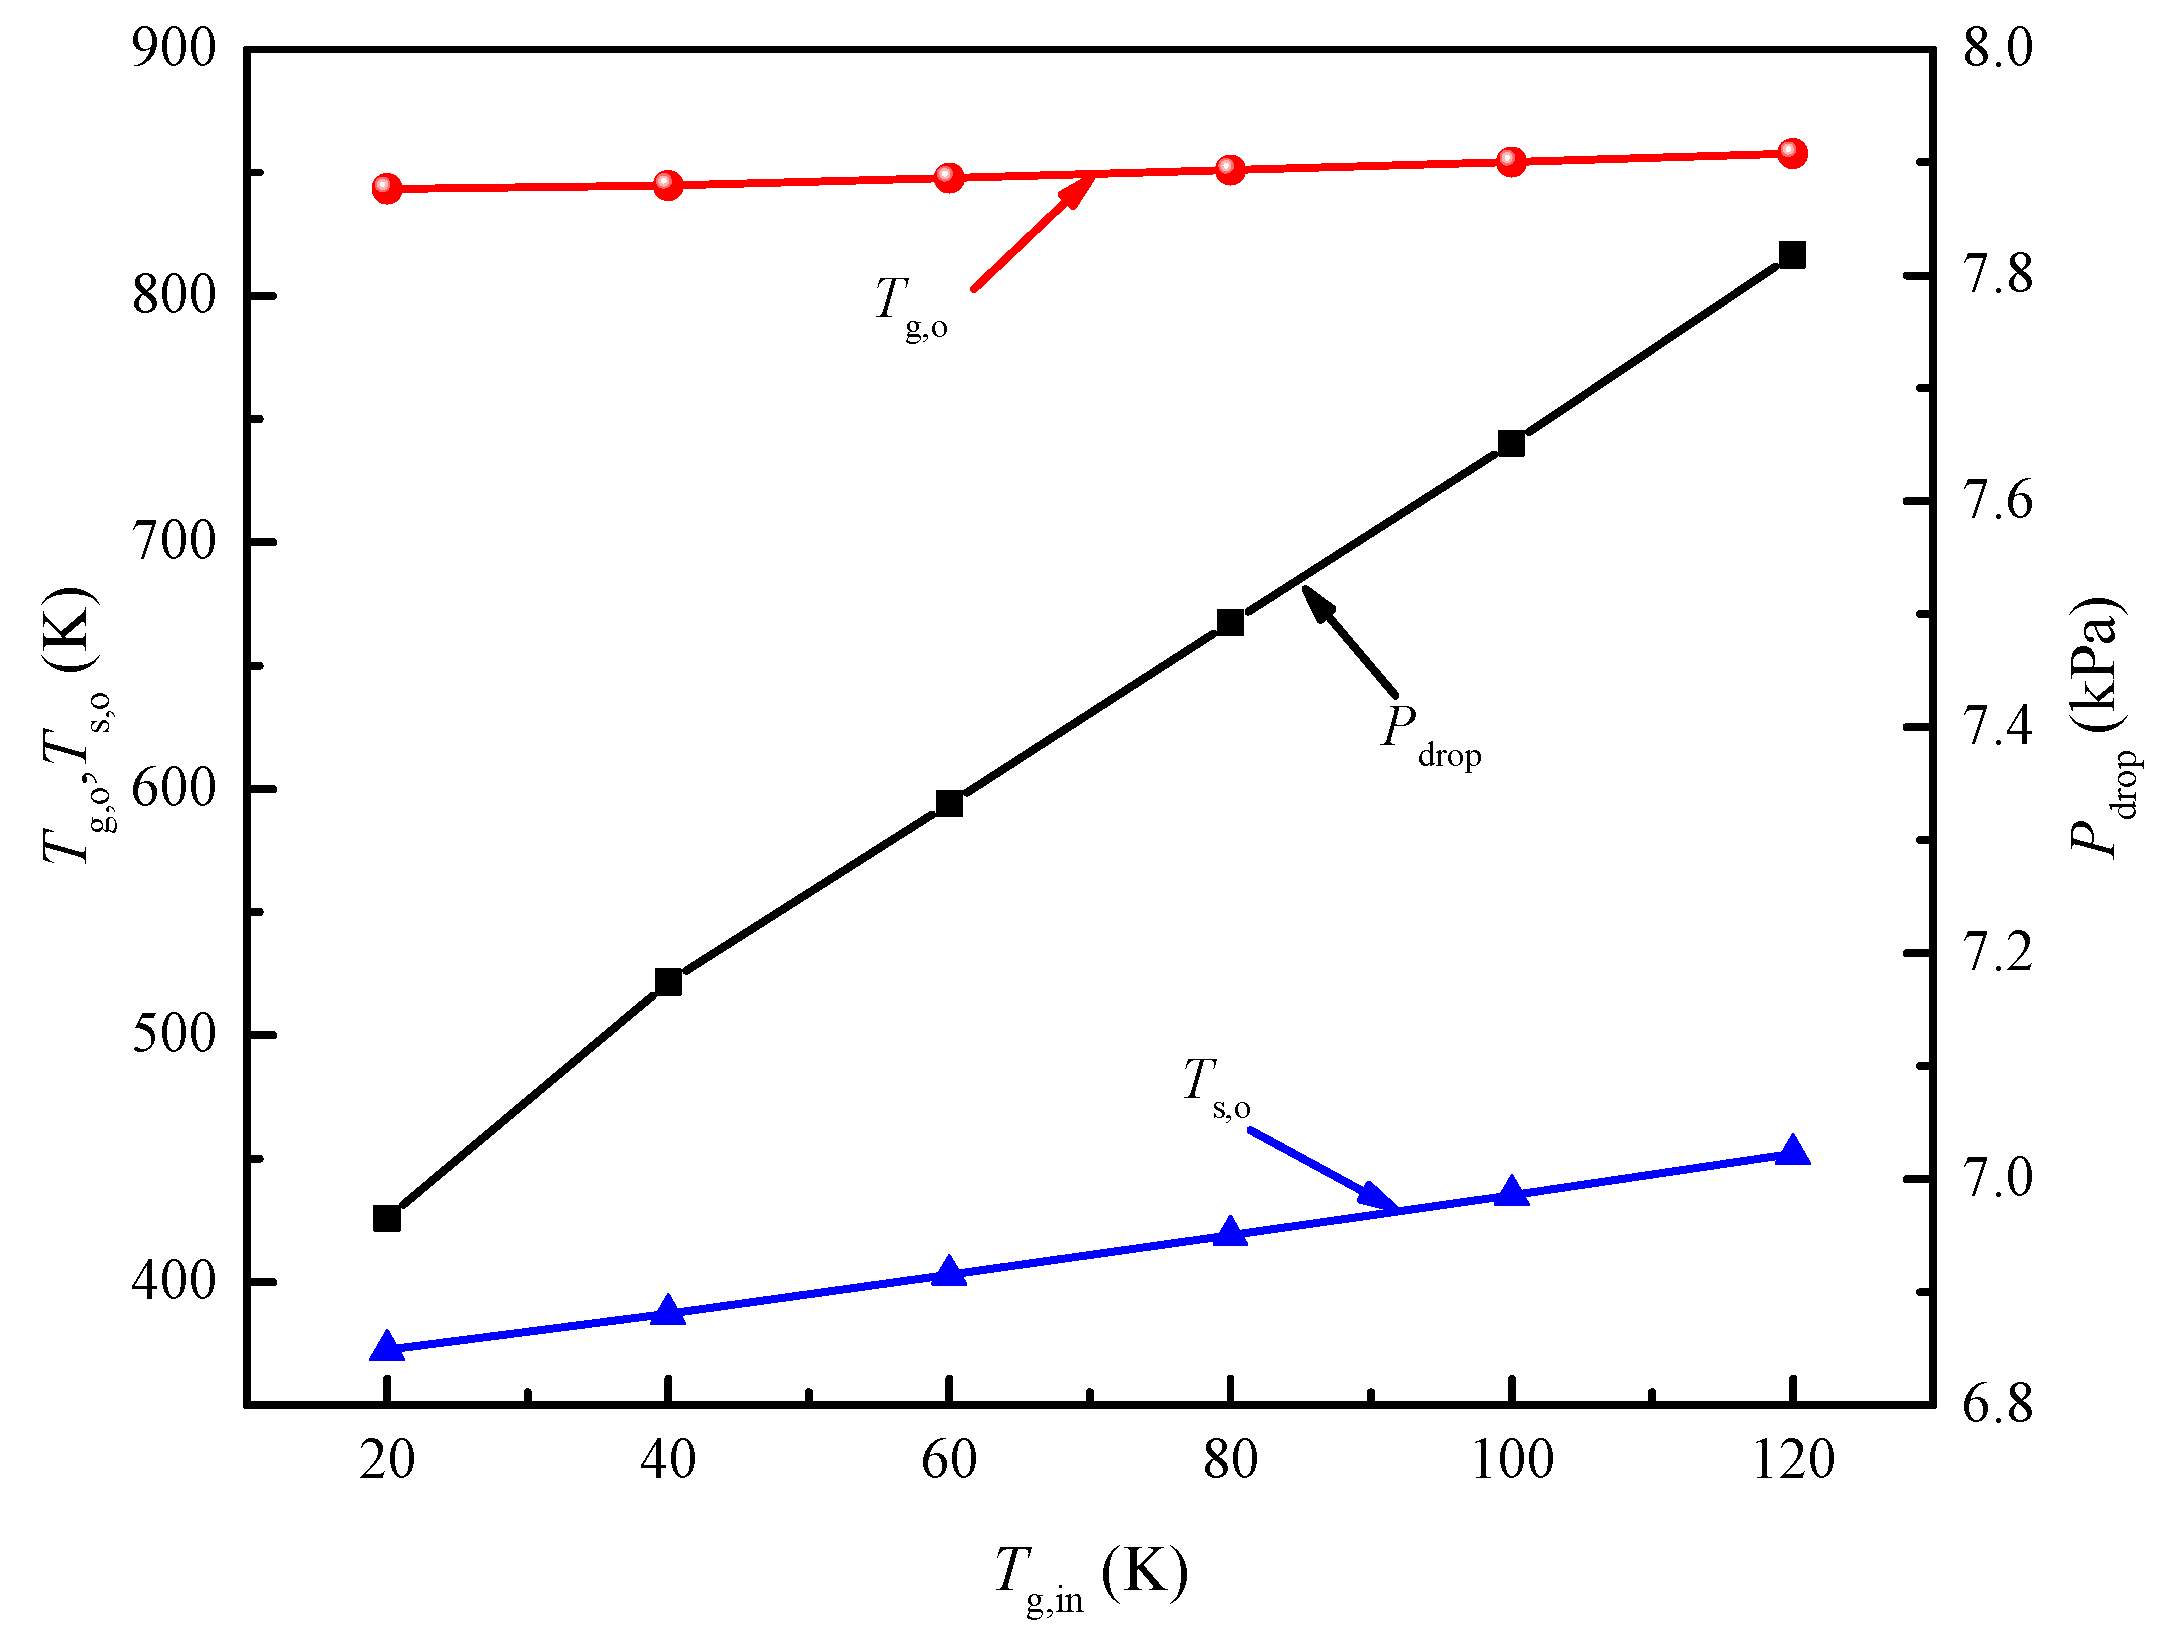
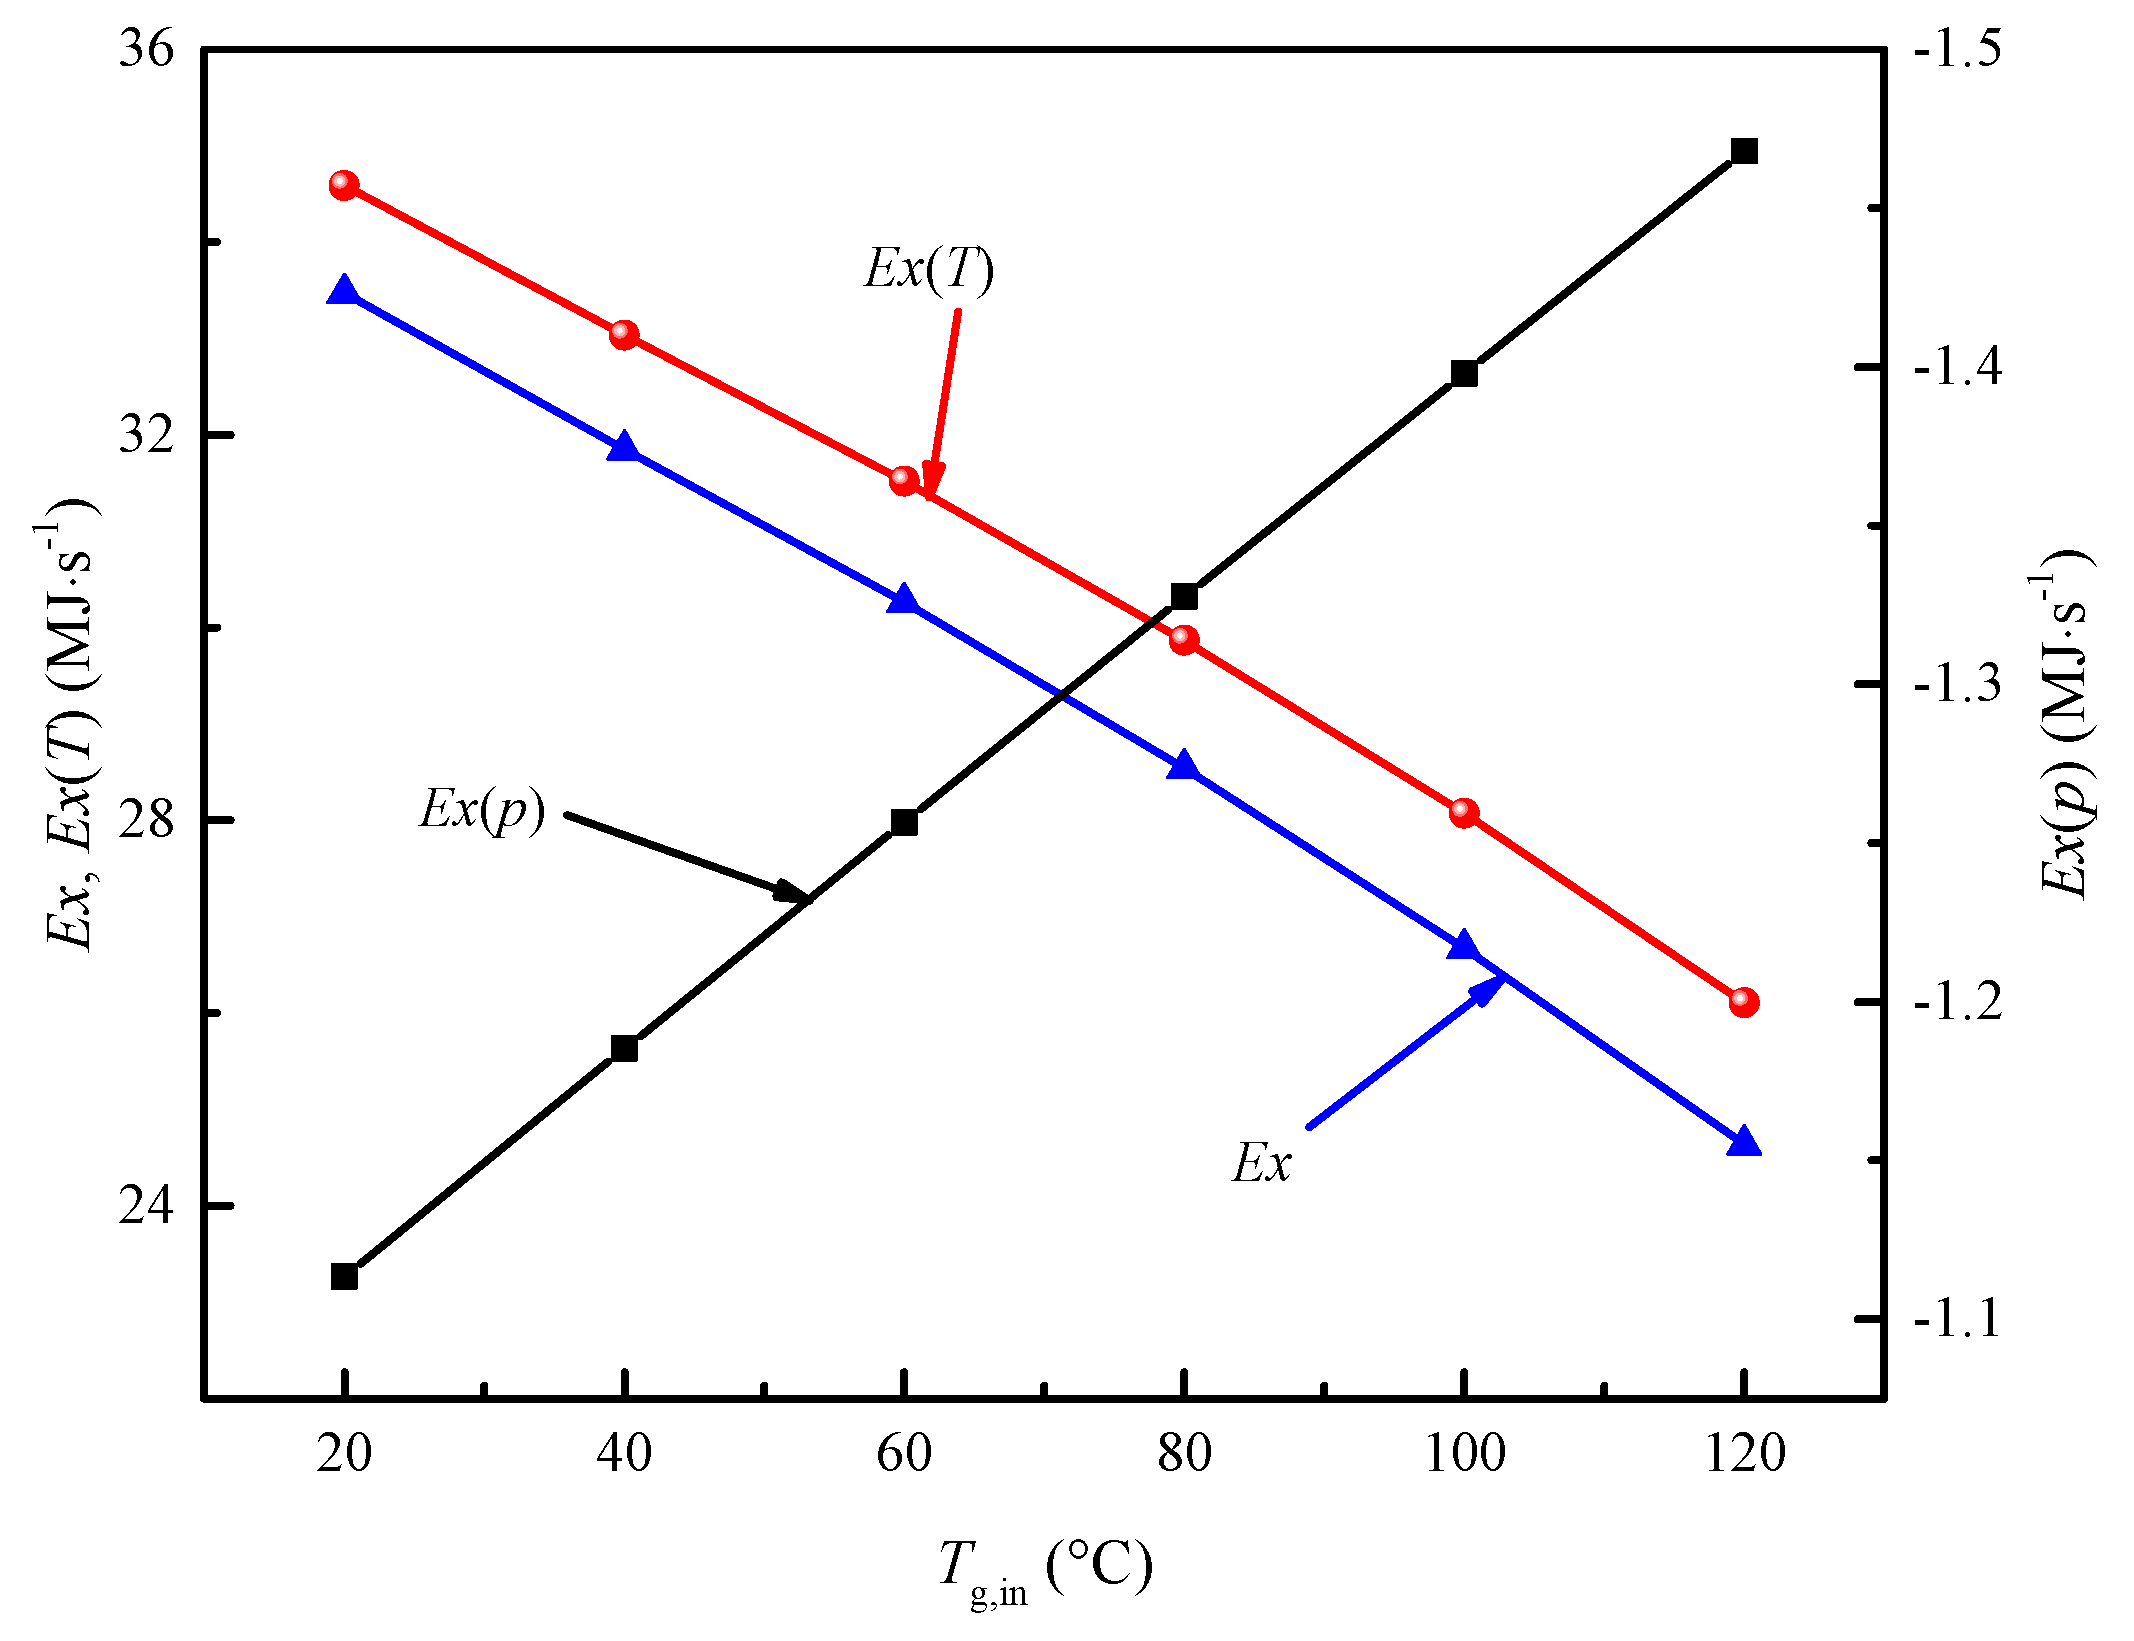
3.2. Effect of the Air Inlet Temperature
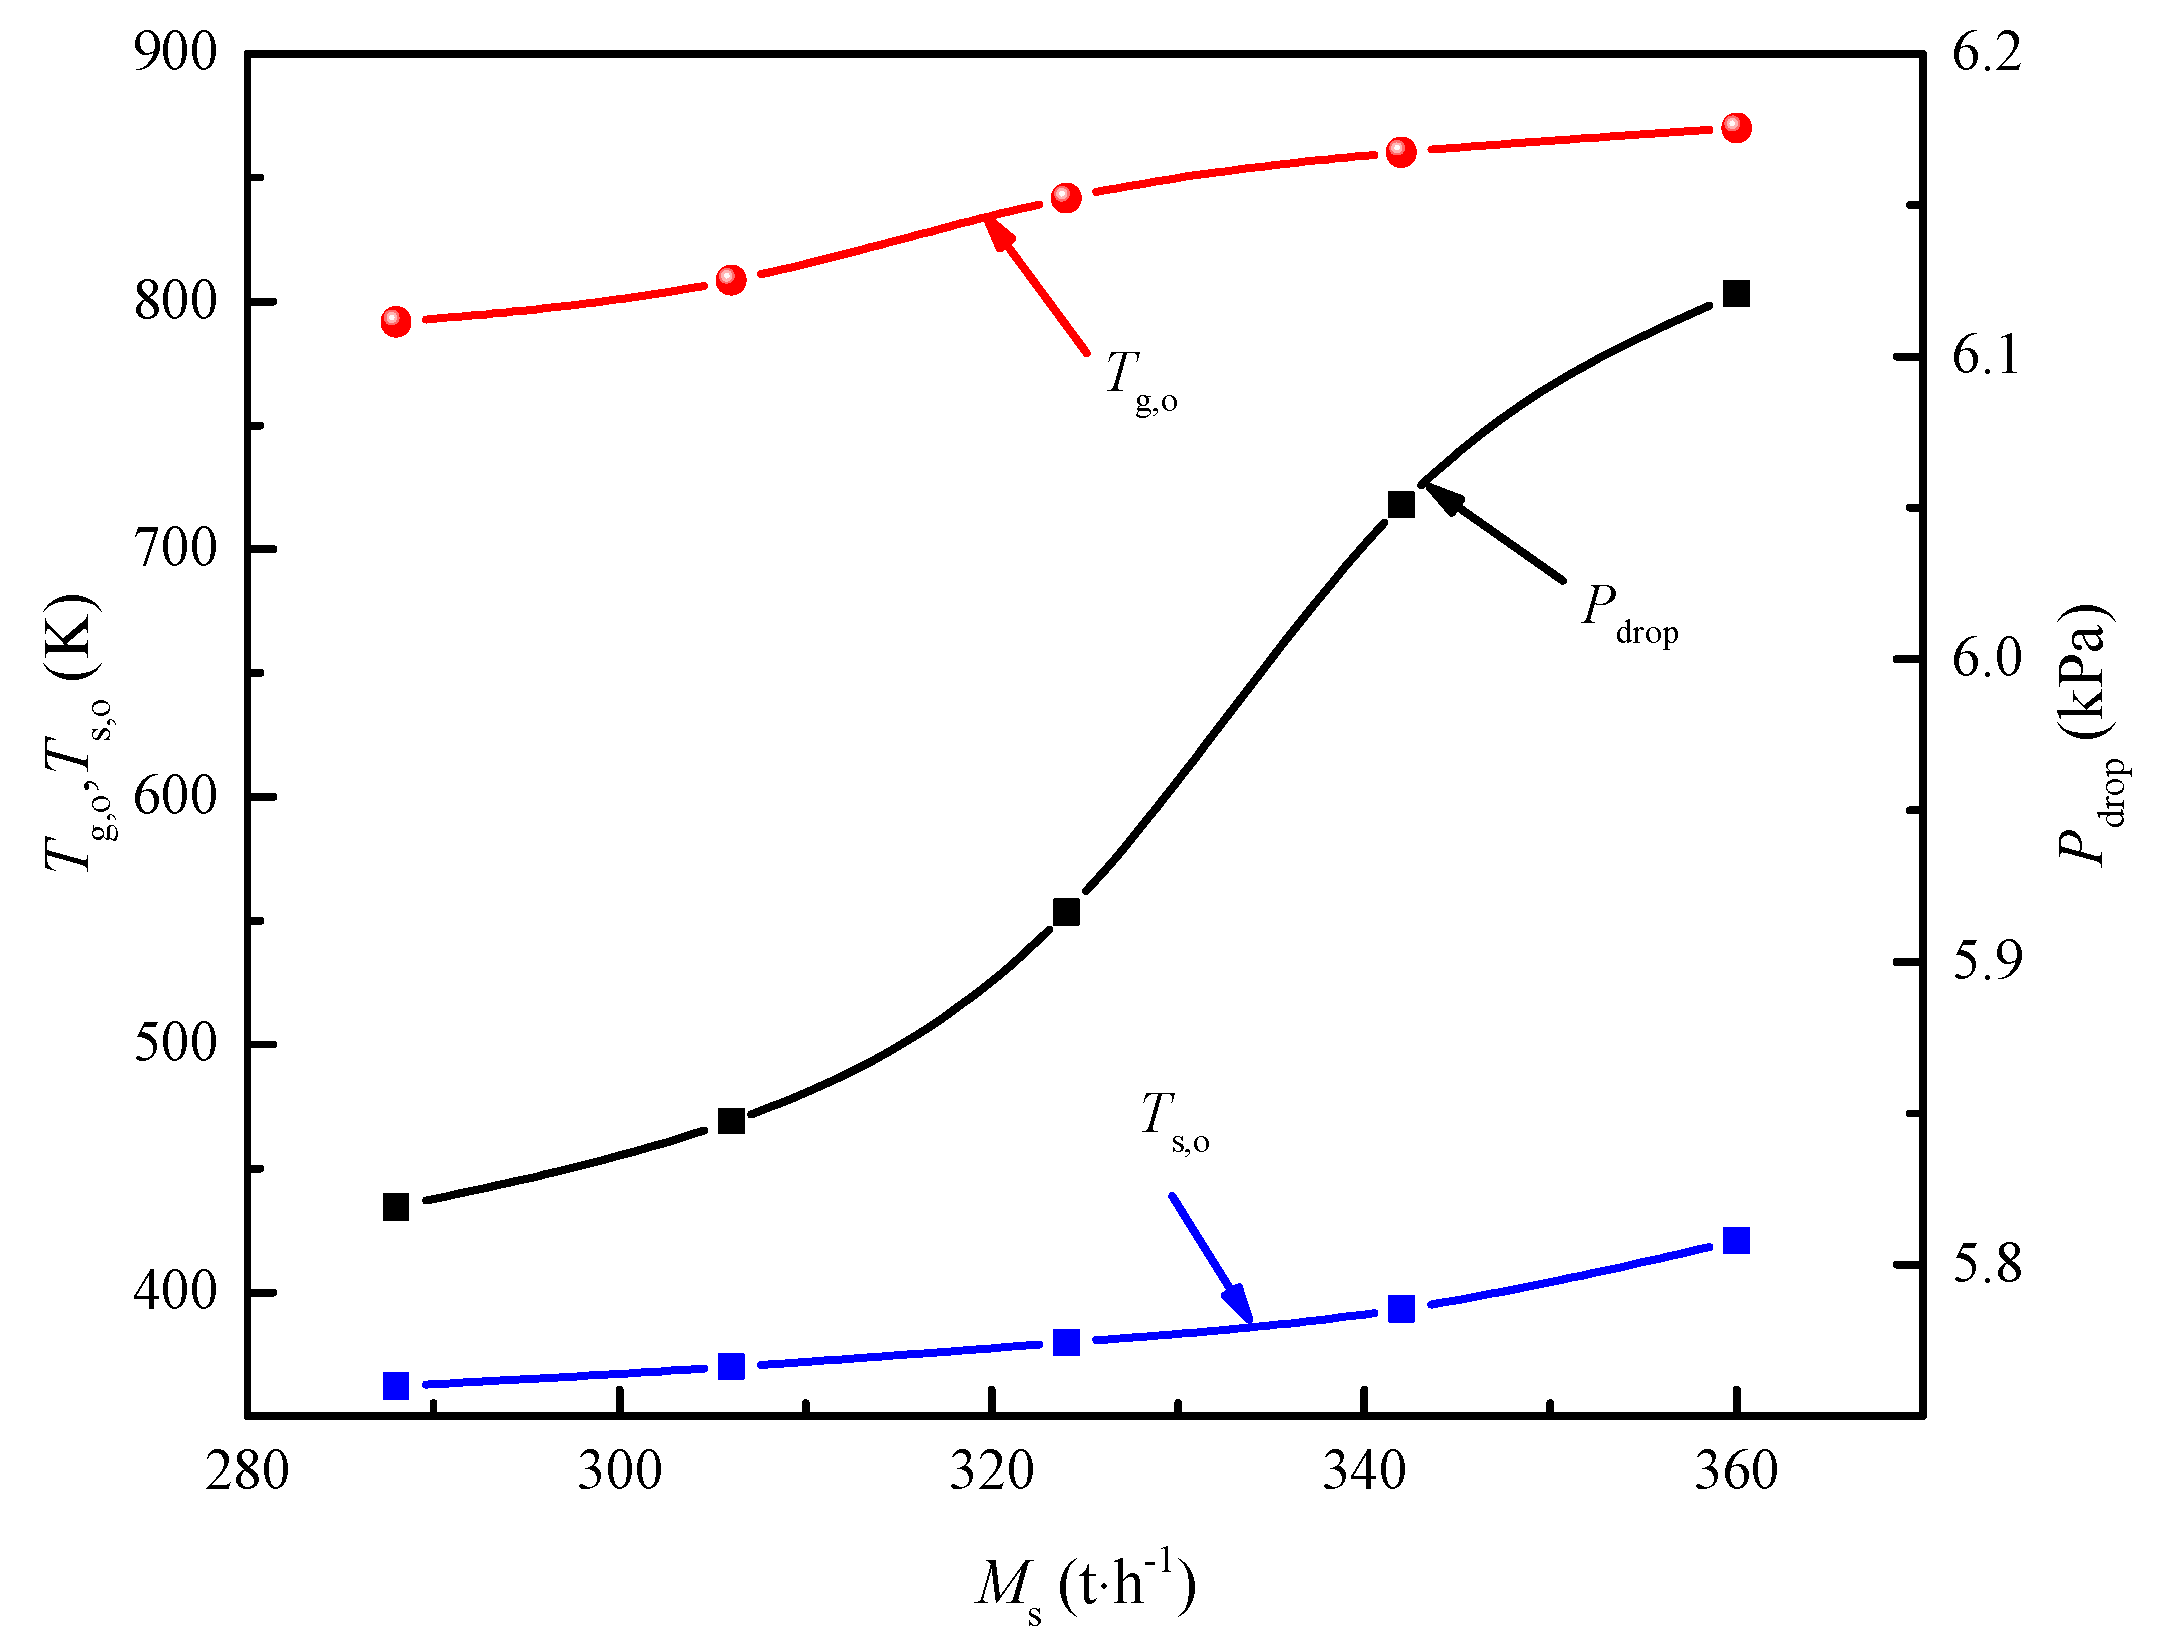
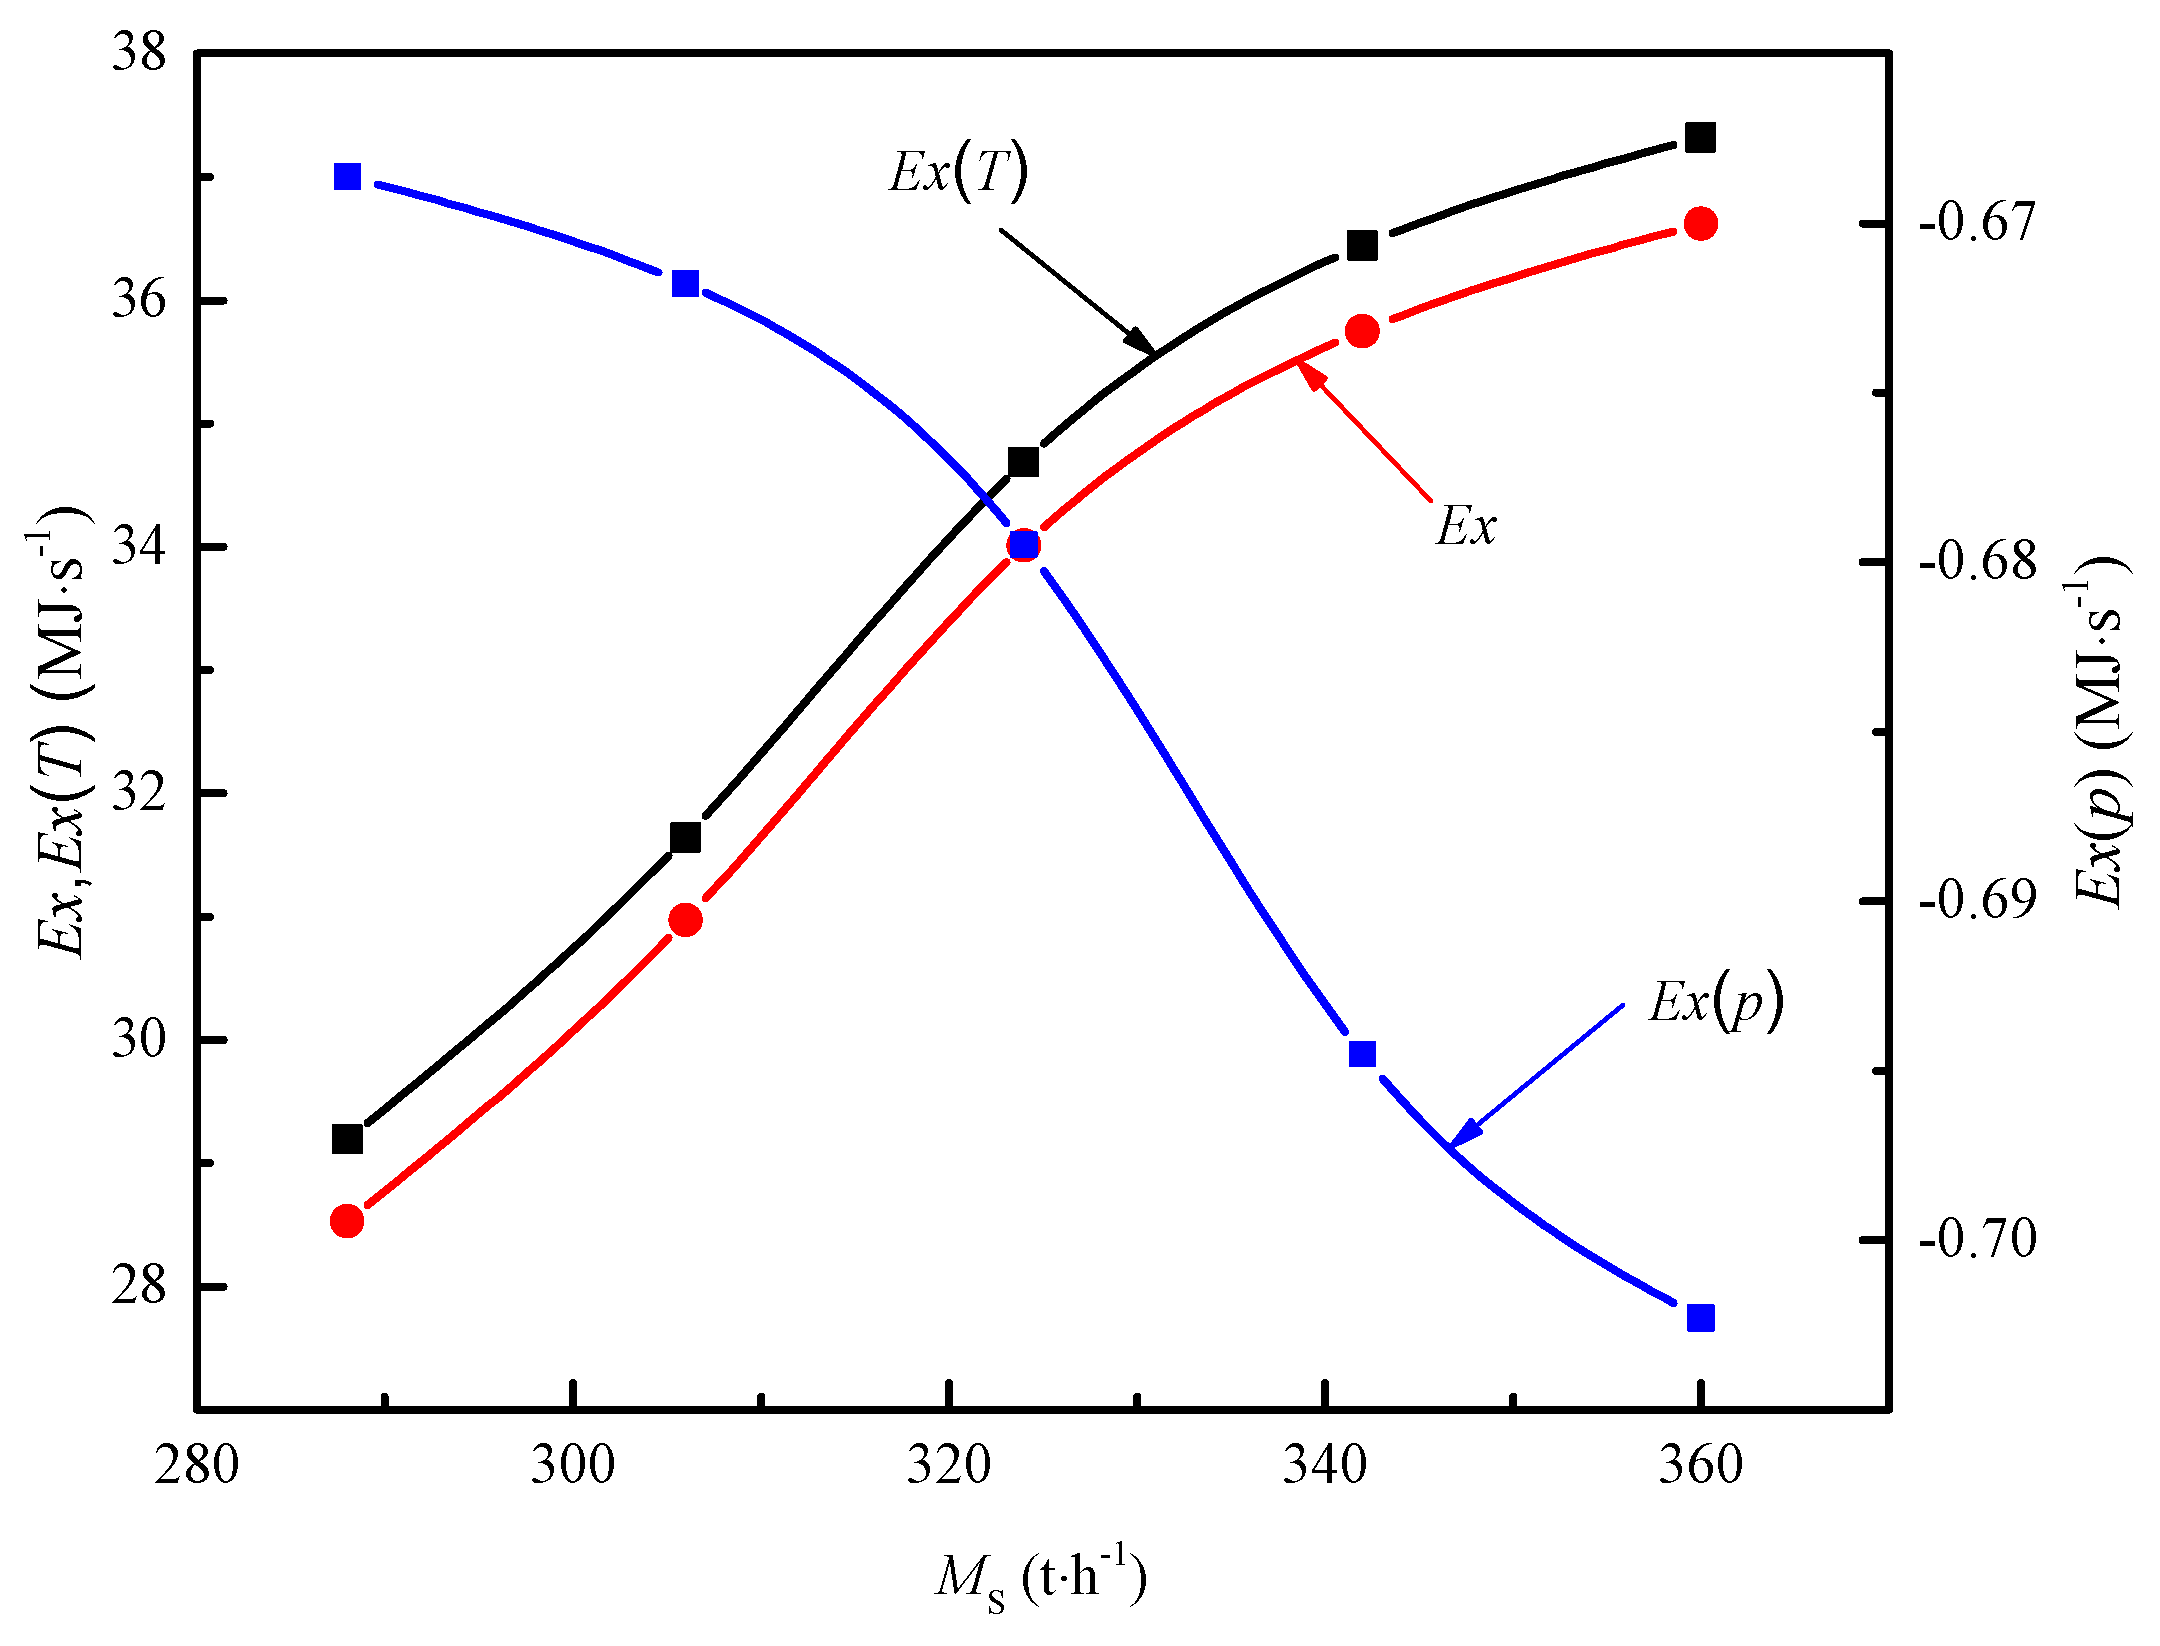
3.3. Effect of the Sinter Mass Flow Rate
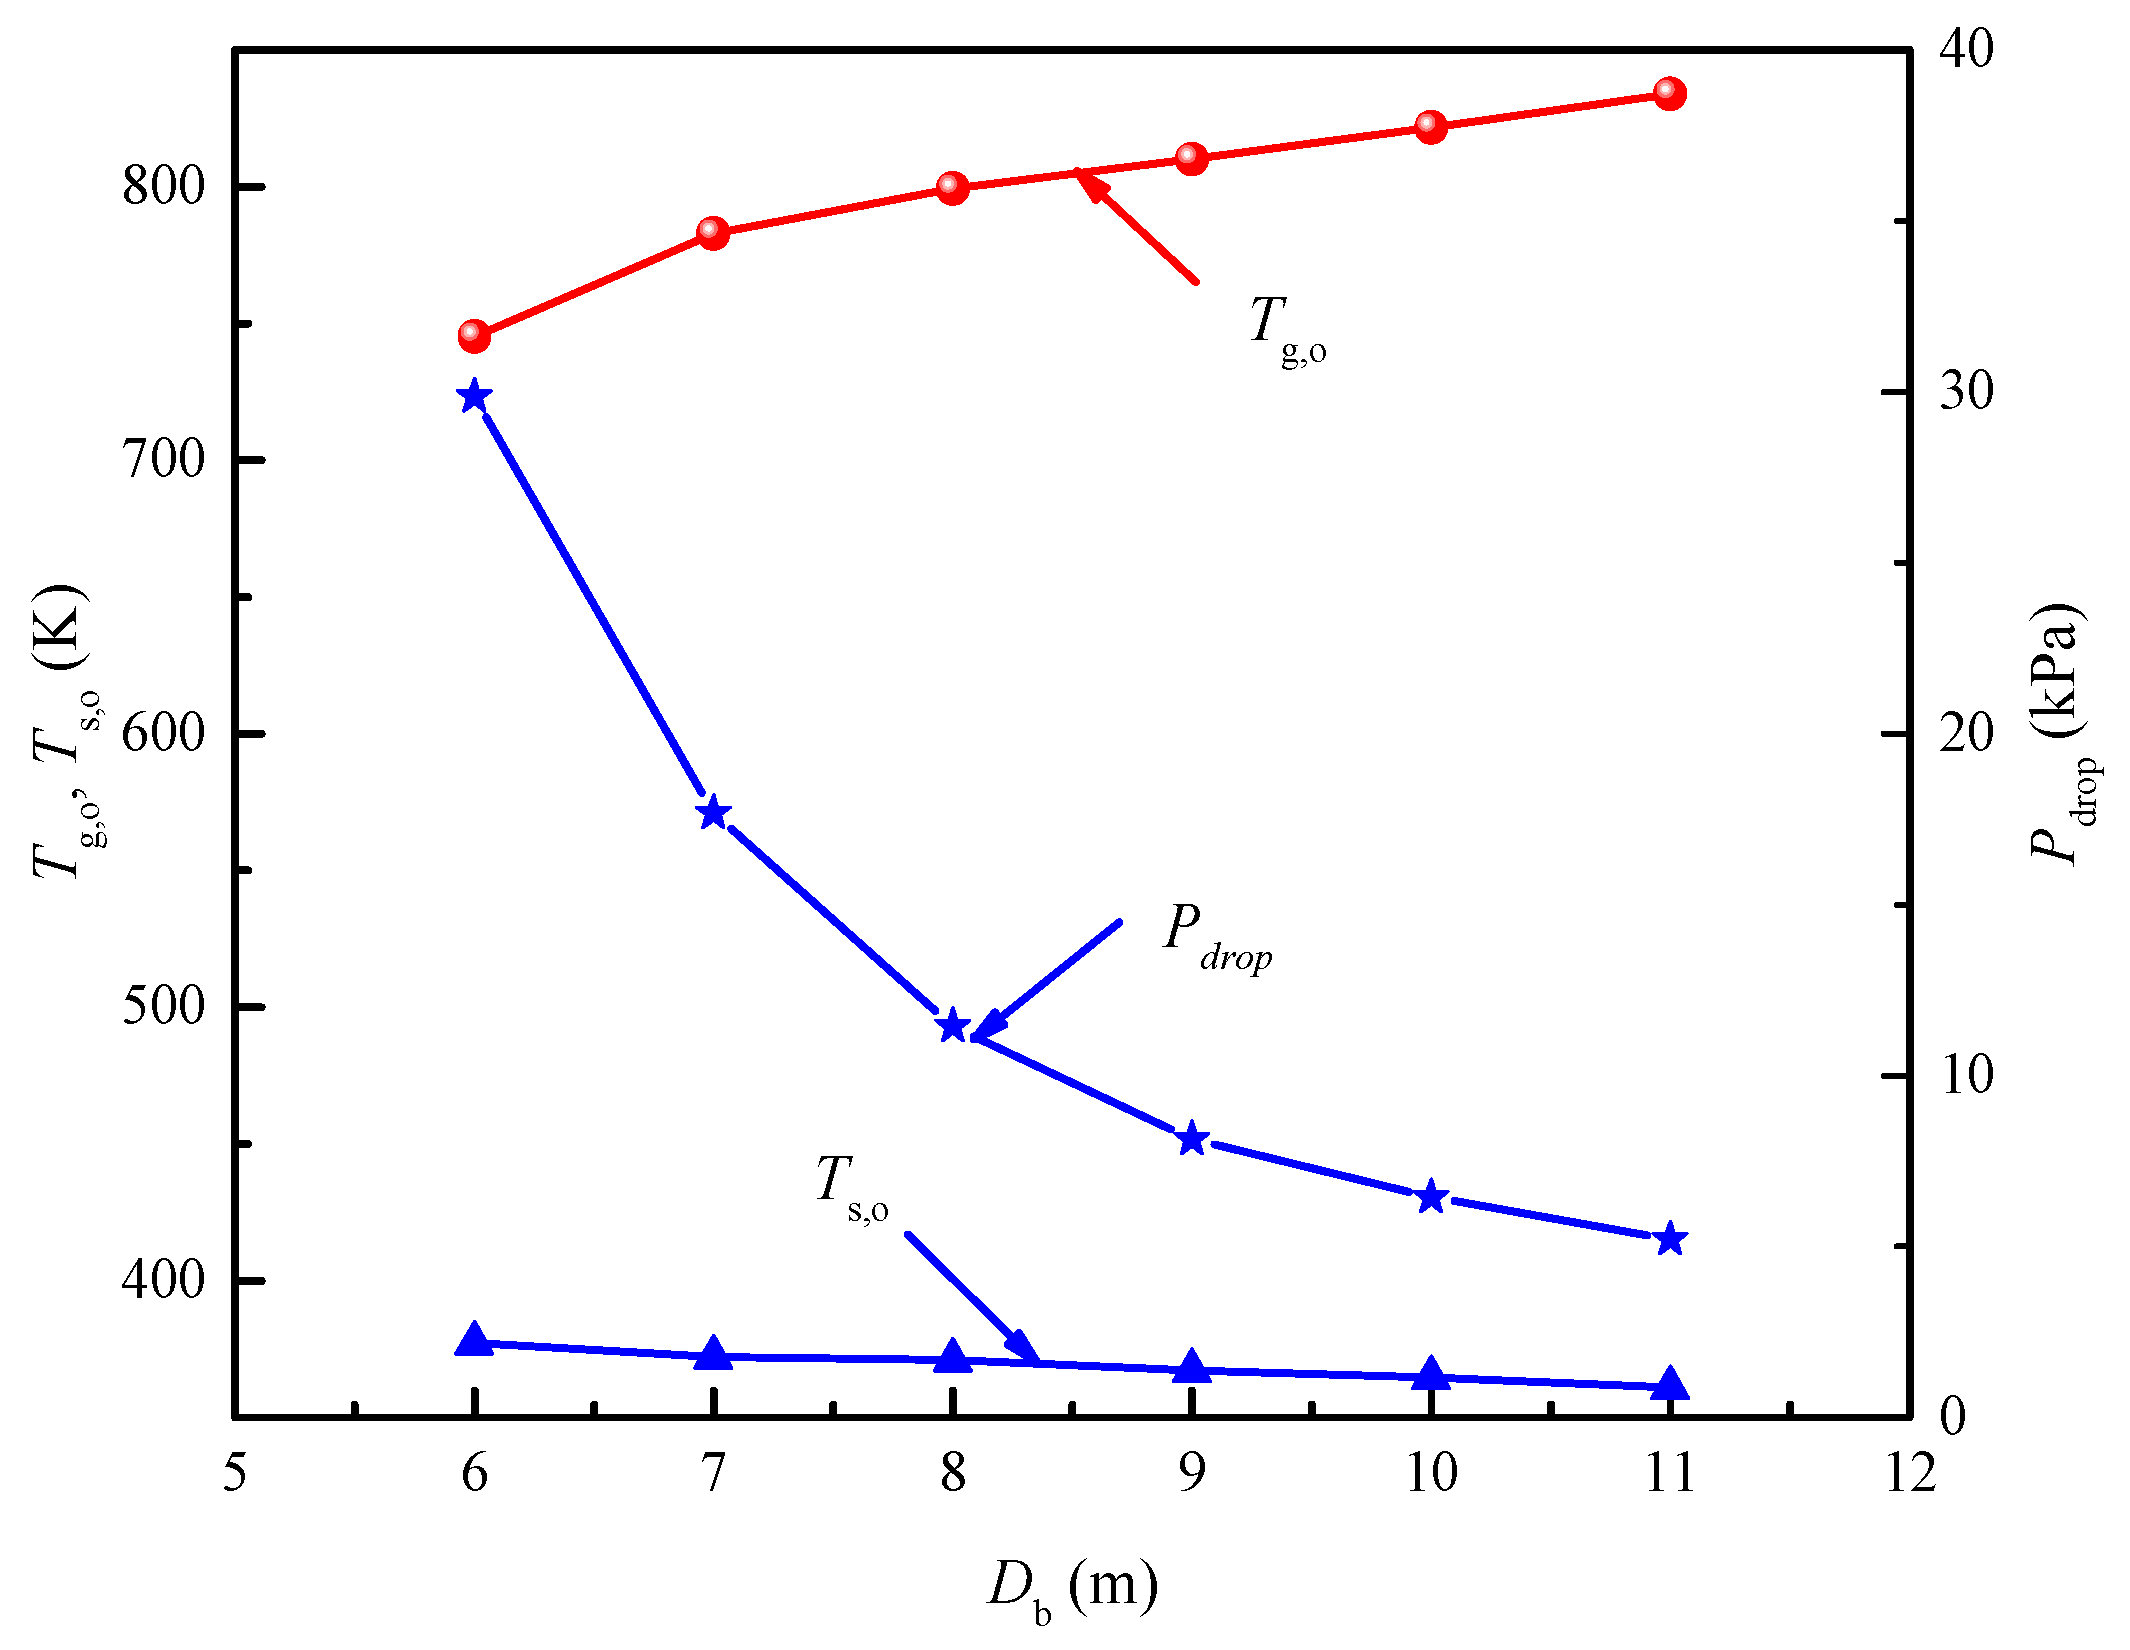
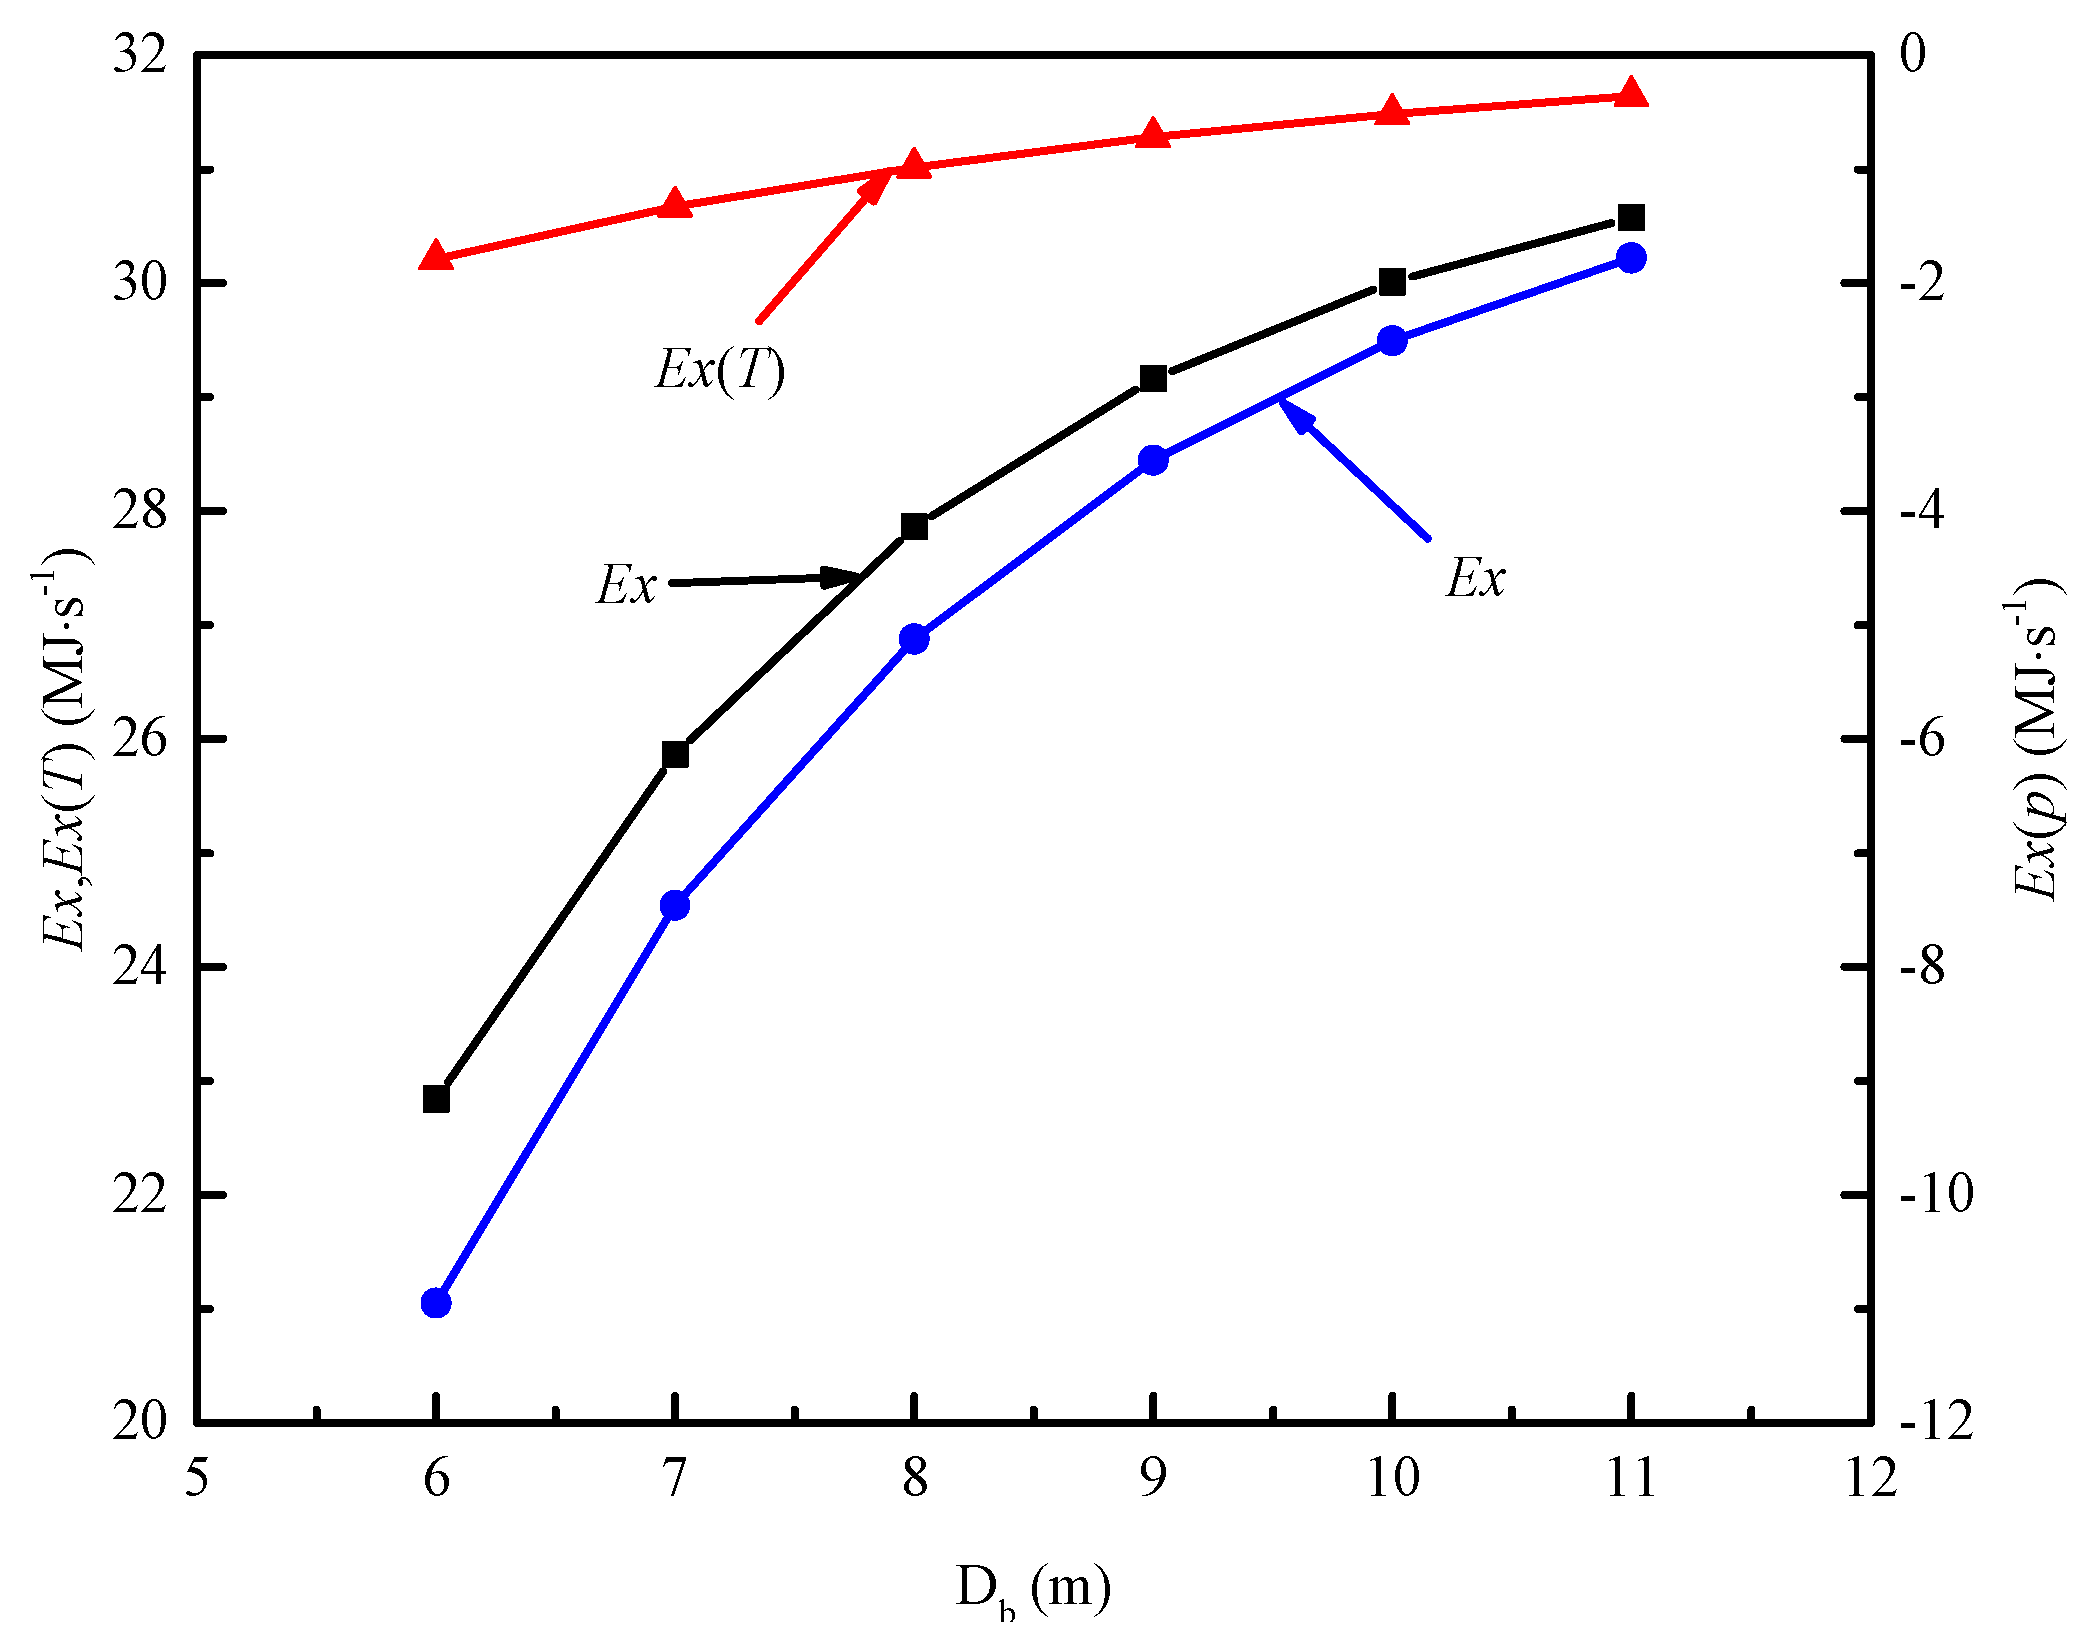
3.4. Effect of the Diameter of the Sinter Bed
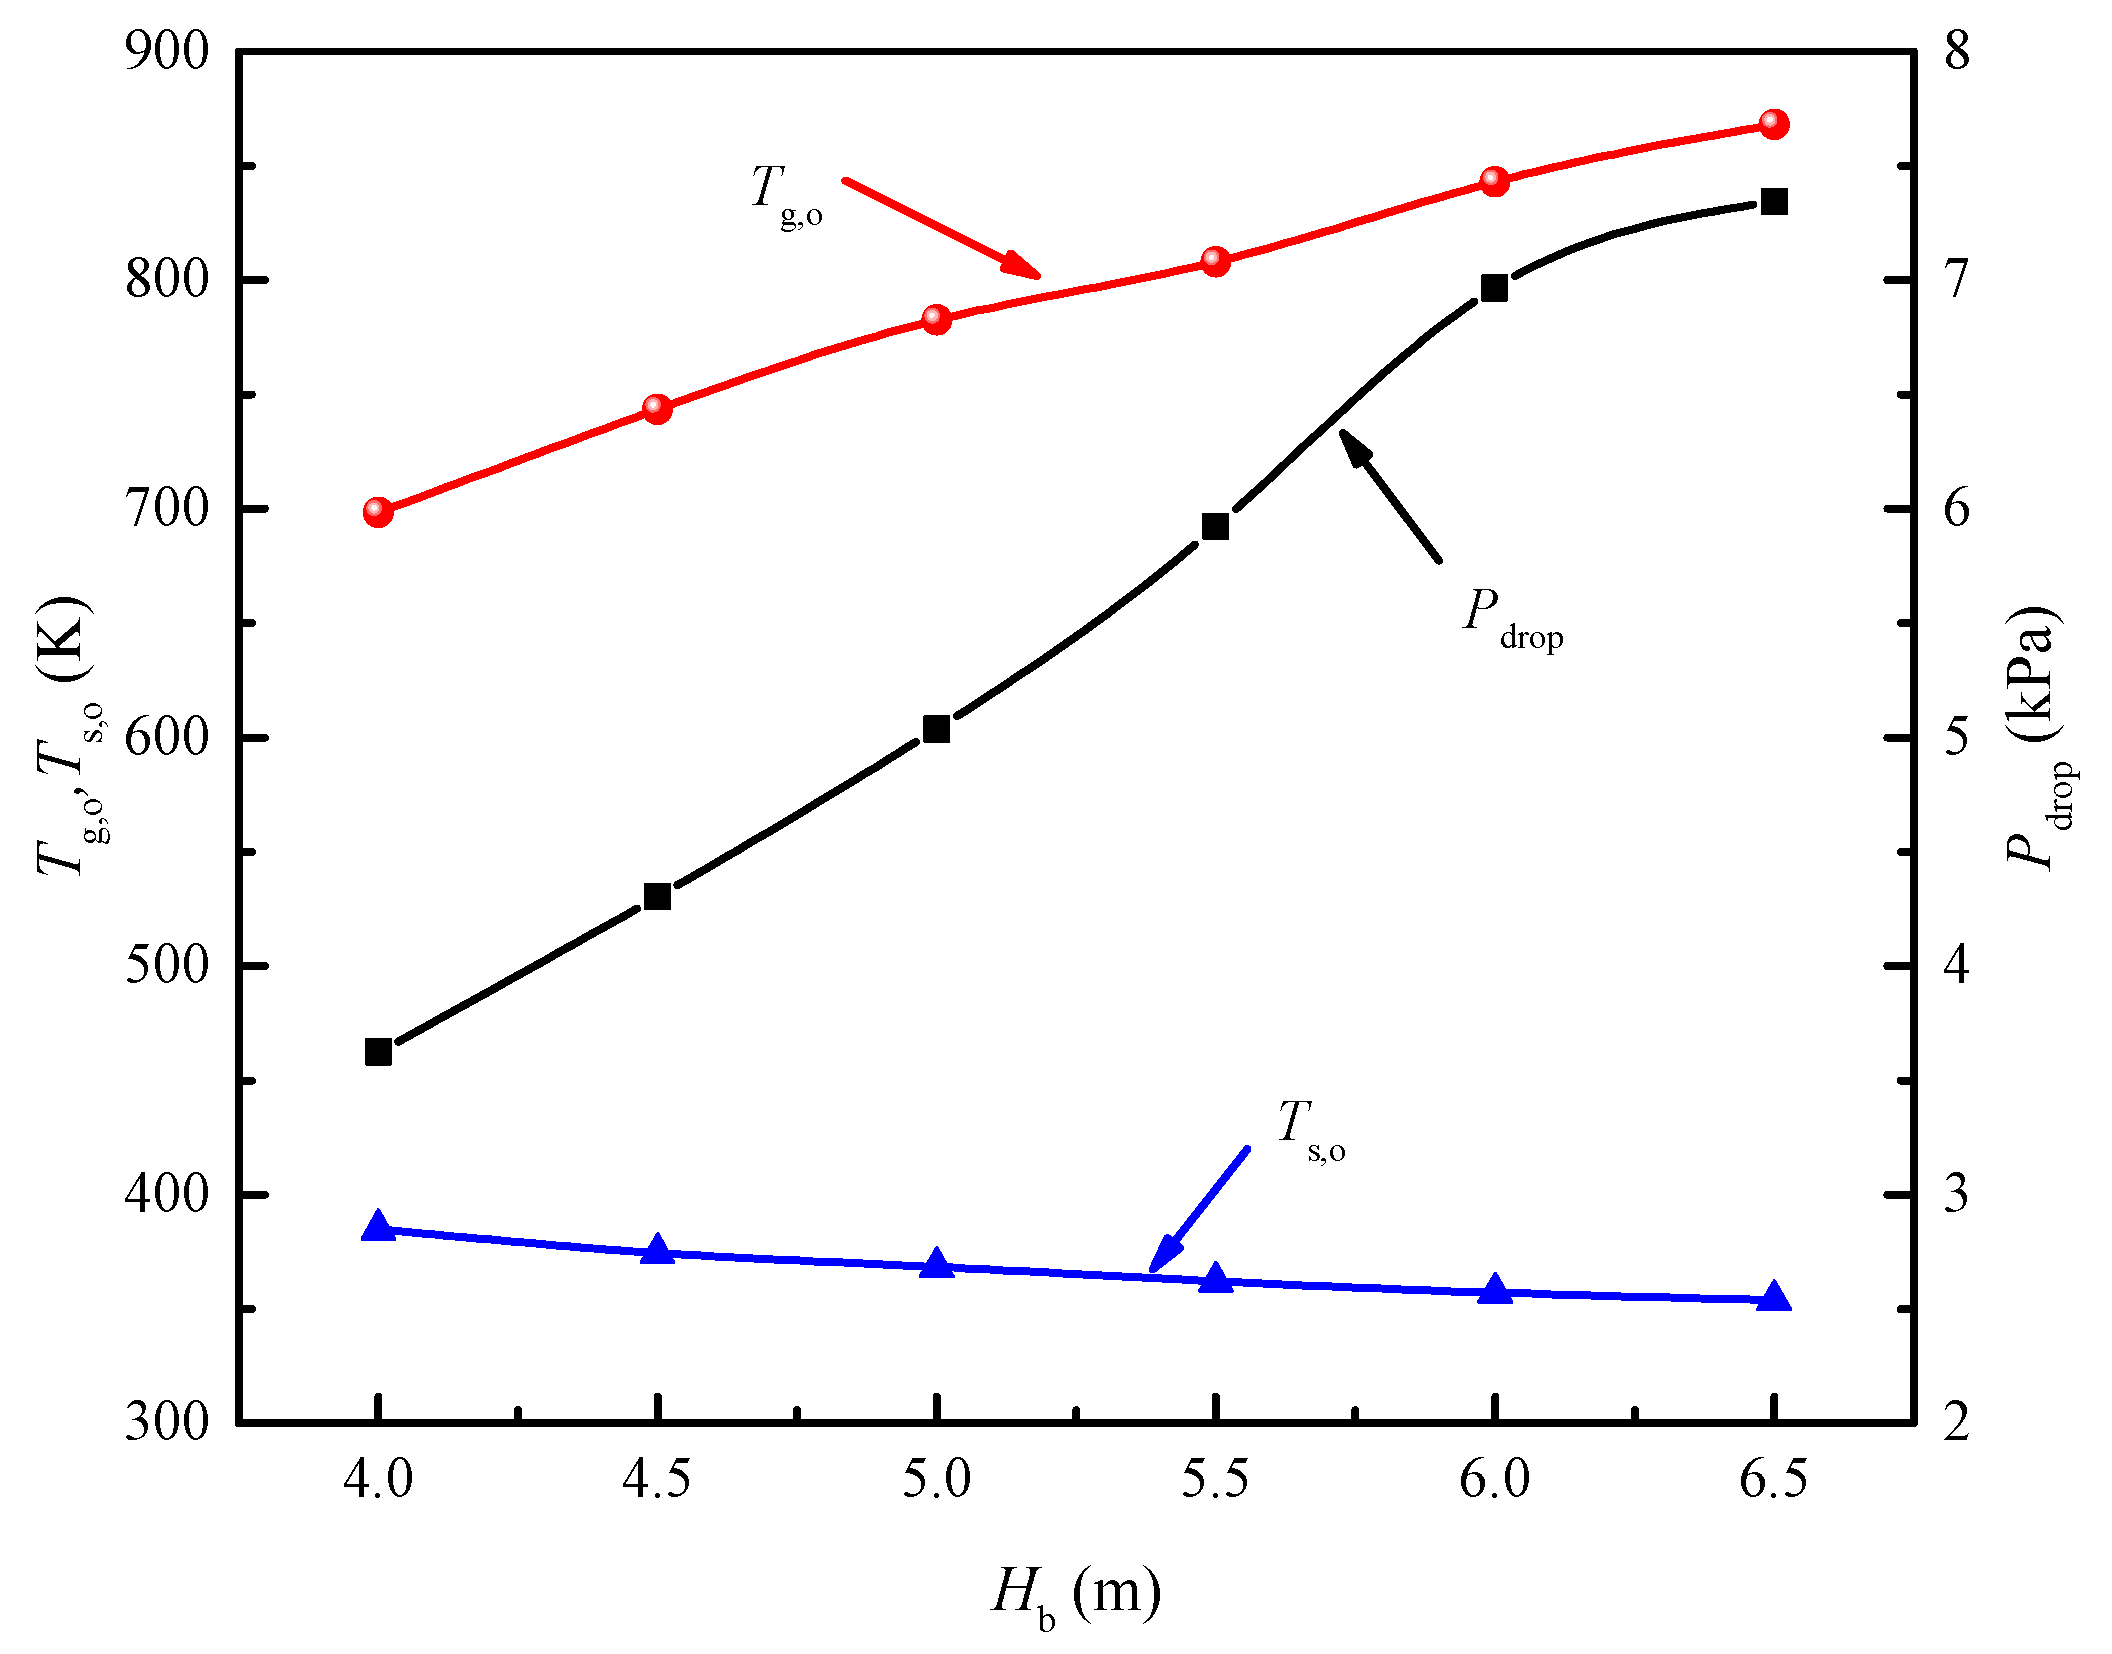
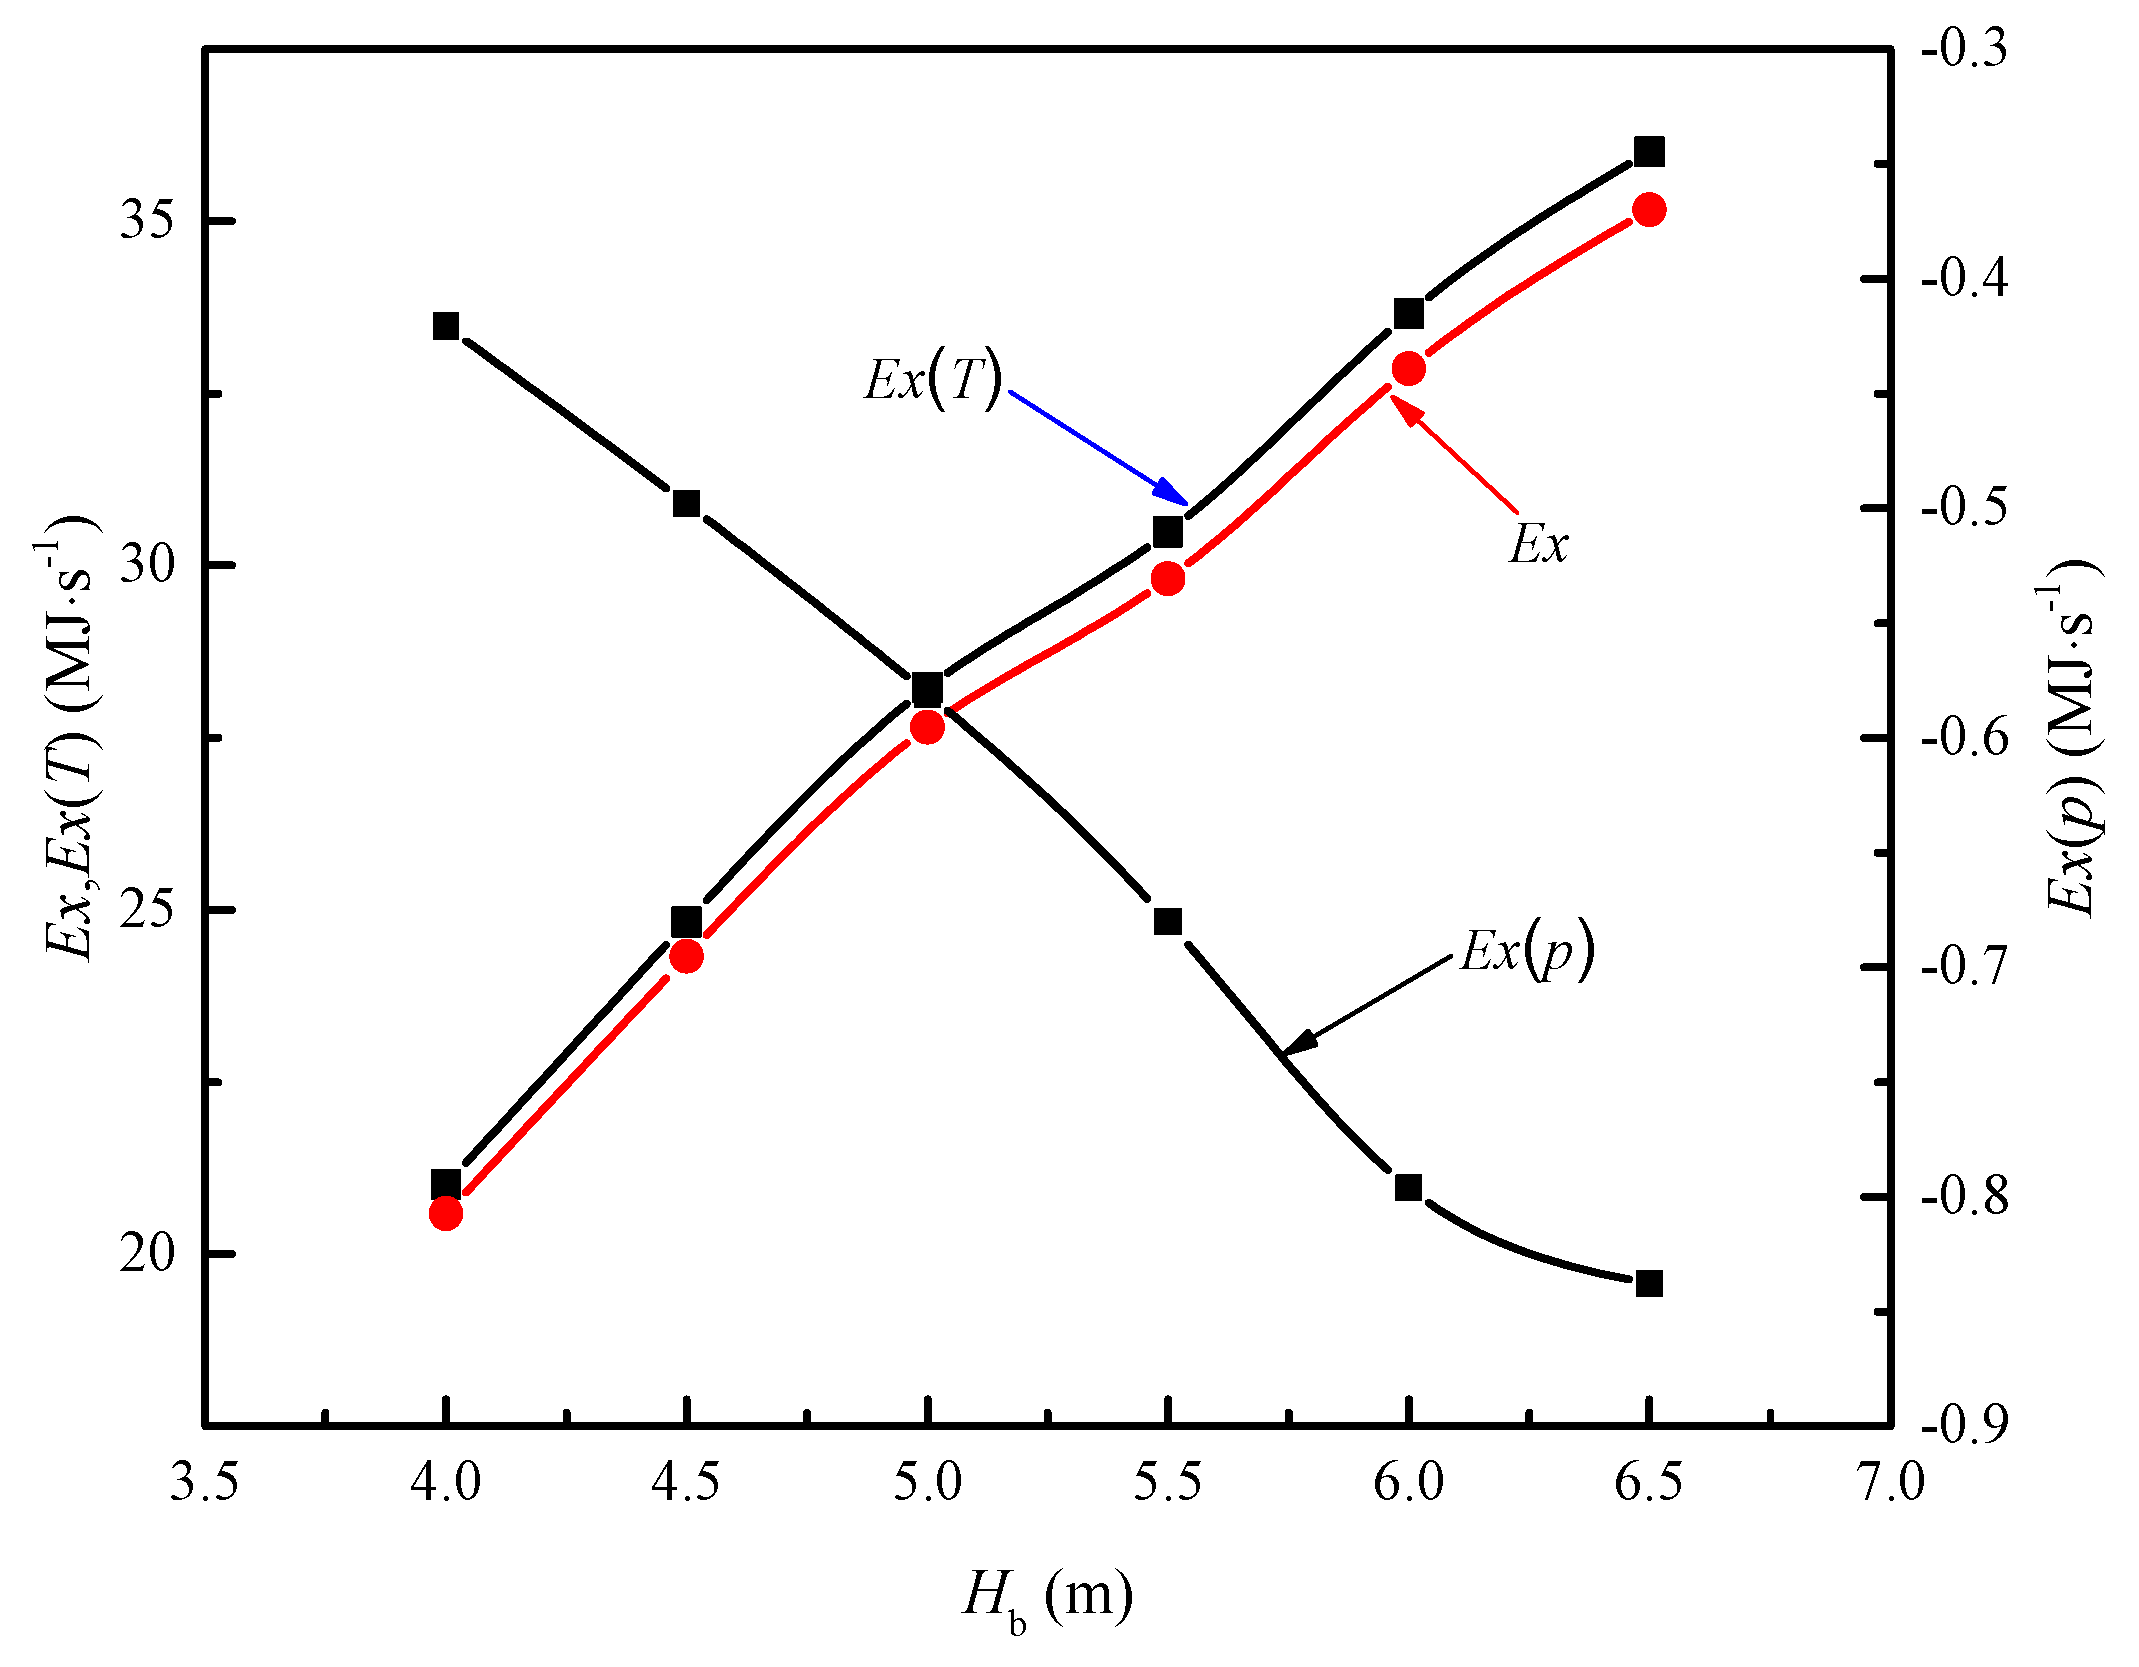
3.5. Effect of the Height of the Sinter Bed
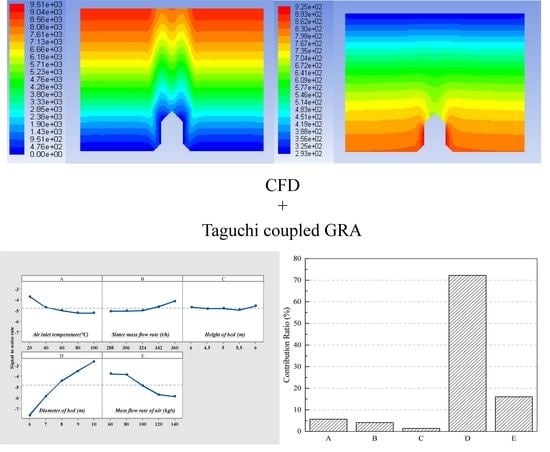
3.6. Optimization Modeling Procedure
3.6.1. Taguchi Method and ANOVA
3.6.2. Analysis of Variance (ANOVA)
3.7. The Multi-Object Optimization Method
3.7.1. Grey Relational Analysis (GRA)
3.7.2. Confirmation Test
4. Conclusions
Author Contributions
Funding
Conflicts of Interest
Nomenclature
| ρ | Air density (kg/m3) |
| u | Velocity vector (-) |
| p | Air pressure (Pa) |
| μ | Dynamic viscosity (kg/m·s) |
| u | Superficial velocity (m/s) |
| k | Turbulent kinetic energy (m2/s2) |
| ε | Turbulent energy dissipation rate (1/s) |
| 1/α | Coefficient of viscous resistance (-) |
| C2 | Coefficient of inertial resistance (-) |
| φ | Porosity (-) |
| dpSM | Sauter mean diameter (mm) |
| c | Specific heat (J/(kg·K)) |
| λ | Thermal conductivity (W/(m·K)) |
| T | Temperature (K) |
| h | Area heat transfer coefficient (W/(m2·K)) |
| hv | Volume heat transfer coefficient (W/(m3·K)) |
| CF | Correction factor (-) |
| yi | Factor in the ith case (-) |
| m | Total number of cases (-) |
| SSfactor | Total square of a single factor (-) |
| N | Number of levels of a factor (-) |
| SST | Sum of squares of factor (-) |
| SSe | Total square of error (-) |
| SSA | Sum square of factor (-) |
| ffactor | Degree of freedom of factor (-) |
| Ffactor | Variance ratio (-) |
| Vfactor | Sum square of a single factor (-) |
| Verror | Sum error of a single factor (-) |
| Subscripts | |
| f | fluid |
| s | solid |
| T | total |
| e | error |
| i | level |
| factor | Parameter of interest |
References
- Liu, Z.C.; Feng, Y.H.; Zhang, X.X.; Xu, L.; Yu, Z.D. Numerical and experimental study on coke size distribution in bell-type charging in the CDQ shaft. Int. J. Min. Met. Mater. 2008, 15, 236–240. [Google Scholar] [CrossRef]
- Altohamy, A.A.; Elsemary, I.M.M.; Abdo, S.; Abodelrahman, M.A.; Attia, A.A.; Sakr, R.Y. Encapsulation surface roughness effect on the performance of cool storage systems. J. Energy Storage 2020, 28, 101279. [Google Scholar] [CrossRef]
- Chiu, C.C.; Tsai, T.Y.; Tai, N.H.; Lee, C.Y. Synthesis of ultra long vertically aligned carbon nanotubes using the rapid heating and cooling system in the thermal chemical vapor deposition process. Surf. Coat. Technol. 2006, 200, 3215–3219. [Google Scholar] [CrossRef]
- Ghafori, H. Computational fluid dynamics (CFD) analysis of pipeline in the food pellets cooling system. J. Stored Prod. Res. 2020, 87, 101581. [Google Scholar] [CrossRef]
- Liu, Y.; Yang, J.; Wang, J.; Cheng, Z.L.; Wang, Q.W. Energy and exergy analysis for waste heat cascade utilization in sinter cooling bed. Energy 2014, 67, 370–380. [Google Scholar] [CrossRef]
- Cai, J.J.; Dong, H. Method and Device of Sinter Waste Heat Recovery and Utilization with Vertical Tank. Chinese Patent 200910187381.8, 1 May 2011. (In Chinese). [Google Scholar]
- Liu, Y.; Yang, J.; Wang, J.Y.; Ding, X.G.; Cheng, Z.L.; Wang, Q.W. Prediction, parametric analysis and bi-objective optimization of waste heat utilization in sinter cooling bed using evolutionary algorithm. Energy 2015, 90, 24–35. [Google Scholar] [CrossRef]
- Feng, H.; Chen, L.; Liu, X.; Xie, Z.; Sun, F. Constructural optimization of a sinter cooling process based on exergy output maximization. Appl. Therm. Eng. 2016, 96, 161–166. [Google Scholar] [CrossRef]
- Feng, J.S.; Zhang, S.; Dong, H.; Pei, G. Effect of gas inlet parameters on exergy transfer performance of sinter cooling process in vertical moving bed. Appl. Therm. Eng. 2019, 152, 126–134. [Google Scholar] [CrossRef]
- Zheng, Y.; Cai, J.J.; Dong, H.; Feng, J.S. Experimental investigation of volumetric exergy transfer coefficient in vertical moving bed for sinter waste heat recovery. Appl. Therm. Eng. 2019, 167, 428–439. [Google Scholar] [CrossRef]
- Zheng, Y.; Dong, H.; Cai, J.J.; Feng, J.S.; Zhang, S. Experimental investigation of volumetric heat transfer coefficient in vertical moving-bed for sinter waste heat recovery. Appl. Therm. Eng. 2019, 151, 335–343. [Google Scholar] [CrossRef]
- Pan, L.S.; Wei, X.Y.; Peng, Y.; Ma, Y.J.; Li, B. Theoretical study on the cooling procedure for vertical flow sinter. Appl. Therm. Eng. 2017, 127, 592–601. [Google Scholar] [CrossRef]
- Feng, J.S.; Dong, H.; Gao, J.Y.; Liu, Y.J.; Liang, K. Experimental study of gas-solid overall heat transfer coefficient in vertical tank for sinter waste heat recovery. Appl. Therm. Eng. 2016, 95, 136–142. [Google Scholar] [CrossRef]
- Zhang, S.; Zhao, L.; Feng, J.S.; Luo, X.F.; Dong, H. Thermal analysis of sinter vertical cooler based on waste heat recovery. Appl. Therm. Eng. 2019, 157, 113708. [Google Scholar] [CrossRef]
- Feng, J.S.; Dong, H.; Gao, J.Y.; Li, H.Z.; Liu, Y.J. Numerical investigation of gas-solid heat transfer process in vertical tank for sinter waste heat recovery. Appl. Therm. Eng. 2016, 107, 135–143. [Google Scholar] [CrossRef]
- Pan, L.S.; Wei, X.L.; Peng, Y.; Shi, X.B.; Liu, H.L. Experimental study on convection heat transfer and air drag in sinter layer. J. Cent. South. Univ. 2015, 22, 2841–2848. [Google Scholar] [CrossRef]
- Feng, J.S.; Dong, H.; Dong, H.D. Modification of Ergun’s correlation in vertical tank for sinter waste heat recovery. Powder Technol. 2015, 280, 89–93. [Google Scholar] [CrossRef]
- Tian, F.Y.; Huang, L.F.; Fan, L.W. Pressure drop in a packed bed with sintered ore particles as applied to sinter coolers with a novel vertically arranged design for waste heat recovery. J. Zhejiang Univ.-Sci. A 2016, 17, 89–100. [Google Scholar] [CrossRef]
- Prusty, J.K.; Pradhan, B. Multi-response optimization using Taguchi-Grey relational analysis for composition of fly ash-ground granulated blast furnace slag based geopolymer concrete. Constr. Build. Mater. 2020, 241, 118049. [Google Scholar] [CrossRef]
- Liu, D.H.; Li, J.H.; Peng, Y.; Zhang, J.L.; Wang, G.W.; Xue, X. Comprehensive evaluation of sintering basic characteristics of iron ore based on grey relational analysis. J. Iron Steel Res. Int. 2019, 26, 691–696. [Google Scholar] [CrossRef]
- Chamoli, S.; Yu, P.; Kumar, A. Multi-response optimization of geometric and flow parameters in a heat exchanger tube with perforated disk inserts by Taguchi grey relational analysis. Appl. Therm. Eng. 2016, 103, 1339–1350. [Google Scholar] [CrossRef]
- Bademlioglu, A.H.; Canbolat, A.S.; Kaynakli, O. Multi-objective optimization of parameters affecting Organic Rankine Cycle performance characteristics with Taguchi-Grey Relational Analysis. Renew. Sustain. Energy Rev. 2020, 117, 109483. [Google Scholar] [CrossRef]
- Canbolat, A.S.; Bademlioglu, A.H.; Arslanoglu, N.; Kaynali, P. Performance optimization of absorption refrigeration systems using Taguchi, ANOVA and Grey Relational Analysis method. J. Clean. Prod. 2019, 229, 874–885. [Google Scholar] [CrossRef]
- Deepthi, Y.P.; Krishna, M.; Saramah, P. Optimization of electroless copper coating parameters on graphite particles using Taguchi and grey relational analysis. Mater. Today Proc. 2018, 5, 12077–12082. [Google Scholar] [CrossRef]
- Erdinc, A.; Kelestemur, O. Optimization of mortars containing steel scale using Taguchi based grey relational analysis method. Constr. Build. Mater. 2019, 214, 232–241. [Google Scholar]
- Nelabhotla, D.M.; Jayaraman, T.V.; Asghar, K.; Das, D. The optimization of chemical mechanical planarization process-parameters of c-plane gallium-nitride using Taguchi method and grey relational analysis. Mater. Des. 2016, 104, 392–403. [Google Scholar] [CrossRef]
- Celik, N.; Pusat, G.; Turgut, E. Application of Taguchi method and grey relational analysis on a turbulated heat exchanger. Int. J. Therm. Sci. 2018, 124, 85–97. [Google Scholar] [CrossRef]
- Kumbhar, D.G.; Sane, N.K. Numerical analysis and optimization of heat transfer and friction factor in dimpled tube assisted with regularly spaced twisted tapes using Taguchi and grey relational analysis. Proc. Eng. 2015, 127, 652–659. [Google Scholar] [CrossRef][Green Version]
- Acir, A.; Canli, M.E.; Ata, I.; Cakiroglu, R. Parametric optimization of energy and exergy analyses of a novel solar air heater with grey relational analysis. Appl. Therm. Eng. 2017, 122, 330–338. [Google Scholar] [CrossRef]
- Kuo, C.F.; Su, T.L.; Jhang, P.R.; Huang, C.Y.; Chiu, C.H. Using the Taguchi method and grey relational analysis to optimize the flat-plate collector process with multiple quality characteristics in solar energy collector manufacturing. Energy 2011, 36, 3554–3562. [Google Scholar]
- Gunes, S.; Senyigit, E.; Karakaya, E.; Ozceyhan, V. Optimization of heat transfer and pressure drop in a tube with loose-fit perforated twisted tapes by Taguchi method and grey relational analysis. J. Therm. Anal. Calorim. 2019, 136, 1795–1806. [Google Scholar] [CrossRef]
- Feng, J.S.; Zhang, S.; Dong, H.; Pei, G. Parameter study of sinter waste heat recovery in vertical tank based on energy and exergy analysis. J. Iron Steel Res. Int. 2020, 27, 22–32. [Google Scholar] [CrossRef]
- Lau, C.S.; Abdullah, M.Z.; Ani, F.C. Optimization modeling of the cooling stage of reflow soldering process for ball grid array package using the grey-based Taguchi method. Microelectron. Reliab. 2012, 52, 1143–1152. [Google Scholar] [CrossRef]
- Taguchi, G. Taguchi Techniques for Quality Engineering; McGraw-Hill: New York, NY, USA, 1988. [Google Scholar]


| Researchers | Target Functions | Parameters | ||||
|---|---|---|---|---|---|---|
| Tg,in1 (°C) | Hb2 (m) | Ma3 (kg/s) | Db4 (m) | Ms5 (kg/s) | ||
| Feng et al. [15] | Exergy performance | 293–373 | 7 | 170–210 | 9 | 152 |
| Zhang et al. [14] | Exergy and energy consumption | 293 | 2 | 60–100 | 6–10 | 85–100 |
| Pan et al. [12] | Heat transfer and pressure drop | 293–473 | 2–5 | - | 8–11 | 83–139 |
| Feng et al. [15] | Heat transfer process analysis | 293 | 5–8 | 170 | 7–10 | 150–180 |
| Feng et al. [32] | Energy and exergy analysis | 293–373 | 5–9 | 160–200 | 6–10 | - |
| Parameters | Unit | Value |
|---|---|---|
| Air dynamic viscosity [15] | kg·m−1·s−1 | 1.711 × 10⁻⁵ × (Tair/273)1.5 × (273 + 122)/(Tair + 122) |
| Air density [15] | kg·m−3 | 1.01325 × 10⁵/(289 × Tair) |
| Air specific heat [15] | J·kg−1·K−1 | 103 × (28.11 + 0.1967 × 10 − 2Tair + 0.4802 × 10 − 5 Tair2 + 1.996 × 10 − 9 Tair3)/28.97 |
| Air conductivity [15] | W·m−1·K−1 | 2.72 × 10⁻⁴ Tair0.8 |
| Sinter specific heat [9] | J·kg−1·K−1 | 337.03 Ts0.152 |
| Sinter ore density [14] | kg·m−3 | 2800 |
| Case | Mesh Element | Air Outlet Temperature (K) | Error (%) | Sinter Outlet Temperature (K) | Error (%) | Pressure Drop (Pa) | Error (%) |
|---|---|---|---|---|---|---|---|
| 1 | 19,232 | 758.60 | - | 339.70 | - | 9763.12 | – |
| 2 | 42,938 | 758.74 | 0.020 | 339.72 | 0.006 | 9756.59 | −0.067 |
| 3 | 91,242 | 758.60 | −0.020 | 339.58 | −0.041 | 9751.69 | −0.050 |
| 4 | 172,872 | 758.58 | −0.003 | 339.58 | 0 | 9751.74 | 0 |
| 5 | 399,722 | 758.56 | −0.003 | 339.52 | −0.018 | 9750.80 | −0.001 |
| Case | Tg,in (°C) | Ma (m3·h−1) | Ts,in (°C) | Ms (t·h−1) | Pressure Drop (Pa) | Air Outlet Temperature (°C) | ||||
|---|---|---|---|---|---|---|---|---|---|---|
| Experimental Results (Pa) | Simulation Results (Pa) | Error (%) | Experimental Results (°C) | Simulation Results (°C) | Error (%) | |||||
| 1 | 20 | 1024 | 550 | 1.2 | 632.6 | 648.06 | 2.44 | 344.7 | 357.56 | 3.73 |
| 2 | 20 | 1204 | 600 | 1.3 | 850.7 | 852.33 | 0.2 | 359.7 | 347.42 | −3.42 |
| 3 | 20 | 1355 | 600 | 1.2 | 1111.5 | 1004.43 | −9.63 | 298.7 | 312.79 | 4.72 |
| 4 | 20 | 1144 | 550 | 1.2 | 796.2 | 763.53 | −4.10 | 309.5 | 328.30 | 6.07 |
| 5 | 20 | 1084 | 580 | 1.0 | 716.2 | 725.36 | 1.28 | 351.2 | 362.86 | 3.32 |
| Case | Experimental Results from the Study by Zhang et al. [14] (°C) | Results from the Simulation Reported in This Study (°C) | Error (%) |
|---|---|---|---|
| 1 | 479 | 489.9 | 2.28 |
| 2 | 543 | 549.9 | 1.27 |
| 3 | 582 | 596.6 | 2.51 |
| 4 | 505 | 529.2 | 4.79 |
| 5 | 478 | 498.6 | 4.31 |
| 6 | 556 | 549.4 | −1.19 |
| 7 | 463 | 476 | 2.80 |
| 8 | 500 | 519.6 | 3.92 |
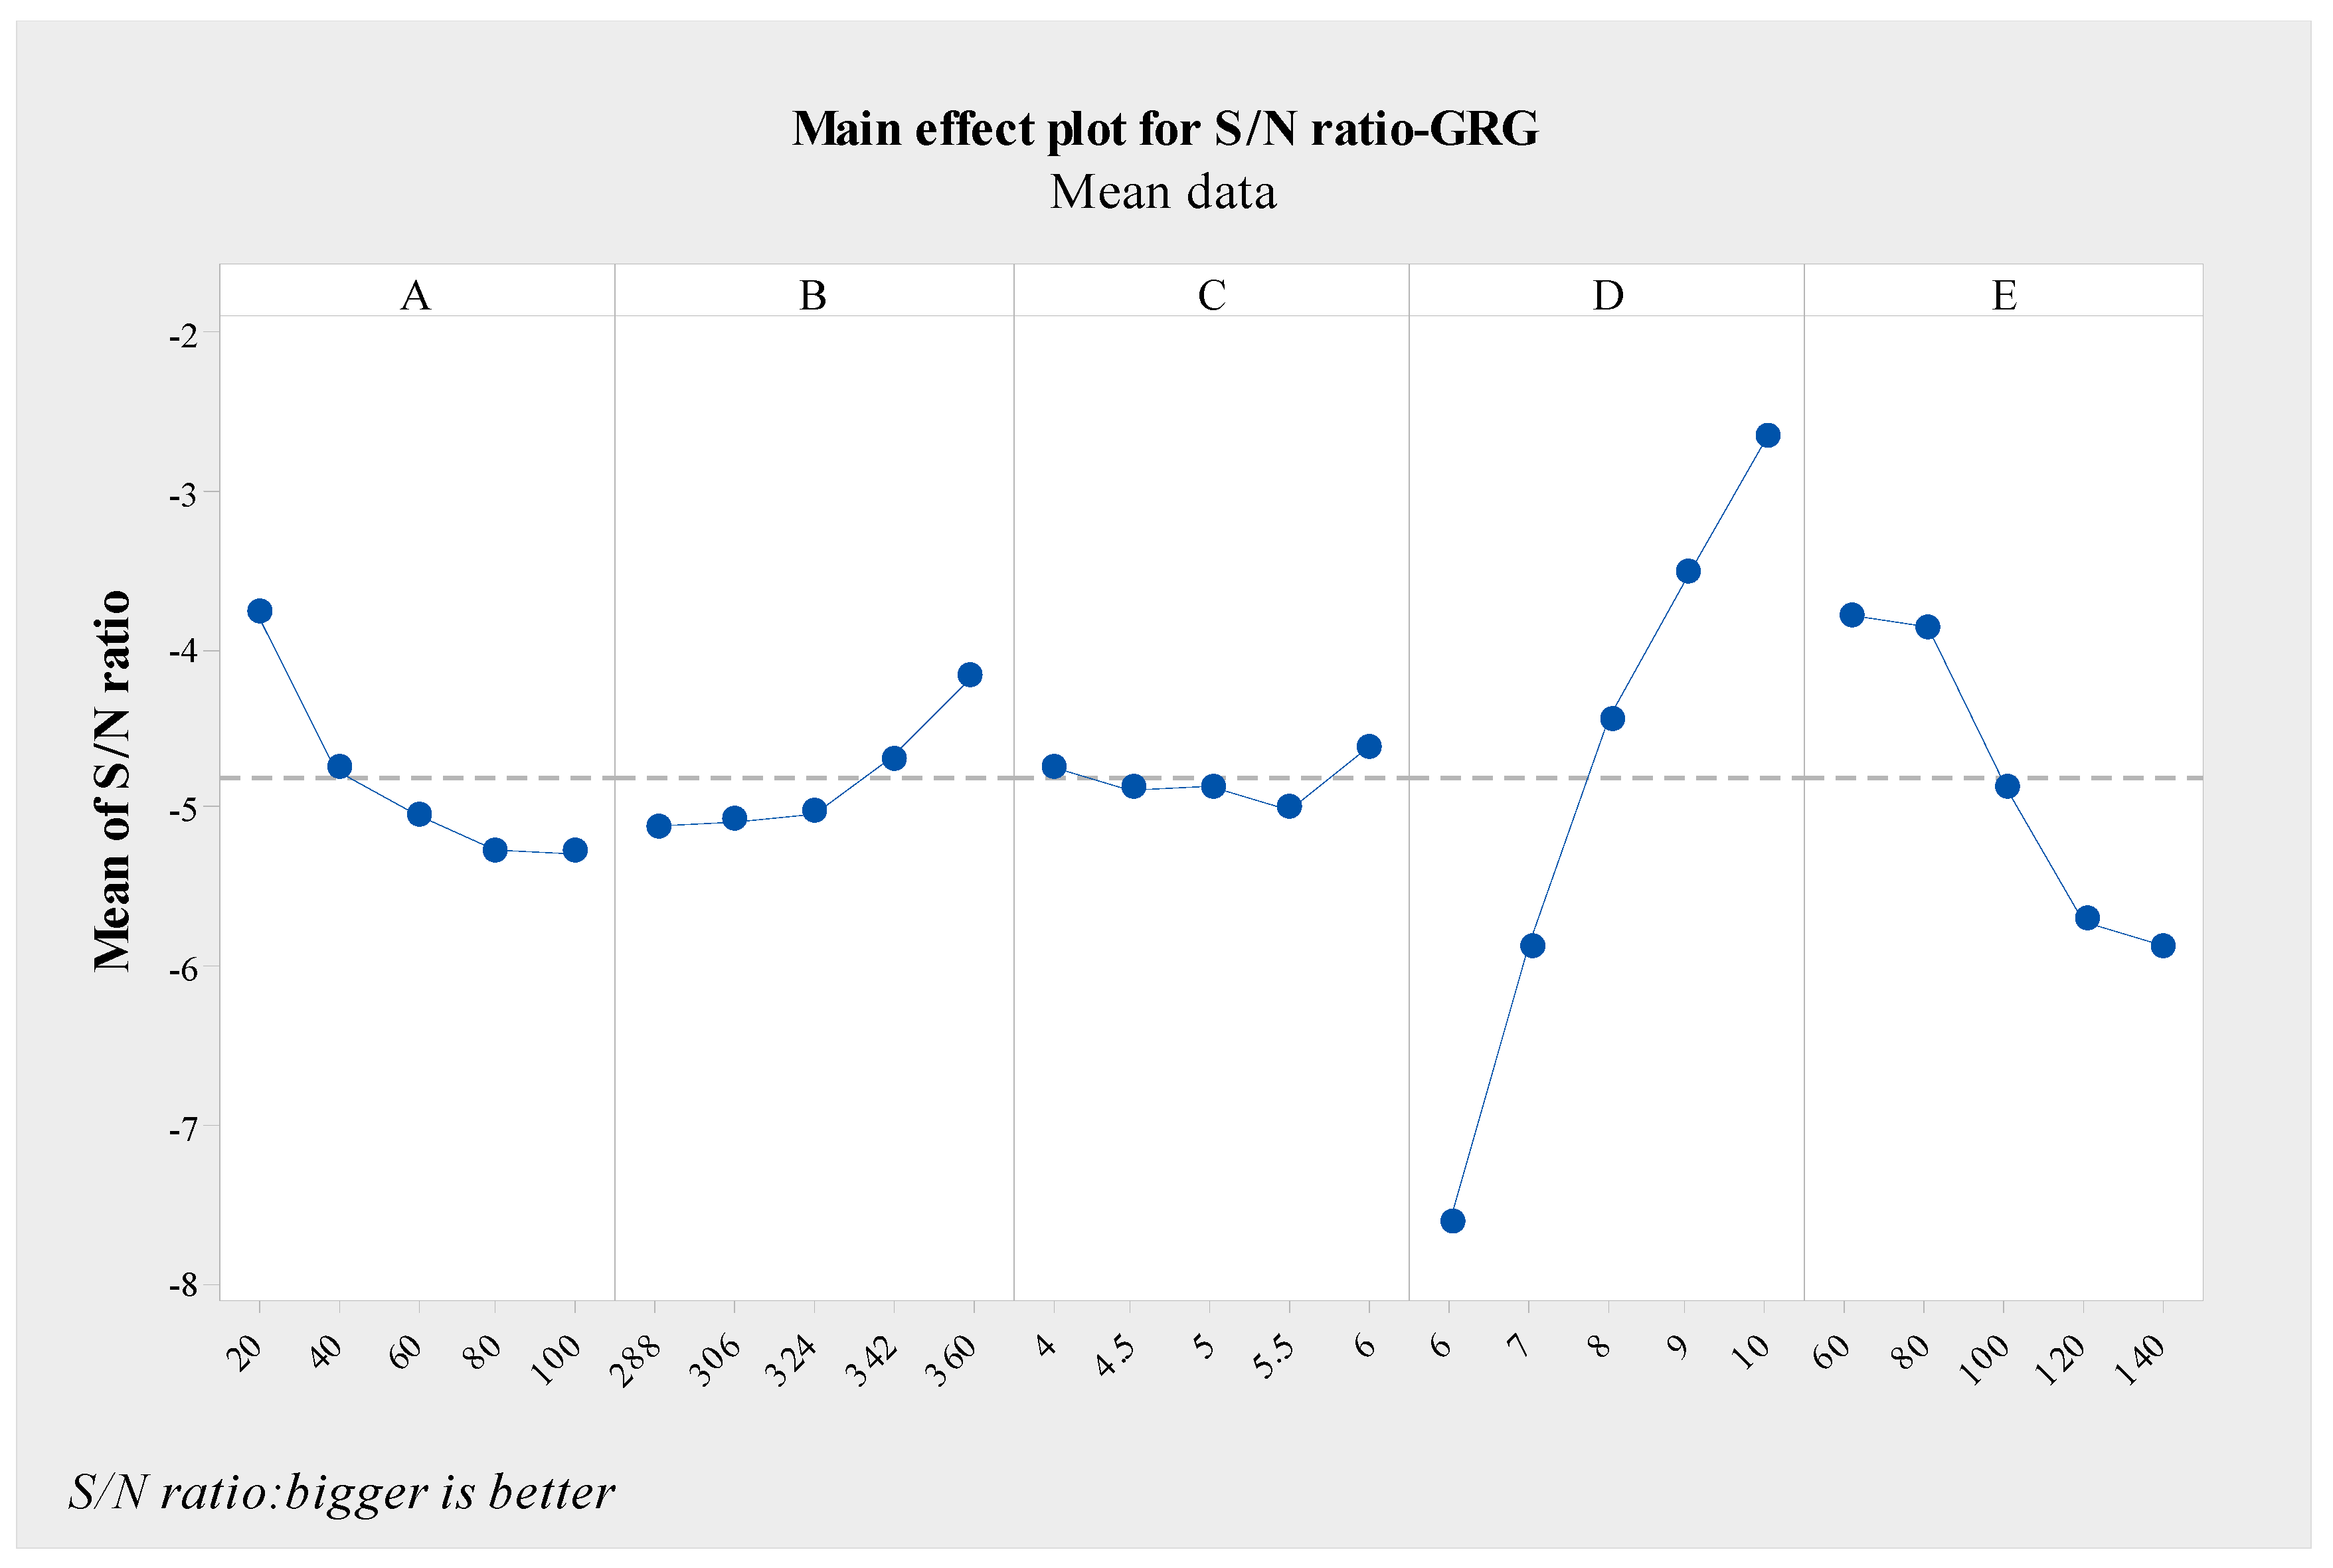
| Label | Factor | Level 1 | Level 2 | Level 3 | Level 4 | Level 5 |
|---|---|---|---|---|---|---|
| A | Air inlet temperature, Tg,in (°C) | 20 | 40 | 60 | 80 | 100 |
| B | Sinter mass flow rate, ms (kg·h−1) | 288 | 306 | 324 | 342 | 360 |
| C | Height of the sinter bed, Hb (m) | 4 | 4.5 | 5 | 5.5 | 6 |
| D | Diameter of the sinter bed, Db (m) | 6 | 7 | 8 | 9 | 10 |
| E | Air mass flow rate, Ma (kg∙h−1) | 60 | 80 | 100 | 120 | 140 |
| Parameters | |||||||||
|---|---|---|---|---|---|---|---|---|---|
| A | B | C | D | E | Results | S/N Ratio | |||
| Case | Levels | Pdrop (Pa) | Ex (MJ/s) | Pdrop | Ex | ||||
| 1 | 1 | 1 | 1 | 1 | 1 | 8755.5 | 6.5482 | −78.8456 | 16.3225 |
| 2 | 1 | 2 | 2 | 2 | 2 | 7441.4 | 12.5810 | −77.4331 | 21.9943 |
| 3 | 1 | 3 | 3 | 3 | 3 | 7693.6 | 18.8894 | −77.7226 | 25.5243 |
| 4 | 1 | 4 | 4 | 4 | 4 | 7820.4 | 21.9384 | −77.8645 | 26.8241 |
| 5 | 1 | 5 | 5 | 5 | 5 | 8328.9 | 31.9316 | −78.4118 | 30.0844 |
| 6 | 2 | 1 | 2 | 3 | 4 | 9293.0 | 11.8293 | −79.3632 | 21.4592 |
| 7 | 2 | 2 | 3 | 4 | 5 | 9628.7 | 18.7338 | −79.6713 | 25.4525 |
| 8 | 2 | 3 | 4 | 5 | 1 | 3533.0 | 19.0416 | −70.9629 | 25.5941 |
| 9 | 2 | 4 | 5 | 1 | 2 | 15,186.1 | 13.4019 | −83.6289 | 22.5433 |
| 10 | 2 | 5 | 1 | 2 | 3 | 8812.9 | 9.4028 | −78.9024 | 19.4651 |
| 11 | 3 | 1 | 3 | 5 | 2 | 3980.3 | 20.0077 | −71.9982 | 26.0239 |
| 12 | 3 | 2 | 4 | 1 | 3 | 20,088.1 | 8.5193 | −86.0588 | 18.6081 |
| 13 | 3 | 3 | 5 | 2 | 4 | 17,377.0 | 14.9978 | −84.7995 | 23.5206 |
| 14 | 3 | 4 | 1 | 3 | 5 | 10,244.7 | 7.8339 | −80.2100 | 17.8796 |
| 15 | 3 | 5 | 2 | 4 | 1 | 3673.5 | 19.0797 | −71.3017 | 25.6114 |
| 16 | 4 | 1 | 4 | 2 | 5 | 22,327.3 | 10.1193 | −86.9767 | 20.1030 |
| 17 | 4 | 2 | 5 | 3 | 1 | 6193.2 | 12.6987 | −75.8383 | 22.0752 |
| 18 | 4 | 3 | 1 | 4 | 2 | 4158.4 | 17.5610 | −72.3785 | 24.8910 |
| 19 | 4 | 4 | 2 | 5 | 3 | 4790.2 | 19.5364 | −73.6071 | 25.8169 |
| 20 | 4 | 5 | 3 | 1 | 4 | 23,299.2 | 5.9202 | −87.3468 | 15.4467 |
| 21 | 5 | 1 | 5 | 4 | 3 | 8939.5 | 17.5114 | −79.0263 | 24.8664 |
| 22 | 5 | 2 | 1 | 5 | 4 | 7036.6 | 12.0931 | −76.9473 | 21.6507 |
| 23 | 5 | 3 | 2 | 1 | 5 | 27,668.0 | 3.2545 | −88.8396 | 10.2497 |
| 24 | 5 | 4 | 3 | 2 | 1 | 7677.1 | 10.2764 | −77.7039 | 20.2368 |
| 25 | 5 | 5 | 4 | 3 | 2 | 6893.1 | 22.4590 | −76.7682 | 27.0278 |
| Level | A | B | C | D | E |
|---|---|---|---|---|---|
| 1 | 24.15 1 | 21.76 | 20.04 | 16.63 | 21.97 |
| 2 | 22.90 | 21.96 | 21.03 | 21.06 | 24.50 1 |
| 3 | 22.33 | 21.96 | 22.54 | 22.79 | 22.86 |
| 4 | 21.67 | 22.66 | 23.63 | 25.53 | 21.78 |
| 5 | 20.81 | 23.53 1 | 24.62 1 | 25.83 1 | 20.75 |
| Delta | 3.34 | 1.77 | 4.58 | 9.20 | 3.74 |
| ∑ Delta | 22.63 | ||||
| Weight | 48.71% |
| Level | A | B | C | D | E |
|---|---|---|---|---|---|
| 1 | −78.06 1 | −79.24 | −77.46 1 | −84.94 | −74.93 1 |
| 2 | −78.51 | −79.19 | −78.11 | −81.16 | −76.44 |
| 3 | −78.87 | −78.94 | −78.89 | −77.98 | −79.06 |
| 4 | −79.23 | −78.60 | −79.73 | −76.05 | −81.26 |
| 5 | −79.86 | −78.55 1 | −80.34 | −74.39 1 | −82.82 |
| Delta | 1.80 | 0.70 | 2.88 | 10.56 | 7.89 |
| ∑Delta | 23.83 | ||||
| Weight | 51.29% |
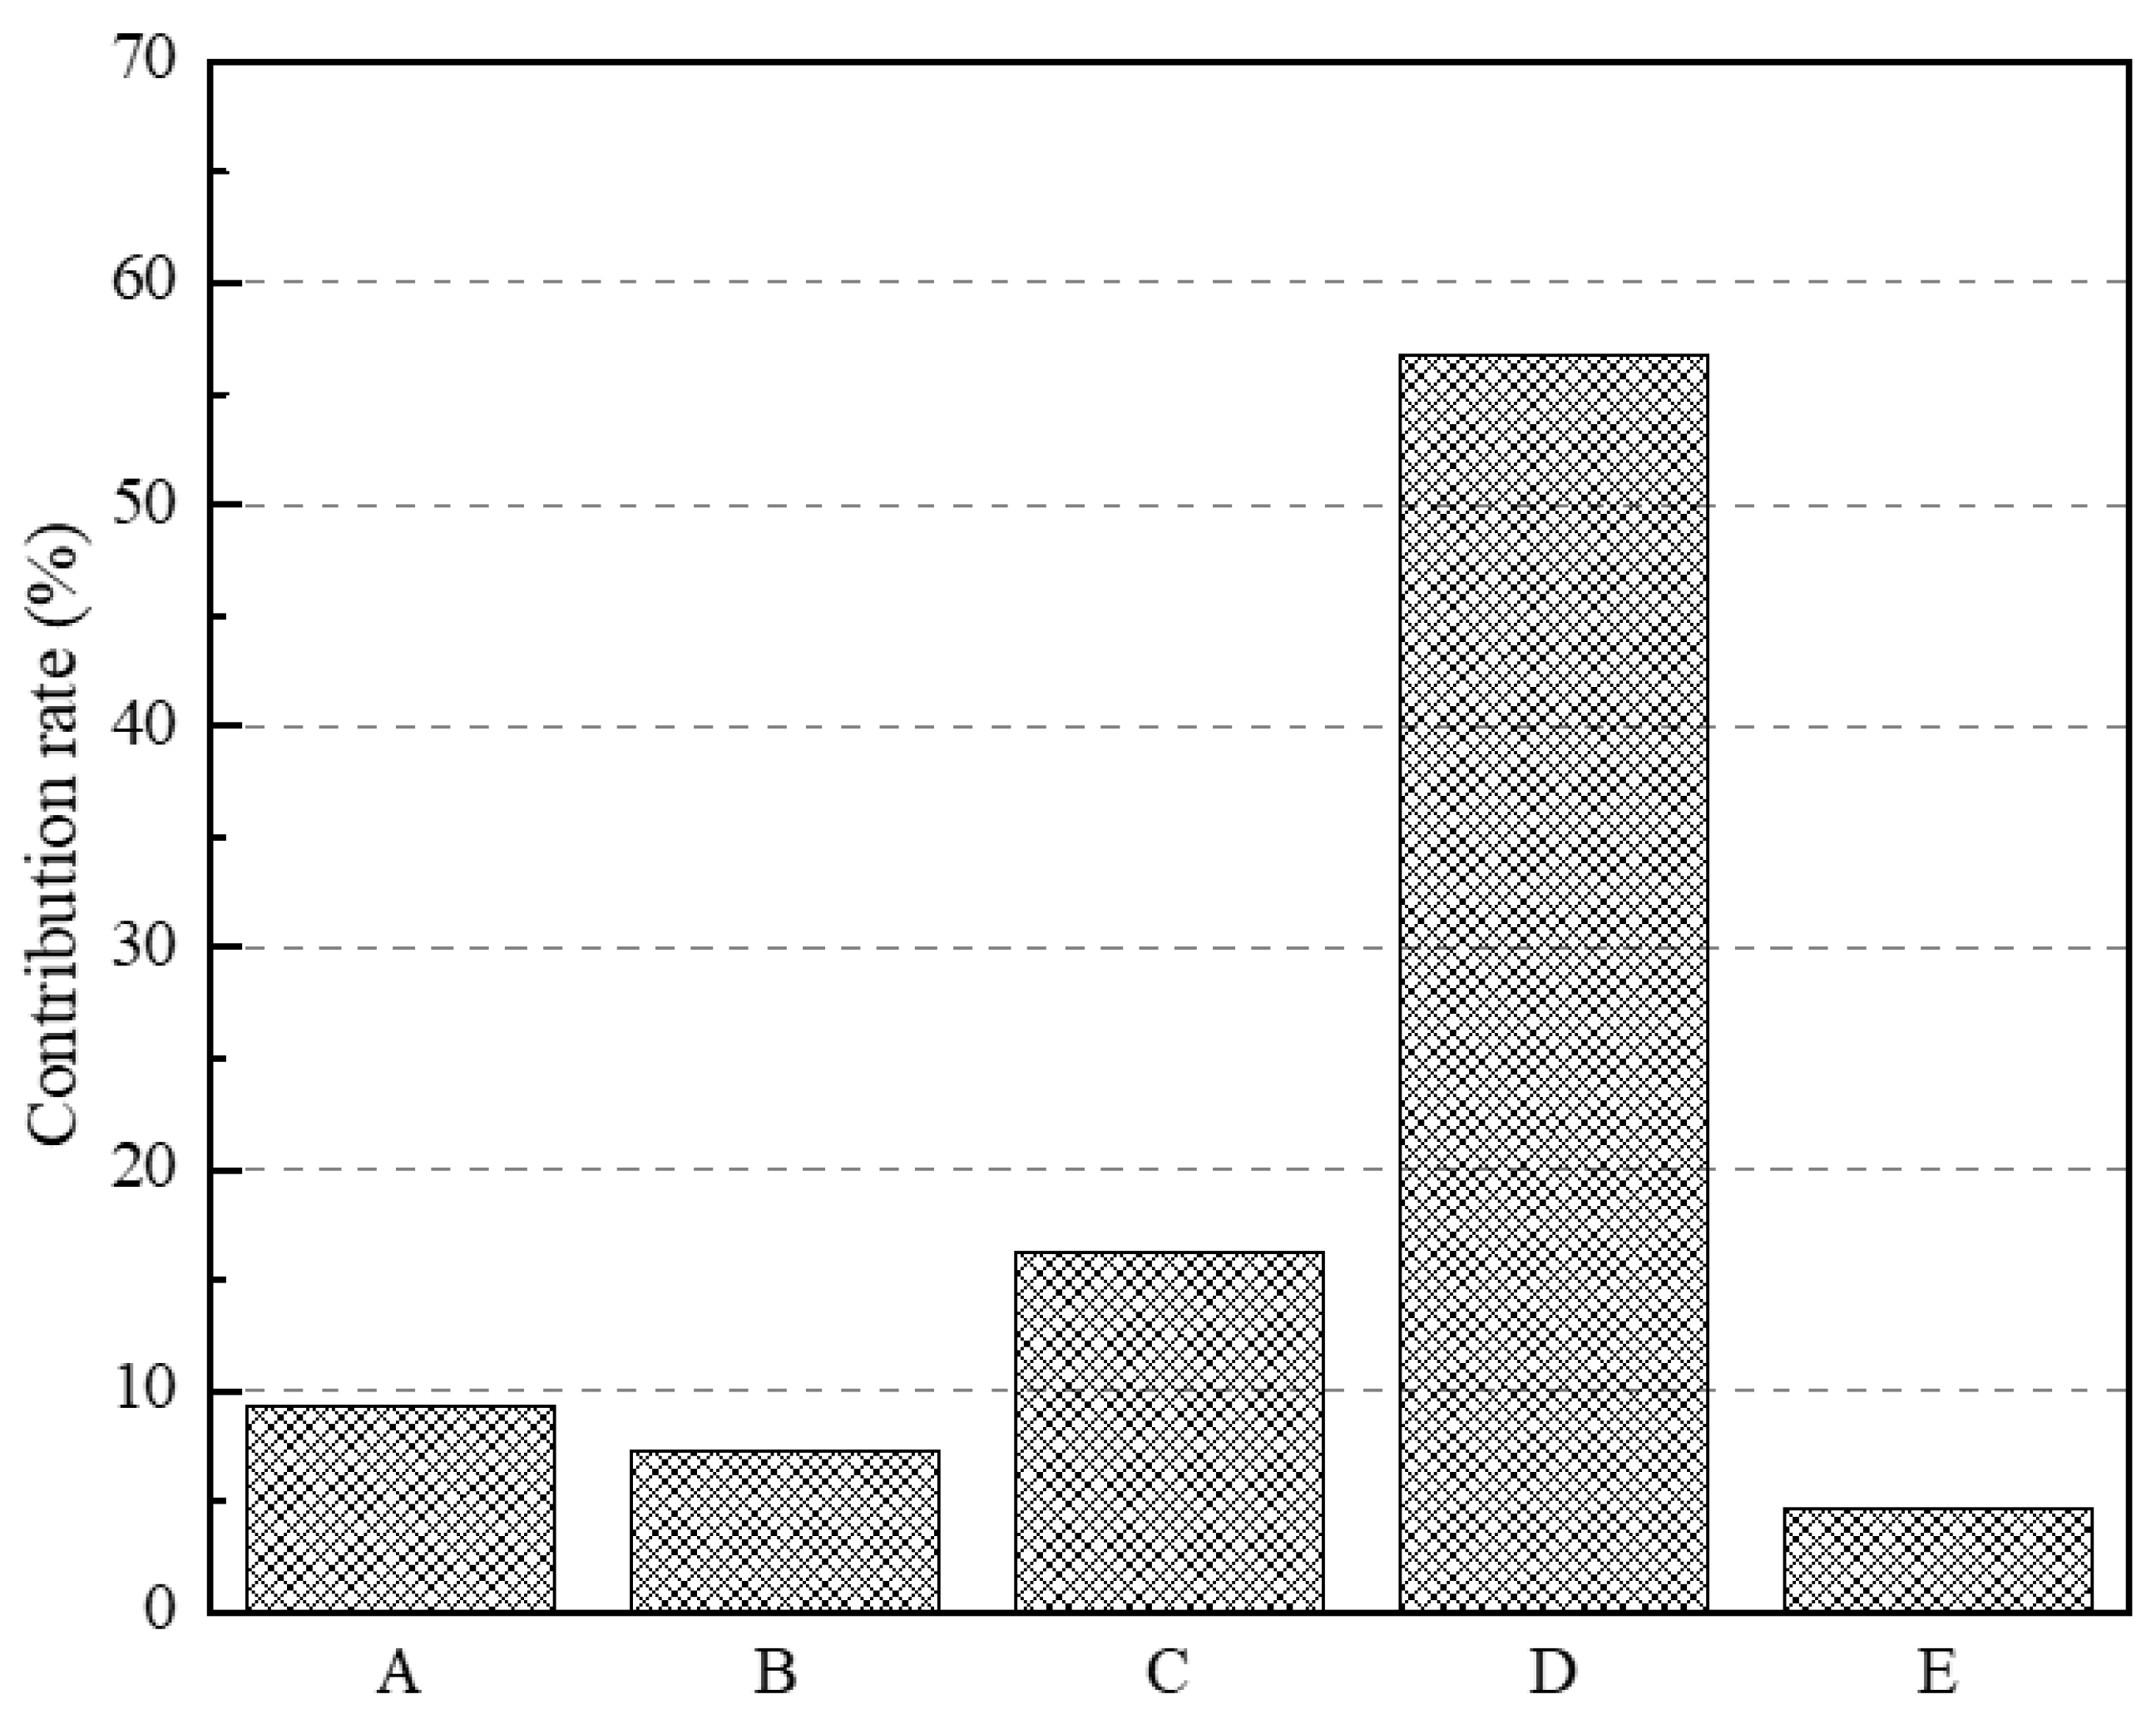
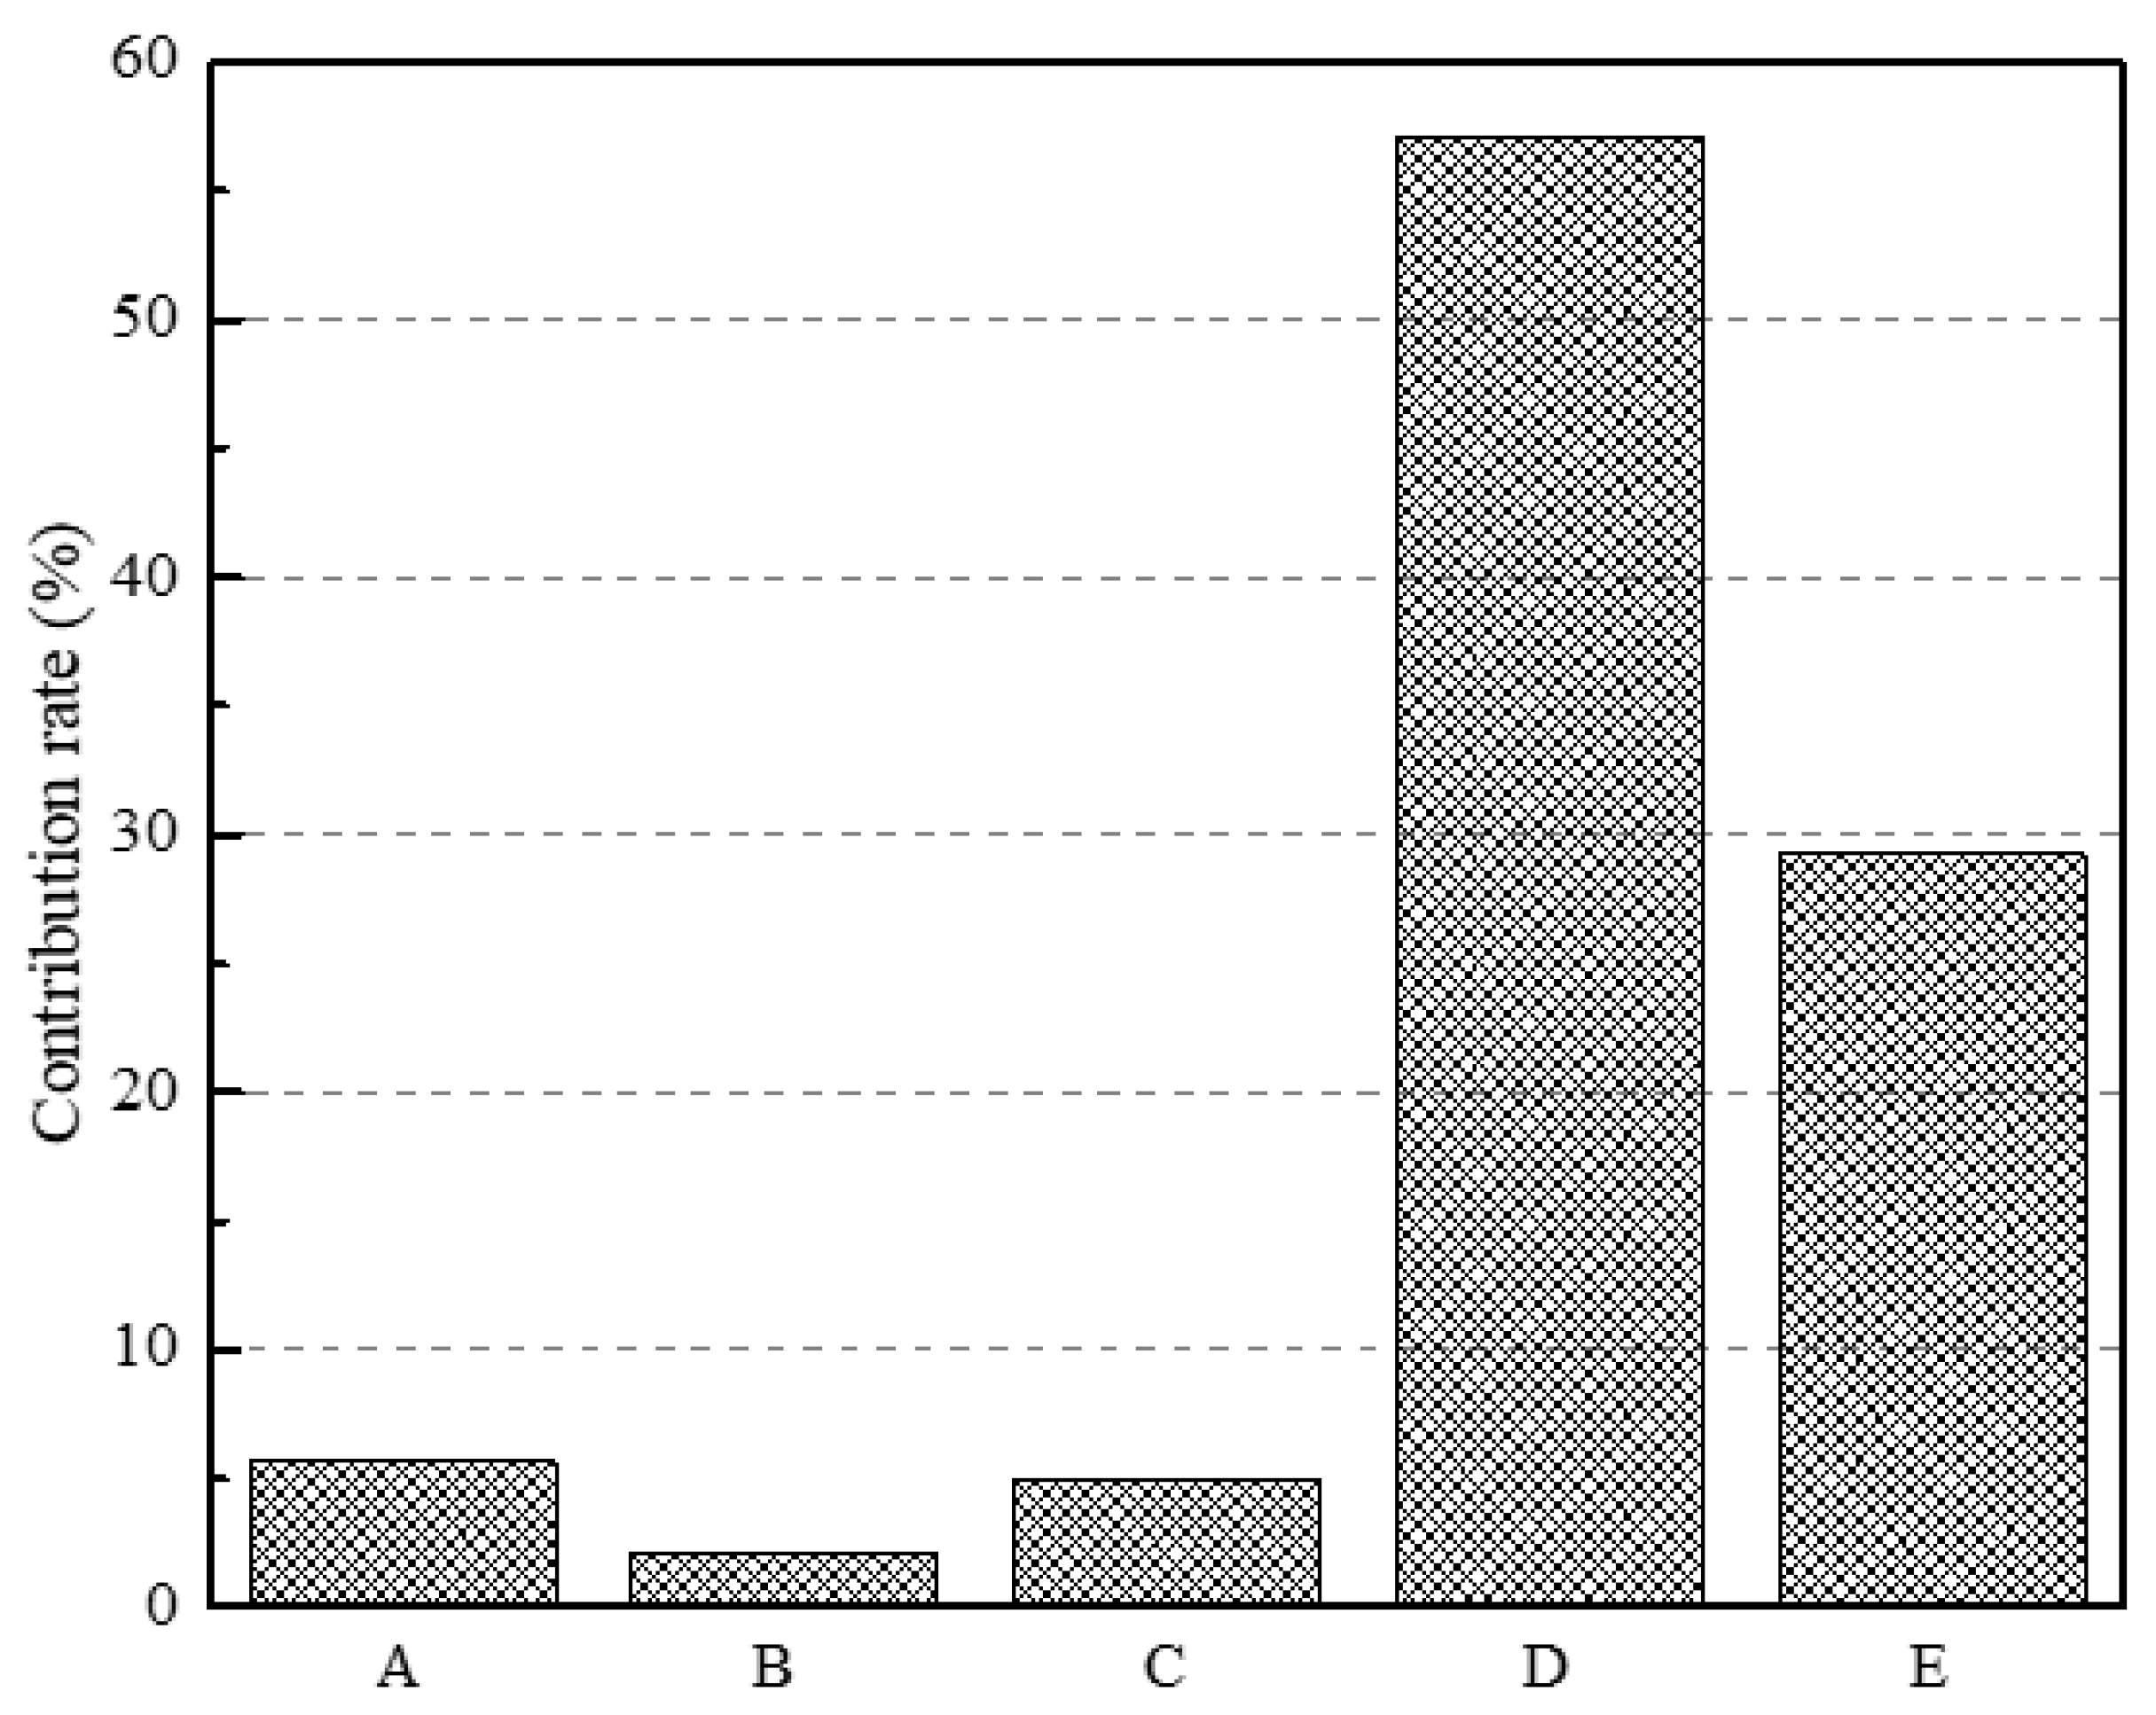
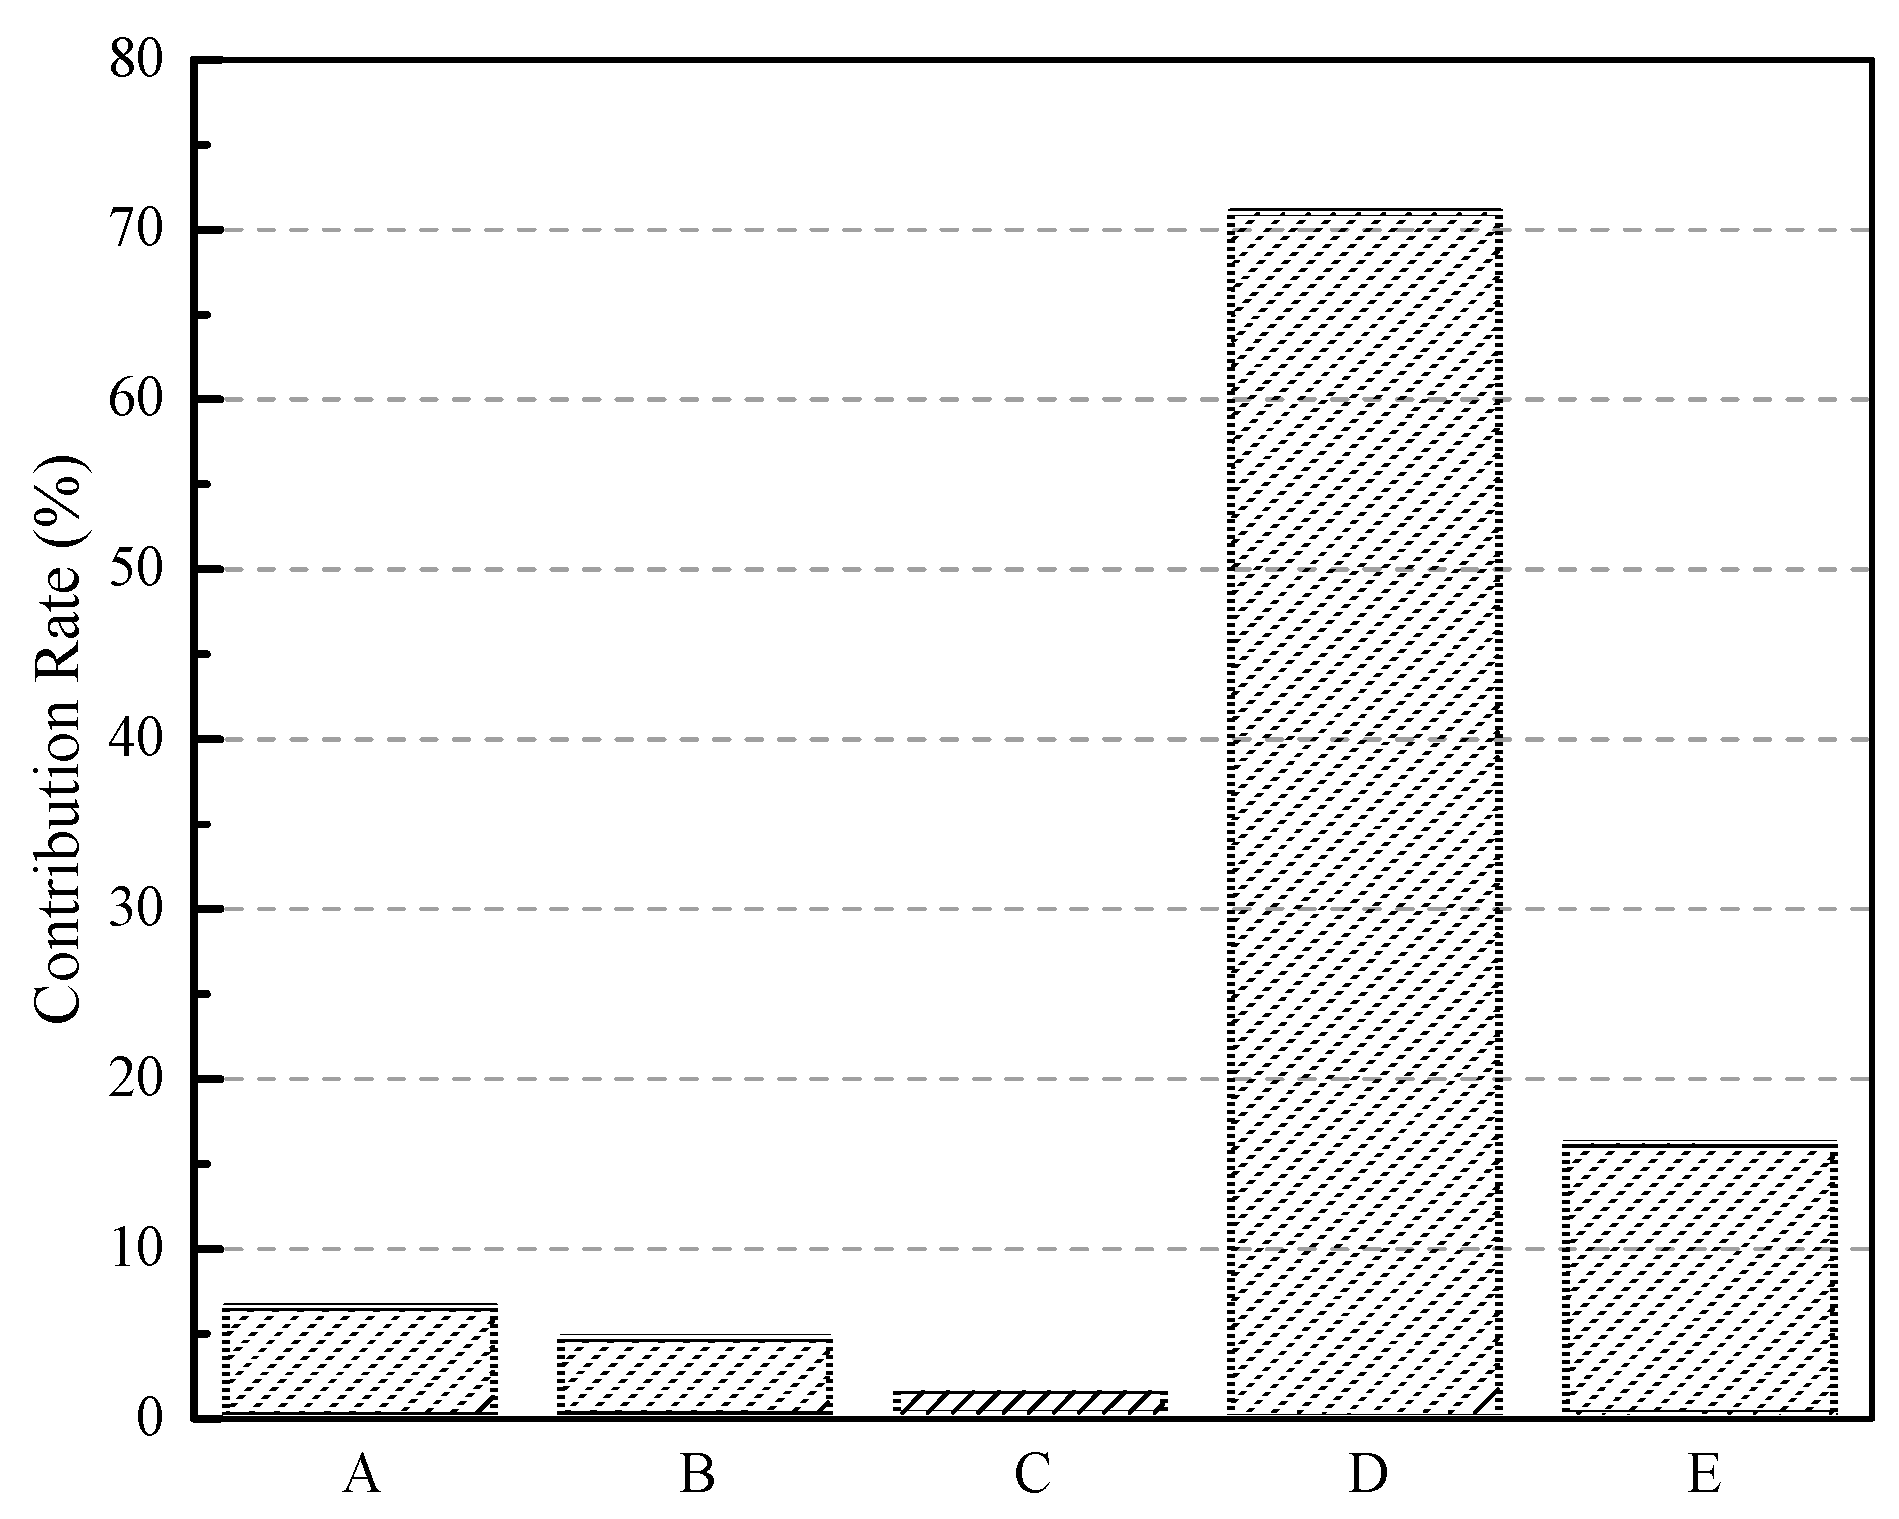
| Parameters | D.O.F. 1 | Sum of Squares | Variance | F-Value | Contribution (%) |
|---|---|---|---|---|---|
| A | 4 | 93.92 | 23.48 | 1.73 | 9.37 |
| B | 4 | 73.72 | 18.43 | 1.36 | 7.35 |
| C | 4 | 163.66 | 40.92 | 3.01 | 16.32 |
| D | 4 | 569.48 | 142.37 | 10.49 | 56.79 |
| E | 4 | 47.68 | 11.92 | 0.88 | 4.75 |
| Error | 4 | 54.30 | 13.57 | 5.42 | |
| Total | 24 | 1002.76 | 100.00 |
| Parameters | D.O.F. | Sum of Squares | Variance | F-Value | Contribution (%) |
|---|---|---|---|---|---|
| A | 4 | 60,096,530 | 15,024,133 | 5.98 | 5.66 |
| B | 4 | 23,128,912 | 5,782,228 | 2.30 | 2.18 |
| C | 4 | 52,139,995 | 13,034,999 | 5.19 | 4.91 |
| D | 4 | 605,712,033 | 151,428,008 | 60.29 | 57.08 |
| E | 4 | 310,112,770 | 77,528,193 | 30.87 | 29.22 |
| Error | 4 | 10,046,182 | 2,511,546 | 0.95 | |
| Total | 24 | 1,061,236,423 | 100.00 |
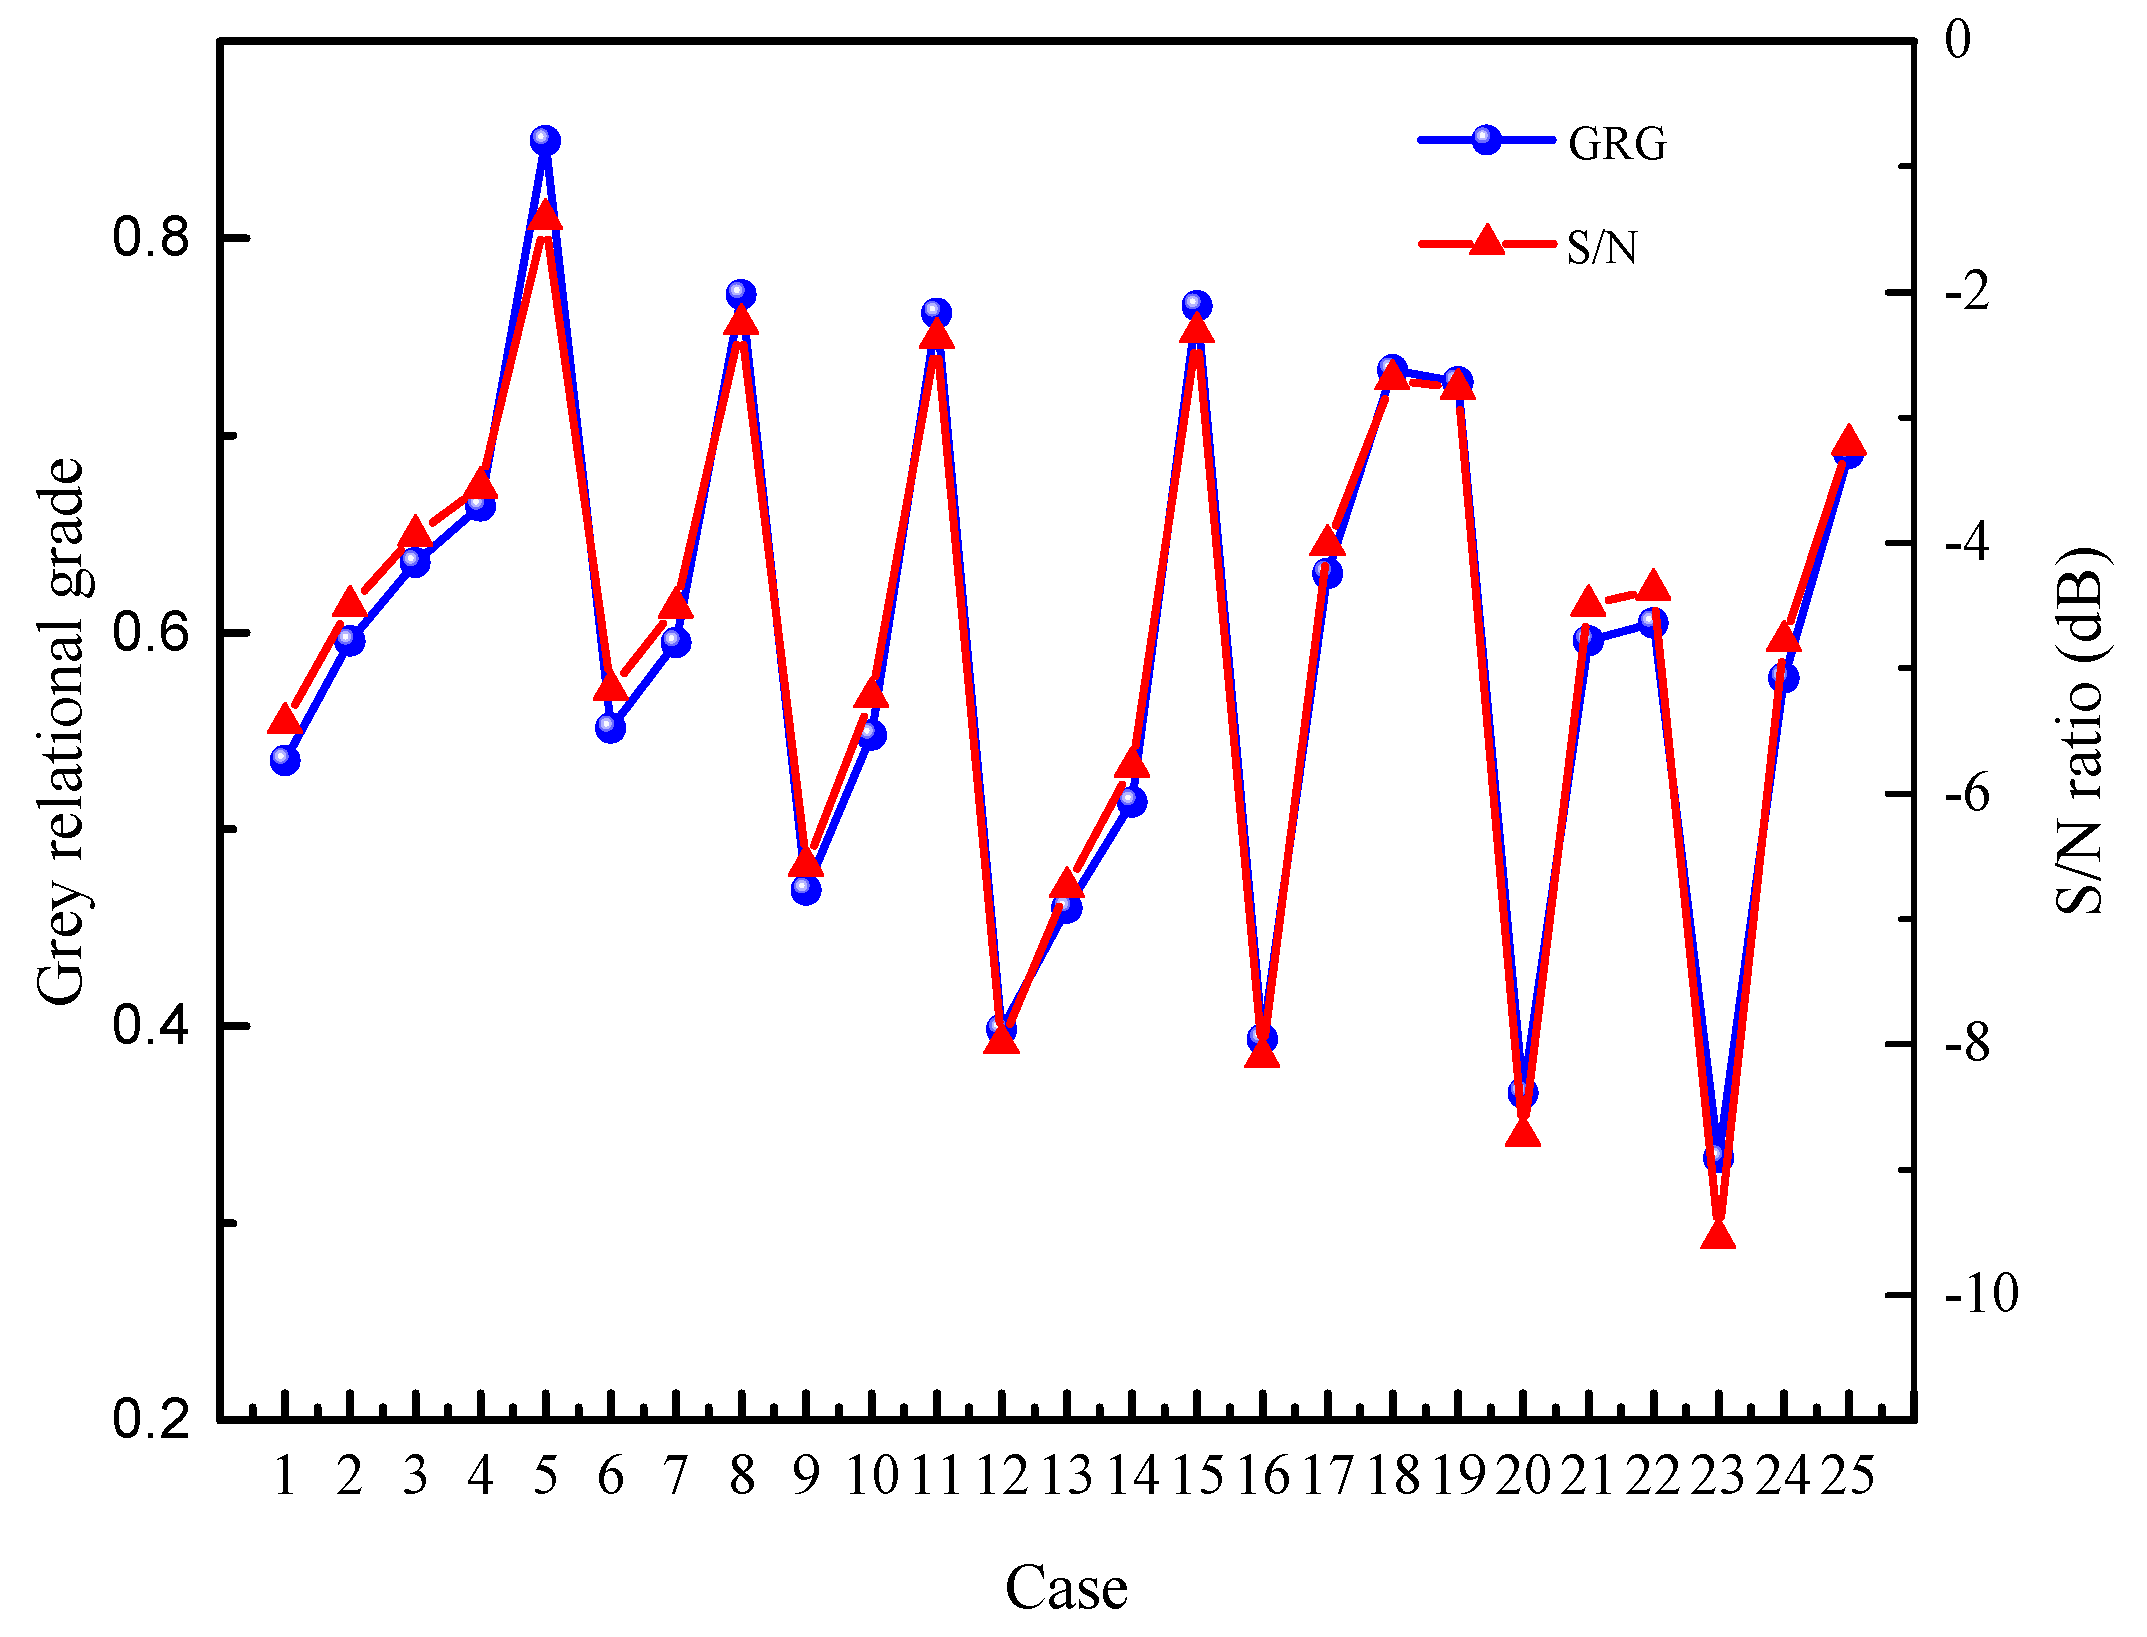
| Case | Normalized Results | Grey Relational Coefficients | Grey Relational Grade | Order | ||
|---|---|---|---|---|---|---|
| Pdrop | Ex | Pdrop | Ex | |||
| 1 | 0.78362 | 0.11486 | 0.69795 | 0.36097 | 0.533815 | 18 |
| 2 | 0.83806 | 0.32522 | 0.75536 | 0.42561 | 0.594745 | 13 |
| 3 | 0.82761 | 0.54520 | 0.74362 | 0.52367 | 0.636486 | 9 |
| 4 | 0.82236 | 0.65153 | 0.73785 | 0.58929 | 0.665493 | 8 |
| 5 | 0.80129 | 1.00000 | 0.71560 | 1.00000 | 0.854127 | 1 |
| 6 | 0.76134 | 0.29901 | 0.67690 | 0.41632 | 0.549980 | 16 |
| 7 | 0.74743 | 0.53978 | 0.66439 | 0.52071 | 0.594410 | 14 |
| 8 | 1.00000 | 0.55051 | 1.00000 | 0.52660 | 0.769416 | 2 |
| 9 | 0.51717 | 0.35385 | 0.50874 | 0.43624 | 0.473426 | 20 |
| 10 | 0.78123 | 0.21440 | 0.69564 | 0.38892 | 0.546242 | 17 |
| 11 | 0.98147 | 0.58420 | 0.96426 | 0.54597 | 0.760521 | 4 |
| 12 | 0.31406 | 0.18359 | 0.42161 | 0.37982 | 0.401254 | 22 |
| 13 | 0.42639 | 0.40950 | 0.46572 | 0.45851 | 0.462206 | 21 |
| 14 | 0.72191 | 0.15969 | 0.64260 | 0.37305 | 0.511306 | 19 |
| 15 | 0.99418 | 0.55184 | 0.98849 | 0.52734 | 0.763871 | 3 |
| 16 | 0.22128 | 0.23938 | 0.39102 | 0.39663 | 0.393752 | 23 |
| 17 | 0.88978 | 0.32933 | 0.81937 | 0.42711 | 0.628308 | 10 |
| 18 | 0.97409 | 0.49888 | 0.95073 | 0.49944 | 0.730916 | 5 |
| 19 | 0.94791 | 0.56777 | 0.90565 | 0.53635 | 0.725770 | 6 |
| 20 | 0.18102 | 0.09295 | 0.37908 | 0.35535 | 0.367523 | 24 |
| 21 | 0.77599 | 0.49715 | 0.69060 | 0.49858 | 0.597070 | 12 |
| 22 | 0.85483 | 0.30821 | 0.77499 | 0.41954 | 0.601857 | 11 |
| 23 | 0 | 0 | 0.33333 | 0.33333 | 0.333333 | 25 |
| 24 | 0.82830 | 0.24486 | 0.74438 | 0.39836 | 0.575840 | 15 |
| 25 | 0.86078 | 0.66968 | 0.78220 | 0.60218 | 0.694517 | 7 |
| Level | A | B | C | D | E |
|---|---|---|---|---|---|
| 1 | −3.759 | −5.120 | −4.733 | −7.623 | −3.780 |
| 2 | −4.747 | −5.082 | −4.874 | −5.872 | −3.855 |
| 3 | −5.036 | −5.034 | −4.862 | −4.429 | −4.874 |
| 4 | −5.267 | −4.687 | −5.001 | −3.519 | −5.708 |
| 5 | −5.278 | −4.164 | −4.617 | −2.644 | −5.870 |
| Delta | 1.519 | 0.955 | 0.385 | 4.979 | 2.091 |
| Rank | 3 | 4 | 5 | 1 | 2 |
| Factors | D.O.F. | Sum of Squares | Variance | F-Value | Contribution (%) |
|---|---|---|---|---|---|
| A | 4 | 0.029458 | 0.007364 | 3.02 | 6.51 |
| B | 4 | 0.021308 | 0.005327 | 2.18 | 4.71 |
| C | 4 | 0.001212 | 0.000303 | 0.12 | 0.27 |
| D | 4 | 0.319099 | 0.079775 | 32.72 | 70.51 |
| E | 4 | 0.071697 | 0.017924 | 7.35 | 15.84 |
| Error | 4 | 0.009752 | 0.002438 | 2.16 | |
| Total | 24 | 0.452525 | 100.00 |
| Output | Initial Parameter Setting A1B5C5D5E5 | Prediction A1B5C5D1 | Confirmation Experiment A1B5C5D5E1 |
|---|---|---|---|
| Ex (MJ·s−1) | 31.93 | 29.89 | |
| Pdrop (Pa) | 8328.9 | 2412.5 | |
| Grey relational grade | 0.8541 | 0.9371 | 0.9268 |
| GRA’s S/N ratio (dB) 1 | −1.369 | −0.564 | −0.660 |
| Improvement in GRG | 9.72% | 8.51% |
© 2020 by the authors. Licensee MDPI, Basel, Switzerland. This article is an open access article distributed under the terms and conditions of the Creative Commons Attribution (CC BY) license (http://creativecommons.org/licenses/by/4.0/).
Share and Cite
Fu, J.; Cai, J. Study of Heat Transfer and the Hydrodynamic Performance of Gas–Solid Heat Transfer in a Vertical Sinter Cooling Bed Using the CFD-Taguchi-Grey Relational Analysis Method. Energies 2020, 13, 2225. https://doi.org/10.3390/en13092225
Fu J, Cai J. Study of Heat Transfer and the Hydrodynamic Performance of Gas–Solid Heat Transfer in a Vertical Sinter Cooling Bed Using the CFD-Taguchi-Grey Relational Analysis Method. Energies. 2020; 13(9):2225. https://doi.org/10.3390/en13092225
Chicago/Turabian StyleFu, Junpeng, and Jiuju Cai. 2020. "Study of Heat Transfer and the Hydrodynamic Performance of Gas–Solid Heat Transfer in a Vertical Sinter Cooling Bed Using the CFD-Taguchi-Grey Relational Analysis Method" Energies 13, no. 9: 2225. https://doi.org/10.3390/en13092225
APA StyleFu, J., & Cai, J. (2020). Study of Heat Transfer and the Hydrodynamic Performance of Gas–Solid Heat Transfer in a Vertical Sinter Cooling Bed Using the CFD-Taguchi-Grey Relational Analysis Method. Energies, 13(9), 2225. https://doi.org/10.3390/en13092225