Abstract
Concentrator photovoltaics have several advantages over flat plate systems. However, the increase in solar concentration usually leads to an increase in the solar cell temperature, which decreases the performance of the system. Therefore, in this paper, we investigate the performance and temperature limits of a high concentration photovoltaic Thermal system (HCPVT) based on a 1 cm2 multi-junction solar cell subjected to a concentration ratio from 500× to 2000× by using three different types of cooling fluids (water, ethylene glycol and water mixture (60:40), and syltherm oil 800). The results show that, for this configuration, the maximum volumetric temperature of the solar cell did not exceed the manufacturer’s recommended limit for the tested fluids. At 2000× the lowest solar cell temperature obtained by using water was 93.5 °C, while it reached as high as 109 °C by using syltherm oil 800, which is almost equal to the maximum operating limit provided by the manufacturer (110 °C). Overall, the best performance in terms of temperature distribution, thermal, and electrical efficiency was achieved by using water, while the highest outlet temperature was obtained by using syltherm oil 800.
1. Introduction
Concentrator photovoltaics (CPV) has attracted a great deal of attention in the field of electricity generation due to its competitive cost in comparison with conventional PV systems for areas with high solar irradiance [1]. The key advantage of the CPV system is the use of high-efficiency concentrator cells, which can reach as high as 44.4% and 46% for three and four multi-junction (MJ) cells at 25 °C, respectively [2]. A key challenge, however, is the increase in the temperature of the solar cell, which adversely affects its electrical efficiency. In light of this challenge, the MJ solar cell manufacturer (AZUR SPACE) has set a maximum operating temperature for the CPV assembly to be 110 °C in order to avoid the damage of the solar cell [3]. Araki et al. [4] indicated that the solar cell temperature increases rapidly with the concentration ratio and can reach up to 1400 °C for 500× when left fully insulated.
Both passive and active cooling mechanisms can be deployed to maintain the solar cell temperature. However, an active cooling system offers a great advantage over the passive option as it allows the use of the waste heat from the system in other thermal applications, which increases the total efficiency of the system as well. Aldossary et al. [5] studied an active cooling system for a high concentrator photovoltaic (500×) for a 1 cm2 MJ solar cell. Their system considered a rectangular cooling channel. The maximum solar cell temperature reached 65 °C at 0.01 m/s. Alsiyabi et al. [6] investigated the performance of the CPV system at 500× using a microchannel heat sink. They reported that the maximum cell temperature reached 54 °C using four layers of a microchannel heat sink, which adds to the cost of the system. Abo-Zahhad et al. [7] studied a CPV system subjected to a concentration ratio of 1000× using a water impingement jet. The researchers revealed that the solar cell temperature fluctuates between 55 and 67 °C through the use of water. In another study by the same researchers [8], a high concentration photovoltaic system (HCPV) under passive cooling conditions was considered. The maximum temperature of the solar cell reached 160 °C at 1500× and convective heat flux of 1600 W/m2K However, there is no reported research about the performance of an HCPV using the active cooling method for a concentration ratio higher than 500× for a 1 cm2 MJ solar cell with the possibility of replacing water as a coolant with an ethylene glycol and water mixture or syltherm oil 800 for this system to avoid the mineral sedimentation issues of water on the fins at high temperatures [9]. Besides, they offer high boiling temperatures if compared with water, which gives them another advantage.
Therefore, in this paper, we investigate the performance and temperature limits of HCPV using a mini-channel heat sink under different concentration ratios (500×–2000×). In addition, we present a comparison of solar cell temperatures when using water, ethylene glycol and water mixture (60:40), and syltherm oil 800 under a different range of mass flow rates. Performance characteristics are shown, categorized in terms of maximum solar cell temperature, outlet fluid temperature, and the thermal and electrical efficiencies of the system.
2. Mathematical Modeling
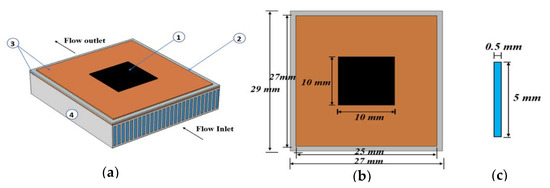
The 3D computational domain, shown in Figure 1, consists of: (1) 1 cm2 MJ solar cell assembly; (2) ceramic layer; (3) copper layers; and (4) aluminum mini-channel heat sink. Their thermal properties and dimensions are presented in Table 1 and Table 2. The germanium layer is considered the heat source of the system [10]. The total input energy is converted into electrical power and the remainder is transformed into thermal heat . The performance of the system is compared using different working media, water, ethylene glycol and water mixture (60:40), and syltherm oil 800 under different ranges of mass flow rates. The trial and error method is used to evaluate the temperature of the solar cell using the following relation [11,12]:
where and are the solar cell efficiency at a certain temperature and reference cell efficiency at an ambient temperature of 25 °C, respectively. is the temperature coefficient of the MJ solar cell and is equal to 0.0047 %/K as provided by the manufacturer [13] and is the reference temperature of the solar cell, which is equal to the ambient temperature of 25 °C.

Figure 1.
(a) The computational domain ((1) MJ solar cell; (2) ceramic layer; (3) copper layers; and (4) aluminum heat sink); (b) dimensions of the system; and (c) dimensions of the fluid channel.

Table 1.
Dimensions of different layers of the HCPVT.

Table 2.
Material thermophysical properties of HCPVT.
The total input energy on the surface of the solar cell can be represented as:
The thermal heat and the electrical power produced from the cell are calculated as follows:
where DNI, CR, and are the direct solar irradiance (W/m2), concentration ratio, and solar cell area (m2), respectively. Hence, the thermal energy to be carried by the fluid:
where ,
and are the mass flow rate (kg/s) and the specific heat capacity of the working medium . and are the inlet and outlet fluid temperatures (°C), respectively. Therefore, the thermal efficiency, , can be calculated by the following relation:
Then, the overall efficiency of the HCPVT system can be calculated as:
where and are the net electrical power and optical efficiency:
The pumping power, , can be calculated by the following relation:
where
and are the volume flow rate and pressure drop , respectively.
The thermophysical properties of all the tested fluids are temperature dependent. The properties of water that were used during the computation were adapted from [14]:
In the case of ethylene glycol and water mixture (60:40), the following equations were used. For syltherm oil 800, the Loikits data [15] were adapted:
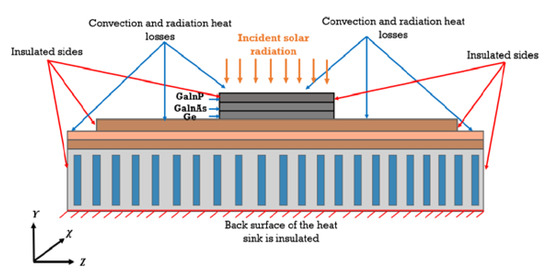
The computational domain (Figure 2) was discretized and solved using the Finite Element Method in COMSOL-Multiphysics 5.3 software [16]. Using the Generalized Minimum Residual (GMR) method, the 3D conjugated heat transfer equations were solved iteratively under steady-state conditions. The top surface of the solar cell, copper, and ceramic layers are subjected to natural convection and radiation heat transfer. Therefore, the heat balance equation to describe the heat transfer on the top surface of the solar cell can be written as:

Figure 2.
Schematic diagram of the boundary conditions of both the CPV assembly and the attached finned mini-channel heat sink.
The heat balance equations for both copper and ceramic layers are as follows:
The convective and radiative heat transfer can be calculated from the following relations [17]:
where h is the convective heat transfer coefficient , is the exposed surface temperature , is the ambient temperature and is assumed to be 25 °C, is the emissivity of the surfaces that are subjected to radiation, and is the Stefan–Boltzmann constant. For radiation heat transfer, the sky temperature was assumed to be equal to the ambient temperature as introduced in Equation (22) for simplification, as suggested in the literature [3,17]. For the MJ solar cell domain, the law of energy conversion for a steady-state with a heat source term
can be written as follows:
Further, for the heat sink, the heat conduction equation should be:
For the fluid domain, the continuity equation:
The momentum equation:
The energy equation:
The 3D computational domain was solved using the Finite Element Method (FEM) according to these assumptions:
- The MJ solar cell is subjected to concentration ratios varying from 500× to 2000×.
- The germanium layer is the heat source of the system.
- The top surfaces of the solar cell, copper, and ceramic layers, as presented in Figure 2, are subjected to natural convection [12] and surface to ambient radiation.
- The sides of the module and its back surface are insulated.
- The ambient temperature is fixed at 25 °C.
- The flow inside the channel is steady, incompressible, and laminar.
- The effects of the body force and viscous dissipation are ignored.
- The inlet temperature of the fluid is fixed at 25 °C and the outlet pressure is atmospheric.
The governing equations were solved using for the following boundary conditions:
At the channel inlet:
At the channel outlet:
The volumetric heat source in the germanium layer:
where V is the volume of the germanium layer.
2.1. Grid Independence Study
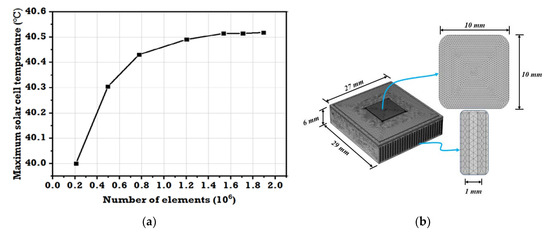
The first step to ensure the accuracy of the modeling was to carry out a grid independence study. The software allows the use of unstructured mesh (free tetrahedral) to solve the computational domain. In Figure 3a, the variation of the volumetric maximum solar cell temperature is plotted against the grid size. The number of elements was varied from 0.2 to 1.9 million elements. The maximum temperature has an almost constant value from 1.5 to 1.9 million elements. Therefore, the best number of elements, 1.5 million, in terms of accuracy and computation time was selected and the generated mesh is presented in Figure 3b. After generating the mesh and running the simulation, the mass and energy residuals were calculated using the software to ensure that they have a value lower than the relative tolerance error set in the software (0.001).

Figure 3.
(a) Grid independence study as a function of the maximum cell temperature; and (b) the generated mesh (The figure is not scaled).
2.2. Validation Study
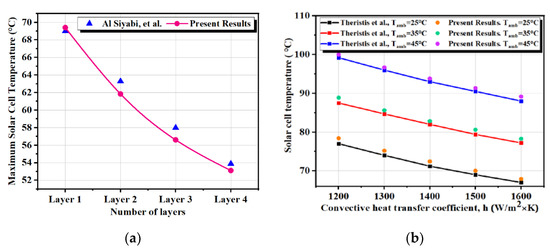
To ensure the accuracy of the numerical modeling further, several validation studies were conducted. The results of the present model were compared with the previously published results of Al Siyabi et al. [12] and Theristis et al. [17] at the same dimension and operating conditions. A good agreement was found between the present results and the compared studies in terms of maximum solar cell temperature with a maximum error of 2.4% with Al Siyabi et al. [12] and 0.7% with Theristis et al. [17], as presented in Figure 4a,b.

Figure 4.
Variation of the solar cell temperature with the number of heat sink layers for the work of Al Siyabi et al. [12] and the present results (a); and variation of the solar cell temperature with the convective heat transfer coefficient for the work of Theristis et al. [17] and the present results (b).
3. Results and Discussion
This section investigates the impact of the concentration ratio and the mass flow rate of water, ethylene glycol and water mixture (60:40), and syltherm-oil 800 on the maximum volumetric solar cell temperature, temperature distribution on the solar cell surface, outlet fluid temperature, and thermal and electrical efficiency of the system.
3.1. Maximum Solar Cell Temperature and Temperature Distribution over the Surface of the Solar Cell
The impact of using water, ethylene glycol and water mixture (60:40), and syltherm oil 800 on the performance of the HCPVT system at different concentration ratios is presented in this section. Figure 5 compares the variation of the maximum volumetric solar cell temperature with the mass flow rate for water, ethylene glycol and water mixture, and syltherm oil. The highest temperature was observed by using oil (109.1 ), while the lowest was by using water (93.5 ) at the same mass flow rate and solar concentration ratio of . Increasing the mass flow rate had a positive effect on reducing the maximum volumetric solar cell temperature, reaching 34.7 °C at a solar concentration ratio of . In general, all the calculated maximum temperatures were lower than the recommended limit provided by the manufacturer. In addition, the temperature distribution for the different working media is presented in Figure 6. Water offered the most uniform temperature distribution followed by ethylene glycol and water mixture (60:40), the average temperature varying from 82.16 to 88.48 °C, respectively.

Figure 5.
Variation of the maximum solar cell temperature with mass flow rates at different values of concentration ratios: (a) water; (b) ethylene glycol and water mixture (60:40); and (c) syltherm oil 800.

Figure 6.
Solar cell surface temperature at and kg/s for: (a) water; (b) ethylene glycol and water mixture (60:40); and (c) syltherm oil 800.
3.2. Outlet Fluid Temperature
The variation of the outlet temperatures of the fluids with the concentration ratio and mass flow rate are presented in Figure 7. The outlet temperature decreased with increasing the mass flow rate, while it increased with the concentration ratio. The highest outlet temperature was observed in the case of using the syltherm oil (73.5 °C), while the lowest was in the case of using water (58.5 °C) at a solar concentration of 2000× and a mass flow rate of kg/s. Further, the outlet temperature by using ethylene glycol and water mixture reached as high as 65 °C at the lowest tested mass flow rate at the concentration ratio of 2000× and 34 °C at a concentration ratio of 500×. Therefore, increasing the concentration ratio had a positive impact on the outlet temperature for all the tested fluids. Syltherm oil 800 offered the highest outlet fluid temperature in comparison with other fluids especially for a concentration ratio above 1000×. Overall, deciding which fluid to use depends mainly on the designed concentration ratio and the available heat recovery application.

Figure 7.
Variation of the outlet temperature with the mass flow rate and concentration ratio for: (a) water; (b) ethylene glycol and water mixture (60:40); and (c) syltherm oil 800.
3.3. Electrical and Thermal Efficiencies
The solar cell temperature and the electrical efficiency were calculated by equation (1) using the trial and error method [11,12] by inputting the reference efficiency as provided by the manufacturer. Therefore, the electrical efficiency depends on the concentration ratio as well as the solar cell temperature. The electrical efficiency of the HCPVT system increased significantly with an increase in the mass flow rate of the working media, as presented in Figure 8. Using syltherm oil decreased the electrical efficiency if compared with water by 2.2% at kg/s, especially at a concentration ratio of 2000. This can be attributed to the high surface temperature of the solar cell that is detected in the case of using the syltherm oil if compared with the other fluids at the same mass flow rates. The highest electrical efficiency was 40.8% in the case of using water and a concentration ratio of 500× and mass flow rate of 0.006 kg/s, while the lowest efficiency was 31.2% in the case of using syltherm oil and a concentration ratio of and mass flow rate of kg/s. Further, increasing the concentration ratio had a negative impact on the calculated electrical efficiency as a large portion of the concentrated solar irradiance converted into heat. In total, among the tested fluids water showed the highest performance in terms of electrical efficiency especially at concentration ratios above . Figure 9 shows the effect of increasing the mass flow rate on the thermal efficiency of the HCPVT system at different concentration ratios. The thermal efficiency of the HCPVT system increased with an increase in the mass flow rate and concentration ratio. The thermal efficiency varied from 42% to 65.4% for the concentration ratio between and . The lowest values are observed in the case of using syltherm oil 800 due to its lower specific heat at constant pressure if compared with the other fluids. The thermal efficiency increased from 23.97% to 57.45% when using syltherm oil 800, while it varied from 34.65% to 62.8% when using the ethylene glycol and water mixture. In the case of thermal efficiency, increasing the concentration ratio had a positive impact as shown in the results.

Figure 8.
Variation of the electrical efficiency with the mass flow rate and concentration ratio for: (a) water; (b) ethylene glycol and water mixture (60:40); and (c) syltherm oil 800.

Figure 9.
Variation of the thermal efficiency with the mass flow rate and concentration ratio for: (a) water; (b) ethylene glycol and water mixture (60:40); and (c) syltherm oil 800.
4. Conclusions
This study explored the performance of an HCPVT system using MJ solar cell under active cooling conditions and solar concentration ratios varying from to . In addition, we investigated the possibility of replacing water with ethylene glycol and water mixture (60:40) and syltherm oil 800. In terms of solar cell temperature, water offered the most uniform temperature distribution and the lowest volumetric temperature at the examined flow rates and concentration ratios. Further, in terms of the outlet temperature, syltherm oil 800 showed the highest fluid temperature, especially for a concentration ratio above , which would be suitable for thermal applications that require a high temperature. At concentration ratios above , using syltherm oil reduced the electrical efficiency by more than 1% when compared with water, while at lower concentration ratios the reduction was insignificant. Water achieved the highest thermal efficiency due to its high specific heat followed by ethylene glycol and water mixture and lastly syltherm oil 800. Overall, deciding which fluid to be used depends mainly on the designed concentration ratio, the required outlet temperature, and thermal energy to be recovered. For future implementation, to reflect the outdoor conditions, a transient simulation would be better than the steady-state case. For more precise calculations, a coupled electrical and thermal simulation would be of importance.
Author Contributions
Conceptualization, Data Curation, Formal Analysis, Investigation, Methodology, Software, Validation, Visualization, and Writing—original draft, A.A.; supervision and writing—review and editing, K.S.; supervision and writing—review and editing, S.S.; project administration, supervision, and writing—review and editing, T.K.M. All authors have read and agreed to the published version of the manuscript.
Funding
The Newton-Mosharafa Fund (a UK-Egypt partnership program for postgraduate scholarships) is acknowledged for the financial support given to Asmaa Ahmed.
Conflicts of Interest
The authors declare no conflict of interest.
References
- Wiesenfarth, M.; Philipps, S.P.; Bett, A.W.; Horowitz, K.; Kurtz, S. Current Status of Concentrated Photovoltaic (CPV); National Renewable Energy Laboratory (NREL): Golden, CO, USA, 2015.
- NREL. Best Research-Cell Efficiency Chart; National Renewable Energy Laboratory (NREL): Golden, CO, USA, 2019; Volume 1.
- Valera, A.; Fernández, E.F.; Rodrigo, P.M.; Almonacid, F. Feasibility of flat-plate heat-sinks using microscale solar cells up to 10,000 suns concentrations. Sol. Energy 2019, 181, 361–371. [Google Scholar] [CrossRef]
- Araki, K.; Uozumi, H.; Yamaguchi, M. A Simple Passive Cooling Structure and Its Heat Analysis for 500× Concentrator PV Module. In Proceedings of the Twenty-Ninth IEEE Photovoltaic Specialists Conference, New Orleans, LA, USA, 19–24 May 2002; pp. 1568–1571. [Google Scholar]
- Aldossary, A.; Mahmoud, S.; Al-Dadah, R. Technical feasibility study of passive and active cooling for concentrator PV in harsh environment. Appl. Therm. Eng. 2016, 100, 490–500. [Google Scholar] [CrossRef]
- Siyabi, I.A.; Khanna, S.; Sundaram, S.; Mallick, T. Experimental and numerical thermal analysis of multi-layered microchannel heat sink for concentrating photovoltaic application. Energies 2019, 12, 122. [Google Scholar] [CrossRef]
- Abo-Zahhad, E.M.; Ookawara, S.; Radwan, A.; El-Shazly, A.H.; Elkady, M.F. Numerical analyses of hybrid jet impingement/microchannel cooling device for thermal management of high concentrator triple-junction solar cell. Appl. Energy 2019, 253, 113538. [Google Scholar] [CrossRef]
- Abo-Zahhad, E.M.; Ookawara, S.; Radwan, A.; El-Shazly, A.H.; El-Kady, M.F.; Esmail, M.F.C. Performance, limits, and thermal stress analysis of high concentrator multijunction solar cell under passive cooling conditions. Appl. Therm. Eng. 2020, 164, 114497. [Google Scholar] [CrossRef]
- Sung, S.K.; Suh, S.H.; Kim, D.W. Characteristics of cooling water fouling in a heat exchange system. J. Mech. Sci. Technol. 2008, 22, 1568–1575. [Google Scholar] [CrossRef]
- Theristis, M.; O’Donovan, T.S. An Integrated Thermal Electrical Model for Single Cell Photovoltaic Receivers Under Concentration. In Proceedings of the International Heat Transfer Conference, Kyoto, Japan, 10–15 August 2014. [Google Scholar]
- Zhou, J.; Yi, Q.; Wang, Y.; Ye, Z. Temperature distribution of photovoltaic module based on finite element simulation. Sol. Energy 2015, 111, 97–103. [Google Scholar] [CrossRef]
- Siyabi, I.A.; Shanks, K.; Mallick, T.; Sundaram, S. Thermal Analysis of a Multi-Layer Microchannel Heat Sink for Cooling Concentrator Photovoltaic (CPV) Cells. In Proceedings of the AIP Conference Proceedings, Bydgoszcz, Poland, 9–11 May 2018; Volume 1881. [Google Scholar]
- Azure Space Solar Power GmbH. AZUR Space Solar Cell Assembly 10 × 10 mm2; Azure Space Solar Power GmbH: Heilbronn, Germany, 2014. [Google Scholar]
- Yazdanifard, F.; Ameri, M.; Ebrahimnia-Bajestan, E. Performance of nanofluid-based photovoltaic/thermal systems: A review. Renew. Sustain. Energy Rev. 2017, 76, 323–352. [Google Scholar] [CrossRef]
- Loikits Syltherm 800. Available online: http://www.loikitsdistribution.com/files/syltherm-800-technical-data-sheet.pdf (accessed on 1 January 2019).
- COMSOL Multi-Physics. Available online: https://www.comsol.com (accessed on 5 January 2019).
- Theristis, M.; O’Donovan, T.S. Electrical-thermal analysis of III-V triple-junction solar cells under variable spectra and ambient temperatures. Sol. Energy 2015, 118, 533–546. [Google Scholar] [CrossRef]
© 2020 by the authors. Licensee MDPI, Basel, Switzerland. This article is an open access article distributed under the terms and conditions of the Creative Commons Attribution (CC BY) license (http://creativecommons.org/licenses/by/4.0/).