Technical Note

An Assessment of Wind Energy Potential for the Three Topographic Regions of Eritrea

by
Teklebrhan Negash
1,
Erik Möllerström
2,* and
Fredric Ottermo
2
1
Department of Mechanical Engineering, Mai-Nefhi College of Engineering and Technology, P.O. Box 12676, Asmara, Eritrea
2
The Rydberg Laboratory for Applied Sciences, Halmstad University, P.O. Box 823, SE-301 18 Halmstad, Sweden
*
Author to whom correspondence should be addressed.
Energies 2020, 13(7), 1846; https://doi.org/10.3390/en13071846
Submission received: 18 March 2020 / Revised: 6 April 2020 / Accepted: 8 April 2020 / Published: 10 April 2020
(This article belongs to the Section A3: Wind, Wave and Tidal Energy)

Abstract

:
This paper presents the wind energy potential and wind characteristics for 25 wind sites in Eritrea, based on wind data from the years 2000–2005. The studied sites are distributed all over Eritrea, but can roughly be divided into three regions: coastal region, western lowlands, and central highlands. The coastal region sites have the highest potential for wind power. An uncertainty, due to extrapolating the wind speed from the 10-m measurements, should be noted. The year to year variations are typically small and, for the sites deemed as suitable for wind power, the seasonal variations are most prominent in the coastal region with a peak during the period November–March. Moreover, Weibull parameters, prevailing wind direction, and wind power density recalculated for 100 m above ground are presented for all 25 sites. Comparing the results to values from the web-based, large-scale dataset, the Global Wind Atlas (GWA), both mean wind speed and wind power density are typically higher for the measurements. The difference is especially large for the more complex-terrain central highland sites where GWA results are also likely to be more uncertain. The result of this study can be used to make preliminary assessments on possible power production potential at the given sites.

1. Introduction

Unlike Europe and North America, which have a long history of wind energy [1,2,3], Africa does not have significant amounts of wind power, and as of 2018, it makes up less than 1% of the total global wind power capacity, with installations mainly in South Africa and Egypt [4]. Eritrea gained independence from Ethiopia in 1991 and is considered as one of the least developed countries in the world, with an acute energy crisis. The main energy source, biomass, has mainly been used for cooking purposes, while the majority of the population lacks electricity. The small amount of existing power production is almost completely fossil-based [5]. To strengthen the electricity supply, while meeting the demands of the Paris agreement, there is an obvious need for renewable electricity generation. Today, wind energy installations in Eritrea are limited to one 750-kW wind farm, and there are no current plans for large-scale implementations [6].
In [7], wind data, mainly from the late 1980s, was presented from various sites in Ethiopia including a few sites in what today is Eritrea. The southern Red Sea Coast in current Eritrea was concluded as having the highest wind energy potential in the region. As part of the same project, the solar energy resources were presented in [8]. The high potential of the Eritrean Red Sea Coast is also acknowledged in [9,10]. The study is based on several wind data sources, the newest from the mid-1990s, and focuses on a handful sites in the Red Sea Coast and the central highlands. More recently, in [11], a Geographic Information System (GIS) based approach for handling existing wind data was used to assess the wind energy potential for the entire African continent. The relatively course results show high wind energy potential for the Eritrean Red Sea coast, although most of the potential is limited by the method’s grid restriction criteria, which have an effect for most areas outside the capital region. A high potential for the Red Sea coast, especially for the winter months, is also shown in [12], where satellite data are analyzed with the Advanced Weather Research and Forecasting (WRF) model. Here, the potential of both wind and wave energy is presented, but only for offshore locations. A wider overview of the Eritrean energy sector from 2007 can be found in [13], where, based on the same wind data as this work, it is briefly mentioned that 300 villages located in the central highland and southern coastal region could feasibly have wind turbines installed in its vicinity. In addition, from 2007, in [14], coarse wind resources for different African countries are presented without regional results in the case of Eritrea. In summary, there is a lack of more site-specific wind resource studies which cover the different regions and topographies of Eritrea.
The wind energy resource of Eritrea is the focus of this work, which is based on wind data, mainly for the year 2000 (the years 2000–2005 for the sites deemed as most potential), measured for 25 different sites as part of the Wind and Solar Monitoring Network (WSMN) established in 1999. The number of sites, spread out over the three topographic regions of Eritrea, gives a unique overview of conventional wind data of Eritrea which will be a useful complement to satellite data and model-based wind assessments when planning wind power implementation. The results will be used to draw conclusions regarding the potential of the different regions. Furthermore, the seasonal variation and other wind attributes presented for the different sites can be used to further analyze how wind energy can be integrated in the power system and combined with other intermittent energy sources, for example, solar energy.

2. Theory

To characterize the wind resource, the mean wind speed v ¯ , the standard deviation of the wind speed σ , the Weibull shape and scale parameters k and c , and the prevailing wind direction, were calculated. The prevailing wind direction is obtained from binning the wind directions into a wind rose with 16 segments, then reading off the most probable direction.
The Weibull parameters are provided to facilitate easy reanalysis of the site performances, but it should be noted that the original wind data is generally a more accurate basis for analysis [15]. The Weibull probability distribution f ( v ) is given by [15]:
f ( v ) = ( k c ) ( v c ) k 1 exp [ ( v c ) k ]
where v is the wind speed. The shape and scale parameters can be calculated from the 10-min wind speed data using the maximum-likelihood method [16]:
k = i = 1 N v i k ln v i i = 1 N v i k i = 1 N ln v i N
c = ( i N v i k ) 1 / k
where N is the number of wind speed data points. Note that Equation (2) needs to be solved numerically, for example, by iteration. The frequency distribution of the measured wind speeds can be obtained by binning the data points into 1-m/s-wide intervals and displaying the percentage of data points for each bin. Comparing this distribution with the corresponding Weibull distribution, it is possible to judge how well the Weibull distribution approximates the real distribution.
For the extrapolation of wind speeds for a certain height z, the wind profile log law is used:
v = v r ln ( z / z 0 ) ln ( z r / z 0 )
Here, v r is the wind speed at the reference height z r and z 0 is the roughness length [15]. This is a rough estimate; the profile can locally be quite different in hilly terrain, for example. The wind power density E is given by [17]:
E = 1 2 ρ c 3 Γ ( 1 + 3 k ) ,
where ρ is the air density and Γ is the gamma function. To estimate how air density varies with the elevation z (in meters), the following expression can be used [15]:
ρ = 3.4837 101.29 z · 0.011837 + z 2 · 4.793 · 10 7 T
where T is the temperature in Kelvin, which for estimations, can be set to the mean temperature of Eritrea (296 K).

3. Method and Observations

The time series of wind data from a number of sites in Eritrea were analysed and summarized using the tools presented above. The measurement series and site characteristics are described in detail below.

3.1. Measurement Series

In 1998, the Department of Energy at the Ministry of Energy and Mines of Eritrea initiated a project in cooperation with the engineering consultant company Sweco, with the intention of mapping the wind and solar energy potential for different parts of Eritrea. As part of this, the Wind and Solar Monitoring Network (WSMN) was established in 1999 with 25 meteorological stations installed around the country. Each station was equipped with either one or two RM Young model 05103 wind monitors for measuring wind speed and direction, and data were logged in 10-min intervals. All stations had one wind monitor placed at 10 m height while five of the stations had one additional identical monitor placed at 30 m height.
In a not-openly-available internal report from the Ministry of Energy and Mines in 2006 [18], the mean wind speed values from these measurements were briefly presented. However, the results were not interpreted as the potential for wind energy in the different regions, and additional parameters such as prevailing wind direction, shape parameters, and standard deviation were not presented. Besides [18] and a brief reference to un-published data from the measurement series in [13], the results from all 25 wind sites have not been published in a comparative way before this work.
There are missing data for some periods of time in a few stations. Discontinuous curves in the plots indicate insufficient data for the corresponding month. The year 2000 is nearly complete for all stations (only one month with missing data for Idi). It should be mentioned that the data presented here, although old, is the most recent wind measurement campaign covering all topographic regions for Eritrea. Although there has been a negative trend in wind speed in the Red Sea area for the years 1985–2015, the effect on the southern wind characteristics for Eritrea was small [19]. This, together with the fact that the terrain of the 25 sites studied here is more or less unaltered since the year 2000, shows that the wind data have not become obsolete.

3.2. Potential Sites for Wind Farms in Eritrea

Eritrea can be divided into the western lowland, the coastal region and the central highlands, which separates the two first [20]. These three regions, within which the 25 wind sites studies in this work are distributed, are described in the sections below. The site positions can be seen in Figure 1 with additional information in Table 1. The table includes the wind power density as given by the free, web-based homogenous large-scale dataset Global Wind Atlas (GWA) v3.0 which is based on atmospheric re-analysis data [21]. The table also includes the roughness length z 0 which is visually estimated using available satellite map services such as Google Earth.
The coastal region is situated along the Red Sea coast in the central to southeastern part of Eritrea and includes altitudes up to 1000 m [20]. The only current wind farm in Eritrea, consisting of three 250-kW turbines is situated here, at the port of Assab on the Red Sea coast [6,13]. Besides the year-round warm climate, the Red Sea coast is characterized by the two distinct monsoon seasons occurring in the summer and winter. Most coastal sites are located in open and flat terrain, although Idi has some surrounding obstacles. Additionally, the coastal region includes the deep depression site, Bada, which, although located 45 km from the sea shore, has a similar topography as the other coastal sites.
The western lowland stretches from the north eastern Eritrea towards the central region and includes both deserts and savannas with altitudes ranging within 500–1500 m. Although these areas are as warm as the coastal region in the summer, the temperature is typically lower in winter time. Most of the sites here are placed in open and flat landscapes with, at most, small obstacles in the vicinity. However, the higher altitude site, Keren, is on the border to the central highlands where the terrain is considerably rougher with surrounding hills and valleys.
The central highland reaches up to 3000 m and has a cooler climate and more fertile land than the two lowland regions, which it separates [20]. The central highland includes mountainous terrain as well as a 2000-m altitude plateau that includes the capital, Asmara. This region contains the majority of the Eritrean population and hence also has the largest electricity demand. Most central highland sites are placed in a rough mountainous landscape. Exceptions are the urban Asmara sites, the southern high-altitude sites, Halay and Kohaito, with open and regular surface, and the Areza and Mailehan sites that are surrounded by low-vegetated agricultural landscape.

4. Results and Discussion

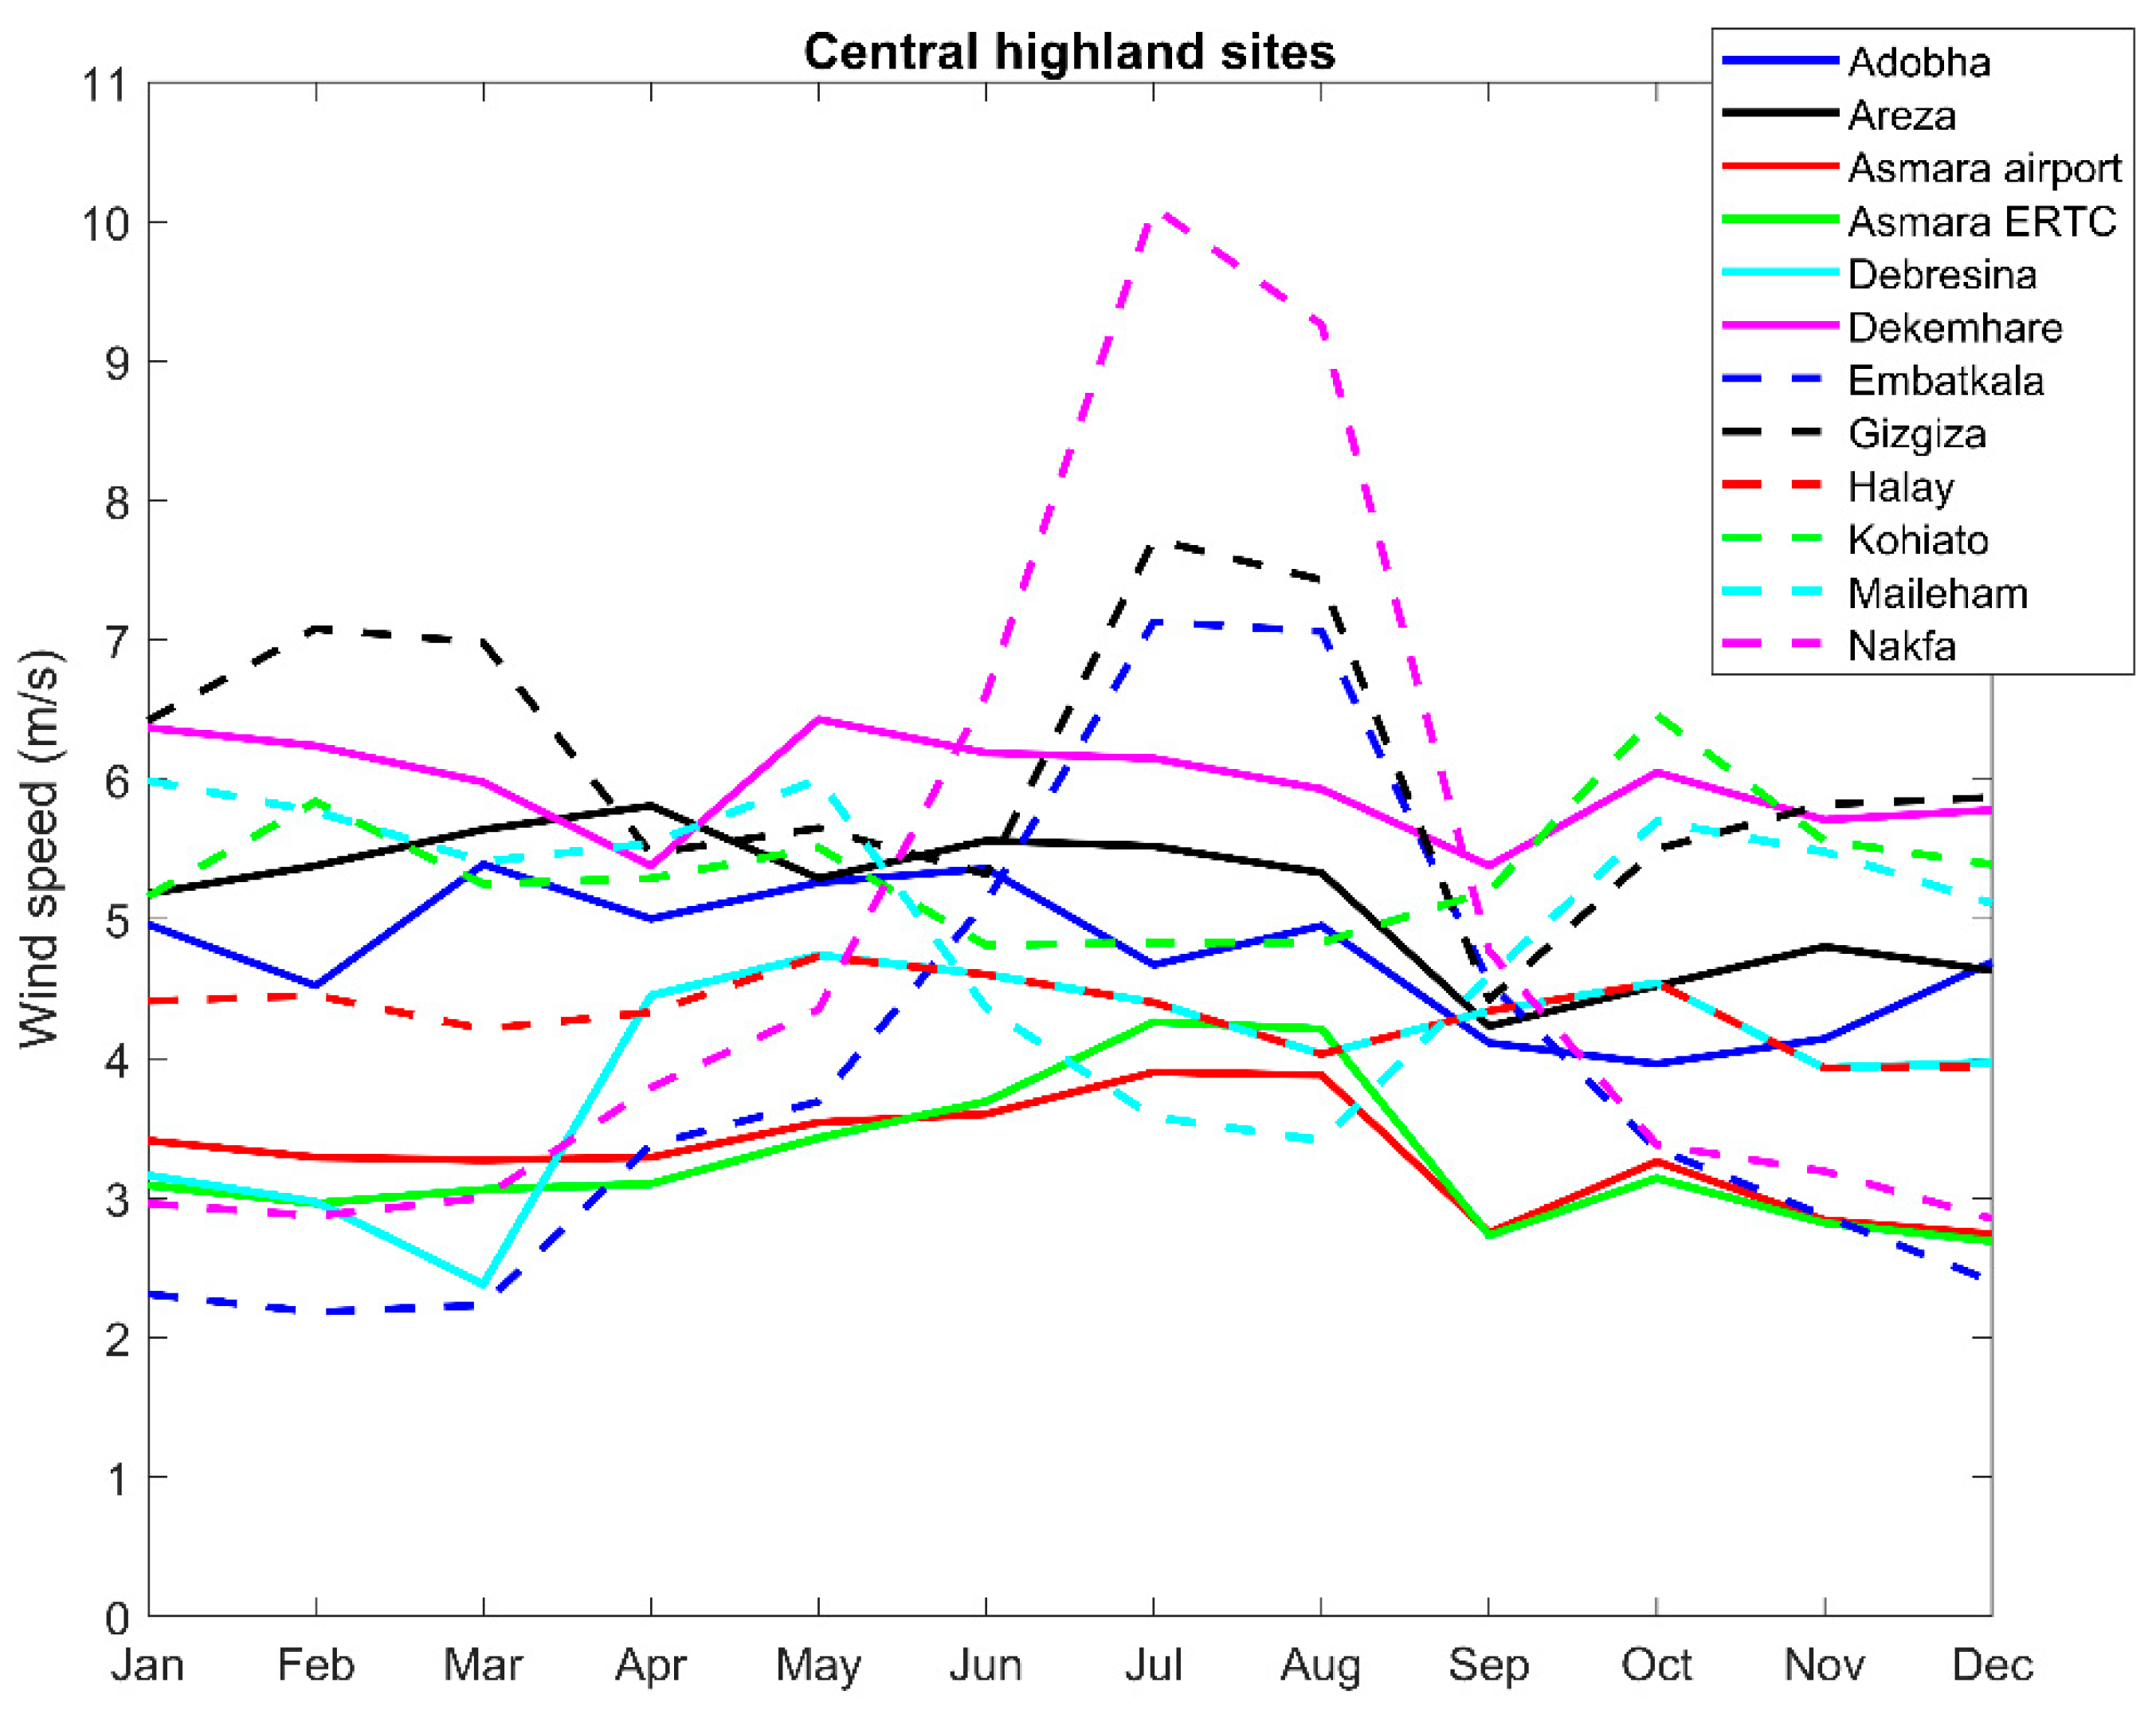
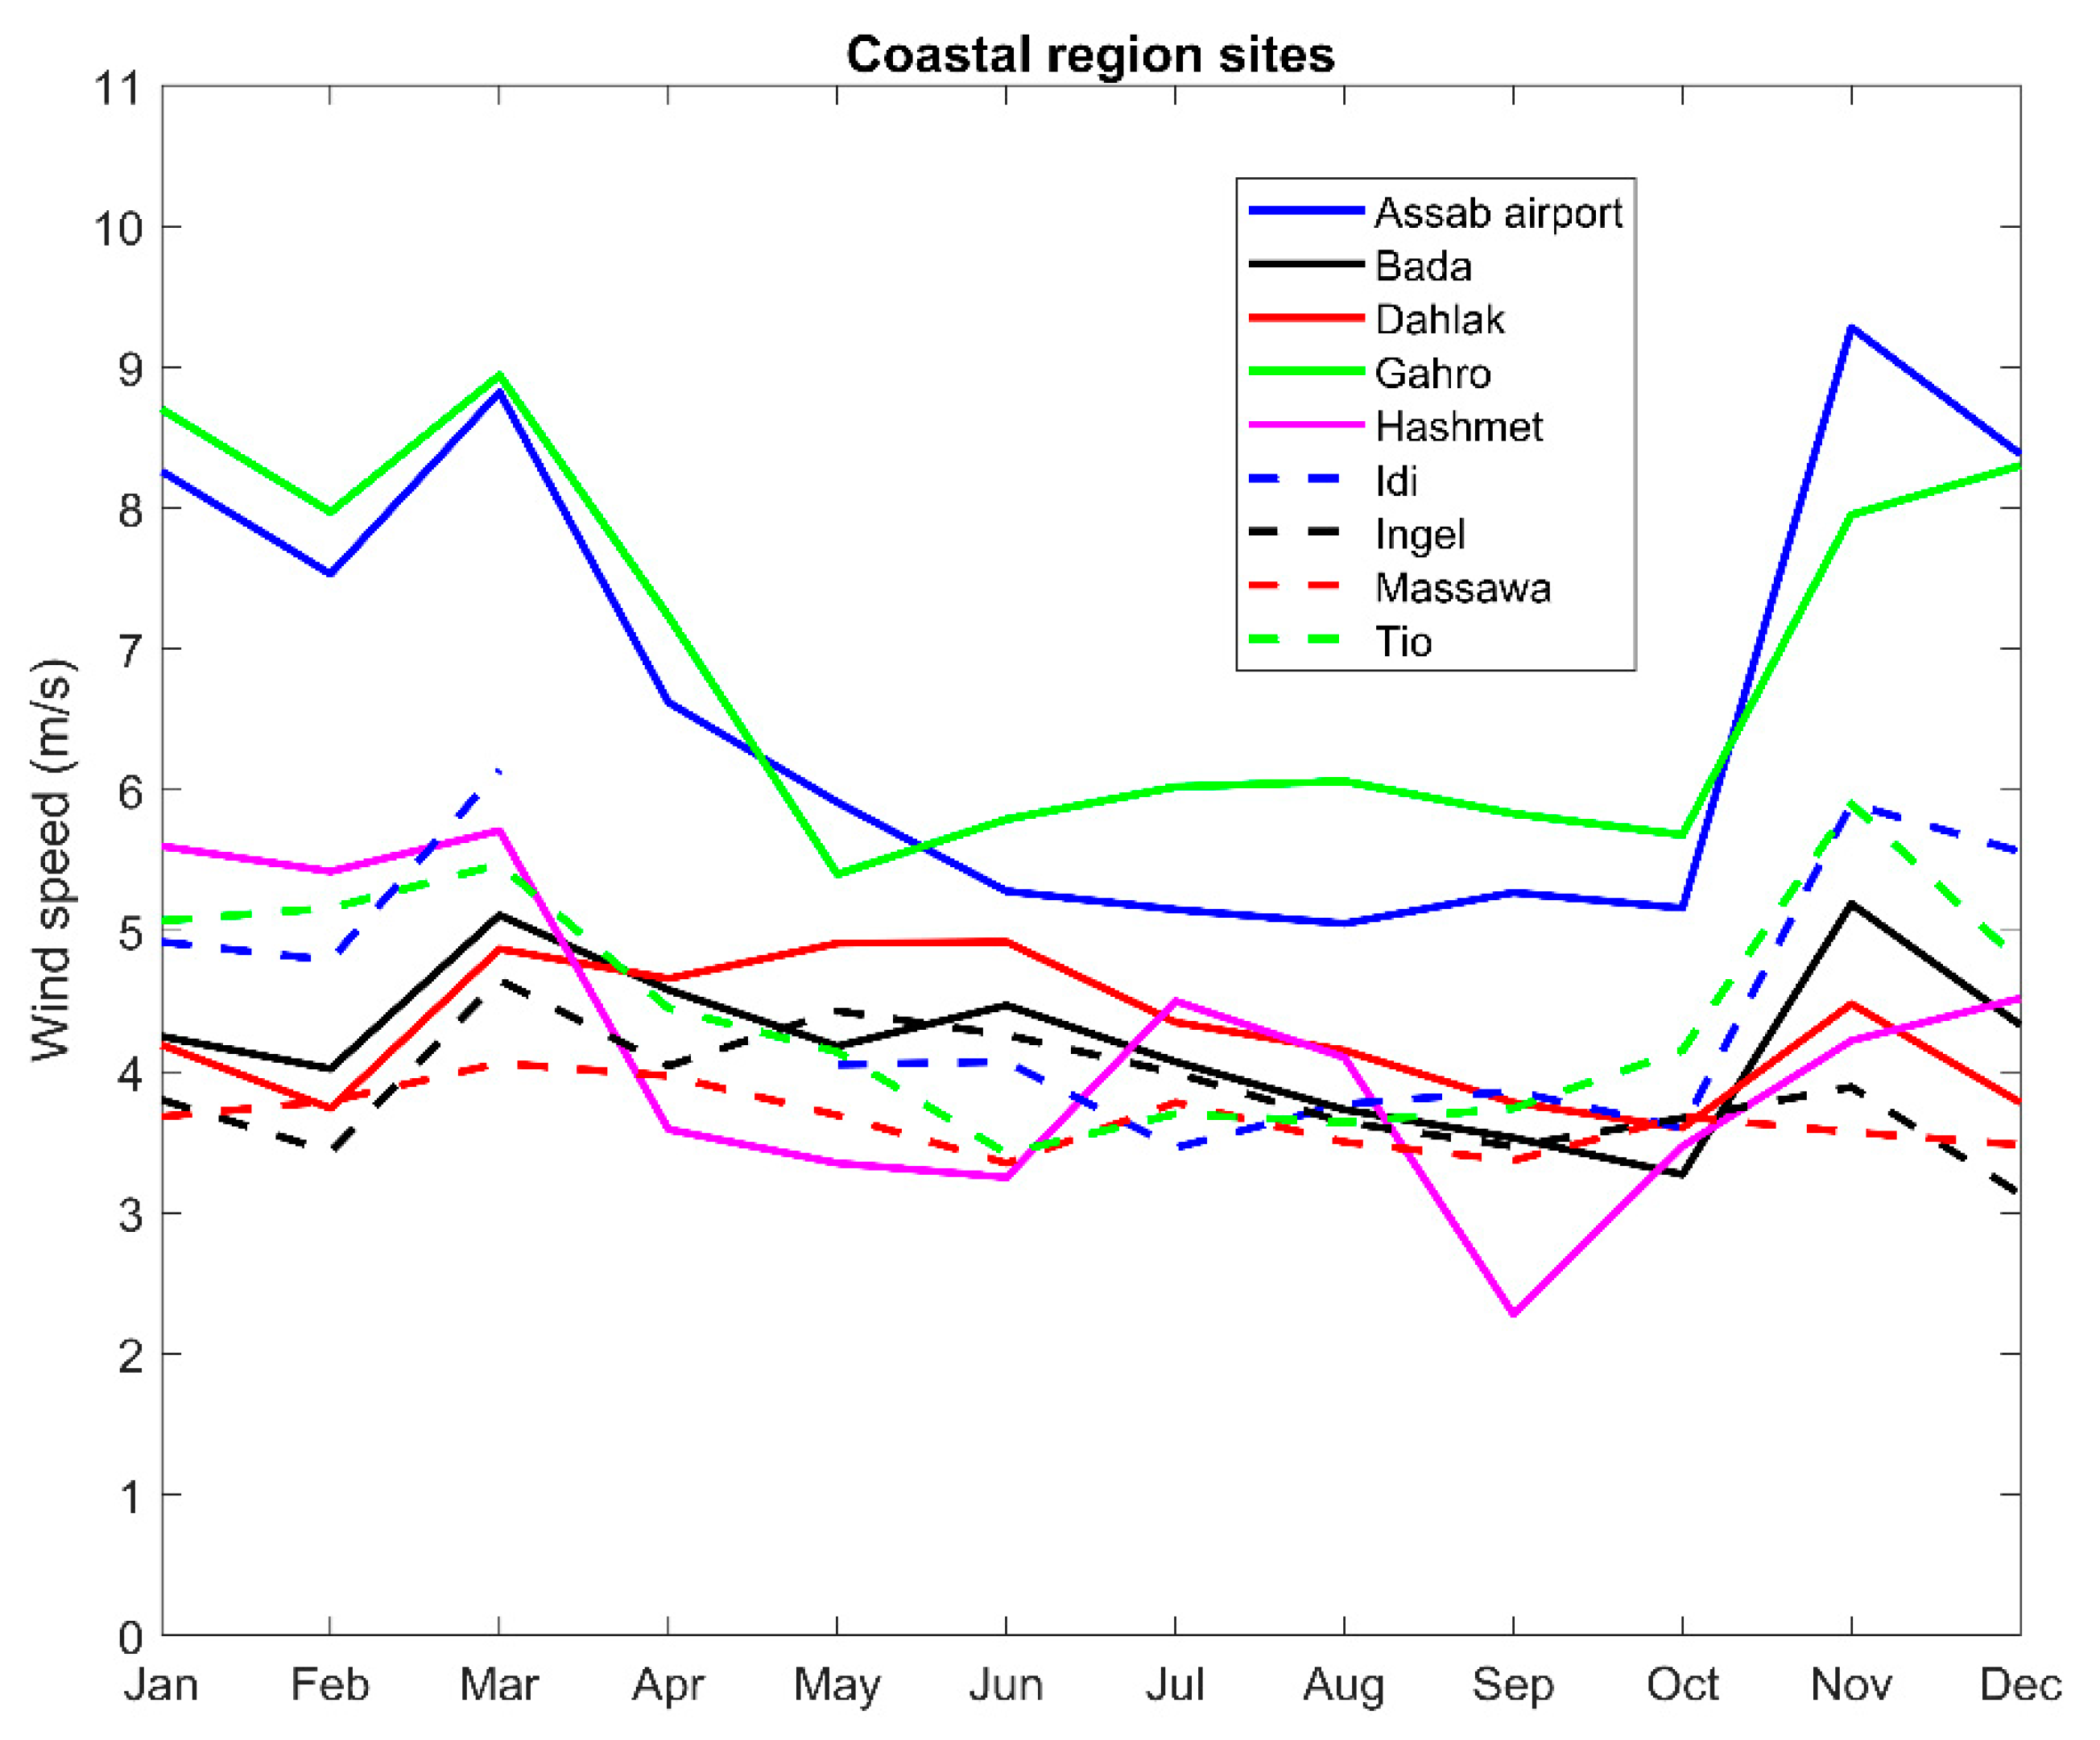
All results presented here, including Figure 2, Figure 3, Figure 4 and Figure 5, are based on wind measurements for the year 2000 (the years 2000–2005 for Figure 6). Furthermore, most of the results are based on measurements performed at 10 m height, although some 30-m measurements are presented. In Table 2, the mean wind speed, standard deviation, prevailing wind direction, and shape parameters for the year 2000 for all 25 sites can be observed. Furthermore, in Table 2, the wind power density for 100 m above ground is presented for all sites. It is calculated from the 10-m mean wind speed using Equations (4)–(6) and altitude and roughness length from Table 1. Furthermore, the seasonal variation of wind speed can be seen in Figure 3, Figure 4 and Figure 5.
Comparing the three regions to each other, sites in the coastal region have typically the highest wind power density followed by the central highlands. However, sites with, as well as without, potential can be found within all the regions. The coastal sites Assab and Gahro, both situated in the far southern part of Eritrea near the mouth of the Red Sea, have the highest mean wind speeds as well as the highest wind power density. However, some central highland sites, such as Gizgiza and Dekemhare, also show potential for wind power. For the western lowlands, Kerkebet is the only site that can be deemed to have potential. To generalize, based on the results from the 25 meteorological stations, the best wind sites can be found at the coastal area of the southern part of Eritrea with good sites also found in the central highlands. However, due to local orographic and roughness speedup effects as well as an uneven stability over land, the logarithmic wind profile will not always be accurate. This will provide a significant uncertainty when extrapolating the wind speed from 10 m to 100 m, which must be considered regarding the wind power density values. It should also be emphasized that, aside from the measured sites, good wind sites are likely to be found in all regions, especially in the central highlands when focusing on mountain ridges.
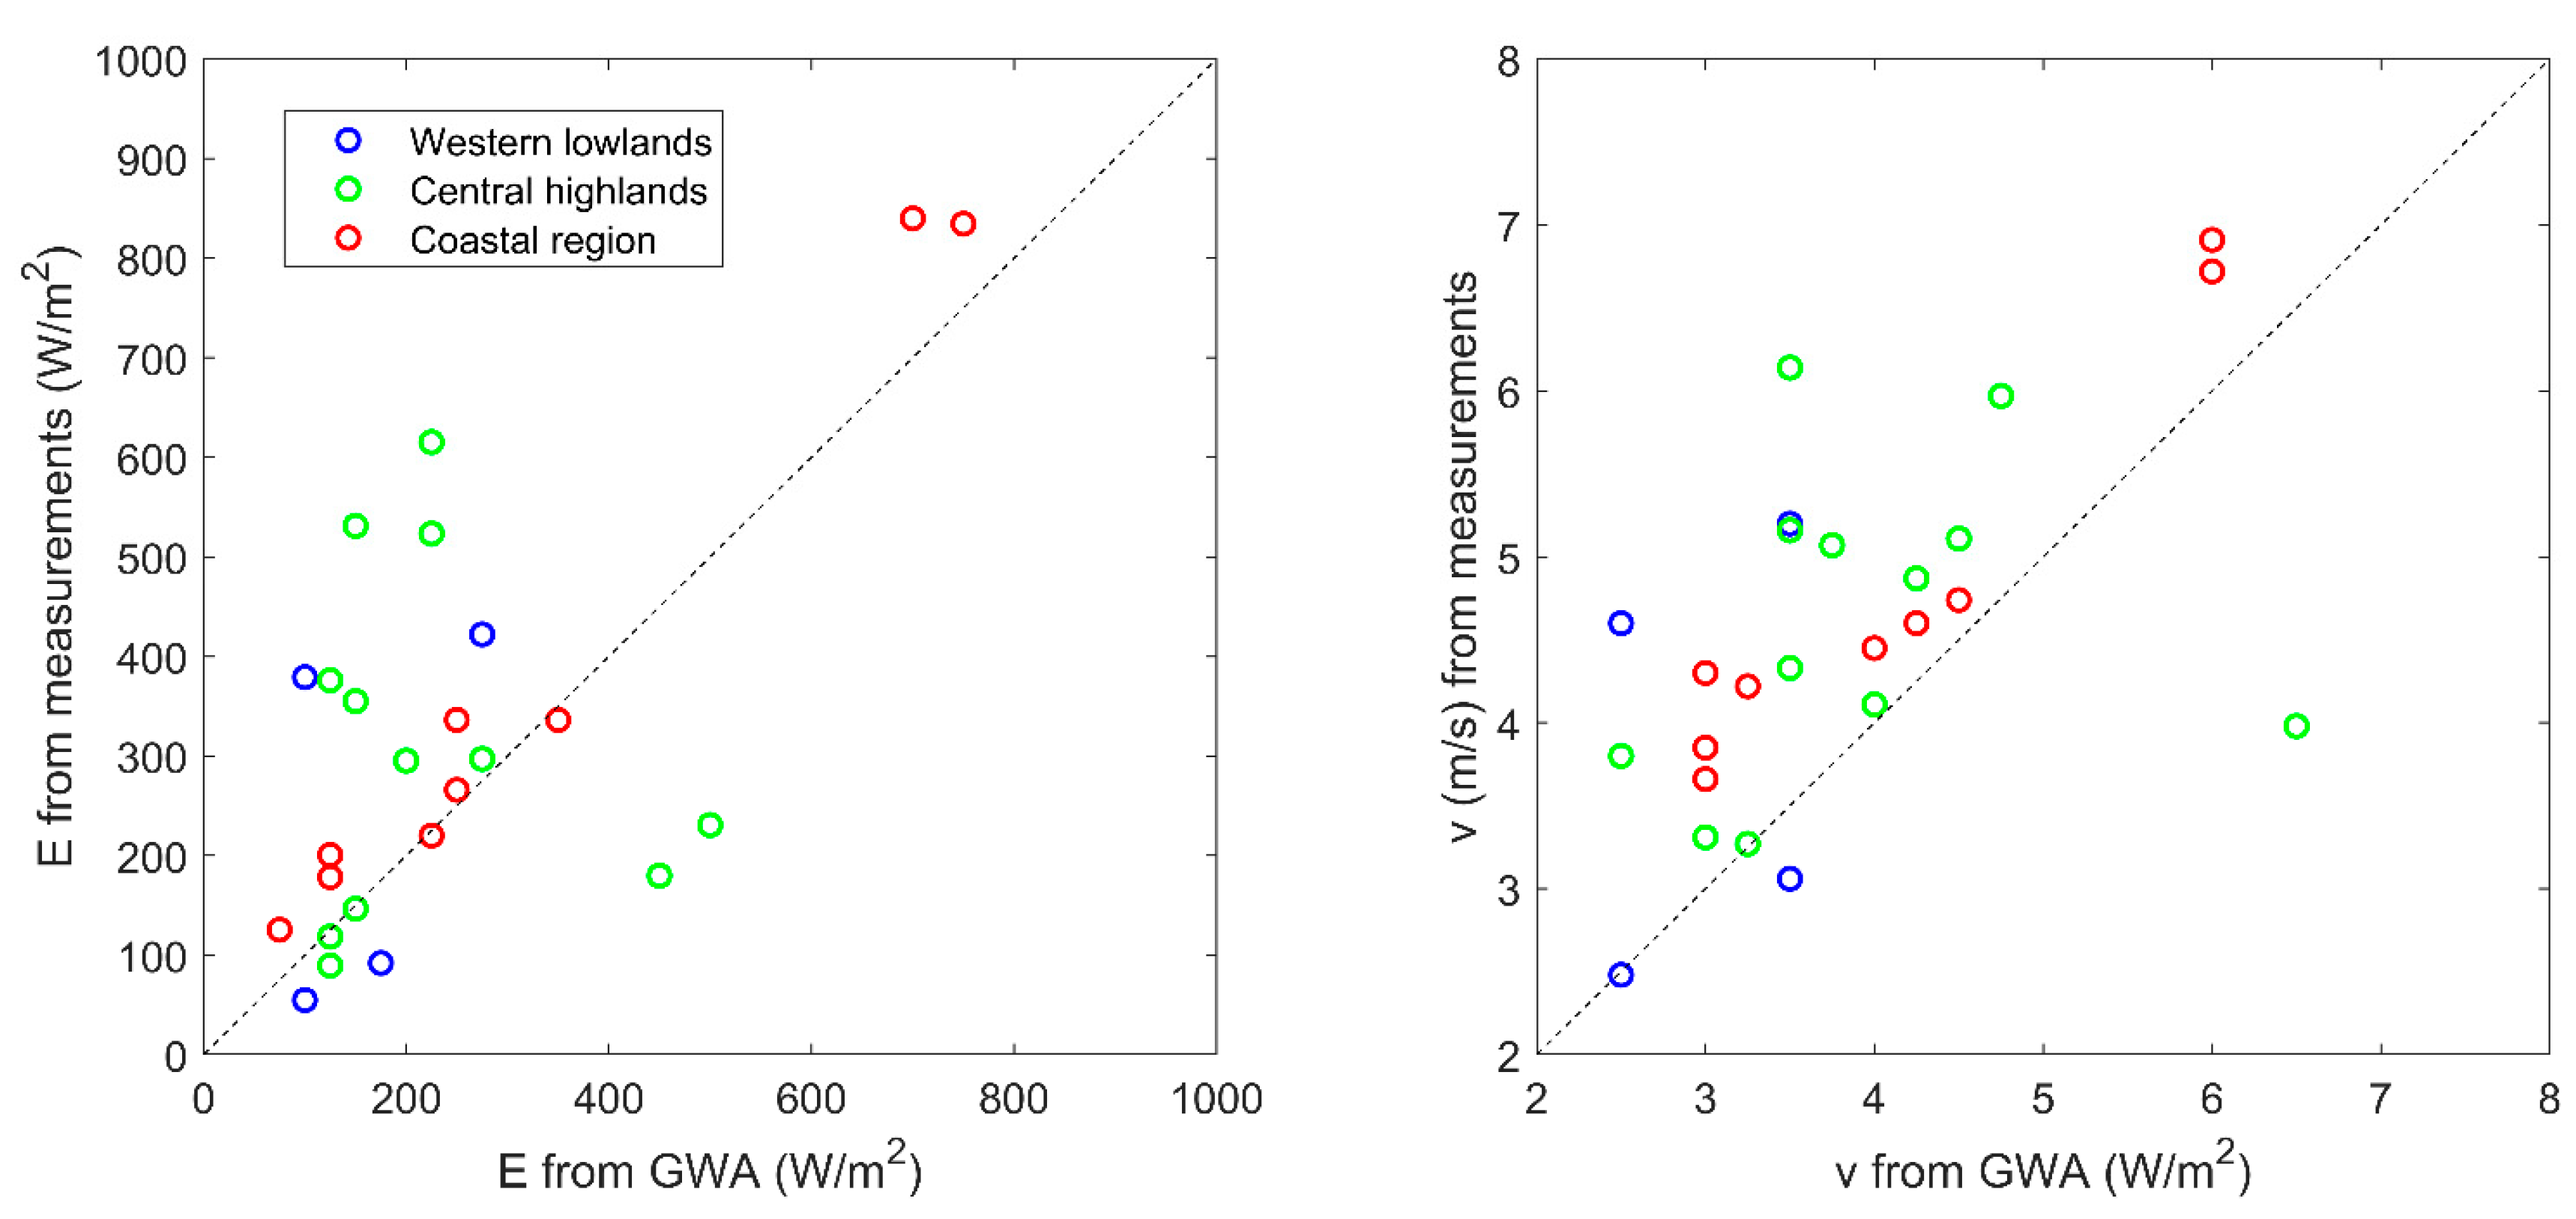
In Figure 2, the relationship between the values from measurements and the values from GWA can be seen for both the wind power density and the 10-m wind speed. It can be noted that the wind power density from measurements are typically somewhat higher than the GWA values. It can also be noted that the central highland sites have the largest deviations between measured and GWA values, with Nakfa and Dekemhare having the largest differences (see Table 1 for GWA values). Between the three regions, the coastal region sites have the highest correlation between measured and GWA values. The larger deviations for the central highland sites are probably linked to the more complex, hilly terrain. GWA has a ruggedness index layer, indicating increased uncertainty if this index is nonzero, which is the case in most of the central highland sites. The roughness length used by GWA in some of these sites also seem inappropriately chosen, judging from a visual inspection of satellite pictures, which adds to the uncertainty of the comparison. To generalize, when using GWA to find good wind sites in north eastern Africa, the results are likely to be more reliable for less complex terrains like coastal regions. Regardless of these deviations, the wind power density is generally found to be highest for the (south) coastal region and lowest for the western lowlands, considering the measurements as well as the GWA. It should also be noted that from the GWA mapping of Eritrea, it is obvious that the measurement stations were not placed on sites with the best local wind conditions, especially for the central highlands, where stations have been placed close to, but not on top of ridges.
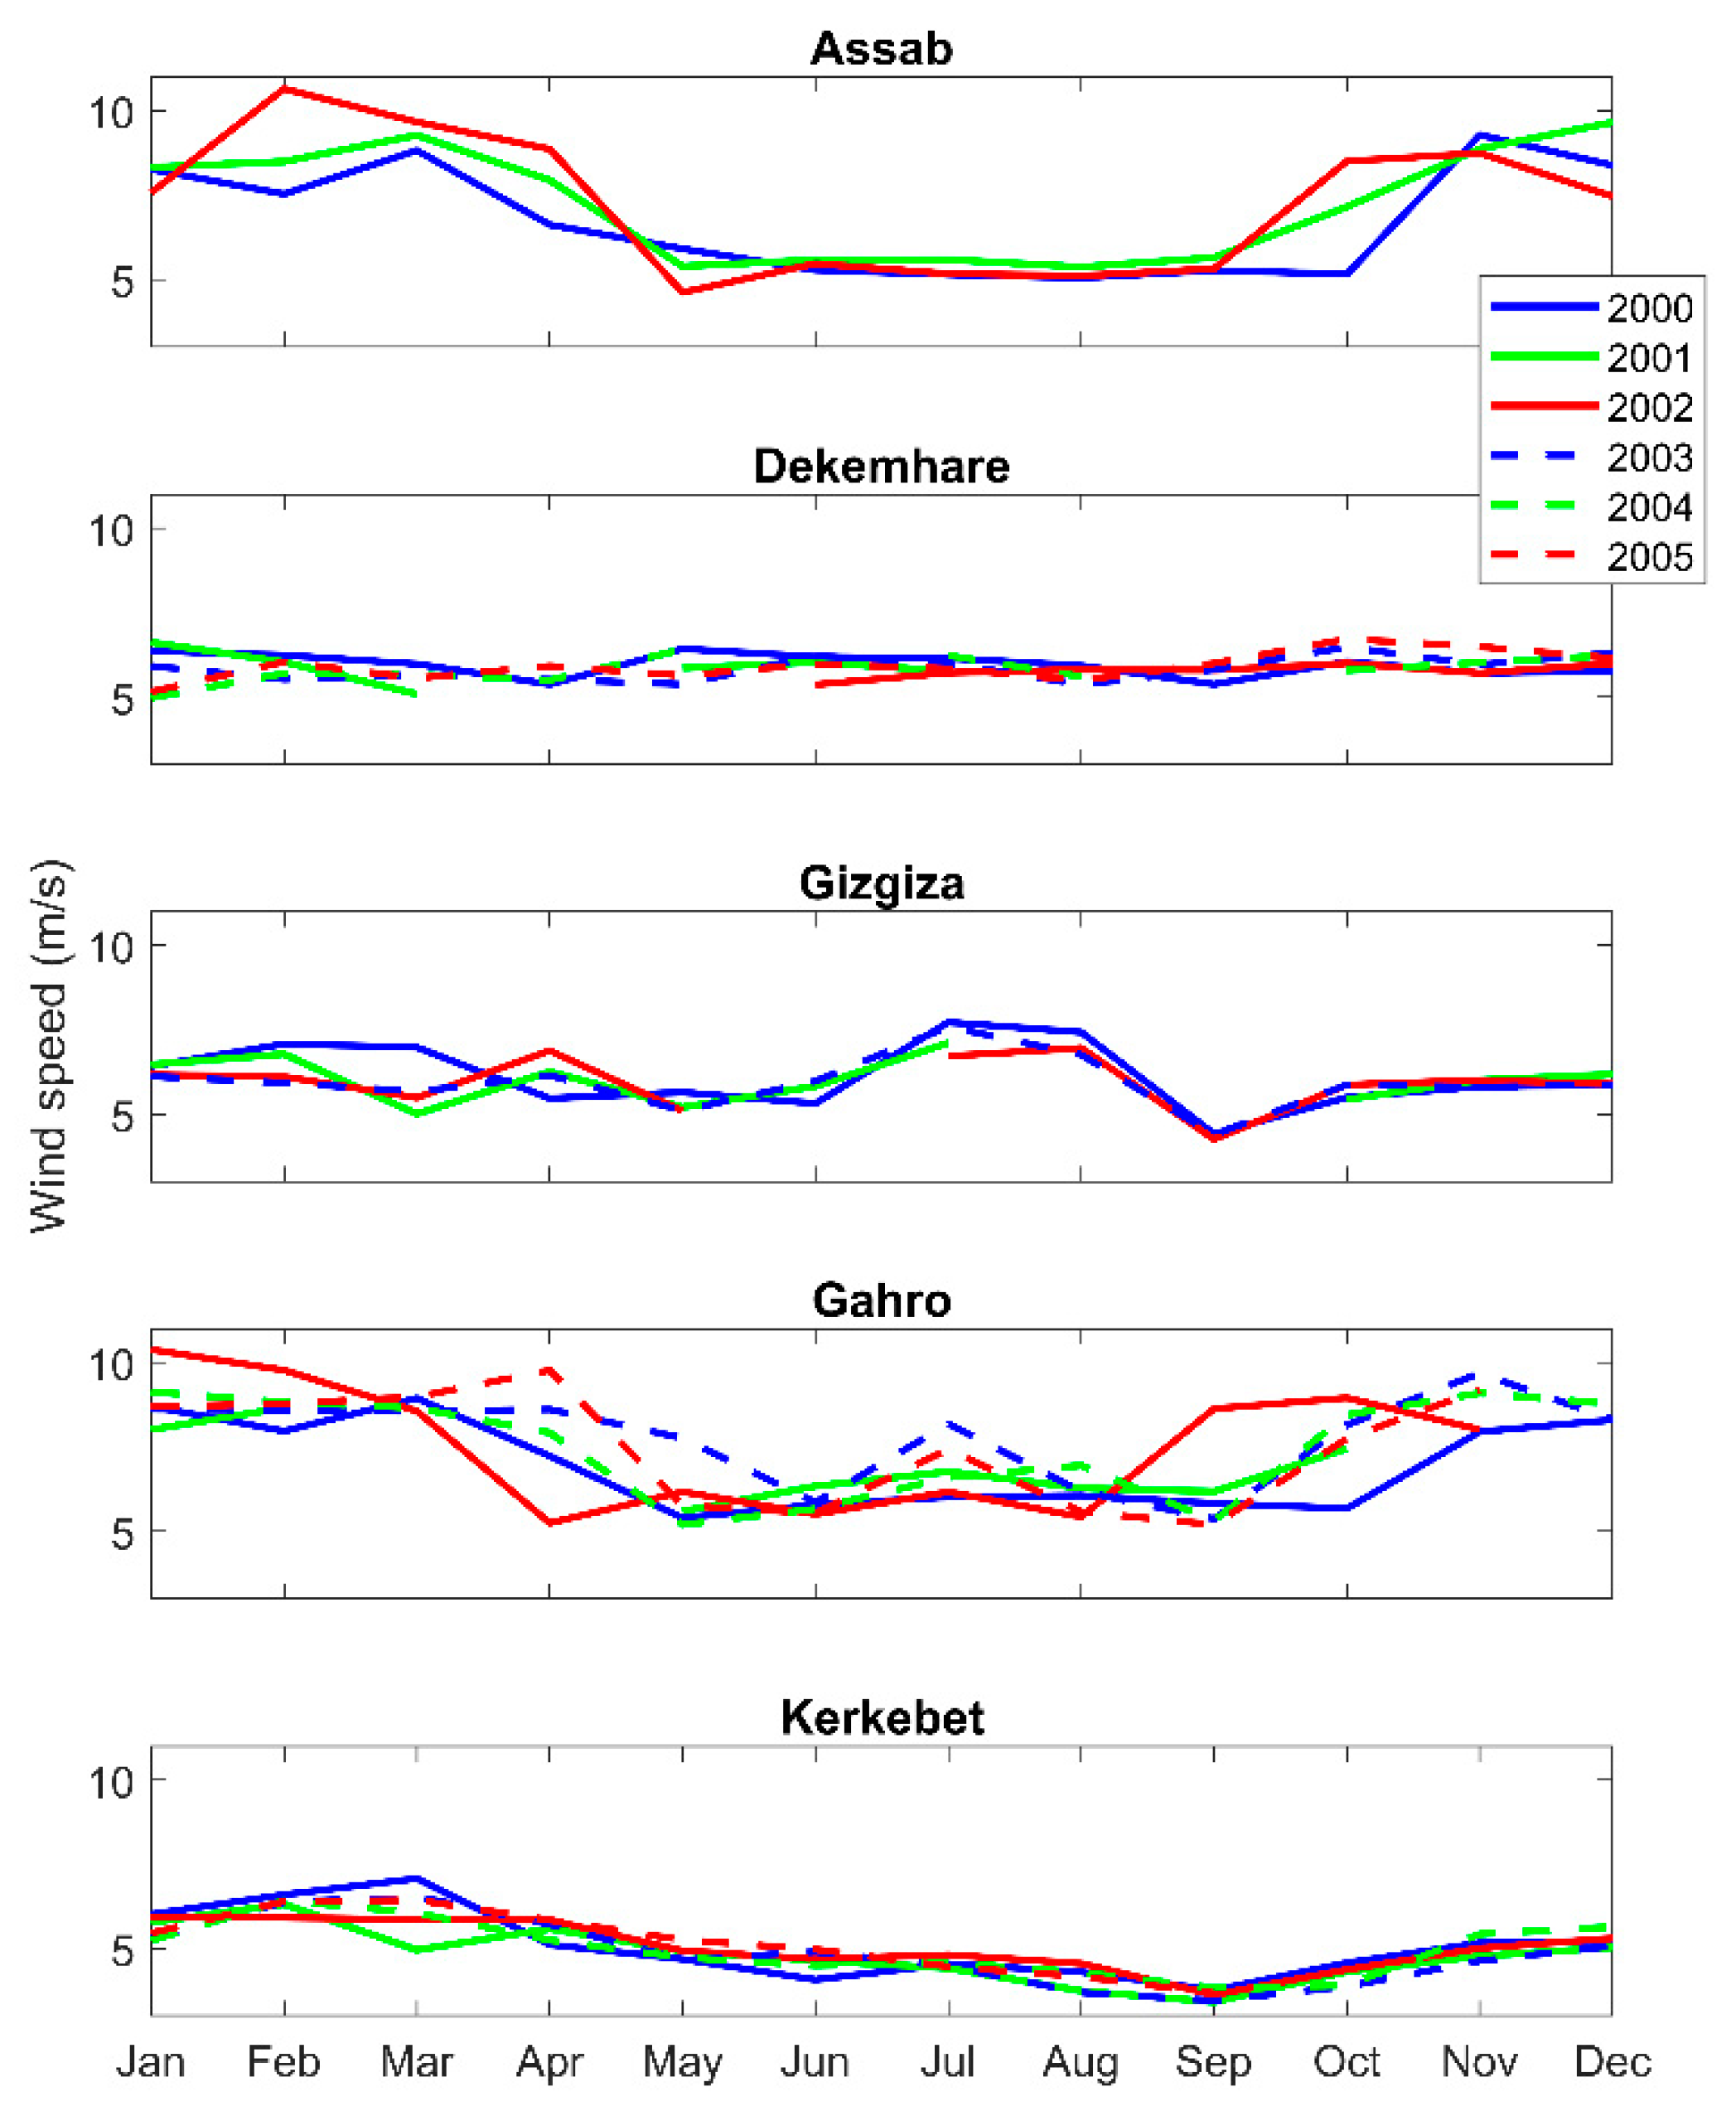
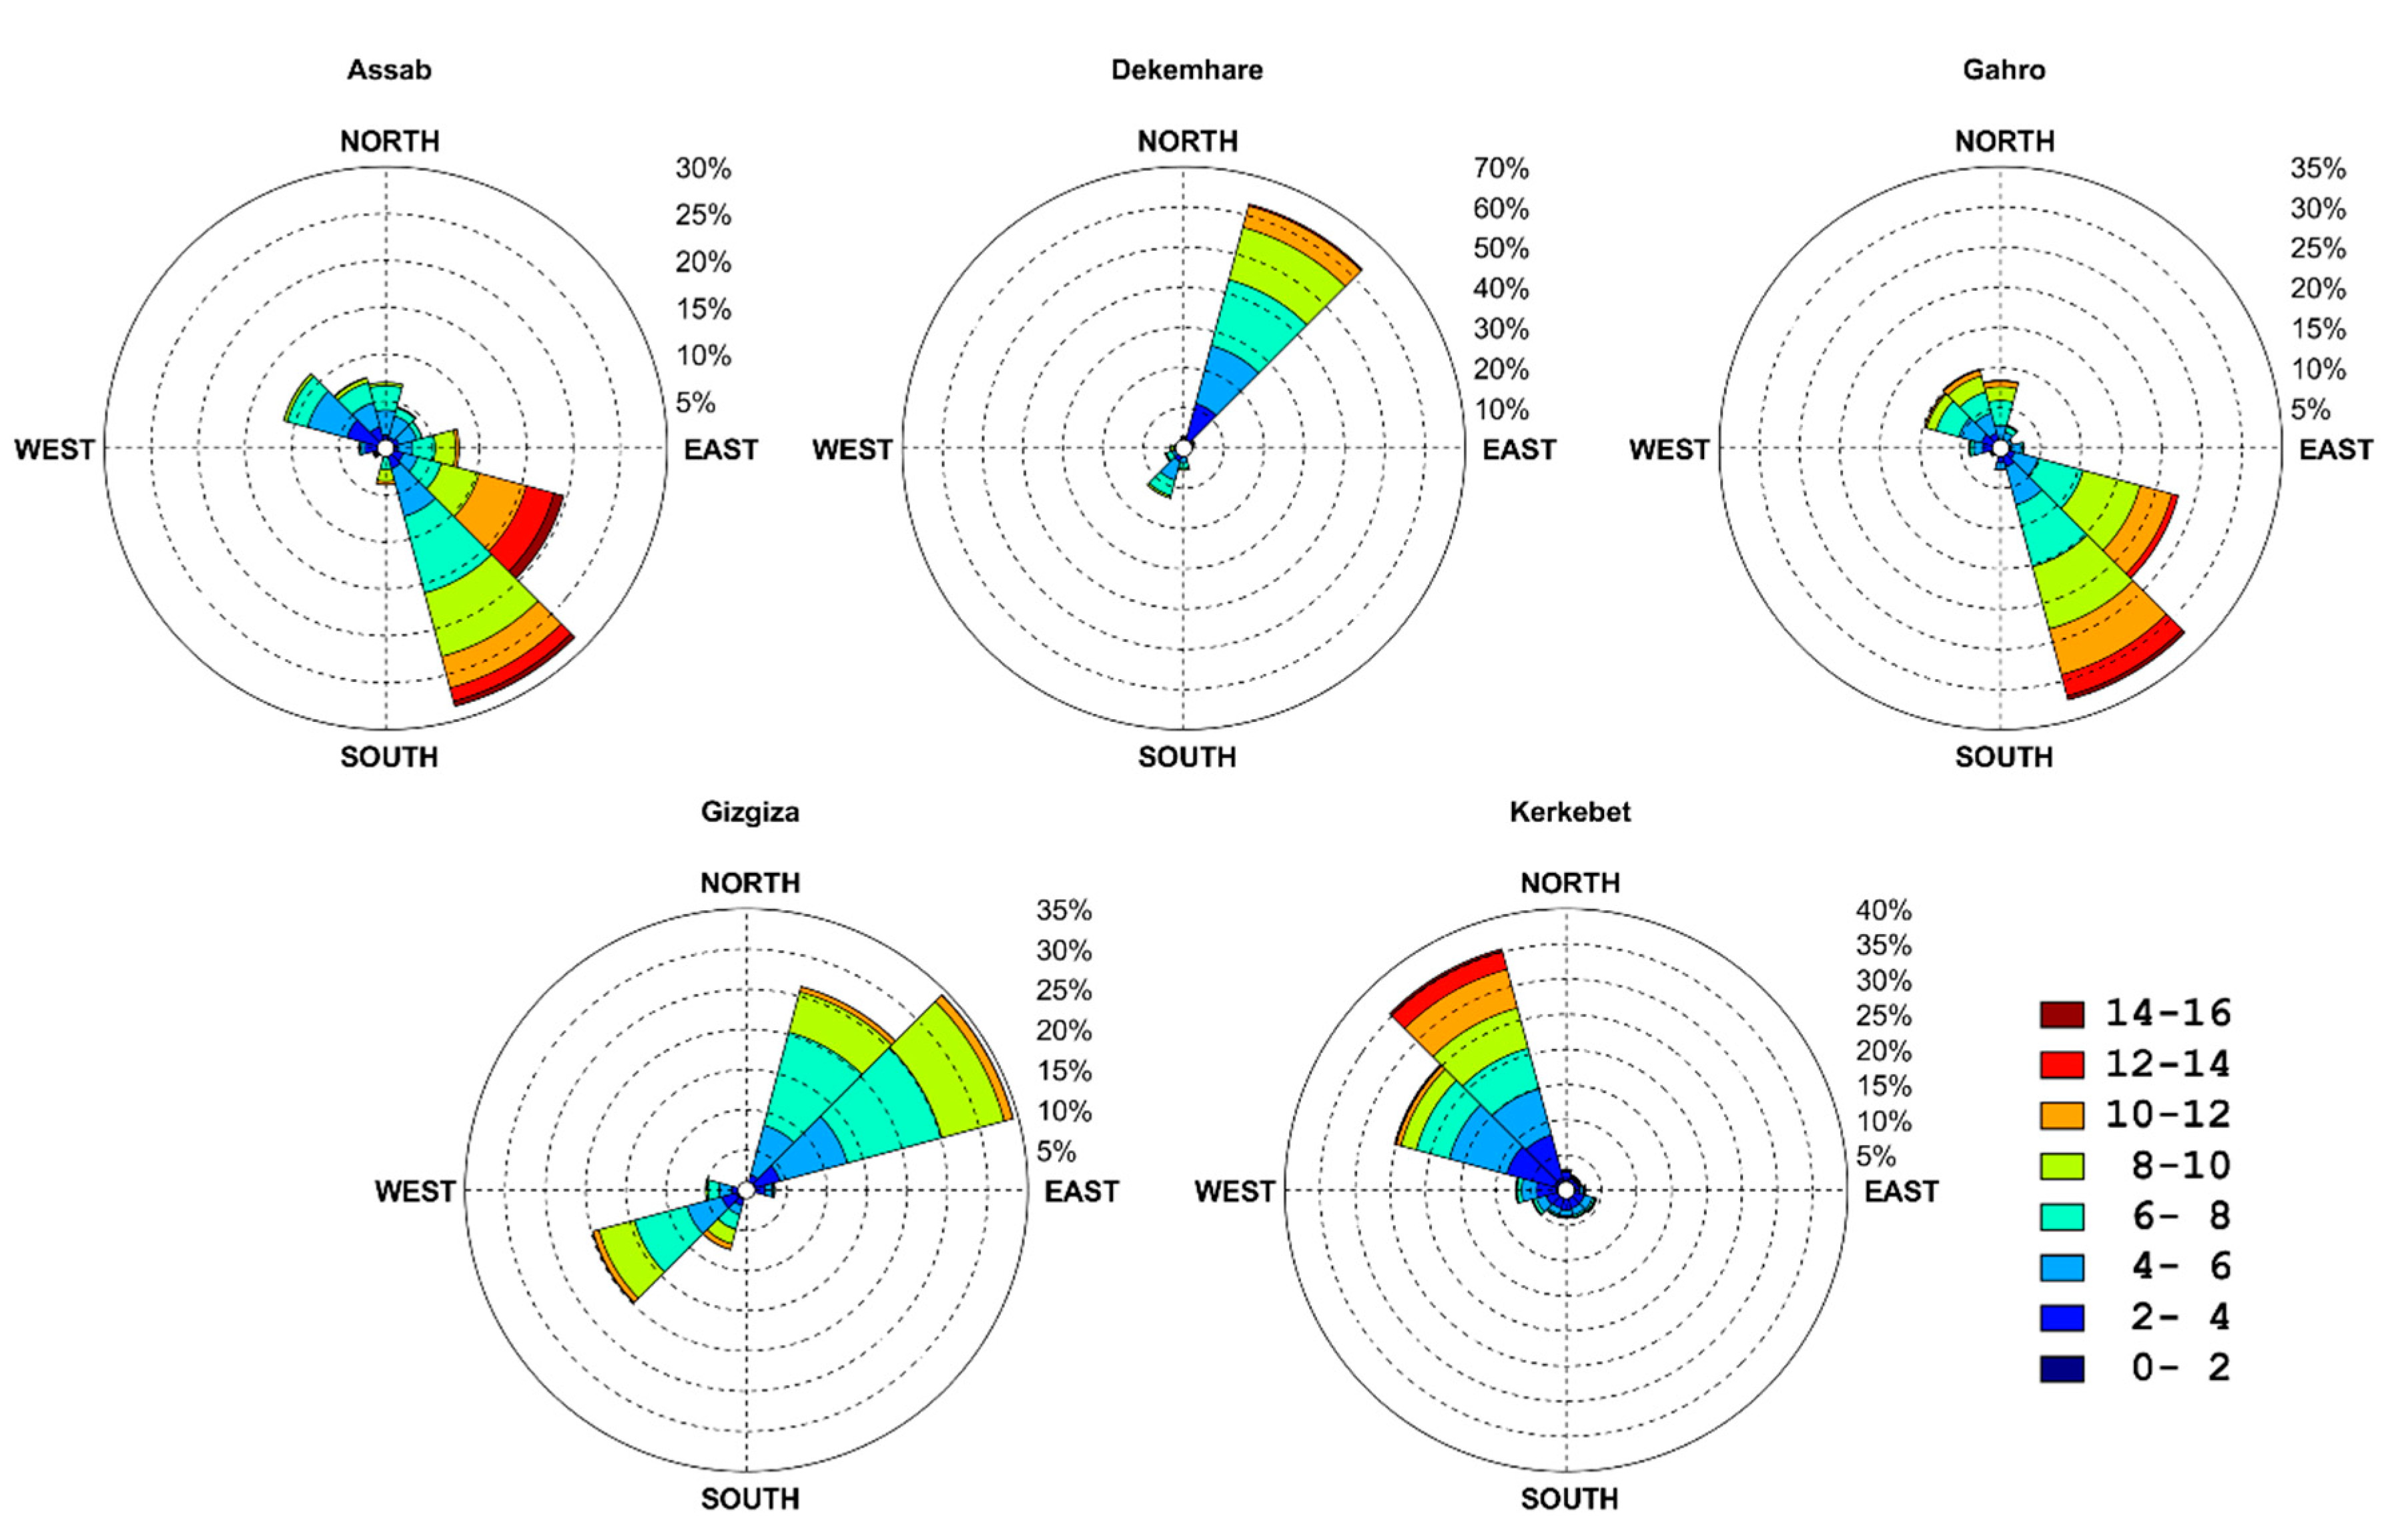
Being only a short distance from one another, Assab and Gahro have a similar seasonal variation with the highest wind speed in the period November–March. Dekemhare, Gizgiza, and Kerkebet, on the other hand, do not show any strong seasonal patterns, indicating that the coastal region has stronger seasonal variations than the central highlands. In Figure 6, the mean wind speed per month for the years 2000–2005 for these five potential sites are presented. It can be seen that the mean wind speeds and seasonal patterns recur for these sites and, to a large extent, are consistent with that of the year 2000. It can be noted that Nakfa has the same mean wind speed for 10 m and 30 m, and this is probably due to the local topography with the measurement mast being placed in a hilly landscape. In Figure 7, wind roses displaying the distribution of wind directions for the year 2000 for the five most potential sites can be seen. Notably, the coastal region sites Assab and Gahro both stand out, with strong southeastern patterns due to the wind following the Red Sea coast from the Bab-El-Mandeb strait, as clearly shown in [12]. The central highland sites Dekemhare and Gizgiza have northeastern patterns, while the western lowland site, Kerkebet, has northwestern patterns. Prevailing wind directions for all 25 sites can be seen in Table 2.
The wind distribution is shown for Gahro and Gizgiza in Figure 8. It can be noted that, for Gahro, the distribution follows the corresponding fitted Weibull distribution relatively closely, which is also the case for most of the other sites (not shown). However, the distribution of the Gizgiza site deviates somewhat from the corresponding Weibull fitted distribution. This is due to a sometimes-strong diurnal pattern with lower wind speeds during the night. Inspired by [22], an attempt was made to capture this pattern by doing one separate Weibull fit to the night periods showing a mean speed below 3 m/s (for data inspection, the night periods are considered to last 10 h starting at 11 a.m.). These low-speed night periods constitute 9.3% of the total data for Gizgiza, providing a Weibull fit of k = 1.3 , and c = 2.1 m/s. The fit for the rest of data is k = 3.4 , and c = 7.3 m/s. The resulting modified (combined) Weibull distribution is shown in Figure 8, and the energy density based on this distribution is calculated to be 507 W/m2, only slightly lower than the one shown in Table 2, which is based on the simple Weibull fit. Hence, the given Weibull parameters in Table 2 can be used to roughly estimate the production from wind farms at all of the sites.
Besides using the results from this study to map suitable areas for wind power, it can also be used to assess wind turbine noise if wind turbines were to be erected at the studied sites, for example, with the methods proposed in [23,24]. Noise is one of the most impactful environmental aspects limiting the growth of wind power, but it can be handled through proper wind farm layout [25,26], or possibly by using the more quiet vertical axis wind turbine technology in the future [27,28].
It should also be noted that a large expansion of wind power in a small developing country as Eritrea will be challenging for the stability of the electrical grid, due to the variable production. It is likely that various measures will be needed, including concepts such as electricity storage, load management, and wind forecasting. It would be interesting to study the potential of AI-based forecasting [29,30] in this context.

5. Conclusions

The wind energy potential and wind characteristics for 25 sites distributed over Eritrea was presented. The best sites for wind power installations were found in the coastal region, especially for the southern part of the country, near the mouth of the Red Sea. Good sites can also be found in parts of the central highland region. It should be noted that, aside from the measured sites, good wind sites are likely to be found in all regions, especially in the central highlands when focusing on mountain ridges. Since there is an uncertainty, due to extrapolating the wind speed from the 10-m measurements, more in-depth analyses should be performed before planning for the erection of wind turbines at any of the studied sites. For the good sites, the seasonal variations are most prominent in the coastal region with a peak during the period November–March. The variation over different years are generally found to be small. Comparing results from measurements with values from GWA, both the mean wind speed and wind power density are typically higher for the measurements. The difference is especially large for the more complex-terrain central highland sites where GWA results, as well as the extrapolation of the wind speeds, becomes more uncertain. The result of this study can be used to make preliminary assessments on possible power production potential at the given sites.

Author Contributions

T.N. analyzed the measured wind data, helped with interpreting the results and wrote the first draft of the paper. E.M. and F.O. were main responsible for interpreting the results as well as writing the final version of the paper. All authors have read and agreed to the published version of the manuscript.

Funding

This research received no external funding.

Acknowledgments

The authors highly acknowledge the Department of Energy at the Ministry of Energy and Mines of Eritrea for the allowance to use the wind data which this paper is based on.

Conflicts of Interest

The authors declare no conflict of interest.

References

  1. Kaldellis, J.K.; Zafirakis, D. The wind energy (r) evolution: A short review of a long history. Renew. Energy 2011, 36, 1887–1901. [Google Scholar] [CrossRef]
  2. Möllerström, E.; Gipe, P.; Beurskens, J.; Ottermo, F. A historical review of installed vertical axis wind turbines rated 100 kW and above. Renew. Sustain. Energy Rev. 2019, 105, 1–13. [Google Scholar] [CrossRef]
  3. Möllerström, E. Wind Turbines from the Swedish Wind Energy Program and the Subsequent Commercialization Attempts—A Historical Review. Energies 2019, 12, 690. [Google Scholar] [CrossRef] [Green Version]
  4. GWEC Global Wind Report 2018; Global Wind Energy Council: Brussels, Belgium, 2018.
  5. World Energy Outlook 2018; International Energy Agency (IEA): Paris, France, 2018; Available online: https://www.iea.org/reports/world-energy-outlook-2018 (accessed on 9 April 2020).
  6. Mukasa, A.D.; Mutambatsere, E.; Arvanitis, Y.; Triki, T. Development of Wind Energy in Africa; Working Paper Series; No 170; African Development Bank Group: Tunis, Tunisia, March 2013. [Google Scholar]
  7. Mulugetta, Y.; Drake, F. Assessment of solar and wind energy resources in Ethiopia. II. Wind energy. Sol. Energy 1996, 57, 323–334. [Google Scholar] [CrossRef]
  8. Drake, F.; Mulugetta, Y. Assessment of solar and wind energy resources in Ethiopia. I. Solar energy. Sol. Energy 1996, 57, 205–217. [Google Scholar] [CrossRef]
  9. Rosen, K.; Van Buskirk, R.; Garbesi, K. Wind energy potential of coastal Eritrea: An analysis of sparse wind data. Sol. Energy 1999, 66, 201–213. [Google Scholar] [CrossRef]
  10. Van Buskirk, R.; Garbesi, K.; Rosen, K. Wind resource assessment of Eritrea, Africa: Preliminary results and status. J. Wind Eng. Ind. Aerodyn. 1998, 74, 365–374. [Google Scholar] [CrossRef]
  11. Mentis, D.; Hermann, S.; Howells, M.; Welsch, M.; Siyal, S.H. Assessing the technical wind energy potential in Africa a GIS-based approach. Renew. Energy 2015, 83, 110–125. [Google Scholar] [CrossRef]
  12. Langodan, S.; Viswanadhapalli, Y.; Dasari, H.P.; Knio, O.; Hoteit, I. A high-resolution assessment of wind and wave energy potentials in the Red Sea. Appl. Energy 2016, 181, 244–255. [Google Scholar] [CrossRef]
  13. Habtetsion, S.; Tsighe, Z. Energy sector reform in Eritrea: Initiatives and implications. J. Clean. Prod. 2007, 15, 178–189. [Google Scholar] [CrossRef]
  14. Wisse, J.A.; Stigter, C.J. Wind engineering in Africa. J. Wind Eng. Ind. Aerodyn. 2007, 95, 908–927. [Google Scholar] [CrossRef]
  15. Manwell, J.F.; McGowan, J.G.; Rogers, A.L. Wind Energy Explained: Theory, Design and Application; Wiley: Chichester, UK, 2010. [Google Scholar]
  16. Seguro, J.; Lambert, T. Modern estimation of the parameters of the Weibull wind speed distribution for wind energy analysis. J. Wind Eng. Ind. Aerodyn. 2000, 85, 75–84. [Google Scholar] [CrossRef]
  17. Floors, R.; Nielsen, M.J.E. Estimating Air Density Using Observations and Re-Analysis Outputs for Wind Energy Purposes. Energies 2019, 12, 2038. [Google Scholar] [CrossRef] [Green Version]
  18. Solomon, K. Wind and Solar Monitoring Network Summary Report (Internal Report); Ministry of Energy and Mines, Department of Energy ERTC: Asmara, Eritrea, 2006. [Google Scholar]
  19. Langodan, S.; Cavaleri, L.; Vishwanadhapalli, Y.; Pomaro, A.; Bertotti, L.; Hoteit, I. The climatology of the Red Sea–part 1: The wind. Int. J. Clim. 2017, 37, 4509–4517. [Google Scholar] [CrossRef]
  20. Tesfagiorgis, M.G. Eritrea; ABC-CLIO: Santa Barbara, CA, USA, 2010. [Google Scholar]
  21. Global Wind Atlas v.3.0. Available online: https://globalwindatlas.info/ (accessed on 30 October 2019).
  22. Ragnarsson, B.; Oddsson, G.; Unnthorsson, R.; Hrafnkelsson, B.J.E. Levelized cost of energy analysis of a wind power generation system at burfell in iceland. Energies 2015, 8, 9464–9485. [Google Scholar] [CrossRef]
  23. Gallo, P.; Fredianelli, L.; Palazzuoli, D.; Licitra, G.; Fidecaro, F. A procedure for the assessment of wind turbine noise. Appl. Acoust. 2016, 114, 213–217. [Google Scholar] [CrossRef]
  24. Fredianelli, L.; Gallo, P.; Licitra, G.; Carpita, S. Analytical assessment of wind turbine noise impact at receiver by means of residual noise determination without the wind farm shutdown. Noise Control. Eng. J. 2017, 65, 417–433. [Google Scholar] [CrossRef]
  25. Yamanidouzisorkhabi, S.; Romero, D.; Yan, G.K.; Gu, M.D.; Moran, J.E.; Morgenroth, M.; Amon, C. The impact of land use constraints in multi-objective energy-noise wind farm layout optimization. Renew. Energy 2016, 85, 359–370. [Google Scholar] [CrossRef]
  26. Mittal, P.; Mitra, K.; Kulkarni, K. Optimizing the number and locations of turbines in a wind farm addressing energy-noise trade-off: A hybrid approach. Energy Convers. Manag. 2017, 132, 147–160. [Google Scholar] [CrossRef]
  27. Möllerström, E.; Ottermo, F.; Hylander, J.; Bernhoff, H. Noise emission of a 200 kW vertical axis wind turbine. Energies 2016, 9, 19. [Google Scholar] [CrossRef] [Green Version]
  28. Ottermo, F.; Möllerström, E.; Nordborg, A.; Hylander, J.; Bernhoff, H. Location of aerodynamic noise sources from a 200kW vertical-axis wind turbine. J. Sound Vib. 2017, 400, 154–166. [Google Scholar] [CrossRef]
  29. Zeng, Y.-R.; Zeng, Y.; Choi, B.; Wang, L.J.E. Multifactor-influenced energy consumption forecasting using enhanced back-propagation neural network. Energy 2017, 127, 381–396. [Google Scholar] [CrossRef]
  30. Wang, L.; Hu, H.; Ai, X.-Y.; Liu, H.J.E. Effective electricity energy consumption forecasting using echo state network improved by differential evolution algorithm. Energy 2018, 153, 801–815. [Google Scholar] [CrossRef]
Figure 1. Map with the wind sites studied in this work, marked out. Red markers represent sites in the coastal region, blue markers the western lowland and green markers the central highlands. For site numbering, see Table 1.
Energies 13 01846 g001
Figure 2. The relation between values calculated from measurements and GWA values. Note that the wind power density E is for 100 m above ground and the wind speed is for 10 m above ground.
Energies 13 01846 g002
Figure 3. Mean wind speed per month for the year 2000 for the central highland sites.
Energies 13 01846 g003
Figure 4. Mean wind speed per month for the year 2000 for the coastal region sites. Note that the April mean value is missing for Idi (12 days of data are missing).
Energies 13 01846 g004
Figure 5. Mean wind speed per month for the year 2000 for the western lowland sites.
Energies 13 01846 g005
Figure 6. Mean wind speed per months for years 2000–2005 for the five sites deemed as most potential. Months with insufficient data are left out.
Energies 13 01846 g006
Figure 7. Wind roses for the year 2000 for the five sites deemed as most potential.
Energies 13 01846 g007
Figure 8. Distribution of the wind speeds for Gahro and Gizgiza for the year 2000. The distribution based on the fitted Weibull parameters are also indicated. For Gizgiza an additional modified Weibull fit is indicated, where high and low wind speed periods are singled out and fitted separately.
Energies 13 01846 g008
Table 1. Location of the studied wind sites. “Map no.” refers to the site location in Figure 1. The roughness length z 0 is visually estimated. The mentioned wind speed (10 m above ground) and wind power density E (100 m above ground) is from the Global Wind Atlas (GWA) v3.0 [21].
RegionMap No.SiteLatLongAlt. (m) z 0   ( m ) v ¯ 10   ( m / s ) E (W/m2)
Western lowland1Aligedir15°7.32′ N36°34.73′ E7580.13.5175
2Kerkebet16°3.53′ N37°25.89′ E4500.013.5275
3Agordet15°33.12′ N37°52.55′ E6330.05<2.5100
4Keren15°46.64′ N38°28.27′ E14000.25<2.5100
Central highland5Adobha17°7.42′ N38°14.03′ E18700.054.0450
6Nakfa16°39.00′ N38°24.00′ E26900.34.25225
7Gizgiza16°0.24′ N38°30.71′ E11800.053.5225
8Debresina15°45.28′ N38°42.29′ E22100.256.5500
9Embatkala15°23.83′ N39°4.37′ E13610.15<2.5125
10Asmara ERTC15°21.48′ N38°53.46′ E22300.053.25125
11Asmara Airport15°17.52′ N38°54.23′ E23250.153.0125
12Dekemhare15°4.82′ N39°3.12′ E20000.14.75150
13Halay15°1.19′ N39°19.18′ E27000.053.5150
14Kohiato14°53.97′ N39°24.58′ E26000.14.5275
15Areza14°54.79′ N38°33.83′ E20290.033.5200
16Maileham14°41.86′ N38°43.42′ E19800.053.75150
Coastal region17Hashmet17°44.15′ N38°44.14′ E100.0054.5250
18Dahlak15°44.70′ N39°59.55′ E30.0053.0125
19Massawa15°39.30′ N39°28.35′ E50.013.075
20Ingel15°8.15′ N39°51.86′ E600.033.0125
21Tio14°40.75′ N40°57.70′ E00.0054.0225
22Bada14°33.25′ N40°7.92′ E−900.13.25250
23Idi13°55.78′ N41°41.27′ E100.014.25350
24Assab Airport13°1.60′ N42°38.94′ E00.036.0700
25Gahro12°47.47′ N43°4.24′ E300.036.0750
Table 2. Wind speed and characteristics based on measured wind data for the year 2000. Note that v ¯ 30 measurements only were available for five sites. All parameters are based on the v ¯ 10 values including the wind power density E which is recalculated for 100 m.
RegionMap No.Site v ¯ 10   ( m / s ) v ¯ 30   ( m / s ) E (W/m2)std k c Prev. Dir.
Western lowland1Aligedir3.064.00921.472.183.46N
2Kerkebet5.20 4223.161.705.81NW
3Agordet2.48 551.331.712.76SW, NW
4Keren4.60 3792.262.15.2NE
Central highland5Adobha4.11 1802.12.024.62NE
6Nakfa4.874.876153.421.515.45SE, NW
7Gizgiza6.14 5232.482.586.85NE
8Debresina3.98 2311.931.884.38NE
9Embatkala3.80 3762.61.264.11NE, SE
10Asmara ERTC3.27 891.741.953.67NE
11Asmara Airport3.314.891181.751.913.72NE
12Dekemhare5.97 5312.602.466.74NE
13Halay4.33 1471.632.854.86NE
14Kohiato5.11 2972.172.535.73NE, SE
15Areza5.16 2952.442.215.80E, NW
16Maileham5.07 3552.751.945.74NE, SW
Coastal region17Hashmet4.74 2662.501.985.34NW, SE
18Dahlak4.30 2002.261.974.85N
19Massawa3.66 1251.852.054.11NE
20Ingel3.85 1782.041.924.32N
21Tio4.455.032202.341.995.02NE, SE
22Bada4.22 3362.591.714.70N
23Idi4.60 3362.921.605.13NE, SE
24Assab Airport6.727.518403.202.177.53SE
25Gahro6.91 8342.972.507.80SE