Abstract
To effectively guarantee a secure and stable operation of a smart substation, it is essential to develop a relay protection system considering the real-time online operation state evaluation and the risk assessment of that substation. In this paper, based on action data, defect data, and network message information of the system protection device (PD), a Markov model-based operation state evaluation method is firstly proposed for each device in the relay protection system (RPS). Then, the risk assessment of RPS in the smart substation is carried out by utilizing the risk transfer network. Finally, to highly verify the usefulness and the effectiveness of the proposed method, a case study of a typical 220 kV substation is provided. It follows from the case study that the developed method can achieve a better improvement for the maintenance plan of the smart substation.
1. Introduction
As the core part of a typical power grid, transmission and distribution substations play an important role in delivering high-quality power to the consumers and controlling the power flow. In order to adapt to the development of high-voltage levels and long-distance transmissions technologies, smart substations have made rapid developments in China. Nowadays, with the increase in power grids’ voltage levels, the corresponding technical parameters of the primary equipment should be improved accordingly [1,2]. As a result, their costs are greatly increased as well. Therefore, to guarantee a secure, safe, and stable operation of the primary equipment, there is a persistent necessity to carry out risk assessment for the operation status of relay protection systems (RPSs) [3,4,5,6,7,8,9].
In recent years, risk assessment of the operation status of RPSs has become a hot research topic, and many results have been developed. Generally speaking, there are roughly two kinds of assessing methods. One kind is the simulation method, such as Monte Carlo simulation [10,11,12,13,14], which is mainly utilized to get reliability indices through statistical analysis and stochastic sampling of the assumed probabilistic distribution, where this kind of method is intuitive [15]. The other kind is the analytic methods, such as Markov model analysis [16,17,18,19,20,21,22,23,24,25], neural networks [26,27,28,29,30,31,32], fault trees [33,34,35,36,37], etc., which are typically applied to develop a probabilistic model with the information of the construction, the function, or the logic relationship of the considered object and calculate the reliability indices by iteration. For these methods, the physical concept is clear and the accuracy is guaranteed, where, in some cases, the calculation burden increases rapidly with the increasing of the system scale. For a relay protection system, considering the strong correlation between the state transition mechanism of the risk assessment method and the change in its operation state mechanism with time, the state assessment of RPS based on the Markov model has become a popular method for the secondary system’s state assessment in a smart substation. In [21], the Markov model was utilized to evaluate the RPS’s reliability in operation state, where the protection system was divided into two parts (main and backup) for reliability evaluation. In [22], the protection system was divided into specific functions to study the reliability of the secondary system in a defined smart substation, where aiming to realize the state maintenance, a Markov model was proposed to obtain the secondary system’s state evaluation by calculating its reliability index. However, it should be pointed out that, in [21,22], Markov models were used to analyze the protection system’s reliability, whereas none of the devices involved in the protection function’s realization were evaluated; in the actual application, the operation state of each device should be paid more attention, which would affect the whole protection system’s reliability.
Furthermore, in [23], regarding the short-term reliability analysis of RPS and considering the resulted errors in the conventional equivalence algorithms, a new method based on the semi-Markov process was presented to assess the aggregated system. In [24], a Markov model was developed to evaluate the protection devices’ state with a secondary message as the data source, then the GO method was implemented to perform the reliability analysis of the RPS. However, it should be pointed out that, in the above-mentioned results, the state of protection devices (PDs) and each protection function could be evaluated, while only the network message was taken to evaluate the operation state of the device, which would thus affect the accuracy of the evaluation results. Besides, the operation risk of the protection system was not analyzed in detail. Based on the literature addressed in this paper, it is noticed that only a few results considered the risk loss of primary equipment caused by the operation risk of the secondary system. Moreover, only a few studies considering risk assessment for smart substation relay protection were found based on the Markov model and the risk transfer network, which are the main motivations of this research.
Therefore, based on the above discussions, in order to overcome the addressed problems, by combining the Markov model and the risk transfer network together, a new risk assessment method for RPS of the smart substation is proposed. Based on the action data, the defect data, and the network message information, the operation status of each device of the protection system can be evaluated by the Markov model. Then, the status and the risk of the secondary system for the smart substation can be assessed by utilizing the risk transfer network. The main contributions of the current research can be highlighted as follows:
- By combining the Markov model and the risk transfer network together, an effective risk assessment method is proposed for the smart substation’s RPS;
- The operation states and the risk losses of all the devices in the protection system are fully discussed by using the Markov model;
- The risk losses of the bus protection system, the main transformer protection system, and the line protection system are analyzed. After that, the risk of the whole protection system is evaluated by risk with the transfer network;
- The proposed state evaluation and risk evaluation approach can increase the provided theoretical support to the state maintenance of the smart substation.
The remaining sections of this paper are arranged as follows. The basic state evaluation of RPS model is introduced in Section 2, and the operation status method based on the Markov model is also presented is this section. In Section 3, by combining the complex network and the risk transfer network, a new state rating and the protection system’s risk assessment is proposed. A case study utilizing a typical 220 kV smart substation is provided in Section 4 to verify the usefulness as well as the effectiveness of the proposed method. Some necessary discussions are presented in Section 5. Finally, the conclusions of the paper are outlined in Section 6.
2. State Evaluation of Relay Protection Device and Markov Model
Generally speaking, the typical connection mode of a 220 kV bus in a smart substation is shown in Figure 1, including line, bus connection, main transformer, and bus interval. For the smart substation adopting the so-called network acquisition and the network jump approach, the relay PD and the intelligent station auxiliary device in the protection system are composed. The smart station auxiliary device mainly includes combination unit, intelligent terminal, network switch, etc.
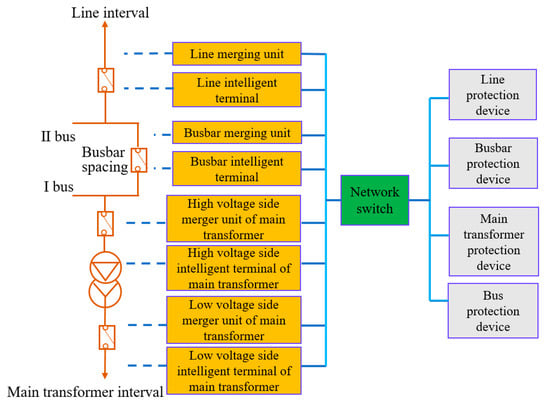
Figure 1.
Protection device (PD) configuration of a typical connection mode of a 220 kV bus.
In a smart substation, and in order to achieve the secondary equipment’s state evaluation and risk evaluation, it is necessary to evaluate the failure rate of all devices shown in Figure 1. In this paper, the devices with the same hardware structure and function are classified, which requires one to find out the failure rate of bus PD, line PD, main transformer PD, network switch, merging unit, and intelligent terminal device. In this paper, the evaluation method based on the Markov model is utilized to perform the failure rate analysis of the above seven types of PDs.
After that, the Markov model is established. The Markov model is developed in this paper to model the operation state of each PD in the RPS. When evaluating the PD’s operation state, the prediction state is only affected by the current state and has no direct connection with the historical state. Therefore, it is usually utilized for reliability analysis of the protection system. For the general Markov theory [38], one can get:
which meets the following conditions:
The transfer density matrix (A) is defined as:
which meets the following condition:
Define the row vector of Markov dynamic probability as:
where the sum of all elements in (5) is 1, it follows from (3) and (5) that:
According to the characteristics of the Markov model, when time t approaches infinity, Markov dynamic probability tends to be stable:
It follows from (7) that the Markov steady state probability P(∞) can be obtained.
Next, the defined PD status assessment is introduced. The state of a PD is reflected by the reliability index. The selection of the reliability index needs the basic reliability data support. With the rapid development of the smart substation technology, the sensing means of the secondary equipment is more and more abundant. In addition, the basic data of the traditional substation, such as the fault information management system, the inspection and maintenance report, and the on-site operation and maintenance information, can reflect the real operation of the equipment row status. Regarding the selection of reliability index, the following three-state progressive model is adopted, which is illustrated in Figure 2.
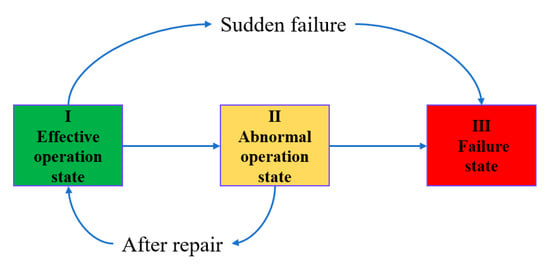
Figure 2.
Three-state progressive model.
It can be seen from Figure 2 that there are two reasons for the failure of the PD. One is that the device is abnormal and has not been repaired in time, resulting in the failure of the device function; the other is that the sudden failure directly leads to the failure of the device function. Moreover, the abnormal state of the PD can be divided into two kinds. One is the abnormal condition of the PD, which is detected by the monitoring system or manual operation inspection, and then it can be repaired to normal operation state; the other is the disability to find the abnormal condition of the device, which in turn causes the PD failure after time accumulation.
There are many factors that affect the PD’s effective operation state. Without loss of generality, the PD involved in this paper mainly considers the following main factors: hardware, software, external loop, and communication. The relationship diagram of each state of the device is shown in Figure 3, in which ES0 represents the effective operation state of the device. AS1, AS2, and AS3 are abnormal operation conditions of hardware, software, external circuit, and communication of the PD and are found by monitoring, respectively. AS4, AS5, and AS6 are abnormal operation conditions of hardware, software, external circuit, and communication of the PD but are not found by monitoring, respectively. IS7 is the failure operation condition of the device.
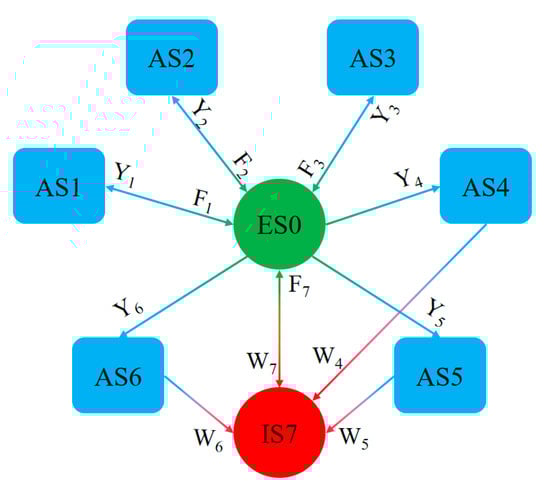
Figure 3.
State transition diagram of the device.
The probability of the PD to be abnormal and detected is called the dominant abnormal probability, which is given by:
The probability of the PD to be abnormal but not be detected is called the probability of hidden abnormality, which is given by:
where T is the cumulative running time of the protection system, n1, n2, and n3 are the times of hardware, software, external circuit, and communication abnormality of the PD detected by the monitoring system, and n4, n5, and n6 are the times of hardware, software, external circuit, and communication abnormality not detected by the monitoring system, respectively.
Probability of malfunction of the protection system is caused by abnormal operation of the PD (including malfunction and refusal), which is given by:
where nW4, nW5, and nW6 are respectively the times of failure of PD caused by hardware, software, external circuit, and communication abnormality of PD.
Probability of PD failure is caused by sudden failure, which is given by:
where nW7 is the number of PD failures caused by sudden failures.
The repair rate after abnormal protection function is formulated as:
where TF1, TF2, and TF3 are the average repair time of device hardware, software, external circuit, and communication abnormality, respectively.
Repair rate after failure of PD is given by:
where TF7 is the average repair time after the failure of the PD.
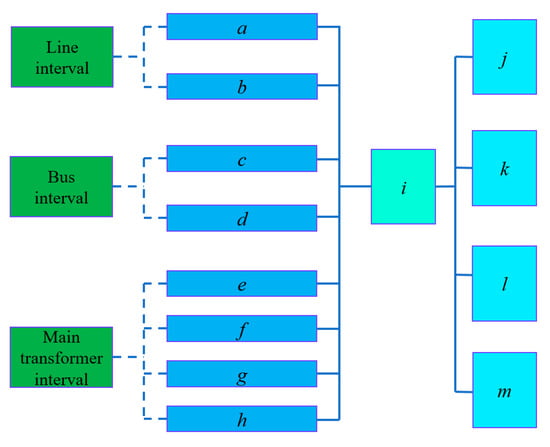
Figure 4.
Risk network diagram of substation protection system.
Following Equations (7), (14), and (15), the Markov steady state probability P(∞) can be obtained:
thus, the probability of three states of the protection system can be obtained as follows:
thus, PIS is the failure rate of the PD.
3. State Rating and Risk Assessment of Protection System
In the above section, based on the Markov model, the failure rate of every PD in the RPS is evaluated by using the state of PD. Aiming to reflect the operation state and the operation risk of the protection system more intuitively, in this section, by combining the complex network and the risk transfer network, a new state and risk assessment method for the protection system is proposed.
With the rapid development of smart substation technology, the secondary equipment forms the secondary system through different networks of the intelligent substation. The connection of the secondary system is much closer. The secondary system can be regarded as a network, thus the complex network theory can be implemented to evaluate the operation risk of the protection system. In general, the basic elements of a complex network include: network node, subject, directed edge, subject set, and degree. For convenience, the risk network diagram of the substation protection system is shown in Figure 4. In the following, the detailed explanations is presented.
- (a)
- Network node
In Figure 4, a, b, c……m is the network node in the complex network. For the 220 kV system PD, the double configuration should be equivalent to one node. Therefore, the PD, the merging unit, and the intelligent terminal in the protection system are all network nodes. In this paper, for the protection system network, the equipment of the smart substation network, such as switch, optical fiber, and hub, is equivalent to a node, which is the network node i depicted in Figure 4.
- (b)
- Agent
The network agent is defined as the network node that realizes a certain network function. For the line protection function, because the line merging unit participates in the completion of the line protection function, the line merging unit is a subject of the line protection function. The protection function subject on the network node n is recorded as Mni, where i is the degree of the subject function.
- (c)
- Agent set
The realization of each protection function in the protection system is completed by multiple agents in collaboration, thus all agents participating in the completion of the same network function are called subject set record as S.
- (d)
- Directed edges
Each protection function of the protection system is implemented by multiple subjects. Therefore, these subjects interact with each other through wired or wireless means, and the transmission of this information has a direction. Therefore, the directed information interaction between subjects is called the directed edge.
- (e)
- Degree
Define the number of items that the subject participates in completing the protection function as degrees, and record it as one. For example, the line merging unit participates in the completion of line protection and bus differential protection, thus the annual degree of line merging unit is two.
The risk transmission of the protection system denotes that the realization of a certain function of the protection system needs to be completed in series by all subjects in the subject set. If one of the subjects fails and the function cannot be realized, other subjects participating in the function’s subject set cannot be completed. Therefore, the risk transmission of the protection system is mainly transmitted from the subject to the subject set. The risk transfer of the subject is only transferred to the subject set in which the subject participates, and the risk transfer is instantaneous. For example, the main line protection function is completed by line merging unit, intelligent terminal, PD, network switch, etc. If the line merging unit fails, that is, the failure of line protection sampling leads to the failure of line protection function, but the risk of line merging unit failure is not transferred to the protection function of the bus and the main transformer.
Based on the above discussions, the risk assessment model of RPS is developed. The normal operation of substation RPS is the basis to ensure both stable and safe operation of the primary equipment and the power grid. The failure of RPS damages the corresponding primary equipment. Therefore, the failure of RPS function affects the secondary system itself and the primary equipment. Therefore, the total risk of a protection function subject set S of RPS is formulated as:
where R2 is the risk caused by the subject set S to the RPS; R1 is the primary equipment risk caused by the subject set S; PMi is the failure probability of the ith subject in the subject set S. The failure rate of the PD can be obtained by (17), CMi is the loss caused by the ith subject’s failure in the subject set S, and its value is quantified according to the maintenance cost of the equipment. n is the number of subjects of the subject set S. This paper considers that the loss of primary equipment caused by the protection system’s failure causes primary equipment loss only if all the protection functions of the primary equipment fail and the grid failure occurs at this time interval. P1 is the probability of primary equipment failure; C1 is the risk loss of primary equipment, and its access rule is based on the maintenance loss and the power failure loss of primary equipment; k is the number of nonrepetitive subjects in the subject set participating in the protection of primary equipment.
Substituting Equations (19) and (20) into Equation (18), the total risk of a protection function entity set S can be derived as:
Therefore, the risk of line protection function, bus coupling protection function, main transformer protection function, and bus differential protection function can be calculated by Equation (21). For the convenience, the risk assessment process for RPS of the smart substation based on the Markov model and the risk transfer network is depicted in Figure 5.
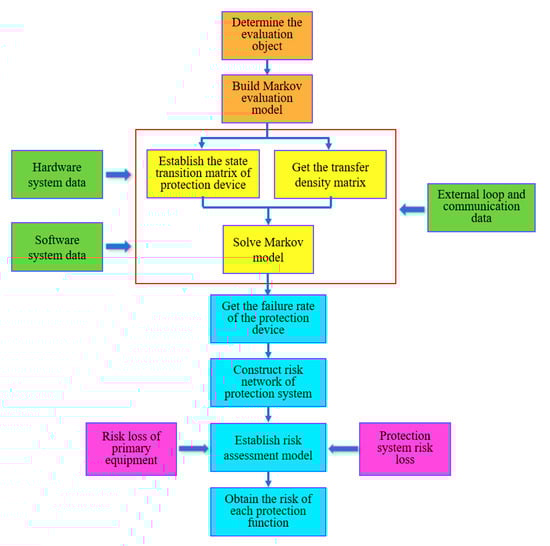
Figure 5.
Risk assessment process of relay protection system.
Remark 1.
It is worth noting that, in most of the existing results [10,13,14,21,22], the operation states and the risk losses of the devices in the protection system were not analyzed in detail, which would affect the accuracy of evaluation results. By using the proposed evaluation method, after fully analyzing the operation states and the risk losses of the devices in the protection system, the reliability evaluation of the whole protection system is expected to be improved compared to the existing results [10,13,14,21,22].
Remark 2.
Furthermore, after evaluating the operation states of each device, by using the risk transfer network, the risk losses of the bus protection system, the main transformer protection system, and the line protection system are analyzed in detail. Hence, the operation risk of the whole protection system can be evaluated, and the accuracy of evaluation results could be improved compared to [23,24,26].
4. Numerical Example
In this section, a typical 220 kV bus connection mode of a smart substation is taken as an example to evaluate the reliability and the risk of the RPS. The considered smart substation is located in the west of China, which is one of the typical smart substations. The operation and maintenance records, abnormal alarm information, and some other data of all secondary equipment of the protection system were archived for more than 5 years, which is useful for verifying the usefulness of the proposed assessment method. The bus connection mode and the protection configuration diagram are shown in Figure 1.
According to the PD configuration diagram of a typical wiring mode of a 220 kV bus, and according to operation and maintenance records, protection action statistics, abnormal alarm information, defect statistics, and other data information of all secondary equipment of the protection system composed of all lines, busbars, main transformers, and bus intervals of all smart substations in one province in China, the average value is taken and, according to the statistical data of abnormal information monitored by the state monitoring system of smart substation in this province, Table 1 shows the statistical data of abnormal operation time of the protection system in the actual operation process of the considered substation in this paper. According to (8), Y1, Y2, and Y3 denoting the statistical data of various abnormal operation time of the protection system in the actual operation process can be obtained. Assuming the successful detection probability of the secondary system in the considered substation is 90%, then the probability of Y4, Y5, and Y6 can be obtained.

Table 1.
State transition probability 1 (10−5h−1).
Furthermore, based on the statistical data of the system outage time caused by the mis-operation event of the protection system, and after analyzing the reasons for that mis-operation, it follows from (10) and (11) that the failure probability can be obtained, where W4, W5, and W6 show the failure probability caused by the continuous operation of the protection system when its abnormal operation is not detected, and W7 denotes the failure probability caused by the unexpected events of the protection system. The detailed values are presented in Table 2.
Table 2.
Failure probability of protection device (10−4h−1).
According to the abnormal handling records of the province’s smart substation, the repair time of all the secondary equipment is taken as a kind of unified archive, thus this paper unifies the abnormal repair probability of all the protection equipment. Hence, the average repair time of the PD hardware can be generally 12 h. The average repair time of software abnormality of PD is generally 8 h, the average repair time of external circuit and communication abnormality is 24 h, and the average repair time after failure of the PD system is 48 h. Thus, for the considered smart substation, based on the processing time data of different parts of the protection equipment and the operation data of the repair time after the protection system failure as well as the requirements of the secondary system’s maintenance time, by (12), the repair probability F1, F2, and F3 of the abnormal operation state of the protection system can be obtained by calculating the reciprocal of repair time, which means that the time it takes for the abnormal condition to be repaired after the device is abnormal and monitored. Then, combining with (13), similarly, the repair probability F7 of the device failure of the protection system can be finally obtained, which indicates the time it takes for the failure device to be repaired successfully. The detailed values are all illustrated in Table 3.
Table 3.
Repair probability of protection device (10−4h−1).
It follows from Table 1, Table 2 and Table 3—also considering Equations (7), (14), and (15)—that the Markov steady state probability P(∞) can be obtained; the detailed results in this case are listed in Table 4.
Table 4.
Steady state probability of protection device.
Based on the risk assessment process shown in Figure 5, the failure probability of each PD is calculated. Then, considering the risk network of the substation protection system, the agent set of each protection function is obtained; the detailed information is given in Table 5.
Table 5.
Composition of protection function agent set.
In Table 5, CMi denotes the self-loss caused by the ith subject’s failure in the subject set S, C1 is the risk loss of primary equipment, and its access rule is based on the primary equipment maintenance loss and power failure. In this paper, the primary equipment price is taken with reference to the average market price, while the replacement cost of protection equipment plug-ins is also taken with reference to the market plug-in replacement price. The utilized values are listed in Table 6.
Table 6.
Price and maintenance cost of primary and secondary equipment.
According to the statistical analysis report of protection actions of the province in 2019, the probability of line interval fault is 0.0005, the probability of grid fault of the main transformer interval is 0.00023, and the probability of bus fault is 0.0001. It follows from Equation (21) and Table 4, Table 5 and Table 6 that we can get the failure rate and the risk loss of the protection system, where the results are illustrated in Table 7 and Table 8, respectively.
Table 7.
Failure rate of protection system.
Table 8.
Risk loss of protection system.
Table 7 and Table 8 demonstrate the failure rate and the risk loss of each protection system calculated by the proposed method in this paper, where the risk loss size and the realization of the protection function of the general protection system are directly related to the number of PDs involved. The realization of bus protection requires the most protection equipment, followed by the protection of the main transformer. The PDs involved in line and bus joint protection are the same and are less than that of bus and main transformer.
Therefore, the secondary risk loss of bus protection is the highest in all protection systems, followed by the main transformer protection, and finally line and bus protection, according to Table 8 and the assessment results of the developed risk assessment method of an intelligent substation RPS based on the Markov model and the risk transfer network proposed in this paper. As is clearly indicated from the obtained results regarding the secondary risk loss caused by each protection system, the reason the secondary risk loss occurs (due to the line protection system being more than the loss that occurs because of the bus protection system) is that the bus protection system is only put into operation in the process of bus charging, and its actual operation time is less likely to fail, thus the secondary risk loss caused by it is smaller than that caused by the line.
In order to further highlight the contribution of the proposed method, some qualitative comparison results are provided in Table 9.
Table 9.
Comparison analysis with some existing results.
It follows from Table 9 that the proposed method not only considers the operation states and the risk losses of the devices in the protection system, but it also considers the risk loss of primary equipment caused by operation risk of the secondary system. Therefore, it can be seen from the evaluation results given in Table 8, the risk loss caused by the primary equipment protection system failure is much less than the loss of the secondary equipment itself, but it must be considered in the actual application. Hence, the risk loss that occurs by the protection system failure is fully considered, and thus the theoretical support regarding the condition-based maintenance realization of the smart substation is provided.
5. Discussions and Future Work
In this paper, first of all, through the comparative analysis of the existing operation risk assessment methods for the protection system—and taking into account the characteristics of the monitoring statistical data for the operation state of the secondary equipment under the actual site conditions as well as the requirements for the operation risk assessment object of the secondary system—an operation risk assessment method combining the Markov model and the risk transfer network is proposed. The special properties are summarized and highlighted as follows:
- Compared to Monte Carlo simulation [12,13,14], neural network [26,27,28,29,30,31,32,33,34,35,36,37], and fault tree [35,36,37], there is a strong correlation between the state transition mechanism of the three-state progressive model based on the Markov model and the change mechanism of the RPS’s operation state, which can more accurately reflect the operation state change of the protection system compared with other models.
- In the proposed assessment method, not only is the operation risk of the secondary equipment itself considered, but the function abnormality of the protection system caused by the abnormality of the secondary equipment, which may lead to the operation risk of the unprotected operation of the primary equipment, is taken into account as well. In addition, the risk loss of the primary equipment is quantitatively analyzed; compared with other methods, i.e., [21,22,23,24,26,27,28,34,35,36], it is more intuitive and accurate to reflect the operational risk of the protection system.
- Most of the existing operation state evaluation methods focus on the risk assessment of the secondary system or a protection function. When the system or a protection function operates abnormally, it is difficult to find the abnormal operation equipment in time, which may affect the normal operation of the primary equipment and cause power failure loss. In the developed results in this paper, more attention is paid to the operation state and the operation risk of a certain secondary equipment, thus much more objective and accurate risk assessment results could be obtained.
It should be noted that, although there have been many results developed for the operation risk assessment of the protection system, there are still some interesting and important problems that should be considered in the future, which are all left for the future research topics:
- In the future, with the development of information and communication techniques, the overall perception of the secondary system’s operation state would be realized. Therefore, with the perception results, how to improve the accuracy of the risk assessment results will be an interesting topic.
- A complete monitoring statistical database is important, which can closely reflect the operation state of the secondary system. Hence, in the future, how to construct this database and effectively use this data would be worthy of being investigated.
- Based on the developed Markov model, how to improve and establish the model for hidden faults in the protection system is also a future research topic.
6. Conclusions
In this paper, the risk assessment method of smart substation RPS based on the Markov model and the risk transfer network was proposed. Based on action data, defect data, and network message information of 220 kV and the proposed protection system, the failure rate of PD based on the Markov model was evaluated, and then the risk assessment for RPS of a smart substation was carried out by combining both the Markov model and the risk transfer network together. For the typical 220 kV connection mode of a smart substation, the risk loss caused by RPS itself and primary equipment was considered. The results demonstrated that the risk loss of the bus protection system is the highest, followed by that of the main transformer protection system, and the risk loss of the line protection system is greater than that of the bus protection system. In addition, the risk loss of primary equipment caused by the failure of RPS is much less than the loss of secondary equipment itself. In order to provide a comprehensive theoretical support for the condition-based maintenance of substation RPS, the risk loss of primary equipment caused by the failure of RPS must also be considered. Therefore, the state evaluation and the risk evaluation of the relay protection system proposed in this paper can provide necessary theoretical support for the smart substation to achieve better state maintenance.
Author Contributions
D.N. and W.W. did the methodology, simulation and validation. D.N. did the analysis and wrote the paper. Conceptualization, D.N. and W.W.; Software, D.N. and W.W.; Investigation, D.N. and W.W.; Resources, D.N. and W.W.; Data Curation, D.N. and W.W.; Writing-Original Draft Preparation, D.N. and R.J.M.; Writing-Review & Editing, D.N., W.W., R.J.M., H.H.A., P.S., M.P. and L.Z.; Visualization, D.N., W.W., R.J.M., H.H.A., P.S., M.P. and L.Z.; Supervision, W.W.; Project Administration, W.W.; Funding Acquisition, D.N. and W.W. All authors have read and agreed to the published version of the manuscript.
Funding
This work was supported by the National Natural Science Foundation of China (No. 51667020), the Natural Science Project of Scientific Research Program in University of Xinjiang Uygur Autonomous Region (No. XJEDU2017I002);and “Tianshan Cedar” Talent Development Program in Xinjiang Uygur Autonomous Region (No. 2017XS02).
Conflicts of Interest
The authors declare no conflict of interest.
References
- Jahromi, A.; Kemmeugne, A.; Kundur, D.; Haddadi, A. Cyber-physical attacks targeting communication-assisted protection schemes. IEEE Trans. Power Syst. 2020, 35, 440–450. [Google Scholar] [CrossRef]
- Farzinfar, M.; Mostafa Jazaeri, M. A novel methodology in optimal setting of directional fault current limiter and protection of the MG. Int. J. Electr. Power Energy Syst. 2020, 116, 105564. [Google Scholar] [CrossRef]
- Yu, X.; Singh, C. A practical approach for integrated power system vulnerability analysis with protection failures. IEEE Trans. Power Syst. 2004, 19, 1811–1820. [Google Scholar] [CrossRef]
- Dai, Z.; Wang, Z. Protection dynamic reliability analysis system based on 3RF technique. IEEE Trans. Power Syst. 2011, 26, 1137–1144. [Google Scholar] [CrossRef]
- Panteli, M.; Crossley, P.A.; Fitch, J. Quantifying the reliability level of system integrity protection schemes. IET Gener. Transm. Distrib. 2014, 8, 753–764. [Google Scholar] [CrossRef]
- Zhang, B.; Wu, Y.; Jin, Z.; Wang, Y. A real-time digital solver for smart substation based on orders. Energies 2017, 10, 1795. [Google Scholar] [CrossRef]
- Huang, Q.; Jing, S.; Li, J.; Cai, D.; Wu, J.; Zhen, W. Smart substation: State of the art and future development. IEEE Trans. Power Deliv. 2017, 32, 1098–1105. [Google Scholar] [CrossRef]
- Gao, L.; Song, L.; Yang, Y.; Yuan, Y.; Cui, Y.; Wu, Y. Secondary equipment condition evaluation based on multi-parameter model for smart substations. Electr. Power Autom. Equip. 2018, 38, 210–215. [Google Scholar]
- Guo, C.; Cai, Z.; Zhang, Y.; Xie, P.; Liu, K.; Li, Y. Operation condition assessment method and its practical implementation for protection systems. IEEE Access 2019, 7, 51771–51781. [Google Scholar] [CrossRef]
- Dai, Z.; Wang, Z.; Jiao, Y. Dynamic reliability assessment of protection system based on dynamic fault tree and Monte Carlo simulation. In Proceedings of the CSEE, Beijing, China, 24–28 July 2011; pp. 105–113. [Google Scholar]
- Schlapfer, M.; Mancarella, P. Probabilistic modeling and simulation of transmission line temperature under fluctuating power flows. IEEE Trans. Power Deliv. 2011, 26, 2235–2243. [Google Scholar] [CrossRef]
- Dai, Z.; Wang, Z.; Jiao, Y. Bayes Monte-Carlo assessment method of protection systems reliability based on small failure sample data. IEEE Trans. Power Deliv. 2014, 29, 1841–1848. [Google Scholar] [CrossRef]
- He, X.; Jiang, X.; Zhang, P.; Gao, X. Availability analysis of smart substation protection system considering maintenance strategies. Power Syst. Technol. 2015, 39, 1121–1126. [Google Scholar]
- Zhou, H.; Zhang, H.; Yang, Z.; Li, J.; Wang, J.; Yin, J. Multi-criteria integrated risk assessment of secondary system hidden failures. Power Syst. Prot. Contr. 2019, 47, 120–127. [Google Scholar]
- Zhao, L.; Li, X.; Ni, M.; Li, T.; Cheng, Y. Review and prospect of hidden failure: Protection system and security and stability control system. J. Mod. Power Syst. Clean Energy 2019, 7, 1735–1743. [Google Scholar] [CrossRef]
- Billinton, R.; Fotuhi-Firuzabad, M.; Sidhu, T.S. Determination of the optimum routine test and self-checking intervals in protective relaying using a reliability model. IEEE Trans. Power Syst. 2002, 17, 663–669. [Google Scholar] [CrossRef]
- Etemadi, A.H.; Fotuhi-Firuzabad, M. New considerations in modern protection system quantitative reliability assessment. IEEE Trans. Power Deliv. 2010, 25, 2213–2222. [Google Scholar] [CrossRef]
- Jiang, K.; Singh, C. New models and concepts for power system reliability evaluation including protection system failures. IEEE Trans. Power Syst. 2011, 26, 1845–1855. [Google Scholar] [CrossRef]
- Damchi, Y.; Sadeh, J. Determination of the optimum routine and self-checking test time intervals for power system protection considering remote back-up protection system failure. IET Gener. Transm. Distrib. 2013, 7, 1163–1171. [Google Scholar] [CrossRef]
- Dui, H.; Si, S.; Zuo, M.J.; Sun, S. Semi-Markov process-based integrated importance measure for multi-state systems. IEEE Trans. Reliab. 2015, 64, 754–765. [Google Scholar] [CrossRef]
- Chen, C.; Liu, J.; Liu, Y.; Jiang, C.; Guo, J. Power system reliability analysis considering substation interior. Electr. Power Autom. Equip. 2015, 35, 103–109. [Google Scholar]
- Dai, Z.; Zhang, T.; Liu, X.; Jiao, Y. Research on smart substation protection system reliability for condition-based maintenance. Power Syst. Prot. Contr. 2016, 44, 14–21. [Google Scholar]
- Li, S.; Hua, Y. Short-term reliability evaluation of protection systems in smart substations based on equivalent state spaces following semi-Markov process. IET Gener. Transm. Distrib. 2016, 10, 2225–2230. [Google Scholar] [CrossRef]
- Ye, Y.; Xie, M.; Wang, J.; Xu, Y.; Xu, D. Real time reliability analysis of relay protection system in intelligent substation based on Markov model and GO method. Power Syst. Prot. Contr. 2019, 47, 47–55. [Google Scholar]
- Hua, Y.; Li, S.; Wu, Z. Short-term reliability assessment of UHV dc systems based on state aggregation with SMP. IEEE Trans. Reliab. 2019, 68, 790–799. [Google Scholar] [CrossRef]
- Dai, Z.; Li, Z.; Jiao, Y.; Wang, Z. Reliability assessment based on BP neural network for relay protection system with a few failure data samples. Electr. Power Autom. Equip. 2014, 34, 129–134. [Google Scholar]
- Jia, Y.; Xu, Z.; Lai, L.L.; Wong, K.P. Risk-based power system security analysis considering cascading outages. IEEE Trans. Ind. Inform. 2016, 12, 872–882. [Google Scholar] [CrossRef]
- Liu, X.; Shahidehpour, M.; Li, Z.; Liu, X.; Cao, Y.; Li, Z. Power system risk assessment in cyber attacks considering the role of protection systems. IEEE Trans. Smart Grid 2017, 8, 572–580. [Google Scholar] [CrossRef]
- Rahman, M.S.; Mahmud, M.A.; Oo, A.M.; Pota, H.R. Multi-agent approach for enhancing security of protection schemes in cyber-physical energy systems. IEEE Trans. Ind. Inform. 2017, 13, 436–447. [Google Scholar] [CrossRef]
- Chen, Y.; Li, Y.; Li, W.; Wu, X.; Cai, Y.; Cao, Y.; Rehtanz, C. Cascading failure analysis of cyber physical power system with multiple interdependency and control threshold. IEEE Access 2018, 6, 39353–39362. [Google Scholar] [CrossRef]
- Wei, X.; Gao, S.; Huang, T.; Bompard, E.; Pi, R.; Wang, T. Complex network-based cascading faults graph for the analysis of transmission network vulnerability. IEEE Trans. Ind. Inform. 2019, 15, 1265–1276. [Google Scholar] [CrossRef]
- Ahmed, A.; Krishnan, V.V.; Foroutan, S.A.; Touhiduzzaman, M.; Rublein, C.; Srivastava, A.; Wu, Y.; Hahn, A.; Suresh, S. Cyber physical security analytics for anomalies in transmission protection systems. IEEE Trans. Ind. Appl. 2019, 55, 6313–6323. [Google Scholar] [CrossRef]
- Roy, D.S.; Mohanta, D.K.; Panda, A.K. Software reliability allocation of digital relay for transmission line protection using a combined system hierarchy and fault tree approach. IET Softw. 2008, 2, 437–445. [Google Scholar] [CrossRef]
- Liu, X.; Pang, J.; Zhang, L.; Xu, D. A high-reliability and determinacy architecture for smart substation process-level network based on cobweb topology. IEEE Trans. Power Deliv. 2014, 29, 842–850. [Google Scholar] [CrossRef]
- Zhou, Z.; Zhang, Q. Model event/fault trees with dynamic uncertain causality graph for better probabilistic safety assessment. IEEE Trans. Reliab. 2017, 66, 178–188. [Google Scholar] [CrossRef]
- Yang, G.; Huang, X.; Li, Y.; Ding, P. System reliability assessment with imprecise probabilities. Appl. Sci. 2019, 9, 5422. [Google Scholar] [CrossRef]
- Kushal, T.; Lai, K.; Illindala, M. Risk-based mitigation of load curtailment cyber-attack using intelligent agents in a shipboard power system. IEEE Trans. Smart Grid 2019, 10, 4741–4750. [Google Scholar] [CrossRef]
- Johansson, M.; Olofsson, T. Bayesian model selection for Markov, hidden Markov, and multinomial models. IEEE Signal Process. Lett. 2007, 14, 129–132. [Google Scholar] [CrossRef]


© 2020 by the authors. Licensee MDPI, Basel, Switzerland. This article is an open access article distributed under the terms and conditions of the Creative Commons Attribution (CC BY) license (http://creativecommons.org/licenses/by/4.0/).