Article

Factorial Decomposition of the Energy Footprint of the Shaoxing Textile Industry

1
Ecological Civilization Research Center of Zhejiang Province, School of economics and management, Zhejiang Sci-Tech University, Hangzhou 310018, China
2
East China Sea Institute/Collaborative innovation center of Port Economy, Ningbo University, Ningbo 315211, China
3
Fashion Department of International United Faculty between Ningbo University and University of Angers/Faculty of Tourism and Culture, Ningbo University, Ningbo 315201, China
*
Authors to whom correspondence should be addressed.
Energies 2020, 13(7), 1683; https://doi.org/10.3390/en13071683
Submission received: 8 March 2020 / Revised: 26 March 2020 / Accepted: 30 March 2020 / Published: 3 April 2020

Abstract

:
To present great environmental pressure from energy consumption during textile production, this paper calculates the energy footprint (EFP) of Shaoxing’s textile industry, from 2005 to 2018. Moreover, this study analyzes the relationship between Shaoxing’s textile industry energy consumption and economic development by using decoupling theory. Furthermore, the Logarithmic Mean Divisia Index decomposition method was employed to investigate the main factors that affect the EFP of Shaoxing’s textile industry. Research results show the following: (1) The growth rate of the total output value of Shaoxing’s textile industry was greater than the growth rate of the EFP, from 2005 to 2007. Thus, the decoupling state showed a weak decoupling, and EFP intensity decreased. (2) The EFP and economic growth were mainly based on the strong decoupling of Shaoxing’s textile industry from 2008 to 2015 (except for 2011), and EFP intensity declined further. (3) Economic recession in the textile industry was severe in Shaoxing, from 2016 to 2018, and the EFP also showed a downward trend. The state of decoupling appeared as a recessive decoupling (2016) and a weak negative decoupling (2017 and 2018), and EFP intensity first increased and then decreased. (4) The total effect of the factors affecting the EFP of the textile industry in Shaoxing demonstrated a pulling trend, and industrial scale played a significant role in driving the EFP. The energy consumption intensity effect contributed the largest restraint. This paper fills in the gaps in the environmental regulation means and methods of pillar industrial clusters in specific regions.

1. Introduction

The relationship between economic growth and environmental pressure has been vividly discussed [1,2,3]. Excessive greenhouse gas emissions have caused serious environmental problems, such as global warming, melting glaciers and rising sea levels. Excessive energy consumption is the cause of such problems. Approximately 63% of the gaseous radiative force that contributes to climate change is carbon [4]. To reduce energy consumption in the textile industry in China, the industry must explore energy-saving technologies and energy-efficient assessment methods [5,6,7]. China is the world’s largest textile product manufacturer and exporter. The textile industry is a traditional pillar industry in China, an important civilian production industry and an industry that creates new international advantages [8,9,10]. China’s cotton textile spindles account for half the world’s total, while China’s textile trade volume accounts for one third of the world’s total [8]. However, it is a high-energy, high-emissions and high-pollution industry and one of the largest sources of greenhouse gas emissions [11,12]. The energy consumed by the textile industry is approximately 4.3% of China’s total energy consumption in the manufacturing industries [13]. This makes the textile industry one of the biggest pollution emitters in China. China’s Textile Industry 13th (2016–2020) Five-Year Plan highlights low-carbon development as a major strategy for economic and social development, and it is also an important way to construct an ecological civilization [14].
Shaoxing is the largest textile printing and dyeing base in the world, and its output in printing and dyeing cloths ranks first in China. Shaoxing built the China International Textile City, which is the world’s largest printing and dyeing cloth trading center. In 2018, the printed fabrics output of printing and dyeing enterprises above a designated size was 16.4 billion meters in Shaoxing, thereby accounting for 56.71% of the total output of printed fabrics in Zhejiang Province and approximately one-third of the total output of printed fabrics in China [15]. The total industrial output value (TIOV) of textile enterprises above a designated size is USD 22.05 billion, accounting for 29.13% of Shaoxing’s industrial output value [15]. The textile industry has made important contributions to the economic and social development of Shaoxing. However, the energy consumption of Shaoxing’s textile industry in 2018 was 6.16 million tons of standard coal, thereby accounting for 36.91% of the city’s industrial energy consumption [15]. The energy consumption ratio was greater than the actual output value ratio, and the unit energy output value was lower than the city’s industrial average. The textile industry is a pillar industry and a typical high-pollution industry in Shaoxing. Implementing an economic energy-saving and consumption reduction model is an inevitable trend and a strategic choice in the economic development of Shaoxing’s textile industry. Studying the changing rules and influencing factors of the energy footprint (EFP) of the textile industry in Shaoxing can determine the effects, experiences and deficiencies of the transformation and upgrade of typical industries and environmental regulations in different regions. Moreover, such an investigation can provide feasible countermeasures and suggestions for the high-quality development of the textile industry.
Wackernagel et al. [16] defined EFP as the forest area needed to absorb CO2 generated by the burning of fossil energy, buffer nuclear radiation and build hydropower dams. Palamutcu [17] believed that EFP is one way to measure energy consumption. The EFP indicator, which links the production and consumption activities of the global economy with energy consumption, plays an important role in the study of sustainable development approaches [18]. EFP, as an indicator of energy production and consumption, can effectively characterize the direct and indirect energy sources required to supply end-consumer goods or services. In addition, it can provide quantitative and decision-making bases for policymakers to improve energy efficiency and optimize energy structure. Numerous scholars have studied issues related to EFP. Chen et al. [19] indicated that using the EFP index to quantify energy consumption can provide an important basis for measuring energy sustainability. Ozturk [20] estimated the energy consumption and energy costs of the Turkish textile sector and analyzed the relationship between energy use and textile product production. Hong et al. [21] studied the energy conservation status of the textile industry in Taiwan and China and provided a benchmark for measuring energy efficiency. Meanwhile, Guo et al. [22] used EFP to examine the embodied and direct energy links between global and Chinese construction industries. Previous research has also used different methods to estimate EFP based on global [23,24], national [25,26], local [27,28], industrial [29,30] and product [31,32] perspectives. Methods used include ecological footprint analysis [33], input-output analysis [34] and lifecycle assessment [35]. Studies have also measured EFP in national and global hectares, as well as in energy/functional units [36,37].
To explore the pressure of the textile industry’s energy consumption reduction on the environment, this study analyzes the relationship between the energy consumption and economic growth of the Shaoxing’s textile industry, based on its energy consumption data and economic development from 2005 to 2018. This study also determines the main factors affecting the relationship and provides relevant suggestions for energy-saving and emissions-reduction paths and measures the sustainable development of the Shaoxing region and textile industry. This paper fills in the gaps in the environmental regulation means and methods of pillar industrial clusters in specific regions.

2. Methods and Data Sources

2.1. EFP

EFP is an important method for measuring energy consumption. In this study, we measured EFP in units of energy and followed the definition of demand for nonrenewable energy resources. The EFP of the textile industry can be expressed as follows:
E F P = E j f j ,
In Equation (1), E F P is the EFP; E j represents the consumption amount of energy j; and f j is conversion factor from physical units to coal equivalent of energy j.
EFP intensity (EFPI) is an indicator that measures changes in energy efficiency, which is expressed as follows:
E F P I = E F P T I O V ,
In Equation (2), E F P I is the EFPI, and T I O V is the TIOV of textile enterprises above a designated size (billion USD).

2.2. Tapio Decoupling Indicator

Elastic analysis mainly uses elasticity to measure the degree of decoupling. Tapio improved and refined the decoupling model [38]. Decoupling is a term that refers to the status when the relationship between energy consumption and economic growth begins to break up [39]. Decoupling can be further divided into two/three/six/eight subcategories [38], and all were used in earlier studies [9,40,41,42]. Compared with other methods, the 8-min state classification method is more detailed and helpful for the analysis of the study. The present study analyzed the decoupling of Shaoxing’s economic development and energy consumption from 2005 to 2018, based on the Tapio decoupling model, and the results were expressed by decoupling elasticity. In this regard, the decoupling function can be expressed as Equation (3):
E = % Δ E F P % Δ T I O V ,
In Equation (3), E is the decoupling elasticity index of the TIOV. Moreover, % Δ E F P is the EFP change rate in the textile industry, and % Δ T I O V is the TIOV change rate in the textile industry. Owing to the different values of % Δ E F P , % Δ T I O V and E , decoupling states can be divided into eight categories, based on Tapio’s elastic division. According to the order of the ideal degree of decoupling from large to small, the categories are strong, weak, recessive decoupling, expansive, recessive coupling, expansive negative, weak negative and strong negative decoupling. Strong decoupling is the most ideal state, whereas strong negative decoupling is the least ideal state. The decoupling state was determined according to the decoupling elasticity index E , and the specific division method can be seen in Table 1.

2.3. Logarithmic Mean Divisia Index (LMDI) Decomposition Model

The LMDI decomposition method was proposed by Ang et al. [43]. It can give a reasonable factor decomposition and has the advantage of the absence of residual and full decomposition, thereby making a model appear convincing. The LMDI factor decomposition method is mainly used to analyze the influencing factors of the total amount of economic and social indicators, such as energy consumption and pollutant emissions. In addition, it is used to determine the contribution of different influencing factors to changes in the total amount of indicators. In recent years, the LMDI has been widely applied, as well as continuously developed and optimized [9,44]. In the present study, LMDI was used to decompose the EFP of Shaoxing’s textile industry. The specific formula of the decomposition model is shown in Equation (4), and the meanings of the variables are shown in Table 2.
E F P = E i j = T I O V T I O V i T I O V E i T I O V i E i j E i = T I O V · I i · T i · S i j ,
Δ E F P = E F P t E F P 0 = T I O V t I i t T i t S i j t T I O V 0 I i 0 T i 0 S i j t = Δ E F P T I O V + Δ E F P I + Δ E F P T + Δ E F P S ,
where E F P t is the EFP of Shaoxing’s textile industry in year t, and E F P 0 is the EFP of Shaoxing’s textile industry in base year 0. The EFP expression formula for changes in the EFP of Shaoxing’s textile industry yearly, according to an additional LMDI decomposition model, is shown in Equation (5).
In Formula (5), Δ E F P T I O V represents the scale effect of the textile industry, Δ E F P I is the industrial structure effect, Δ E F P T denotes the energy consumption intensity effect and Δ E F P S is the energy structure effect. The contribution values of each factor to the EFP changes of the textile industry are Δ E F P T I O V ,   Δ E F P I ,   Δ E F P T and Δ E F P S . The expressions of the contribution of each decomposition factor are as follows:
Δ E F P T I O V = E i j t E i j 0 l n E i j t l n E i j 0 l n T I O V t T I O V 0
Δ E F P I = E i j t E i j 0 l n E i j t l n E i j 0 l n I i t I i 0
Δ E F P T = E i j t E i j 0 l n E i j t l n E i j 0 l n T i t T i 0
Δ E F P S = E i j t E i j 0 l n E i j t l n E i j 0 l n S i j t S i j 0

2.4. Data Sources and Processing

China’s textile industry is classified under three subsectors: manufacturers of textiles (MT); manufacturers of textile apparel, footwear and caps (MTAFC); and manufacturers of chemical fibers (MCF). The TIOV and energy consumption data of enterprises above a designated size in Shaoxing’s textile industry and subindustries were derived from the 2006–2019 Shaoxing statistical yearbook. The f j data were obtained from the 2018 China energy statistical yearbook. Owing to inflation and other factors that influence constantly changing prices in economic development, the gross product of Shaoxing’s textile industry was compared with its energy consumption, which was calculated by the TIOV comparable price, and 2005 was used as the base period. Nomenclature comparison table is in Appendix A.

3. Results and Discussion

3.1. Descriptive Analysis and Discussion

Figure 1 shows the EFP change trends and TIOV of Shaoxing’s textile industry and subsectors from 2005 to 2018. In addition, Figure 1 shows that, from 2005 to 2018, Shaoxing’s EFP demonstrated a rising and then a declining trend, which can be divided into two stages, namely the rising stage and the declining stage. The rising period was from 2005 to 2007, with an average annual growth of 4.4%. In 2007, the EFP reached the highest value of 2.11 Mt, whereas 2008–2018 was the declining period, with an average annual decline of 7.19%. In 2018, the lowest EFP was 0.45 Mt. In Figure 1, the TIOV change trends of the textile industry are also divided into two stages, namely the rising stage and the falling stage. The rising stage was from 2005 to 2015, with an average annual growth rate of 9.1%. The maximum TIOV was USD 46.97 billion in 2015. During the declining period, the annual average decline rate was 19.2% (2016–2018), in which the lowest TIOV was USD 22.01 billion in 2018.
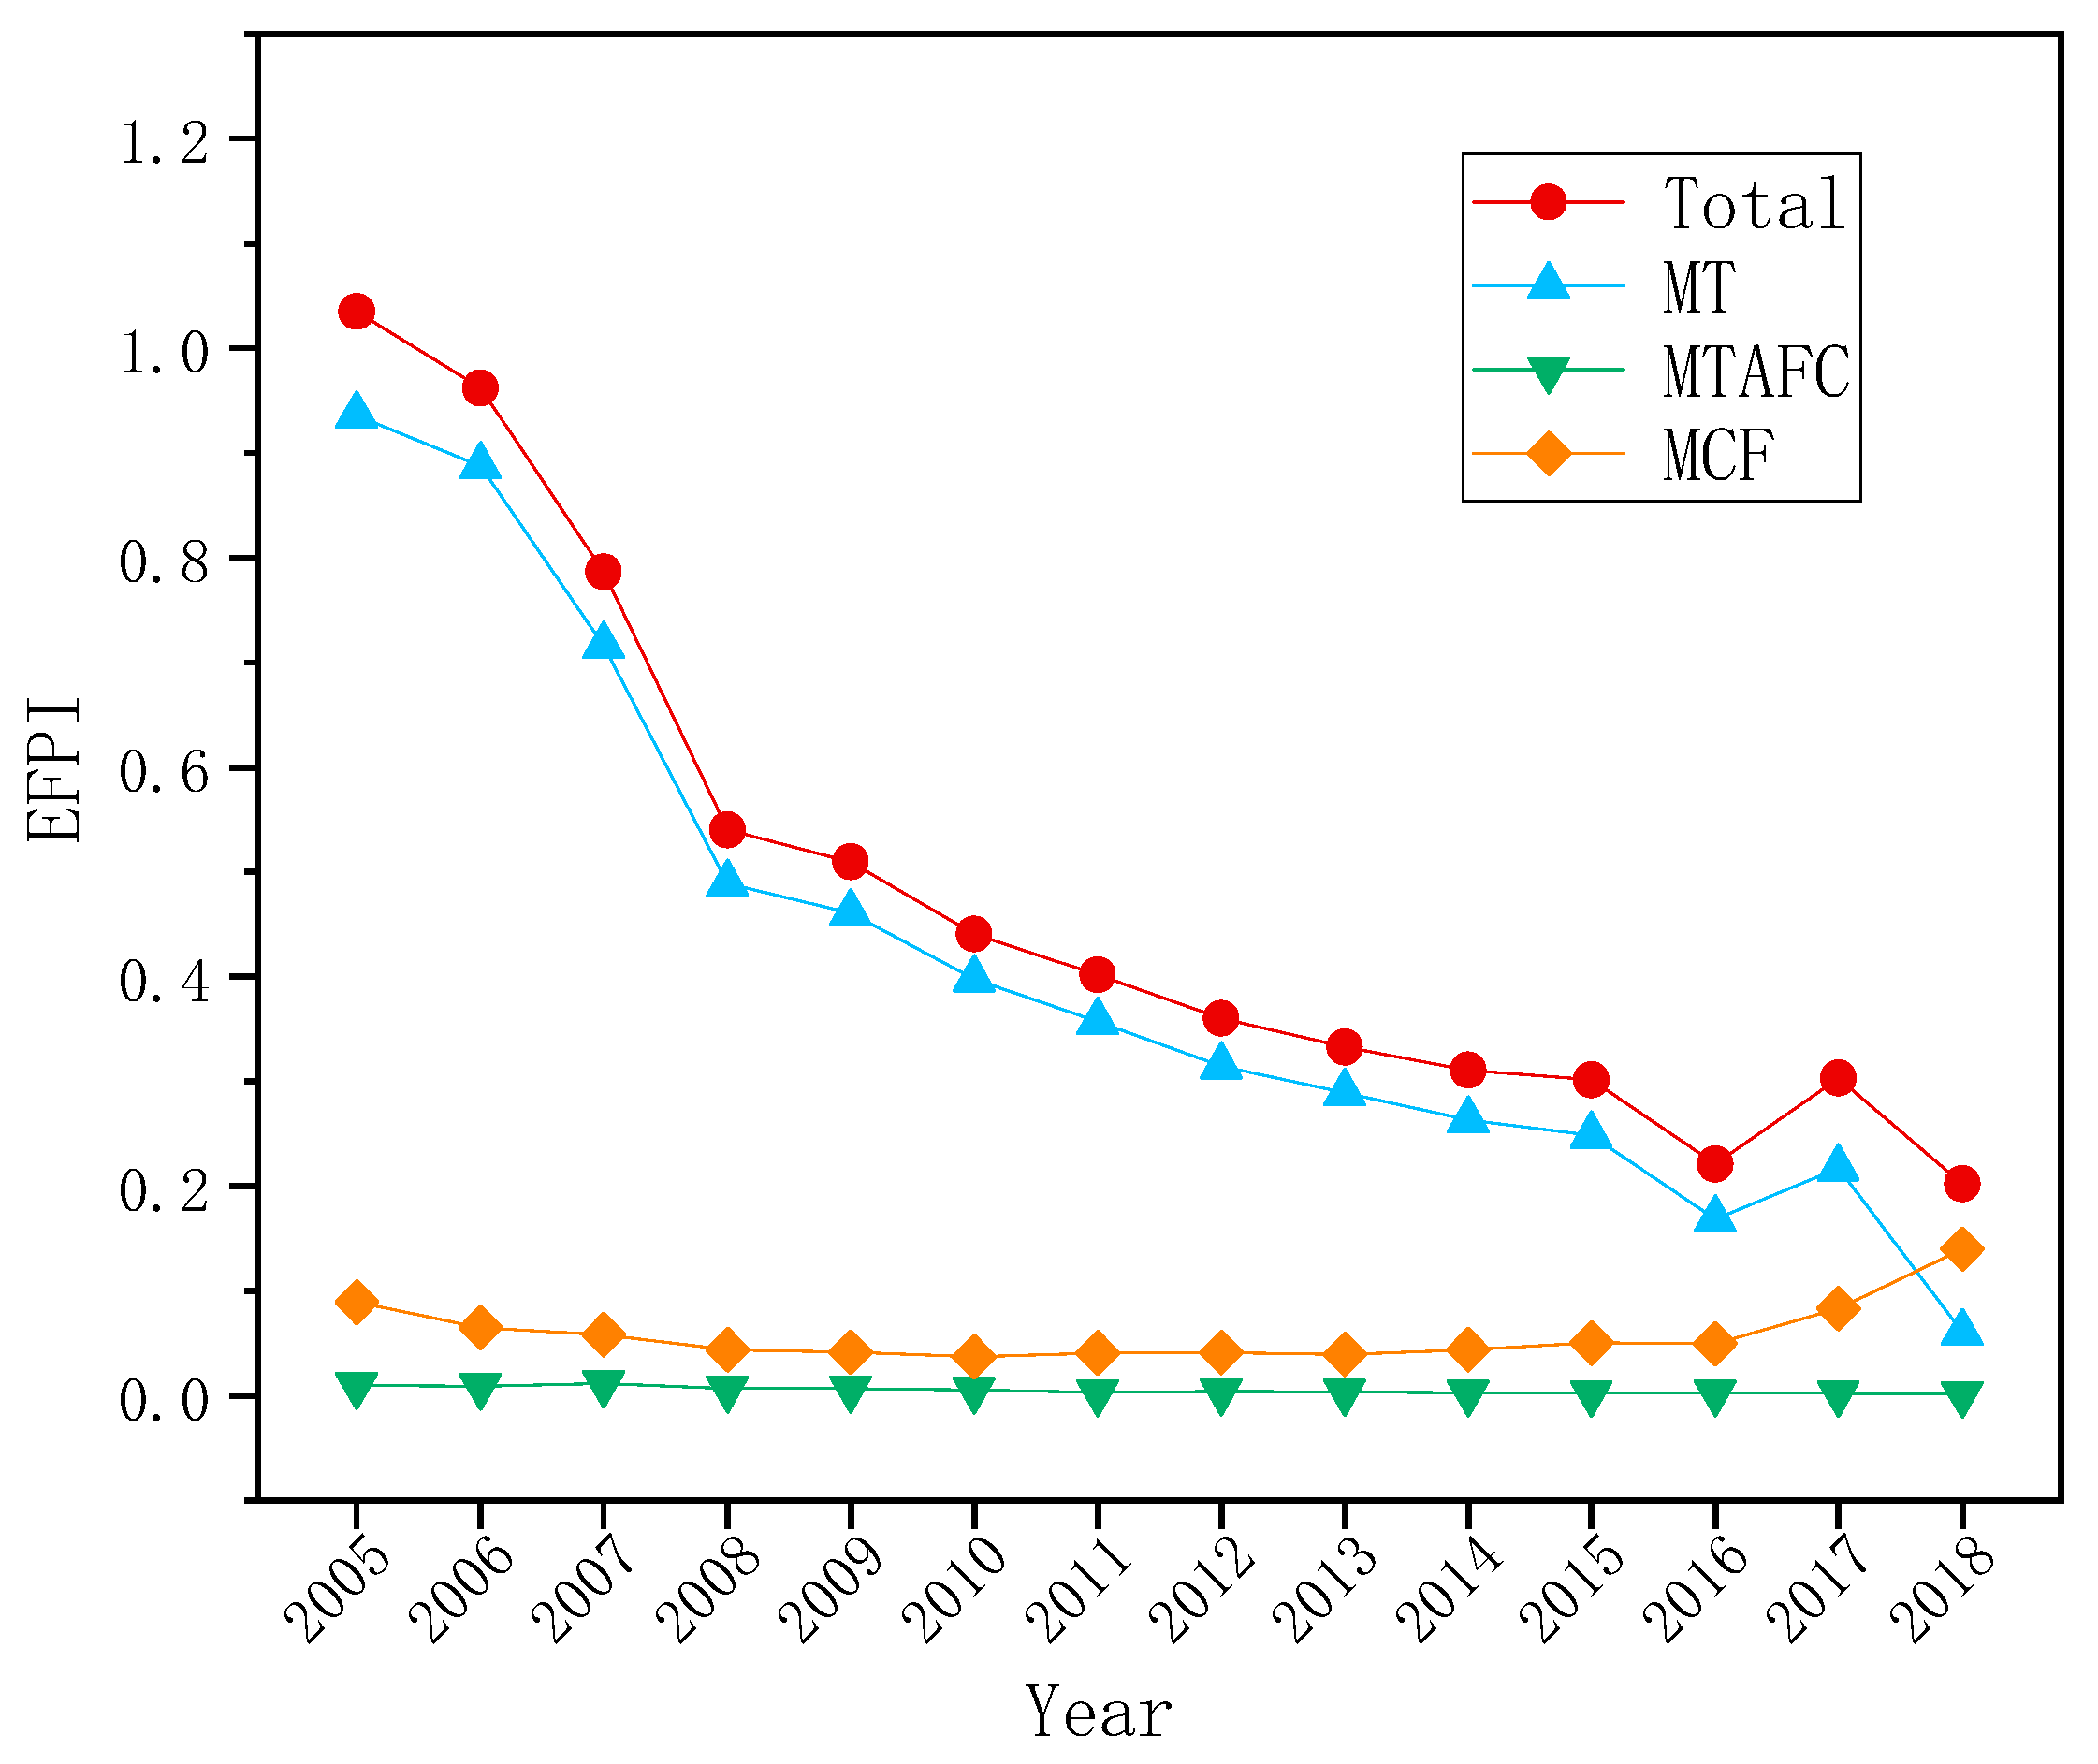
The EFPI of Shaoxing’s textile industry and subsectors from 2005 to 2018 is shown in Figure 2. In the sample period, the total EFPI of the textile industry showed a downward trend. The EFPI of the MT and MTAFC subindustries demonstrated a downward trend. Specifically, the downward trend of the MT subindustry was significant, with a decrease rate of 82.65% (2005–2016). The EFPI of the MT subindustry decreased from 0.114 (2005) to 0.020 (2016), whereas the EFPI of the MTAFC subindustry experienced a relatively small decline, from 0.00121 (2005) to 0.00022 (2018). In the MCF subindustry, EFPI first slowly declined to 0.00603 (2005–2010) and then rose to 0.01055 (2011–2018).
The decoupling state between the TIOV and EFP of Shaoxing is shown in Table 3. For 13 years, from 2006 to 2018, the overall decoupling state was satisfactory. During the steady rise of the TIOV, the EFP showed a downward trend. In 10 years, from 2006 to 2015, three years of weak decoupling (2006, 2007 and 2011) was followed by seven years of strong decoupling (2008–2010 and 2012–2015). The 2016 decoupling index was 4.39, thereby indicating a recessive decoupling. In 2017 and 2018, the TIOV declined, with decline rates of 27% and 26%, respectively. Thus, the decoupling state for both years was a weak negative decoupling.
The EFP decline in Shaoxing and the increase in energy-use intensity are inseparable from the intensity of environmental protection in China and Shaoxing. The sample period can be divided into three periods, according to Figure 1 and Figure 2 and Table 3.
The first period (2005–2007): In the years after China’s accession to the World Trade Organization in 2001, Shaoxing mainly focused on the rapid development of the textile industry. Shaoxing, as a globally important textile printing and dyeing product production base, was driven by international and Chinese domestic demands. As a result of the increase in production, international trade in textile products was prosperous and TIOV increased. However, the production and supply of products consumed considerable energy, thereby leading to serious environmental pollution problems. The amount of energy consumed per output value unit (EFPI) decreased, which meant that the increase in the TIOV was greater than the increase in the EFP, and energy efficiency improved. Therefore, the decoupling state at this period was a weak decoupling. Thus, the coupling relationship between energy consumption and economic growth was not completely broken.
The second period (2008–2015): After energy consumption caused environmental pollution, China vigorously promoted the construction of an ecological civilization. Furthermore, various parties in society adopted numerous options and measures, including implementing environmental regulations, adopting market-based trading methods and conducting technological innovations. Entrepreneurs’ self-environmental and public environmental awareness also improved. Firstly, environmental regulations were created during the period, specifically, in the textile industry of Zhejiang Province and Shaoxing Municipality, including laws, regulations [45,46], notices, industry standards and pollution permits. Secondly, market-oriented means were developed through the implementation of emissions trading systems, pollution fees and emissions taxes. Such measures could effectively control energy consumption and total emissions to reduce pollution emissions. Thirdly, regarding the technological innovation of textile enterprises, pressure on environmental protection forced the technological transformation of enterprises. At the same time, the government provided subsidies for technological transformation, thereby effectively improving the technological efficiency of the textile industry. Fourthly, entrepreneurs’ awareness of environmental protection and social responsibility was enhanced, investment in environmental protection increased and the ‘changing coal into natural gas’ [47] cooperation was consciously implemented to reduce carbon emissions; the natural gas is a secondary energy source. Such factors led to the strong decoupling of energy consumption from economic growth during this period. Whilst TIOV increased, energy consumption decreased, and EFPI decreased further.
The third period (2016–2018): In January 2016, Shaoxing implemented ‘Challenging by Showing Sword’ to promote the upgrade of the textile printing and dyeing industry. ‘Challenging by Showing Sword’ referred to the centralized rectification of textile printing and dyeing enterprises that generated large amounts of pollution and had hidden safety hazards and chaotic management. Specifically, this operation involved the rectification of several textile printing and dyeing enterprises with low production capacities, small scales and unregulated pollution discharges. Enterprises affected the image, product quality and price order of the textile printing and dyeing industry in Shaoxing and restricted the overall improvement and development of the printing and dyeing industry to a certain extent. During this operation, the production of an initial batch of 74 textile printing and dyeing companies was suspended, owing to rectification, including 10 in the Paojiang Industrial Park and 64 in the Keqiao Industrial Park. EFPI showed an increasing and then decreasing trend. Energy consumption and environmental pollution problems were effectively controlled during this second period, but a hysteresis effect was generated, thereby creating a situation in which the TIOV no longer increased but declined sharply. Therefore, the states of decoupling during this period did not seem ideal, that is, a recessive decoupling, a weak negative decoupling and a weak negative decoupling. The reason for the less-than-ideal situations was that, after enterprises dispersed from the relocation to the Shaoxing Binhai Industrial Park, several enterprises with low-end production capacities were shut down, especially those with poor product quality, large energy consumption, large chemical consumption and weak production capacities. In the industrial agglomeration zone, textile printing and dyeing enterprises uniformly managed and discharged sewage and implemented strict emissions standards. Thus, enterprises considerably improved in terms of management, innovation, equipment, technology, environment, entrepreneurship and labor quality. The core competitiveness and industry voice of textile printing and dyeing enterprises in Shaoxing were also strengthened.

3.2. LMDI Decomposition Analysis and Discussion

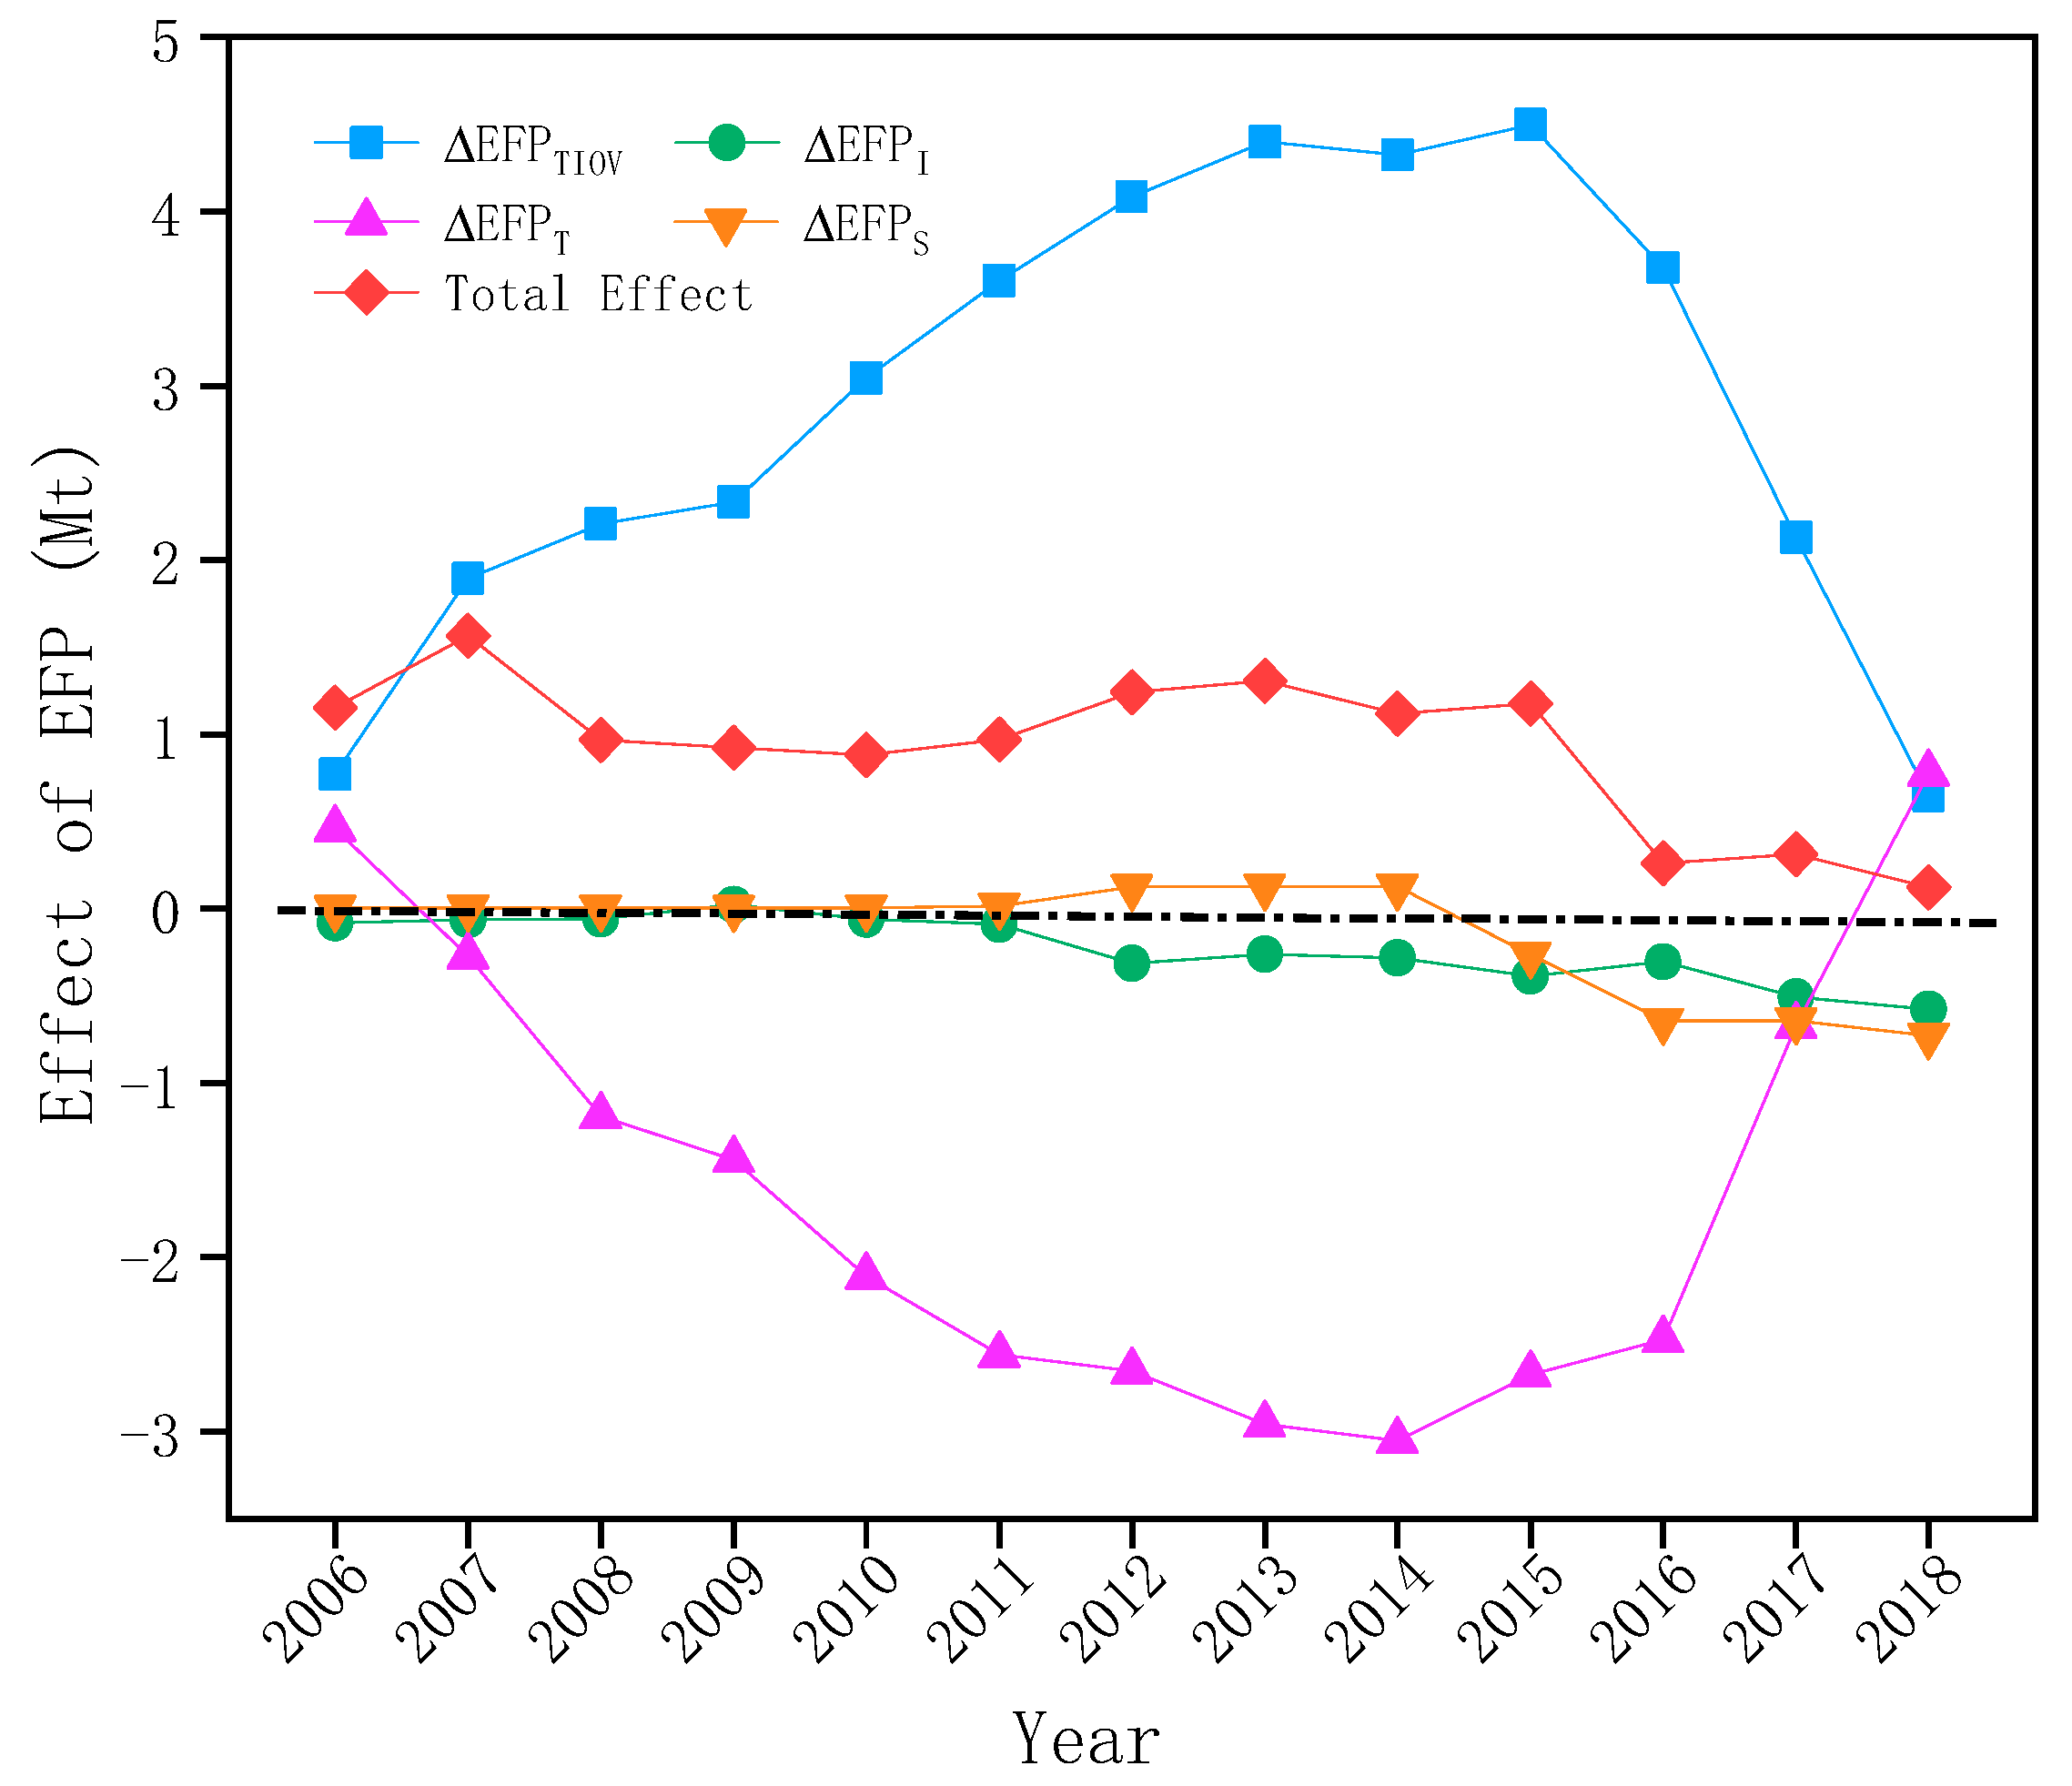
The EFP of Shaoxing’s textile industry in 2006 and 2018 was decomposed by the LMDI factor decomposition method. The factor decomposition trend is shown in Figure 3. The four main factors included the industrial scale effect, the industrial structure effect, the energy consumption intensity effect and the energy structure effect. In addition, total effect was calculated. From 2006 to 2018, the total EFP effect of the textile industry showed a pulling trend. However, the pulling range dropped in waves, with a maximum pulling effect of 1.57 Mt (2007) and a minimum of 0.12 Mt (2018). Among the four factors, the cumulative effect of the industrial scale was a positive factor, which exerted the largest pulling effect on the EFP. The cumulative pulling effect was 37.61 Mt during the sample period, which was higher than the total inhibitory effect of the other three factors (i.e., 25.60 Mt). Thus, the total effect was positive. From 2006 to 2015, the scale effect of the industry increased and then decreased sharply in the next three years, thereby creating an inverted ‘U’ shape, with a peak value of 4.50 Mt (2015). The energy consumption intensity effect provided the maximum inhibitory effect, thereby offsetting the industrial scale pull effect, with a total offset of 20.80 Mt. The effect of energy consumption intensity decreased from 2006 to 2014 then increased yearly, thereby pulling EFP growth in 2006 and 2018 and creating a ‘U’ shape, with a lowest point of −3.05 Mt (2014). The effect of industrial structure and energy structure on EFP was small, with a cumulative inhibition of 4.80 Mt. After 2011, the energy structure effect increased, showed a pull effect from 2011 to 2014 and then declined after 2014, thereby demonstrating an inhibition effect. The industrial structure effects were inhibitory effects during the sample period (except for 2009), and the inhibitory effect was enhanced after 2011, with a cumulative inhibition of 2.95 Mt.
From the perspective of the influencing factors of the relationship between EFP and economic growth, the cumulative effect of industrial scale factors had the largest pulling effect on EFP. The MT sector made up the largest proportion of the textile subsectors of Shaoxing. Compared with the other two subsectors, the MT sector is a typical high energy-consuming sector and the most energy-consuming and polluting sector in the printing and dyeing industry. A large EFP is generated during dyeing, printing and finishing processes. Printing and dyeing subsectors have a large base and high energy consumption in the MT sector, and the potential for energy conservation, consumption reduction and emissions reduction is relatively small. In this investigation, we found that most of the printing and dyeing enterprises in Shaoxing were mainly based on sample processing. Moreover, most followed imitations in terms of process technology, variety development and management, with few independent brands and poor R&D and innovation capabilities. The online parameter detection and online control technology of dyeing and finishing equipment, as well as the development and manufacturing accuracy of new equipment and supporting parts, energy saving and environmental protection, lag behind advanced global levels. Therefore, optimizing the printing and dyeing process and improving industrial efficiency are urgent for the Shaoxing’s textile industry to achieve high-quality development.
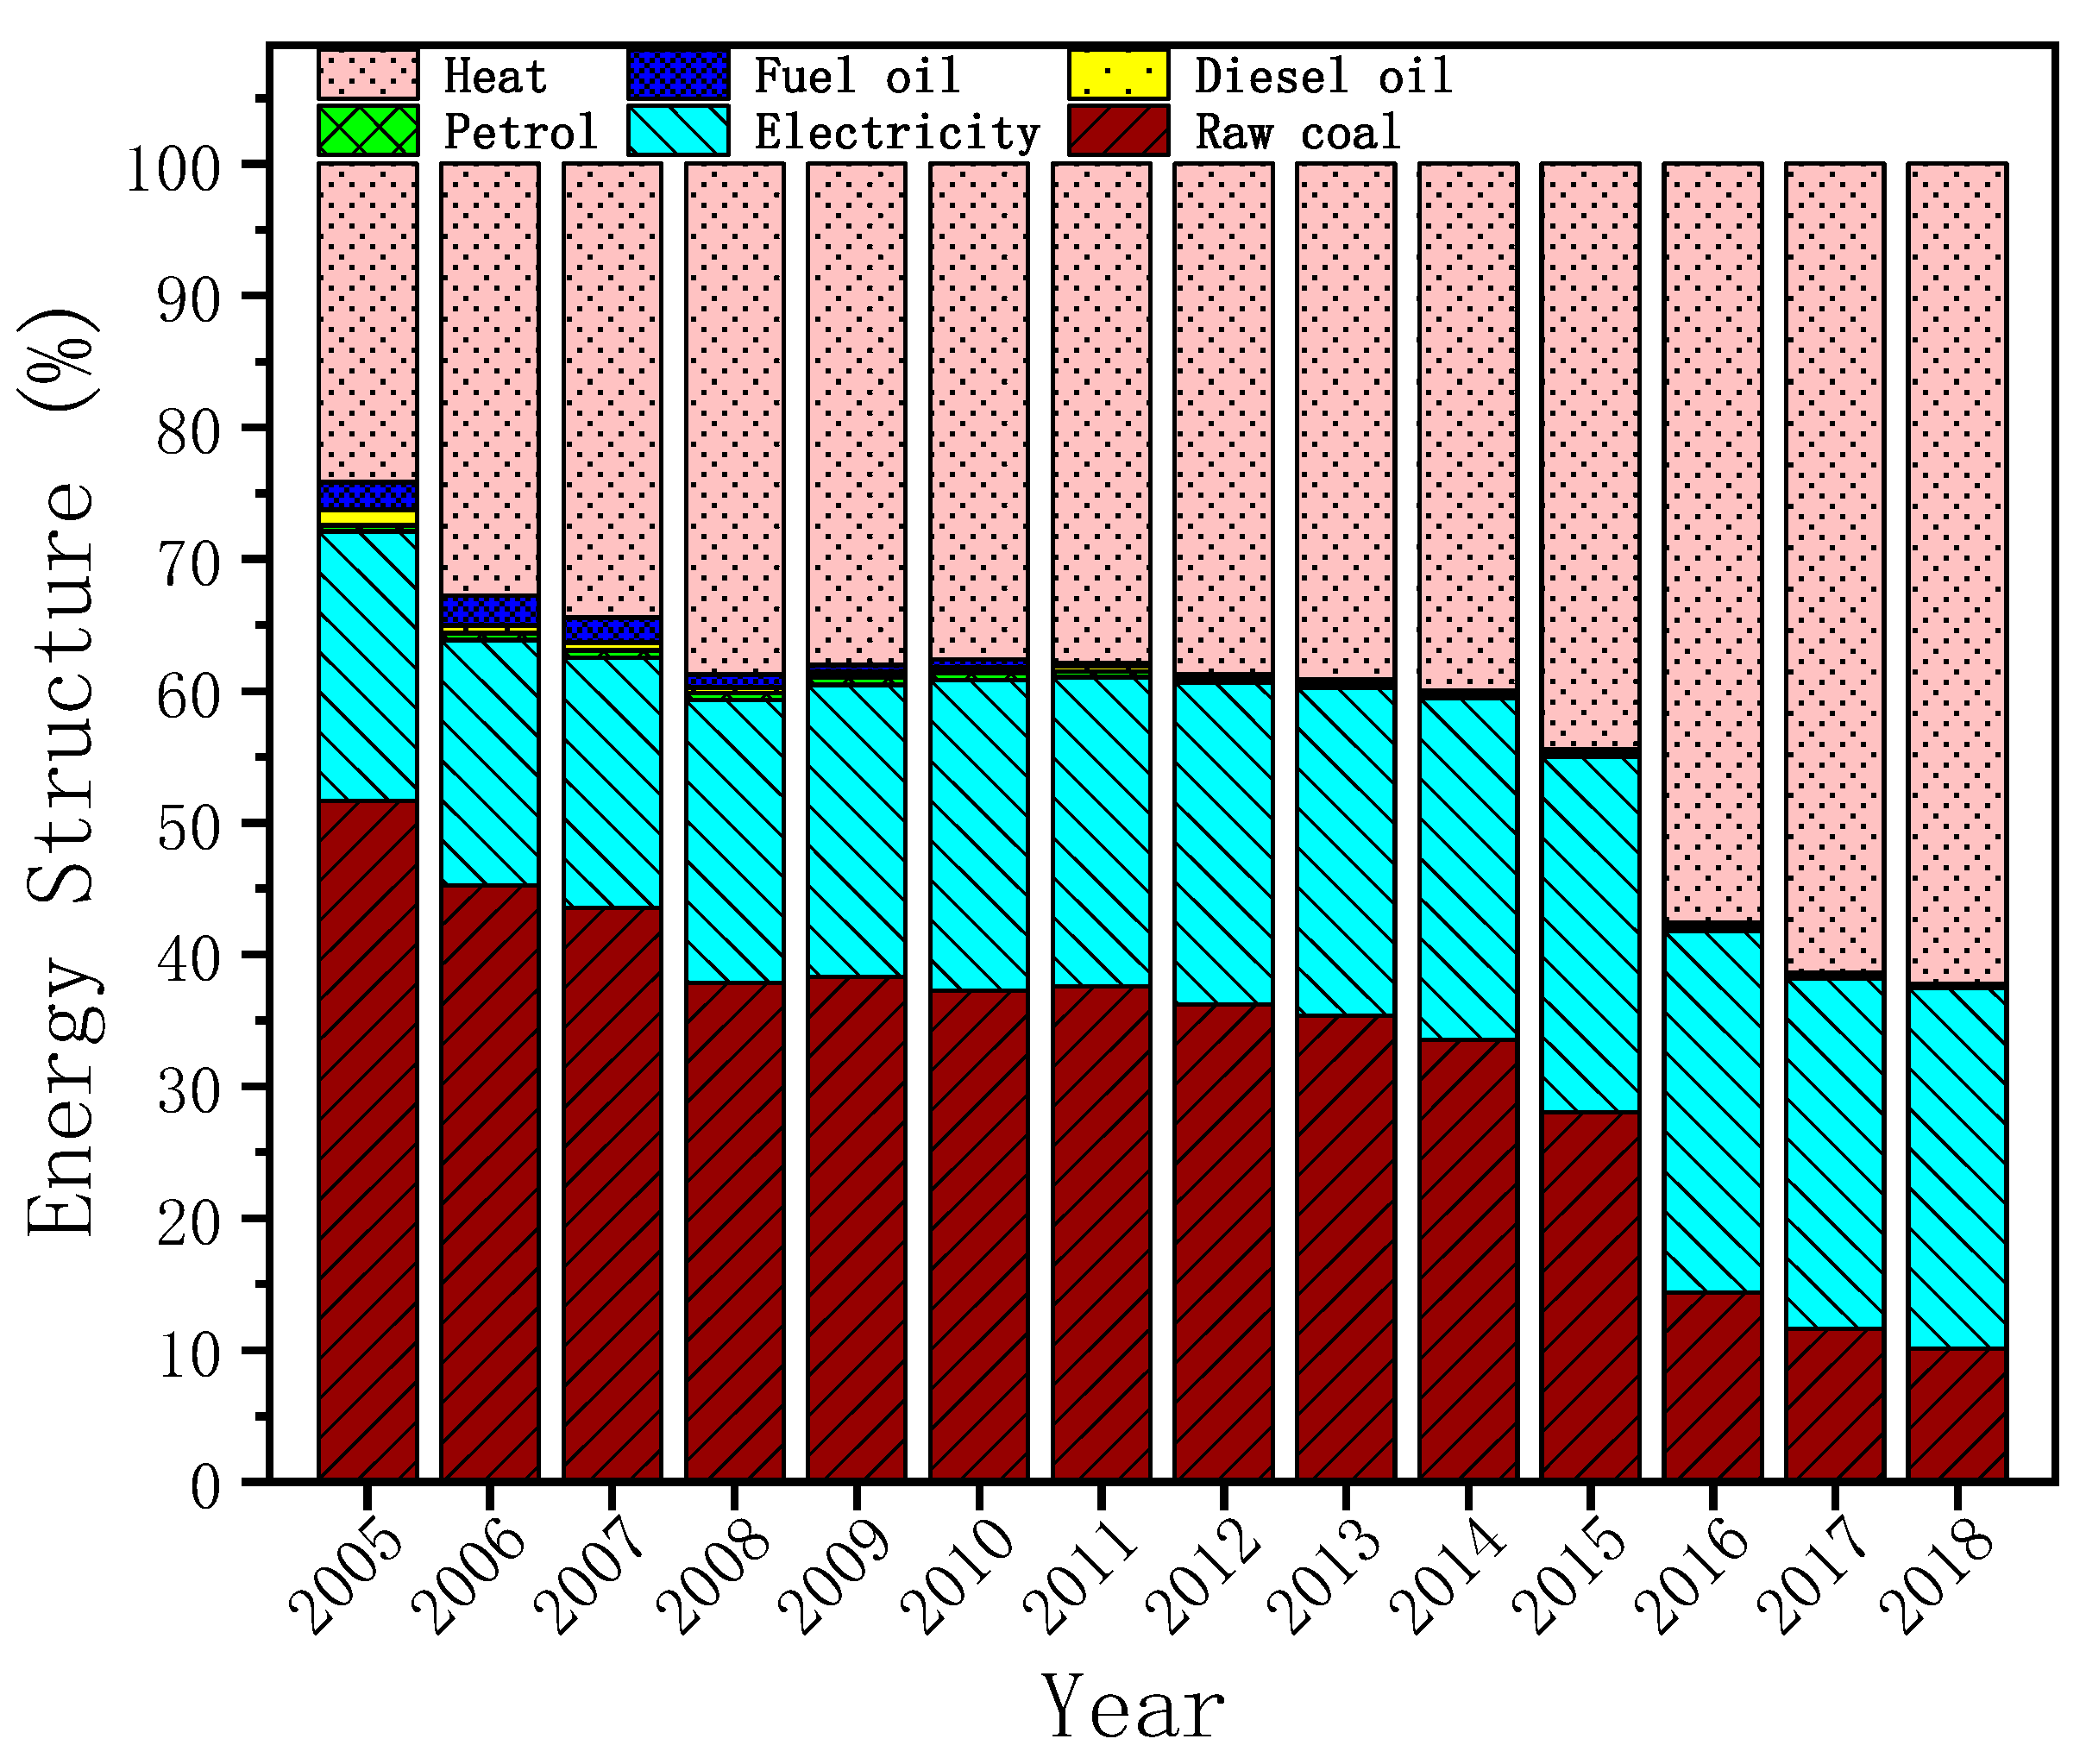
The energy structure effect is a crucial factor that restrains the growth of energy consumption. Figure 4 shows the energy structure of the textile industry in Shaoxing from 2005 to 2018. Figure 4 indicates that raw coal, heat and electricity are the main sources of energy consumption in Shaoxing’s textile industry. With the Shaoxing government’s introduction of the ‘changing coal into natural gas’ policy and textile enterprises’ updating of advanced technology and equipment, the use of electricity and heat increased significantly from 2005 to 2018, and the growth rate of heat was greater than that of electricity. Raw coal that produced a considerable amount of pollution decreased significantly during the sample period. Natural gas is the cleanest fossil fuel, with relatively low carbon intensity than coal in most end uses [48,49]. Heat produced by natural gas is a clean energy source that create CO2 emissions less than raw coal in Shaoxing’s textile industry [49]. In general, clean energy accounted for an increasing proportion of the energy structure of the Shaoxing’s textile industry. Furthermore, the consumption of electricity and heat continued to cause EFP consumption indirectly. Therefore, Shaoxing should further optimize energy structure and gradually increase the proportion of clean energy. Such optimization includes increasing the proportion of secondary energy converted from clean energy, which in turn will increase the significance of the energy conservation and environmental protection effect.

4. Conclusions

Energy consumption is a significant factor that affects the sustainable development of Shaoxing’s textile industry. A detailed analysis of energy consumption in Shaoxing’s textile industry can provide essential information for the establishment of energy policies. This study calculates the EFP of the textile industry in Shaoxing, from 2005 to 2018, and analyzes the relationship between the energy consumption and economic growth in the textile industry, as well as the four factors affecting the EFP. This study presents the following results:
(1) From 2005 to 2018, the EFP of Shaoxing first increased then decreased, with an average annual growth rate of 4.4% during the growth period (2005–2007) and an average annual decline of 7.19% during the decline period (2008–2018). The EFPI decline trend of the textile industry and MT subsector was roughly the same, with the decline trend of the MT subsector as the largest among the three subsectors. However, the change trends of the MTAFC and MCF subsectors were not obvious. Shaoxing’s textile enterprises should accelerate the development and production of ecological and functional textiles and promote environmentally friendly, energy-saving and clean production printing and dyeing technologies. Innovation funds should be set up by Shaoxing’s government and social investors, to alleviate pressure in the capital of small- and medium-sized enterprises
(2) For 13 years, from 2006 to 2018, the overall decoupling state was satisfactory. In the 10 years from 2006 to 2015, three years of weak decoupling and was followed by seven years of strong decoupling. In 2016, the state was a recessive decoupling. In 2017 and 2018, TIOV declined, and both years showed a weak negative decoupling. Energy consumption restriction policies and the popularization of energy-saving technologies promote the decoupling of energy consumption from economic growth, diminishing the gap between promoting factors and inhibiting factors. Shaoxing’s government should eliminate obsolete process equipment and shut down/close printing and dying enterprises that consume considerable amounts of energy and generate high pollution, as well as wastewater treatment facilities that cannot meet requirements.
(3) The total energy footprint effect of the textile industry showed a pulling trend from 2006 to 2018 but dropped in waves. The cumulative effect of the industrial scale was a positive factor, which played a significant role in driving the EFP. Technological innovation and cutting-edge technology applications in the textile industry of Shaoxing are necessary in order to to reduce the energy consumption. These will also improve the industrial productivity. The cumulative effects of the other three factors were negative, and the sum of the inhibitory effect was smaller than that of the industrial scale effect, among which the effect of energy consumption intensity contributed the largest inhibitory effect. Environmental policies and laws should be strengthened to reduce the proportion of the energy intensive sector and promote high value-added textile products manufacturing with less energy intensity.
Both TIOV and EFP had been rapidly decreasing for Shaoxing’s textile industry after 2015. Consequently, structural unemployment appeared, so many skilled textile workers were laid off. Supply and demand of textile products may be unbalanced in the future. Such problems should be further discussed in the future studies.

Author Contributions

Conceptualization, Y.L. and Y.Y.; methodology, L.Z.; validation, X.W., X.C., Y.C. and L.Z.; formal analysis, X.W.; investigation, X.C.; resources, Y.C.; data curation, Y.Y.; writing—original draft preparation, X.C., Y.C. and L.Z.; writing—review and editing, Y.L.; visualization, X.W.; supervision, Y.Y.; project administration, Y.L.; funding acquisition, X.W., Y.L. and Y.Y. All authors have read and agreed to the published version of the manuscript.

Funding

This research was funded by the Project of Philosophy and Social Sciences in Zhejiang Province, China (19NDJC235YB), Key projects of the national social science fund (19AZD004), General Project of Humanities and Social Sciences Research of the Ministry of Education of China (19YJCZH092), Key Project of Zhejiang Ecological Civilization Research Center of Zhejiang Provincial Key Research Base of Philosophy and Social Sciences and K. C. Wong Magna Fund in Ningbo University.

Acknowledgments

We are very grateful for the support of the School of Economics and Management/Fashion School of Zhejiang Sci-Tech University, and Zhejiang Silk and Fashion Culture Research Center for this study.

Conflicts of Interest

The authors declare no conflict of interest.

Appendix A

Table A1. Nomenclature comparison table.
AbbreviationDetailed Name
EFPEnergy footprint
EFPIEnergy footprint intensity
TIOVTotal industrial output value
LMDILogarithmic mean Divisia index
MTManufacturer of textiles
MTAFCManufacturer of textile apparel, footwear and caps
MCFManufacturer of chemical fibers

References

  1. Holdren, J.P. Science and Technology for Sustainable Well-being. Science 2008, 319, 424–434. [Google Scholar] [CrossRef] [Green Version]
  2. Magazzion, C. The Relationship among Economic Growth, CO2 Emissions and Energy Use in the APEC Countries: A Panel VAR Approach. Environ. Syst. Decis. 2017, 37, 353–366. [Google Scholar] [CrossRef]
  3. Li, Y.; Luo, Y.; Wang, Y.; Wang, L.; Shen, M. Decomposing the decoupling of water consumption and economic growth in China’s textile industry. Sustainability 2017, 9, 412. [Google Scholar] [CrossRef] [Green Version]
  4. Wang, Q.; Li, R.; Jiang, R. Decoupling and Decomposition Analysis of Carbon Emissions from Industry: A Case Study from China. Sustainability 2016, 8, 1059. [Google Scholar] [CrossRef] [Green Version]
  5. Shen, Y.; Lisa, A.A. Local environmental governance innovation in China: Staging ‘triangular dialogues’ for industrial air pollution control. J. Chin. Gov. 2018, 3, 351–369. [Google Scholar] [CrossRef]
  6. Guan, T.; Delman, J. Energy policy design and China’s local climate governance: Energy efficiency and renewable energy policies in Hangzhou. J. Chin. Gov. 2017, 2, 68–90. [Google Scholar] [CrossRef]
  7. Li, Y.; Ding, L.; Yang, Y. Can the Introduction of an Environment Target Assessment Policy Improve the TFP of Textile Enterprises? A Quasi-Natural Experiment Based on the Huai River in China. Sustainability 2020, 12, 1696. [Google Scholar] [CrossRef] [Green Version]
  8. Zhao, H.; Lin, B. Resources allocation and more efficient use of energy in China’s textile industry. Energy 2019, 185, 111–120. [Google Scholar] [CrossRef]
  9. Wang, L.; Li, Y.; He, W. The energy footprint of China’s textile industry: Perspectives from decoupling and decomposition analysis. Energies 2017, 10, 1461. [Google Scholar] [CrossRef] [Green Version]
  10. Li, Y.; Shen, J.; Lu, L.; Luo, Y.; Wang, L.; Shen, M. Water environment stress, rebound effect, and economic growth of China’s textile industry. PeerJ 2018, 6, e5112. [Google Scholar] [CrossRef]
  11. Zhao, H.; Lin, B. Impact of foreign trade on energy efficiency in China’s textile industry. J. Clean. Prod. 2020, 245, 118878. [Google Scholar] [CrossRef]
  12. Li, Y.; Wang, Y. Double decoupling effectiveness of water consumption and wastewater discharge in China’s textile industry based on water footprint theory. PeerJ 2019, 7, e6937. [Google Scholar] [CrossRef]
  13. China Statistics Press. China Statistical Yearbook on Science and Technology; China Statistics Press: Beijing, China, 1981–2013. (In Chinese) [Google Scholar]
  14. Notice of the Ministry of Industry and Information Technology on Distributing the Development Plan of the Textile Industry (2016–2020) MIIT Regulation [2016] No. 305. Available online: http://www.miit.gov.cn/n1146295/n1652858/n1652930/n3757019/c5267251/content.html (accessed on 28 February 2020). (In Chinese)
  15. Shaoxing Statistical Yearbook 2019. Available online: http://tjj.sx.gov.cn/art/2019/12/31/art_1489207_41684038.html (accessed on 13 February 2020). (In Chinese)
  16. Wackernage, M.; Lewan, L.; Hansson, C.B. Evaluating the use of natural capital with the ecological footprint Applications in Sweden and Subregions. AMBIO 1999, 28, 604–612. [Google Scholar]
  17. Palamutcu, S. Energy Footprints in the Textile Industry; Woodhead Publishing: Cambridge, UK, 2015; pp. 31–61. [Google Scholar]
  18. Lan, J.; Malik, A.; Lenzen, M.; McBain, D.; Kanemoto, K. A structural decomposition analysis of global energy footprints. Appl. Energy 2016, 163, 436–451. [Google Scholar] [CrossRef]
  19. Chen, S.Q.; Kharrazi, A.; Liang, S.; Fath, B.D.; Lenzen, M.; Yan, J.Y. Advanced approaches and applications of energy footprints toward the promotion of global sustainability. Appl. Energy 2020, 261, 114415. [Google Scholar] [CrossRef]
  20. Ozturk, H.K. Energy usage and cost in textile industry: A case study for Turkey. Energy 2005, 30, 2424–2446. [Google Scholar] [CrossRef]
  21. Hong, G.B.; Su, T.L.; Lee, J.D.; Hsu, T.C.; Chen, H.W. Energy conservation potential in Taiwanese textile industry. Energy Policy 2010, 38, 7048–7053. [Google Scholar] [CrossRef]
  22. Guo, S.; Zheng, S.; Hu, Y.; Hong, J.; Wu, X.; Tang, M. Embodied energy use in the global construction industry. Appl. Energy 2019, 256, 113838. [Google Scholar] [CrossRef]
  23. Chen, G.Q.; Wu, X.F. Energy overview for globalized world economy: Source, supply chain and sink. Renew. Sustain. Energy Rev. 2017, 69, 735–749. [Google Scholar] [CrossRef]
  24. Chen, Z.M.; Chen, G.Q. An overview of energy consumption of the globalized world economy. Energy Policy 2011, 39, 5920–5928. [Google Scholar] [CrossRef]
  25. Chen, B.; Chen, G.Q.; Yang, Z.F.; Jiang, M.M. Ecological footprint accounting for energy and resource in China. Energy Policy 2007, 35, 1599–1609. [Google Scholar] [CrossRef]
  26. Zhang, B.; Qiao, H.; Chen, Z.M.; Chen, B. Growth in embodied energy transfers via China’s domestic trade: Evidence from multi-regional input-output analysis. Appl. Energy 2016, 184, 1093–1105. [Google Scholar] [CrossRef]
  27. Zhang, B.; Chen, Z.M.; Xia, X.H.; Xu, X.Y.; Chen, Y.B. The impact of domestic trade on China’s regional energy uses: A multi-regional input-output modeling. Energy Policy 2013, 63, 1169–1181. [Google Scholar] [CrossRef]
  28. Wilson, J.; Tyedmers, P.; Grant, J. Measuring environmental impact at the neighbourhood level. J. Environ. Plan. Manag. 2013, 56, 42–60. [Google Scholar] [CrossRef]
  29. Bordigoni, M.; Hita, A.; Blanc, G.L. Role of embodied energy in the European manufacturing industry: Application to short-term impacts of a carbon tax. Energy Policy 2012, 43, 335–350. [Google Scholar] [CrossRef]
  30. Crawford, R.H. Validation of the use of input-output data for embodied energy analysis of the australian construction industry. J. Constr. Res. 2005, 6, 71–90. [Google Scholar] [CrossRef]
  31. Zhao, Y.; Onat, N.C.; Kucukvar, M.; Tatari, O. Carbon and energy footprints of electric delivery trucks: A hybrid multi-regional input-output life cycle assessment. Transp. Res. Transp. Environ. 2016, 47, 195–207. [Google Scholar] [CrossRef]
  32. Lenzen, M.; Dey, C. Truncation error in embodied energy analyses of basic iron and steel products. Energy 2000, 25, 577–585. [Google Scholar] [CrossRef]
  33. Wiedmann, T. A first empirical comparison of energy Footprints embodied in trade-MRIO versus PLUM. Ecol. Econ. 2009, 68, 1975–1990. [Google Scholar] [CrossRef]
  34. Wang, H.; Wang, G.; Qi, J.; Schandl, H.; Li, Y.; Feng, C.; Liang, S. Scarcity-weighted fossil fuel footprint of China at the provincial level. Appl. Energy 2020, 258, 114081. [Google Scholar] [CrossRef]
  35. Chang, Y.; Ries, R.J.; Wang, Y. The embodied energy and environmental emissions of construction projects in China: An economic input-output LCA model. Energy Policy 2010, 38, 6597–6603. [Google Scholar] [CrossRef]
  36. Cucek, L.; Klemes, J.J.; Kravanja, Z. A review of footprint analysis tools for monitoring impacts on sustainability. J. Clean. Prod. 2012, 34, 9–20. [Google Scholar] [CrossRef]
  37. Kenourgios, D.; Drakonaki, E.; Dimitriou, D. ECB’s unconventional monetary policy and cross-financial-market correlation dynamics. N. Am. J. Econ. Financ. 2019, 50, 101045. [Google Scholar] [CrossRef]
  38. Tapio, P. Towards a theory of decoupling: Degrees of decoupling in the EU and the case of road traffic in Finland between 1970 and 2001. Transp. Policy 2005, 12, 137–151. [Google Scholar] [CrossRef] [Green Version]
  39. Hao, Y.; Huang, Z.; Wu, H. Do Carbon Emissions and Economic Growth Decouple in China? An Empirical Analysis Based on Provincial Panel Data. Energies 2019, 12, 2411. [Google Scholar] [CrossRef] [Green Version]
  40. Zhang, Y.; Zou, X.; Xu, C.; Yang, Q. Decoupling Greenhouse Gas Emissions from Crop Production: A Case Study in the Heilongjiang Land Reclamation Area, China. Energies 2018, 11, 1480. [Google Scholar] [CrossRef] [Green Version]
  41. Roman, R.; Cansino, J.M.; Botia, C. How far is Colombia from Decoupling? Two-level decomposition analysis of energy consumption changes. Energy 2018, 148, 687–700. [Google Scholar] [CrossRef]
  42. Li, Y.; Lu, L.; Tan, Y.; Wang, L.; Shen, M. Decoupling water consumption and environmental impact on textile industry by using water footprint method: A case study in China. Water 2017, 9, 124. [Google Scholar] [CrossRef]
  43. Ang, B.W. The LMDI approach to decomposition analysis: A practical guide. Energy Policy 2005, 33, 867–871. [Google Scholar] [CrossRef]
  44. Xia, C.; Li, Y.; Ye, Y.; Shi, Z.; Liu, J. Decomposed driving factors of carbon emissions and scenario analyses of low-carbon transformation in 2020 and 2030 for Zhejiang Province. Energies 2017, 10, 1747. [Google Scholar] [CrossRef] [Green Version]
  45. The People’s Government of Zhejiang Province during the ‘12th Five-Year Plan’ Period of Heavy Pollution and High Energy Consumption, the Guiding Opinions on Deepening the Rectification of the Industry and Promoting Improvement (Zhe Zheng Fa [2011] No. 107). Available online: http://www.zj.gov.cn/art/2012/7/14/art_1582424_26042073.html (accessed on 13 February 2020). (In Chinese)
  46. Implementation Plan for the Transformation and Upgrade of the Printing and Dyeing Industry in Shaoxing City (Shao Zheng Ban Fa [2013] No. 106). Available online: http://www.sx.gov.cn/art/2013/7/16/art_1467567_160160.html (accessed on 13 February 2020). (In Chinese)
  47. Notice of the Shaoxing Municipal People’s Government Office on Accelerating the Coal-to-Natural Gas Work of Printing and Dyeing Enterprises (Shao Zheng Ban Fa (2012) No. 158). Available online: http://www.sx.gov.cn/art/2013/2/19/art_1463812_18069826.html (accessed on 13 February 2020). (In Chinese)
  48. Liu, Z.; Guan, D.; Douglas, C.B.; Zhang, Q.; He, K.; Liu, J. A low-carbon road map for China. Nature 2013, 500, 143–145. [Google Scholar] [CrossRef] [PubMed]
  49. Qin, Y.; Höglund-Isaksson, L.; Byers, E.; Feng, K.; Wagner, F.; Peng, W.; Mauzerall, D.L. Air quality–carbon–water synergies and trade-offs in China’s natural gas industry. Nat. Sustain. 2018, 1, 505–511. [Google Scholar] [CrossRef] [Green Version]
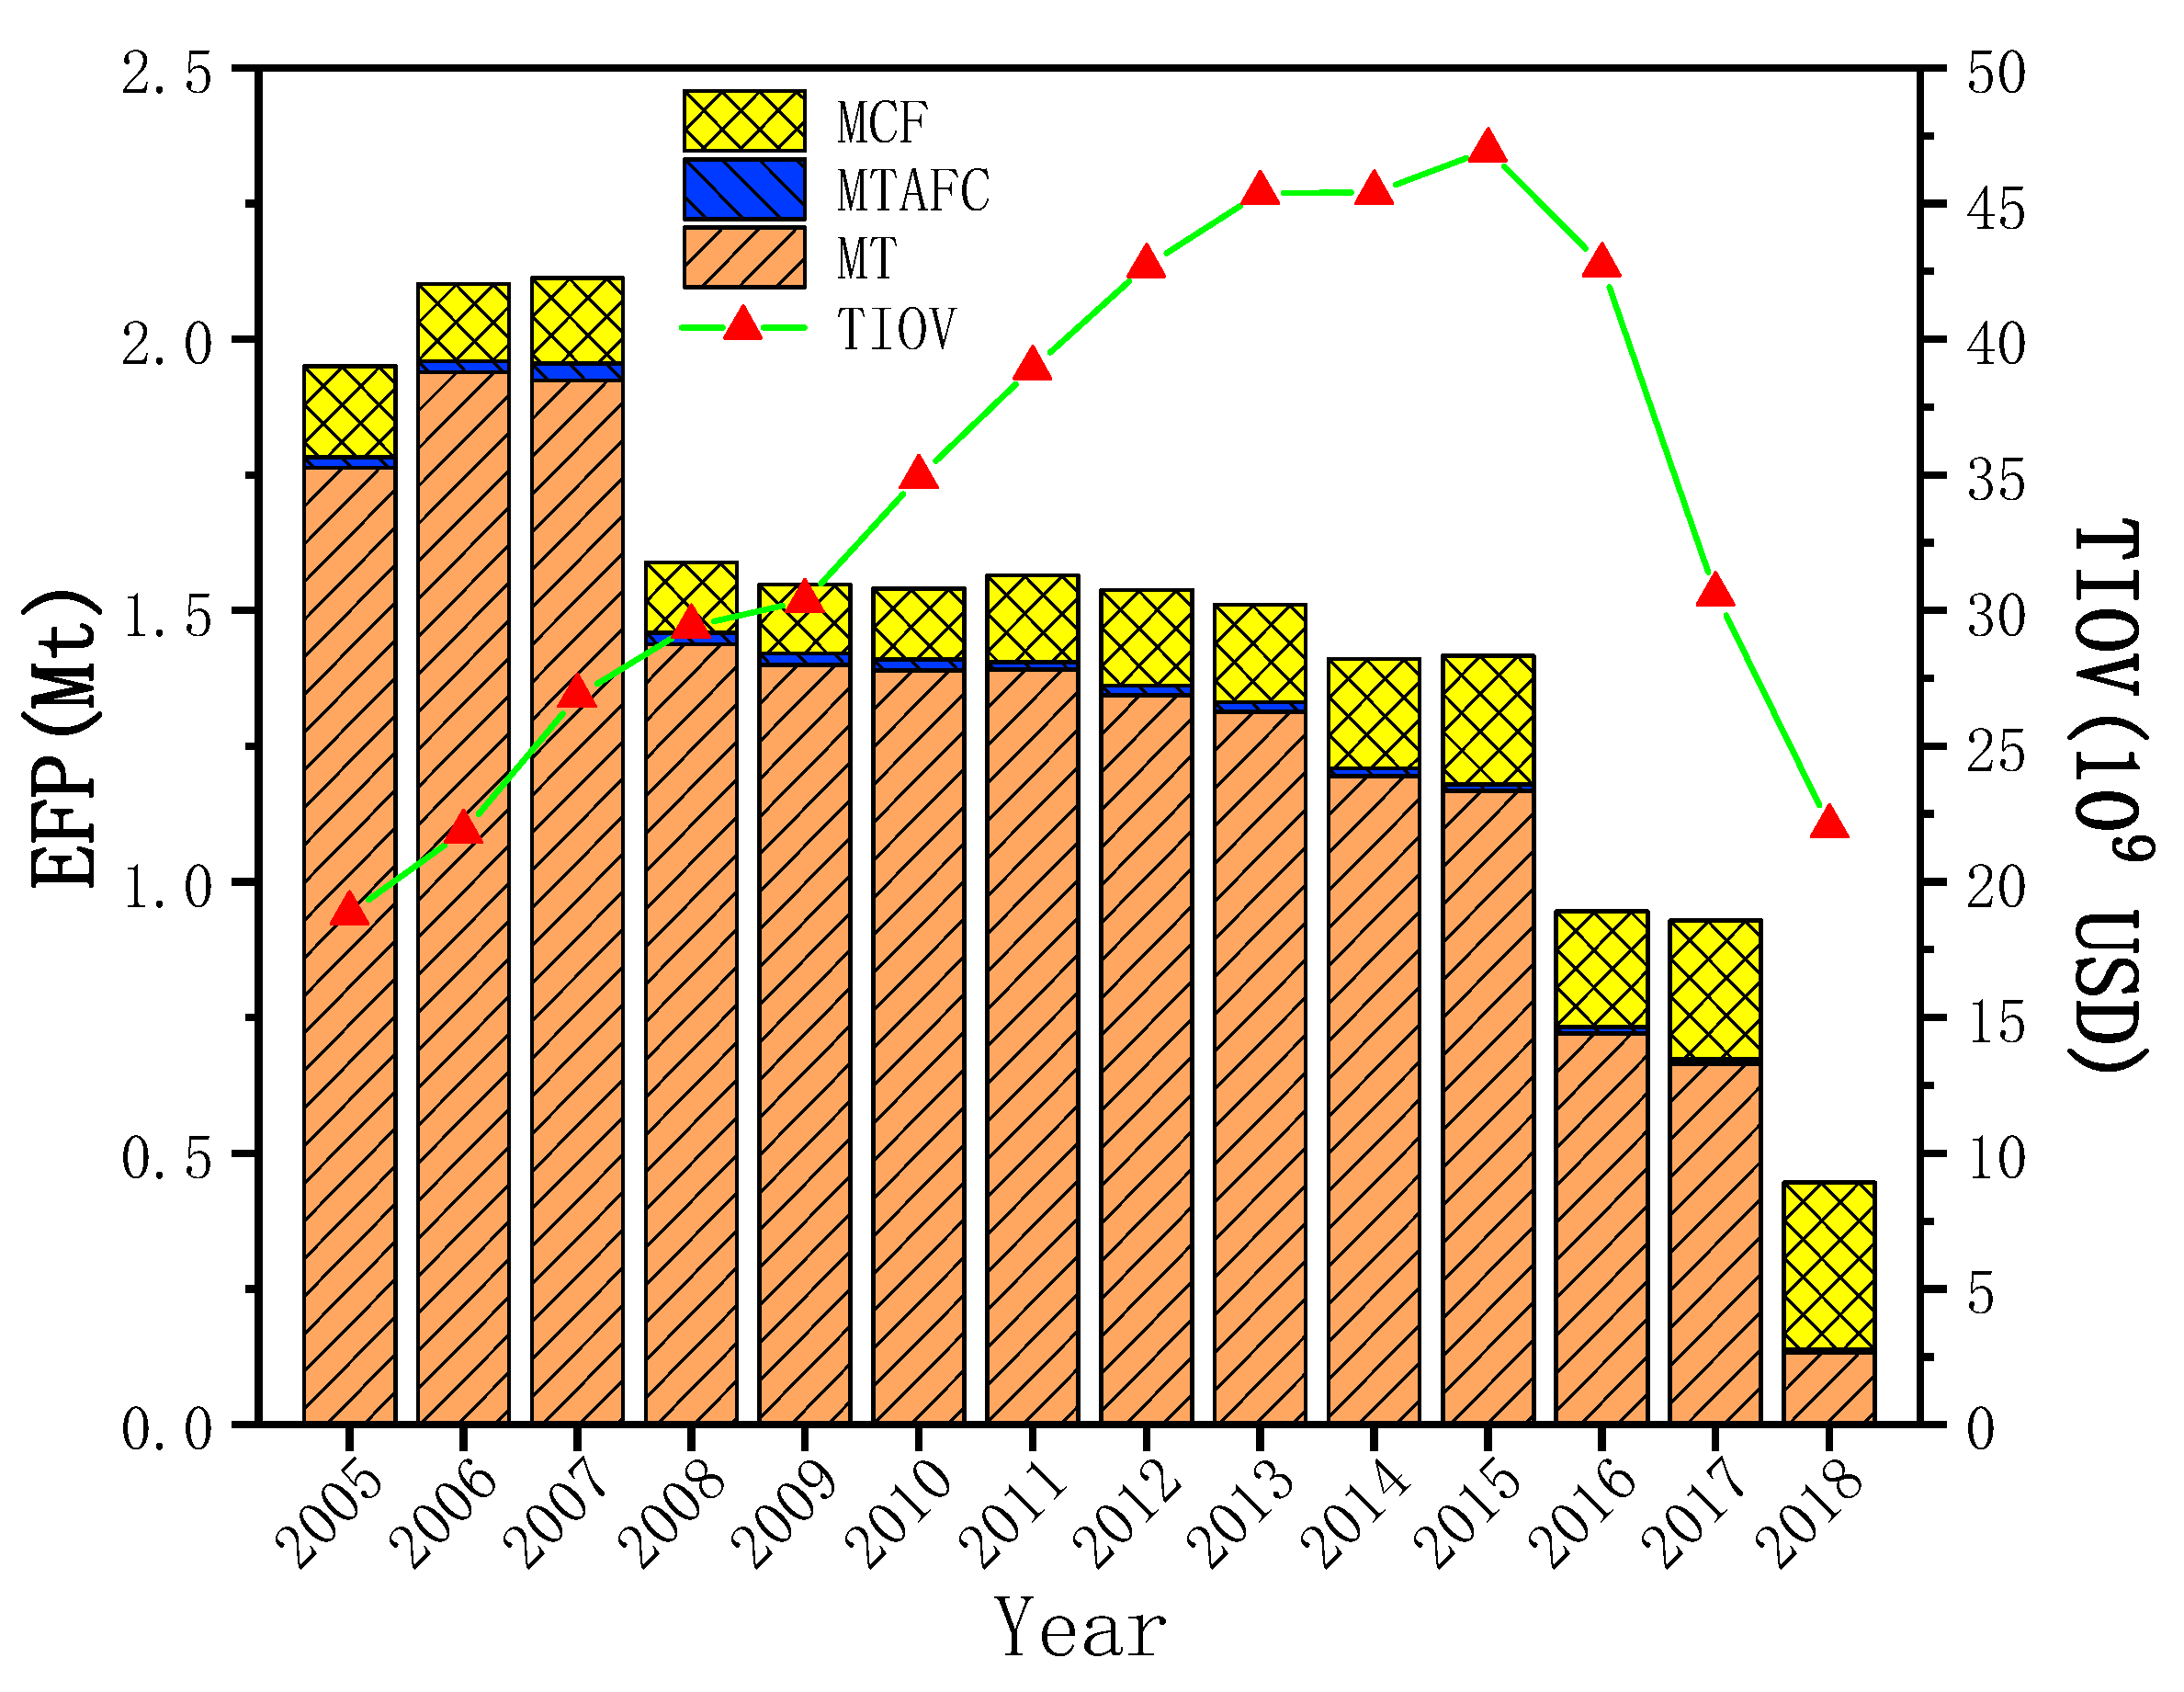
Figure 1. EFP of Shaoxing’s textile industry and the subsectors and TIOV of Shaoxing’s textile industry during 2005–2018.
Energies 13 01683 g001
Figure 2. EFPI of Shaoxing’s textile industry and the subsectors during 2005–2018.
Energies 13 01683 g002
Figure 3. EFP effect decomposition of Shaoxing’s textile industry during 2006–2018.
Energies 13 01683 g003
Figure 4. The energy structure of Shaoxing’s textile industry during 2005–2018.
Energies 13 01683 g004
Table 1. Tapio decoupling model division method.
Decoupling State % Δ E F P % Δ T I O V E
Strong decoupling+(−∞, 0)
Weak decoupling++(0, 0.8)
Recessive decoupling(1.2, +∞)
Expansive coupling++(0.8, 1.2)
Recessive coupling(0.8, 1.2)
Expansive negative decoupling++(1.2, +∞)
Weak negative decoupling(0, 0.8)
Strong negative decoupling+(−∞, 0)
Table 2. Meanings of the decomposition analysis model variables.
VariableMeaningVariableMeaning
E i j the consumption amount of energy j in the subsector i I i TIOV proportion of subsector i in textile industry, i.e., the industry structure factor
T I O V i the TIOV of subsector i T i The energy intensity of subsector i
E i the total energy consumption in the subsector i S i j The ratio of energy j consumption in subsector i to total energy consumption in the industry, i.e., the energy structure factor
Table 3. Decoupling state between TIOV and EFP of Shaoxing.
Year % Δ E F P % Δ T I O V E Decoupling State
20060.080.170.45Weak decoupling
20070.010.260.02Weak decoupling
2008−0.250.16−1.55Strong decoupling
2009−0.030.03−0.95Strong decoupling
2010−0.010.20−0.03Strong decoupling
20110.020.170.09Weak decoupling
2012−0.020.12−0.15Strong decoupling
2013−0.020.08−0.23Strong decoupling
2014−0.070.02−3.55Strong decoupling
20150.0050.040.12Strong decoupling
2016−0.33−0.084.39Recessive decoupling
2017−0.02−0.270.07Weak negative decoupling
2018−0.04−0.260.14Weak negative decoupling