Article

Energy, Economic, and Environmental Evaluation of a Proposed Solar-Wind Power On-grid System Using HOMER Pro®: A Case Study in Colombia

by
Farid Antonio Barrozo Budes
1,
Guillermo Valencia Ochoa
1,
Luis Guillermo Obregon
2,
Adriana Arango-Manrique
3 and
José Ricardo Núñez Álvarez
4,*
1
Mechanical Engineering Department, Universidad del Atlántico, Carrera 30 Número 8-49, Puerto Colombia, Barranquilla 080007, Colombia
2
Research Group on Sustainable Chemical and Biochemical Processes, Chemical Engineering Department, Universidad del Atlántico, Carrera 30 Número 8-49, Puerto Colombia, Barranquilla 080007, Colombia
3
Electrical and Electronic Engineering Department, Universidad del Norte, Km 5 Vía Puerto Colombia, Barranquilla 080007, Colombia
4
Energy Department, Universidad de la Costa, Calle 58 Número 55- 66, Barranquilla 080002, Colombia
*
Author to whom correspondence should be addressed.
Energies 2020, 13(7), 1662; https://doi.org/10.3390/en13071662
Submission received: 17 March 2020 / Revised: 28 March 2020 / Accepted: 29 March 2020 / Published: 2 April 2020
(This article belongs to the Special Issue Alternative Energy Sources)

Abstract

:
The electrical sector in the Caribbean region of Colombia is currently facing problems that affect its reliability. Many thermo-electric plants are required to fill the gap and ensure energy supply. This paper thus proposes a hybrid renewable energy generation plant that could supply a percentage of the total energy demand and reduce the environmental impact of conventional energy generation. The hybrid plant works with a photovoltaic (PV) system and wind turbine systems, connected in parallel with the grid to supply a renewable fraction of the total energy demand. The investigation was conducted in three steps: the first stage determined locations where the energy system was able to take advantage of renewable sources, the second identified a location that could work more efficiently from an economic perspective, and finally, the third step estimated the number of PV solar panels and wind turbines required to guarantee optimal functioning for this location using, as a main method of calculation, the software HOMER pro® for hybrid optimization with multiple energy resources. The proposed system is expected to not only limit environmental impacts but also decrease total costs of electric grid consumption from thermoelectric plants. The simulations helped identify Puerto Bolivar, Colombia, as the location where the hybrid plant made the best use of non-conventional resources of energy. However, Rancho Grande was found to offer the system more efficiency, while generating a considerable amount of energy at the lowest possible cost. An optimal combination was also obtained—441 PV arrays and 3 wind turbines, resulting in a net present cost (NPC) of $11.8 million and low CO2 production of 244.1 tons per year.

1. Introduction

The continuous increase in greenhouse effects in the energy field [1,2], the potential danger that represents the future of this trend, and the continuous rise in this kind of energy production boost the development of new trends of energy generation (NTEG), which lead to energy transition [3,4,5]. NTEG will be independent of hydrocarbons and fossil fuels because research on clean energy acquisition methods is on the rise, offering reliable solutions to the current problem [6,7]. Solar and wind energy systems are the most selected methods for clean energy production because of their viability and easy acquisition [8]. In 2006, the World Energy Outlook estimated that energy production could be duplicated in 25 years. Furthermore, the publication also expects a growth of 57% in renewable energy production [9]. The boost from new trends in renewable energy generation takes into consideration the current development of technologies that can be used to obtain energy from the movement of the sea waves, as well as ocean currents. There are other ways to obtain renewable energy, one of which is the photovoltaic (PV) system. Asia Pacific is estimated to remain the global PV leader in 2025 with the largest installed solar PV facility in the world [10]. The PV market has grown in both developed and developing countries, implying that renewable energy is a viable global resource. The world’s largest PV energy production from an installed plant is located in Pavagada solar park in India. The park, which can generate up to 2 GW, was fully functional in 2019 [11]. A report in the Journal of Geophysical Research estimated that the highest reachable capacity of wind energy around the world is approximately 72 million GW, which corresponds to 500% more than the energy consumption of every kind of power [12].
Hybrid energy, which is the use of different kinds of energy, is more efficient than conventional energy generation. The availability of wind energy in Colombia, combined with biomass energy, has had a significant influence on the Caribbean region [13]. The exploitation of this source of energy can be an excellent solution to the energy problems prevalent in the region [14]. This solution lies in the design of a hybrid renewable energy plant that has the capacity to use all the renewable energy resources existing in this region [15].
However, fossil fuels are still considered the main energy source in the region, although they cause considerable damage to the environment by the high generation of greenhouse gases [6,16]. The use of fossil fuels by “fracking” increases greenhouse gases and other gases like arsenic and mercury [10]. Greenhouse gas emissions increased by at least 70% in the period between the 1970s to the beginning of the 21st century, with the energy sector being the main responsible factor [17]. An analysis by the Oak Ridge National Laboratory (Tennessee, United States) on carbon dioxide emissions states that greenhouse gasses in Colombia increased from 16 megatons to 84 megatons (80%) in the 1960s to 2014; it was compared to Portugal, Finland, Chile, Austria, Sweden, Ireland, and Hungary [18].
At present, energy potential (wind and solar energy) in the Caribbean Colombian region is going to waste, more specifically in La Guajira department; these forms of renewable energy can help mitigate greenhouse emissions and increase electricity generation. With hybrid systems, operating costs are reduced because they do not require as much maintenance as conventional energy generation methods, and owing to a learning curve that helps people understand how this technology operates [19].
The Hybrid Optimization for Multiple Energy Resources (HOMER) software provides the necessary tools to establish different simulations with multiple energy resources [20] and study behavior over time. This enables the simulation of a hybrid power plant with twice or more renewable resources. This academic tool can be used to determinate viability from economic and environmental perspectives and/or energy generation systems. Therefore, HOMER is ideal for this research work.
The main contribution of this research is to highlight the renewable energy potential in the Caribbean region of Colombia (more specifically in La Guajira), showcase the possibilities to meet the growing energy demand, and offer renewable energy as a great solution to the region’s problems. The following sections of the paper are organized as follows. Section 2 provides the legal and regulatory framework for renewable energy projects, a description of the available sources in different locations of La Guajira, a scheme of the proposed system, and the planning undertaken for this research. Section 3 provides the theory and equations required to implement the study. Section 4 presents the results of the simulations with a complete analysis.

2. Contextualization and Required Information

This section highlights the Colombian policy associated with renewable integration in the electrical grid. It also gives geographical details of the different weather stations located in La Guajira, Colombia. The tables and graphs presented in this section contain relevant data obtained by the meteorological stations over 20 years. In addition, this research work’s planning process is described.

2.1. Political Context

Colombia has a legal and policy framework that helps justify the development of this research work; it is shown in Figure 1 [21]. It is important to note that the legal framework is responsible for establishing limits and penalties for all future projects. An essential point of the policy is to provide economic benefits for projects that meet their guidelines and contribute to the development of new trends—in this case, the energy sector. The benefits include reduction in taxes, such as the cost of importing energy generating devices from renewable sources, and return on investment in net income coming directly from the state. In some countries, the production of clean energy in homes is promoted through incentives for those who provide this type of resource as a surplus in the community power grid.

2.2. Energy System Scheme

The data were obtained from different meteorological stations located in La Guajira department, Colombia, as shown in Figure 2. There are nine stations dedicated to collecting temperature, wind speed, and solar radiation data. The data of pressure, relative humidity, and temperature in Figure 2 correspond to average yearly values.
In order to provide accurate results and establish the ideal location to use solar and wind energy, it was necessary to obtain data from each of the meteorological stations and pinpoint their specific locations [22].
After studying the problem mentioned in this study, the creation of a hybrid wind and solar power generation plant was proposed to tap into the energy potential (Figure 3). This plant is proposed to have wind turbines 80 m in rotor height and with output power of 1.5 MW each, and an inverter module system like the Goldwind PMDD 1.5 MW Wind turbine [23]. A set of PV arrays (1kW per array) with 4 PV modules of 250 W each and a converter module system were proposed to work together with the turbine’s wind power to take advantage of the high energy potential in the area. The map is divided into two different zones to establish areas influenced by wind speed and zones where potential renewable energy is higher and meteorological stations are located.

2.3. Planning

The investigation was carried out in three stages. The first stage involved the analysis of data collected from the weather stations over 10 years. The data concerning energy production and renewable fraction were studied without considering the costs on the system in an effort to estimate locations where renewable energy sources could be used in higher proportions.
The second stage sought to determine the most efficient location for a hybrid energy system that uses both wind and PV systems, working at the same time. This stage focuses on an economic perspective to study the results of total energy production, fraction of renewable energy, and aspects such as total net present cost (NPC) and CO2 production to determine a location with optimal behavior.
The third stage determined the most efficient arrangement of wind and PV technologies working together, that is, the ideal number of wind turbines and PV panels depending on the energy demand and characteristics of the selected location. Finally, the grid power that the plant could develop, and its optimal composition was determined.
The first and second stages were calculated using simulations made in HOMER Pro software. The third stage used an optimization process through the MATLAB optimization function called Optimtool and the TOPSIS method for Pareto optimization. The data was used in the MATLAB curve fitting complement to determine the corresponding function for two main optimization objectives (energy cost and CO2 emissions).

2.4. Renewable Energy Resource Data

Figure 4, and Table 1 and Table 2 show the curves corresponding to wind speed in different locations at an altitude of 80 m with the corresponding temperature and solar radiation matrices for nine measurement points during a year, where AP means “Almirante Padilla” influence zone, and PB means “Puerto Bolivar” influence zone.
It is important to highlight the need to consider temperature in this case study. La Guajira, being a coast, is one of the warmest places in the Colombian territory. In addition, PV panels have a deficit when the temperature over them is too high. Furthermore, the physical properties of wind see a negative change with temperature increase. This reduces the amount of energy generated from PV arrays and wind turbines. Therefore, the temperature factor in the simulations was not considered, as it could represent possible incorrect results in this investigation.

2.5. Forecasting of Energy Demand

Thermoelectric plants are essential in the Colombian energy dispatch. However, large quantities of fossil fuels are required in thermoelectric plants, which means high and continuous operating costs, in addition to the high production of polluting gases and the legal consequences [24].
For this reason, it is necessary to implement a hybrid renewable energy generation plant that can replace a high percentage of the energy produced in thermoelectric plants. It would help in reducing the use of thermoelectric plants and facilitate their operation. If optimal operation of the hybrid plant is found, it could guarantee supply security and even enable selling of the remaining energy to the electric grid.
It was necessary to determine energy demands as a function of time, as shown in Figure 5. The energy that can be produced in thermoelectric plants is then compared with that produced by wind and solar systems. The effect of temperature is taken into account. Table 3 shows the parameters used in this research.

3. Methodology

3.1. Wind Speed Estimation

The Weibull probability distribution was implemented to estimate the most probable wind speed in different locations using maximum and minimum values. A random variable x has a Weibull distribution if its probability density function is given as shown in Equation (1) [25].
f x ; α , θ = α θ α · x α 1 · e x p x / θ α x 0 0 x < 0
The parameters α and θ [26] are estimated with experimental data. Depending on their values, Equation (1) can obtain the form of Equation (2), called the function of the probability density of the Rayleigh distribution:
f x ; σ 2 = x σ 2 · exp ( x 2 / 2 σ 2 ) x > 0
In this case study, the factors of the different types of distribution expressed monthly for the locations of Puerto Bolívar and Almirante Padilla are presented in Table 4. On the other hand, Figure 6 shows the different velocity distributions of wind speed.
The data for wind velocity were taken at a height of 10 m. Hellman’s exponential law was used to determine the average wind velocity at any altitude:
V h = V 10 · h / 10 μ
where, Vh is wind velocity at the required altitude h, V10 is the wind velocity at altitude of 10 m, and μ is the Hellman exponent, which varies with the roughness of the terrain [27]. These values were found to be 0.28 and 0.14 for the locations of Almirante Padilla and Puerto Bolívar airport, respectively [13].

3.2. HOMER Economic Analysis

In the principal cost analysis, total net present cost (NPC) and cost of energy (COE) are determined using Equation (4).
N P C $ = T A C / C R F
where, TAC is the total annualized cost and CFR is the capital return factor, calculated using Equation (5).
C R F $ = i · 1 + i N / 1 + i N 1
where, N is the number of years, and i is the annual range of real interest [%]. The cost of energy COE is the average unit cost of energy produced [$/kWh], and is determined using Equation (6).
C O E $ / k W h = C t o t . a n n / E
where, Ctot.ann is the total annual cost, and E is the total energy consumption per year.

3.3. HOMER Estimation of the Output Power of PV Panels

Equation (7) is used to determine the output power of PV panels:
P P V = Y P V · f P V · G T G T , S T C · 1 + α P · T c T c , S T C
where, YPV is the nominal capacity of the panel matrix, fPV is the reduction factor of the panels, GT is the incident solar radiation in the PV matrix in the current time step, GT,STC is the radiation incident in standard conditions, αP is the power temperature coefficient, Tc is the temperature of the PV cell in the current time step, and Tc,STC is the temperature of the PV cell under conditions of a standard test.

3.4. HOMER Estimation of the Output Power of Wind Turbines

Equation (8) is used to determine the output power of wind turbines.
P W T G = ρ ρ 0 · P W T G , S T P
where PWTG is the output power of the wind turbine, PWTG,STP is the output power of the wind turbine at standard conditions, ρ is the actual density of air, and ρ0 is the density of air at standard conditions.

3.5. Curve Fitting and Multi-Objective Optimization of the Forecast

With tabulated data, curve fitting using regressions is necessary; thus, it is important to have the best mathematical function to make forecasts. Optimtool was thus implemented to create an optimization process using the previously found function and determine Pareto’s efficiency as a way of plotting the results. Pareto’s efficiency shows a set of solutions delimited by the values closest to the origin coordinate if it is a minimum optimization; or, on the contrary, if it is a maximum optimization, the solution is delimited with the farthest values. The study then proceeded to use the multiple criteria method called Technique for Order of Preference by Similarity to Ideal Solution (TOPSIS) [28]. This method selects one of the values obtained in the Pareto efficiency, using the closest distance of any data from the lower vertex delimited by both ends of the graph. This technique uses the following equation:
d i x = j = 1 n t i j t x j 2   ,       i = 1 , 2 , , m     d i y = j = 1 n t i j t y j 2   ,       i = 1 , 2 , , m
where dix and diy are the distances from the selected point tij to the ideal positive point txj, and the ideal negative point tyj, respectively.
The relative proximity to the ideal solution (Siy) is determined by Equation (10):
S i y = d i y d i y + d i x                     0 S i y 1
This method allows to determine the best operating conditions for a system based on mathematical tools. However, it is also possible to achieve optimal conditions of power generation systems through advanced exergetic analysis, which are formulations based on the physical phenomena involved in each piece of equipment in the system [29,30].

4. Results and Discussions

This section presents the energy results, economic perspective, and multi-objective optimization.

4.1. Energy Results

Figure 7 shows the profile of the energy production obtained by PV systems, their nominal output power, and equivalent PV hours per year in multiple locations in La Guajira, Colombia. In this step, device replacement and capital costs are not considered, because the objective of this section is to evaluate the energy generation potential of the hybrid system.
Figure 7 shows that the most significant annual energy production is in the town of Urumita. However, this does not mean that Urumita is the best location. It is necessary to quantify the efficiency of the devices to determine an optimal location for the PV system. The fraction between the nominal PV power and the energy generated per year gives a specific number of hours for each location in one year. Therefore, it estimates how PV arrays take advantage of solar light during operation, which means that locations where PV arrays have the longer number of hours per year will take more advantage of solar radiation.
On the other hand, it is necessary to highlight that PV output power indicates the nominal power for all the set of PV arrays connected between them, which are made of 4 panels with 250 W each. On this basis, Puerto Bolívar was identified as the location where the system works with the highest number of hours, despite having less energy generation compared to the other locations. This means that Puerto Bolívar is the best place to use our PV system. In percentage terms, the efficiency of this system is the fraction between the worked hours per year and the hours of one year, which gives an efficiency of 21.9%.
Subsequently, the optimal location for the wind system was determined. Considering that the use of wind turbines with hub height of 80 m and nominal power of 1.5 MW is fixed, a comparison was made between the number of wind turbines (given by the software for each location) and the energy production generated per year, which points towards the ideal location (Figure 8).
Figure 8 shows six locations where the system considered five 1.5 MW turbines to reach the energy production plotted in the previous graphic for each location, while the other three only needed four turbines to reach a higher amount of energy. Thus, these three locations were analysed to find the area with the highest generation of wind power: Nazareth was identified as the location with 0.4% and 0.18% more wind power, compared to Puerto Bolívar and Rancho Grande, respectively.
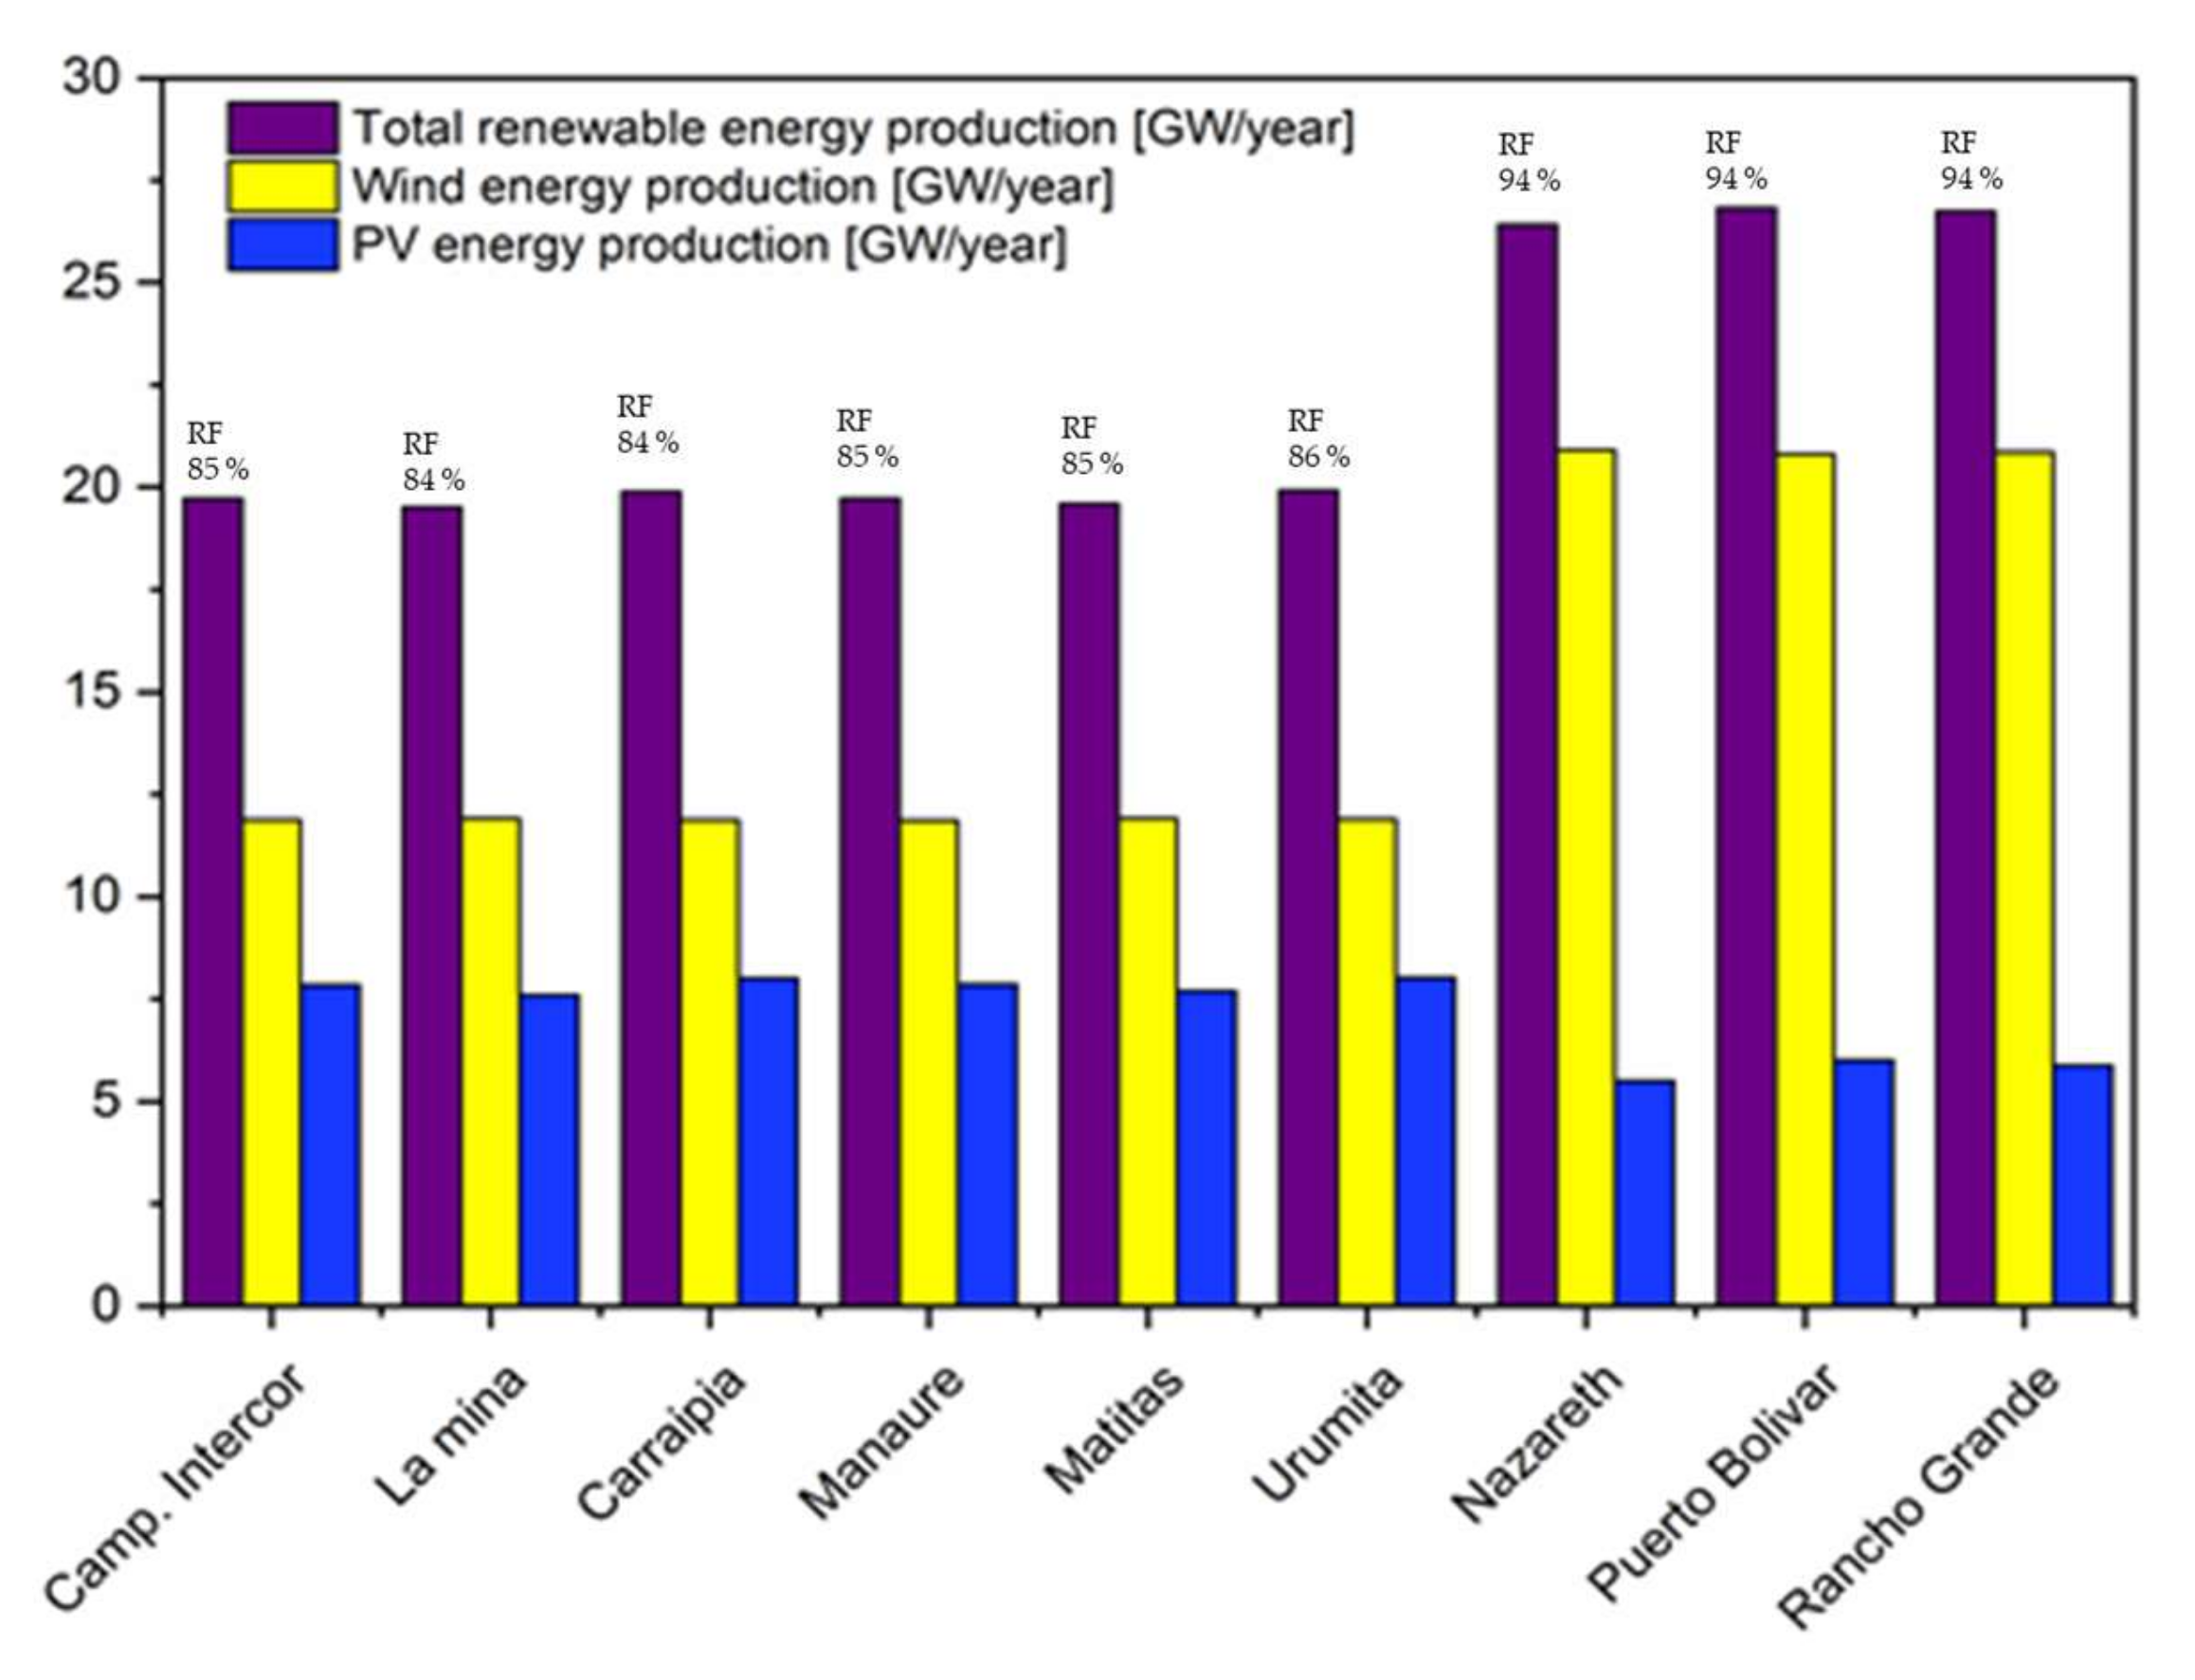
After the best location for installation of the wind generation system was identified, the optimal general location was determined since the optimal sites for both types of devices are different. Therefore, it was necessary to analyse the percentage of renewable fraction present in each of the locations to identify which of these two locations generates the highest amount of renewable energy. The renewable fraction in a system is the ratio of the amount of clean energy produced and the total energy demand of our system.
Once the optimal location was determined, the parameters of the hybrid renewable energy generation plant were modified to increase power generation, resulting in a decrease in costs.
Figure 9 shows that Nazareth, Puerto Bolivar, and Rancho Grande are the locations with the highest RF percentage to produce energy by renewable resources. However, these values have a minimal difference, which means that it is necessary to verify the second step of the simulation; this refers to an economic perspective to determine the optimal location.

4.2. Economic Perspective

The simulation requires capital and replacement costs for PV systems and wind turbines. A generic PV array (1 kW; 4 × 250 W) with a capital cost of USD 3000 and a replacement cost of USD 3000 was used. Generic wind turbines of 1.5 MW with a capital cost of USD 3,000,000 and a replacement cost of USD 3,000,000 were used. The effects of temperature were considered in the simulation.
Using generic energy demand based on the requirements of La Guajira department, simulation at this stage resulted in a single generic wind turbine for each location. Therefore, Figure 10 and Figure 11 show the relationship of the number of PV panels with net present cost (NPC), total energy production, a fraction of renewable energy, and CO2 emissions for the following locations: Nazareth, Port Bolívar, and Rancho Grande.
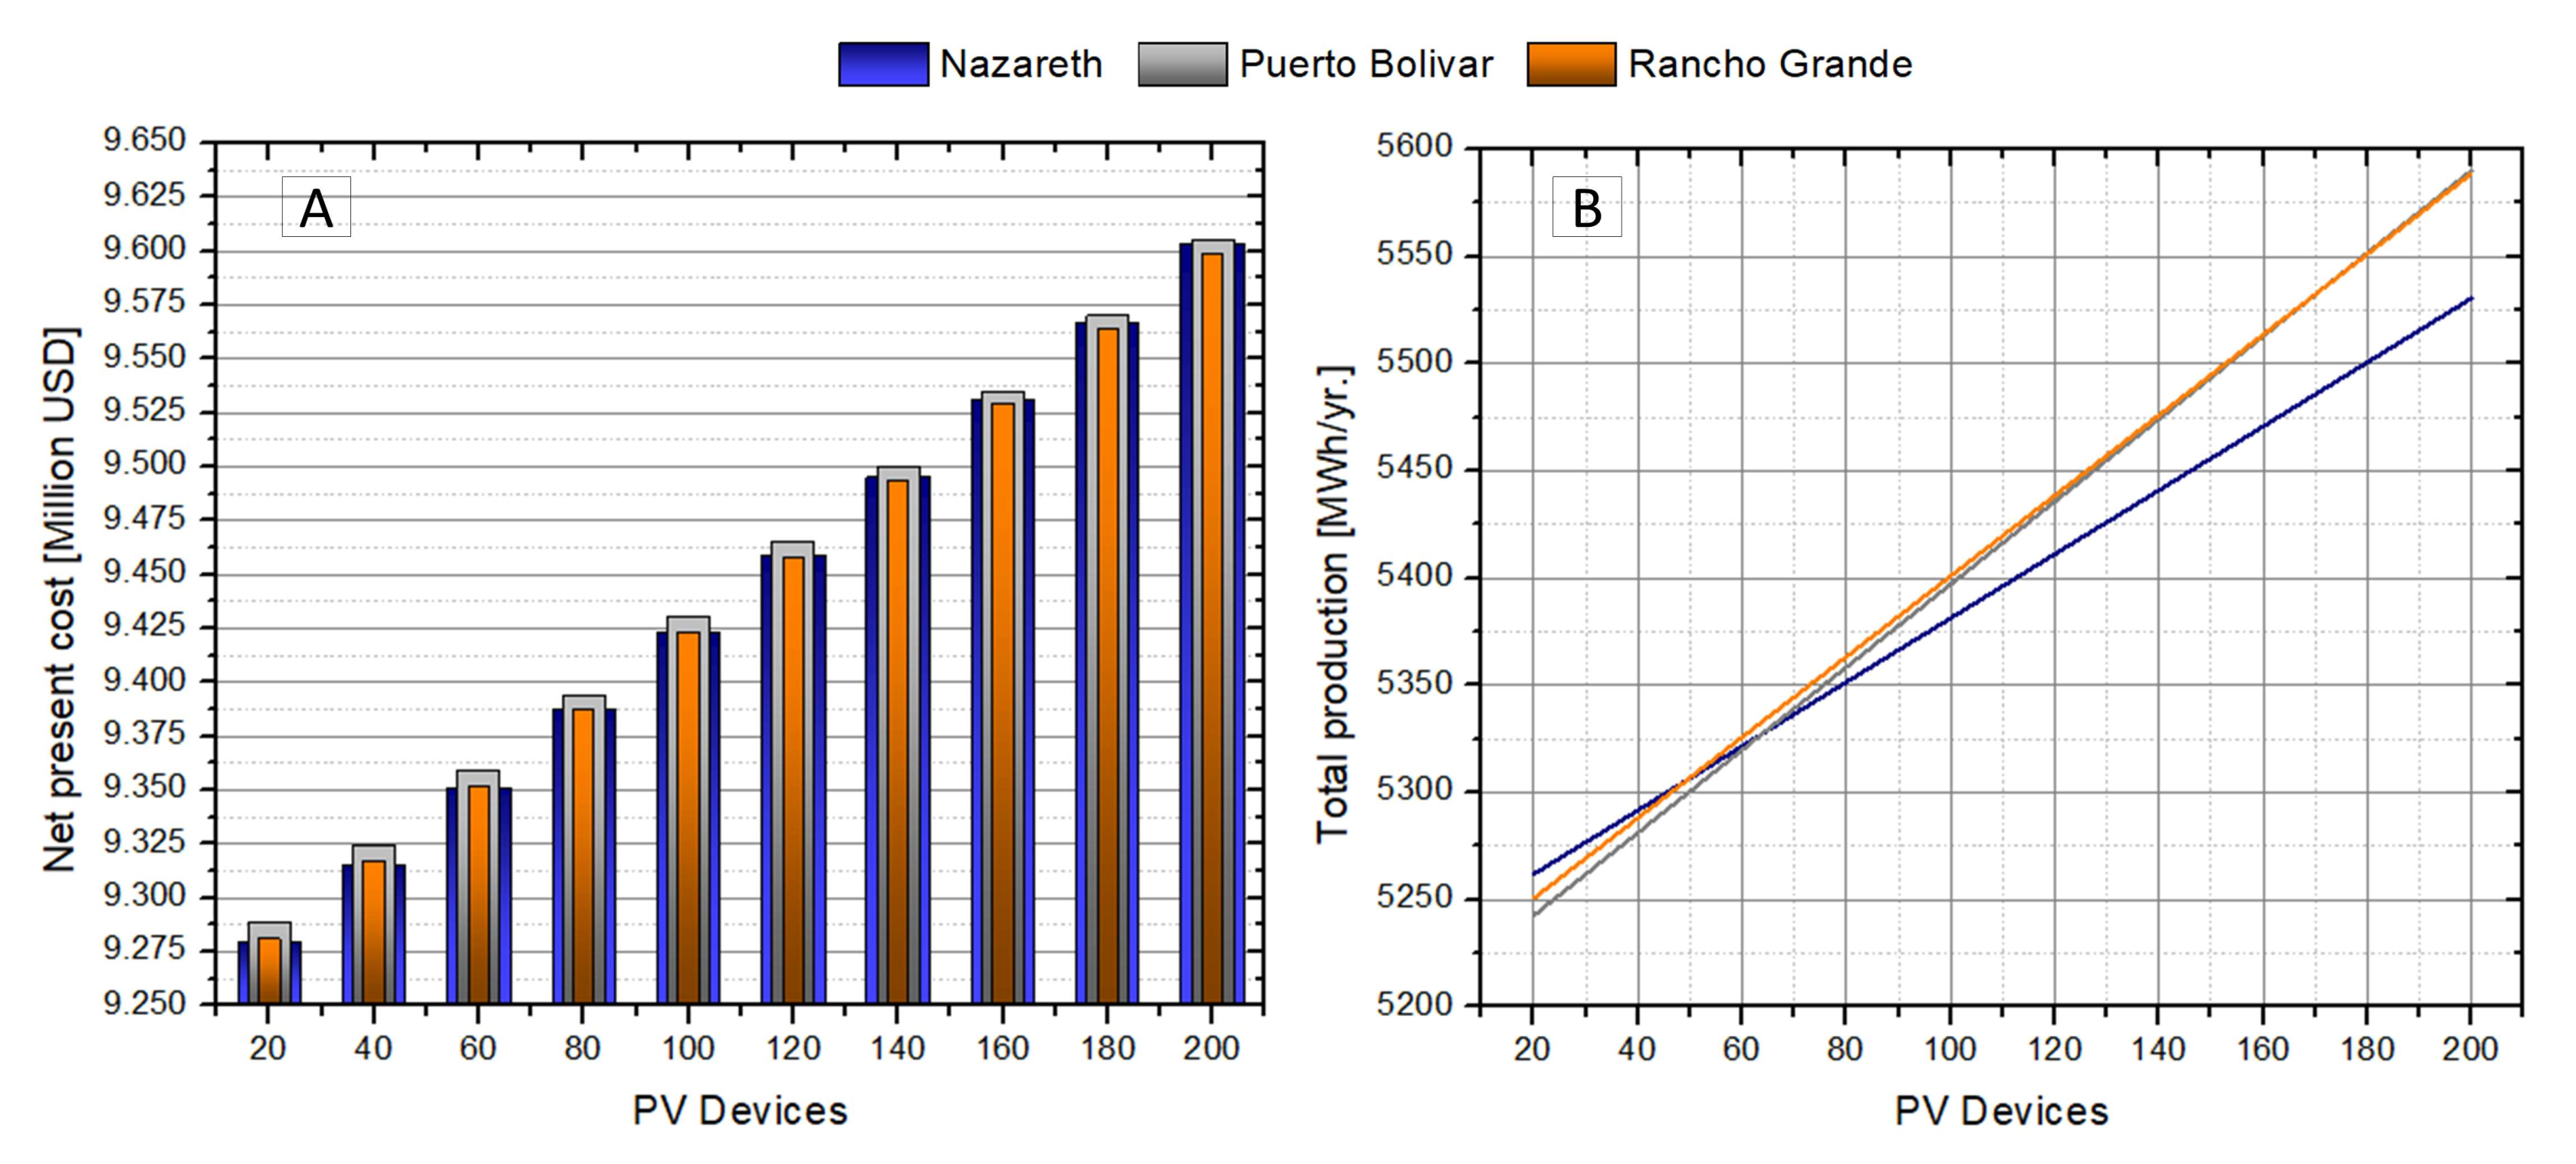
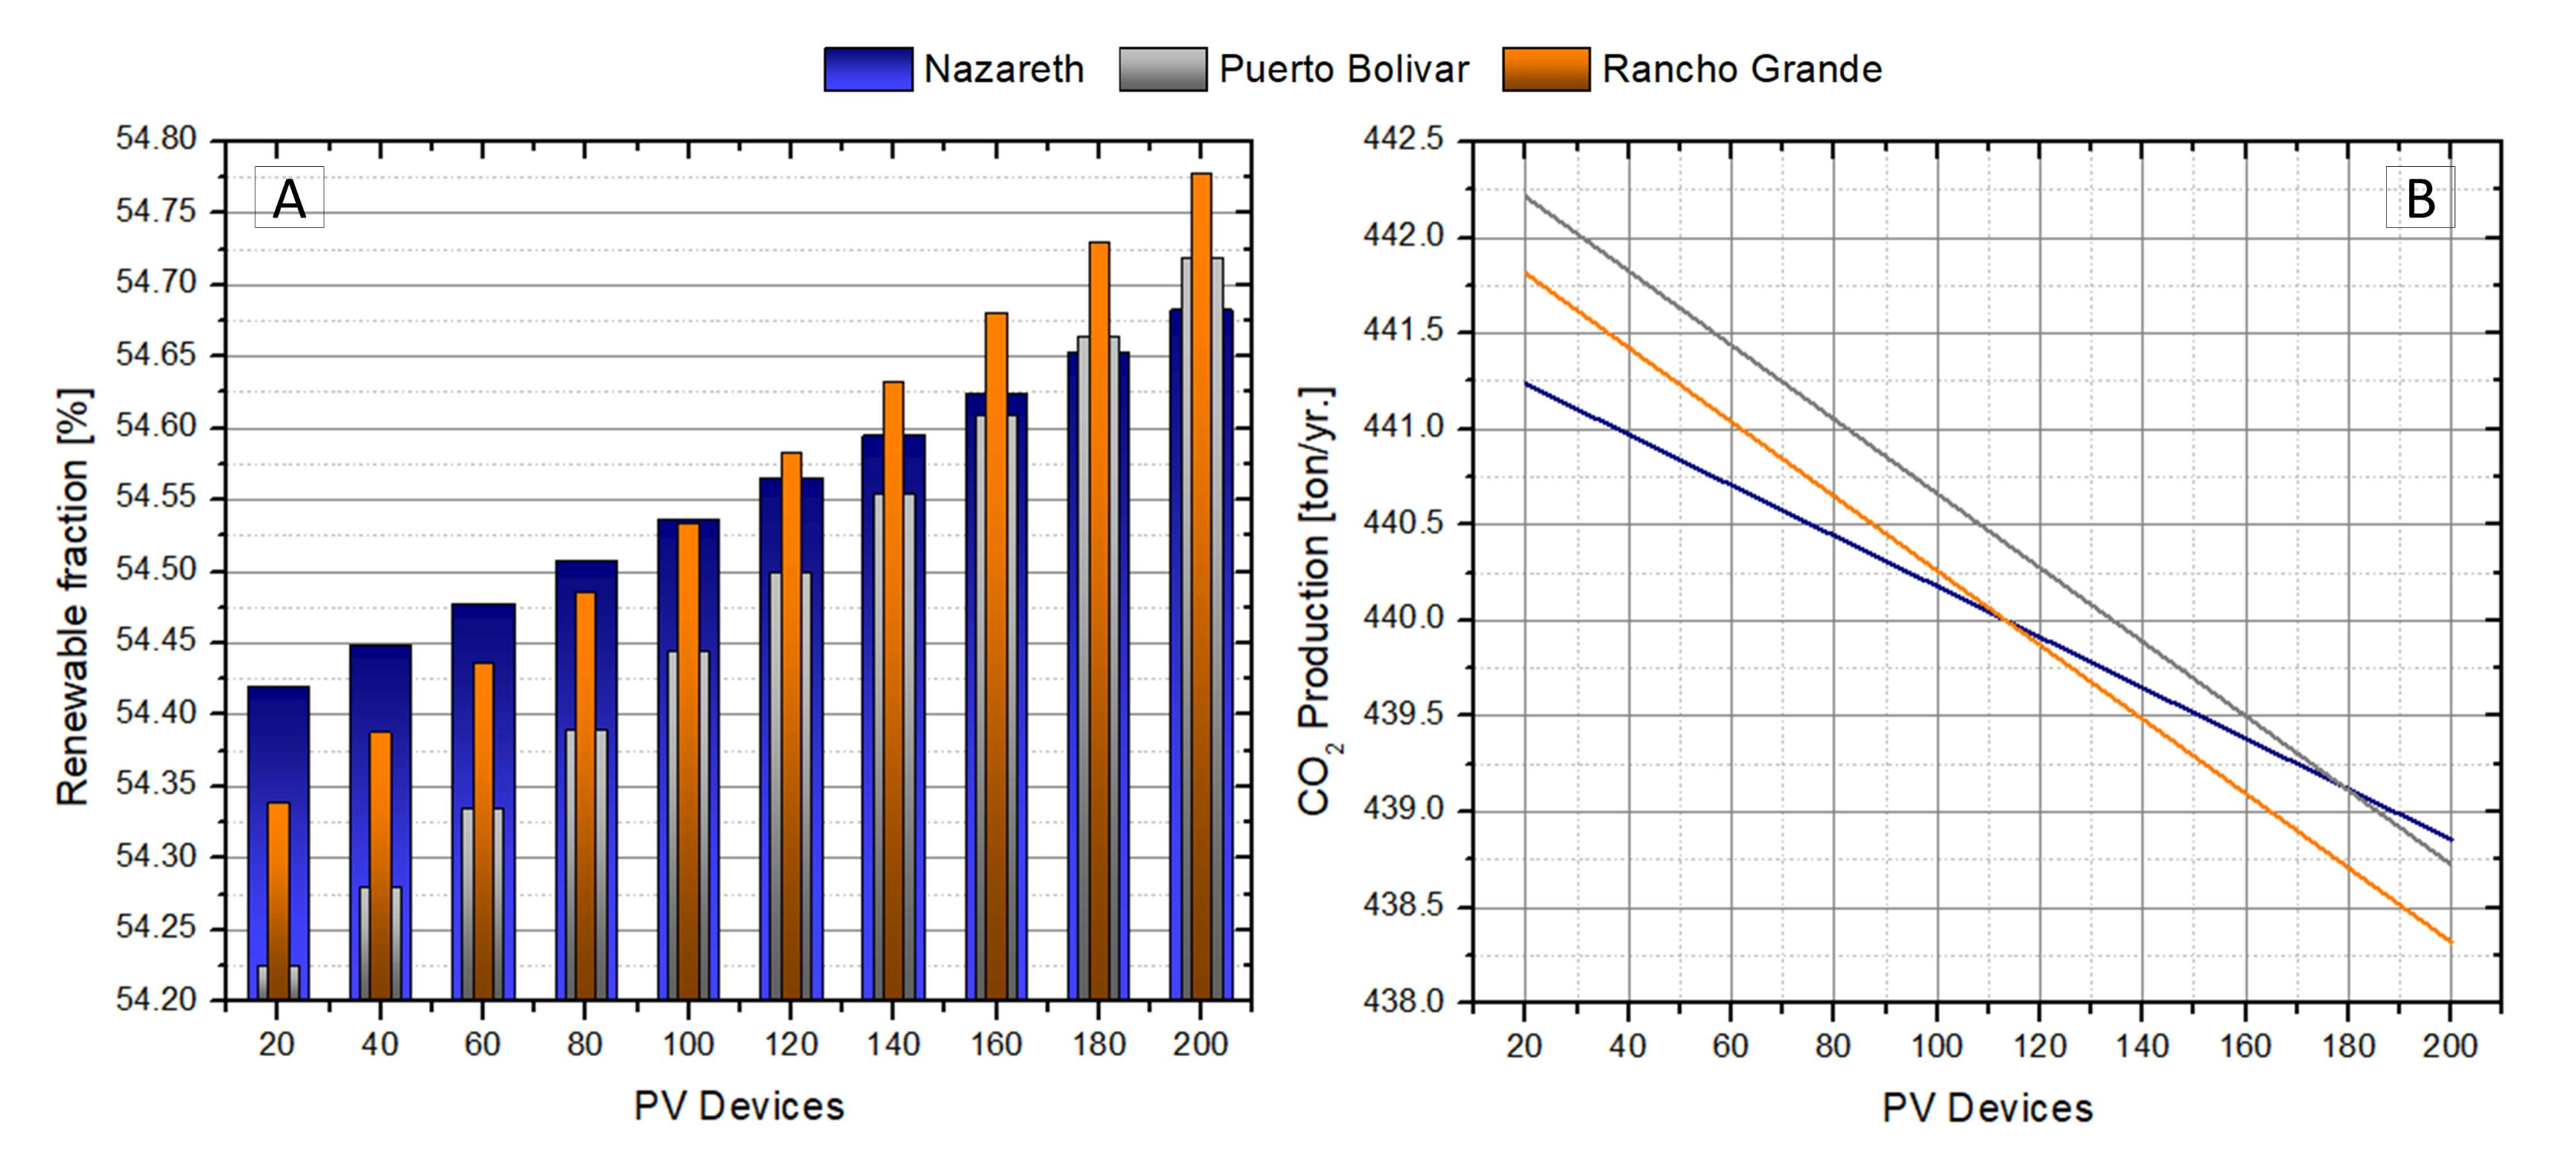
Figure 10A shows that Nazareth and Rancho Grande are the locations where the NPC of the entire project, based on the number of PV panels implemented, is the lowest. Practically, the NPC for Nazareth and Rancho Grande are the same, which means that it is necessary to consider the following criteria to make the right decision about which place is optimal. In the town of Nazareth, the reason for total energy production and the number of PV panels is the lowest, compared to the localities of Rancho Grande and Puerto Bolívar. In addition, Figure 10B shows that the total energy production in Rancho Grande remains the best for at least 200 PV arrays. Another essential criterion considered was the renewable fraction. It is critical to highlight that a 1 PV device or 1 PV unit is equal to a 1 PV array for this simulation analysis.
Figure 11A shows that Nazareth and Rancho Grande have almost the same fraction values to produce energy by renewable energy, which are higher than those of Puerto Bolívar. This means that Puerto Bolívar is not the optimal place to implement a hybrid PV and wind power plant. Even if the location has good production values, its renewable fraction is the lowest, resulting in a high NPC.
The last criterion to study is the CO2 emission produced by thermoelectric power plants and the acquisition of other non-renewable energy sources. Figure 11B shows that CO2 emissions in Nazareth are lower than those of Rancho Grande when there are 110 PV arrays. For large numbers of PV units, lower CO2 production is located in Rancho Grande, making it the best possible location.

4.3. Multi-Objective Optimization of Rancho Grande for Location of a Hybrid System

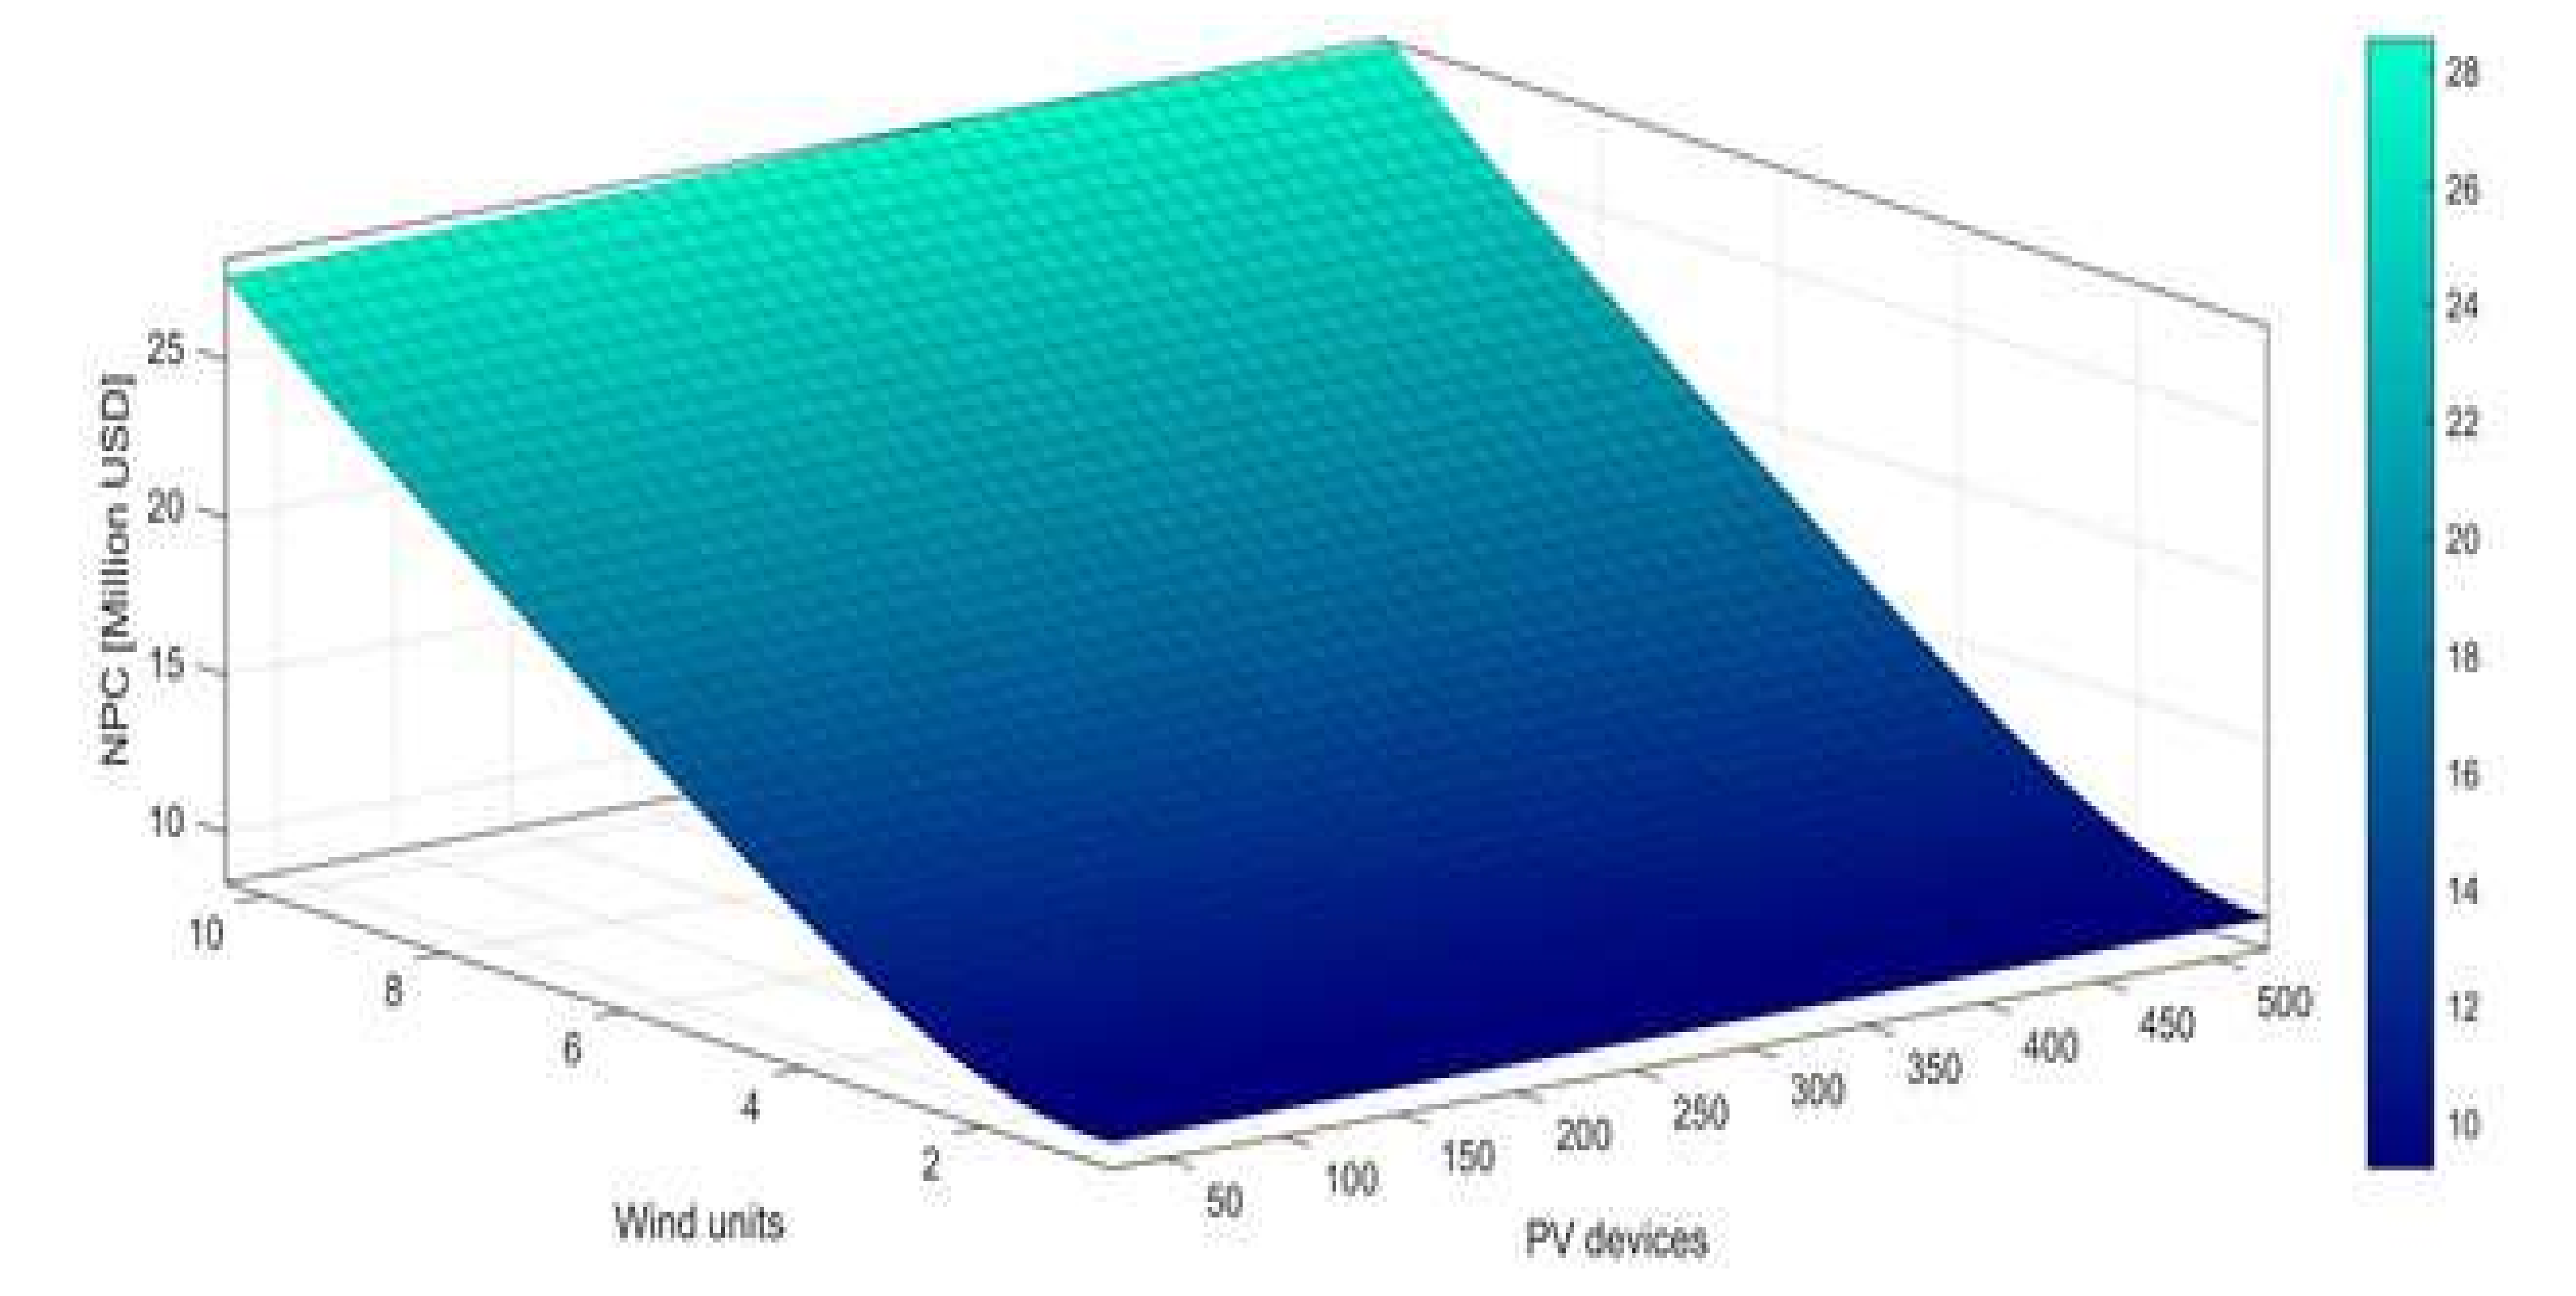
Considering that Rancho Grande was identified as the optimal location to implement a hybrid wind and PV system, the next stage sought to determine, through the optimization of multiple objectives, the most efficient combination of the number of PV devices and wind turbines.
Wind turbines in the range of 1 to 10 and the number of PV arrays in the range of 50 to 500 were implemented. A matrix was then developed for current NPC and CO2 production based on PV devices and wind turbines.
A mathematical function for each criterion, NPC (Equation (11)) and CO2 (Equation (12)), was determined using the MATLAB curve fitting tool. Figure 12 and Figure 13 show the corresponding polynomial regressions with their respective functions.
f 1 x , y = 9.523 + 8.646 · 10 6 · x 0.8988 · y + 0.0006295 · x · y + 0.6652 · y 2 8.478 · 10 5 · x · y 2 0.06331 · y 3 + 3.936 · 10 6 · x · y 3 + 0.002267 · y 4
f 2 x , y = 602.8 0.1141 · x 198 · y + 0.0199 · x · y + 39.17 · y 2 0.0009659 · x · y 2 3.691 · y 3 1.175 · 10 5 · x · y 3 + 0.1323 · y 4
These functions were useful in developing a MATLAB code for a multi-objective optimization process. Figure 12 shows the behavior of the NPC as a function of the PV devices and the wind units. It was necessary to use fourth-degree polynomial regression to obtain the minimum percentage of error, 0.0001%. Equation (11) is the mathematical function of the net present cost (NPC), where “x” is the number of PV units and “y” is the number of wind turbines.
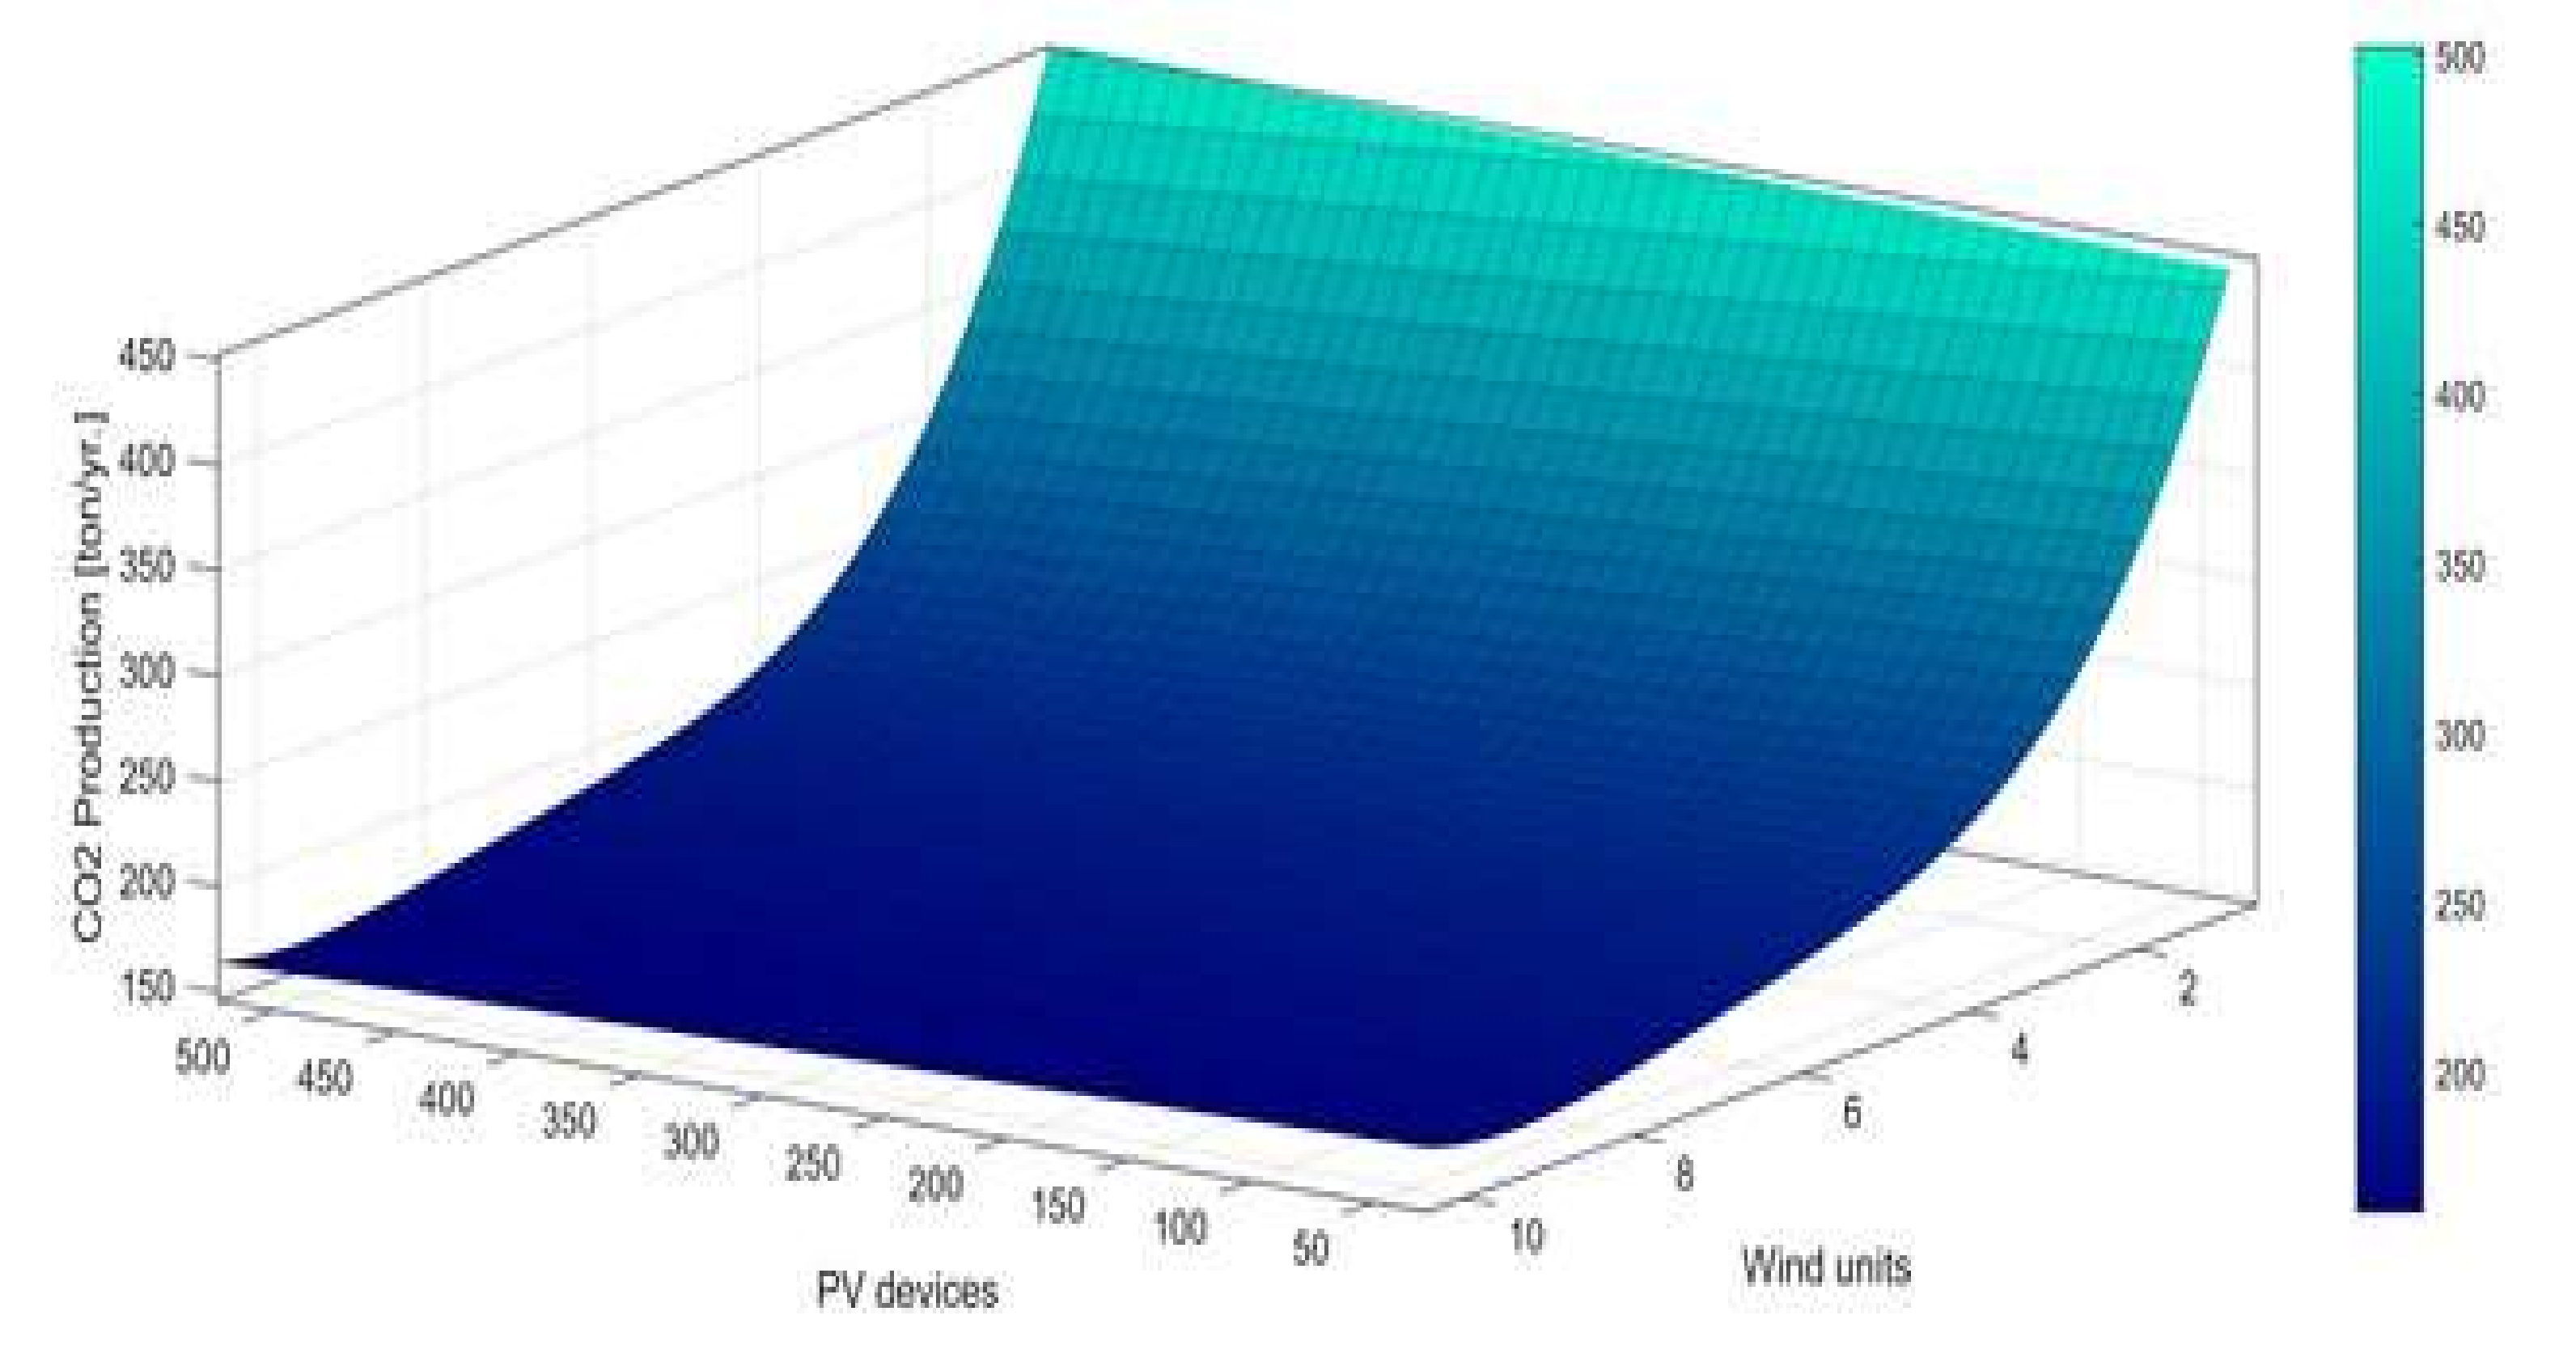
Figure 13 shows the behaviour of CO2 production as a function of the number of wind units and PV devices. Equation (12) is the corresponding mathematical function for CO2 emissions, where “x” is the number of PV units, and “y” is the number of wind turbines. As can be seen, the effect of PV devices on CO2 production is negligible, compared to the wind unit.
The optimization was conducted considering Objective 1 (the current NPC), and Objective 2 (the production of CO2) with the two functions mentioned above. The purpose was to minimize both criteria using Pareto’s efficiency. For each data of PV arrays and wind turbines, there are values of current NPC and CO2 Production, as given in Table 5 (only a range of values was placed, since it can be more extensive).
f1(x,y) and f2(x,y) from Table 5, which are the values for NPC and CO2 production, respectively, were then plotted (Figure 14).
It is important to note that Table 5 shows values that are not feasible due to decimal values; for example, index 17 gives 8.58 wind turbines. Decimal values are out of range because it is impossible to install 8.58 wind turbines of 1.5 MW. When choosing the nearest integer values, a considerable error was generated. On the other hand, PV arrays do not have this problem because their units are high, making it possible to approximate decimals to the nearest integer.
For this reason, it was necessary to determine the index that has the nearest integer for wind turbine devices, with at least 0.01 difference of any integer, as shown in Table 6.
While it is necessary to choose one of these values, it is important to note that all the previous data were optimal combinations, that is, data that is the best possible option for a specific number of selected devices. Figure 14 shows the locations of these indexes (in orange dots).
Figure 14 is a Pareto front composed of values of f1(x,y) and f2(x,y) shown in Table 5, which represents the net present cost (NPC) and CO2 emissions, respectively. In addition, the characteristic equation is presented, where “x” is the number of PV arrays, and “y” is the number of wind turbines. Orange dots are the possible values given in Table 6, which represent specific configurations for the purposed hybrid plant. The ideal point is described as the interception of the vertical axis in the lowest value of CO2 production with the horizontal axis in the lowest value of the Net Present Cost. The non-ideal point is described as the interception of the horizontal axis generated from the higher amount of CO2 production with the vertical axis generated from the higher value of the Net Present Cost. Both ideal points are represented with red dots.
The next step is to implement the Technique for Order of Preference by Similarity to Ideal Solution (TOPSIS) method, which states that the selected point (taken in Figure 14) should have the shortest geometric length from the positive ideal solution and the most extended geometric length from the perfect negative solution. This optimization method has been widely used to improve the thermal and economic performance of energy systems [31,32,33]. Indexes 39 and 33 are the closest to the desired condition, as shown in Table 7.
Equation (10) is used to choose between the two values. The index with the value of Sy closest to 1 is the right point. The index 33 is closer to 1, making it the best possible option; therefore, a total of 441 PV arrays (1764 modules of 250 W) and 3 wind turbines of 1.5 MW should be used, resulting in an estimated NPC cost of 11.8 million dollars, and estimated CO2 emission of 244.1 tons per year.
In this way, the best parameters that offer minimum energy costs to the residents, minimum emissions of pollutant gases, and maintain a reasonable energy production rate are obtained.

5. Conclusions

In this paper, an optimization process was developed to install a hybrid PV and wind power plant in La Guajira, Colombia. The study was done in three stages, with specific characteristics and region conditions. The first stage focused on an energy perspective, where it was found that three of the nine measurement locations—Nazareth, Puerto Bolivar, and Rancho Grande—were the best locations to take advantage of the available energy with 95% percentage each to produce energy using renewable energy. The renewable fraction for the other locations was close to 87%.
The second stage focused on an economic perspective, considering prices and taxes. This stage was developed only for the three best locations, finally identifying Rancho Grande as the optimal place to set up a hybrid energy plant. This location had an advantage over other areas in terms of renewable fraction, total production, and estimated CO2 reduction.
The third and final stage focused only on the town of Rancho Grande, intending to determine the optimal combination of PV panels and wind turbines. This stage identified, for the plant, an optimal combination of 441 PV units and 3 wind turbines, giving an estimated minimum NPC of $11.8 million, and low CO2 production of 244.1 tons per year.

Author Contributions

Conceptualization, G.V.O., F.A.B.B., and A.A.-M.; Methodology, G.V.O. and J.R.N.Á.; Software, G.V.O., L.G.O., and A.A.-M.; Validation, G.V.O., L.G.O., and J.R.N.Á.; Formal Analysis, G.V.O., J.R.N.Á., and F.A.B.B.; Investigation, G.V.O., L.G.O., and F.A.B.B.; Resources, J.R.N.Á. and A.A.-M.; Writing—Original Draft Preparation, F.A.B.B.; Writing—Review & Editing, L.G.O., A.A.-M., and G.V.O.; Funding Acquisition, G.V.O., and J.R.N.Á. All authors have read and agreed to the published version of the manuscript.

Funding

This work was supported by Universidad del Atlántico, and Universidad de la Costa.

Acknowledgments

This research was supported by the Mechanical Engineering Program of Universidad del Atlántico. The Kai Research Group supports G. Valencia and F. Barrozo.

Conflicts of Interest

The authors declare no conflict of interest.

References

  1. McCormick, R.L.; Tennant, C.J.; Hayes, R.R.; Black, S.; Ireland, J.; McDaniel, T.; Williams, A.; Frailey, M.; Sharp, C.A. Regulated emissions from biodiesel tested in heavy duty engines meeting 2004 emission standards. In Proceedings of the 2005 SAE Brasil Fuels & Lubricants Meeting, Rio De Janeiro, Brazil, 11–13 May 2005. [Google Scholar]
  2. Valencia Ochoa, G.; Cárdenas Gutierrez, J.; Duarte Forero, J. Exergy, Economic, and Life-Cycle Assessment of ORC System for Waste Heat Recovery in a Natural Gas Internal Combustion Engine. Resources 2020, 9, 2. [Google Scholar] [CrossRef] [Green Version]
  3. Valencia Ochoa, G.; Piero Rojas, J.; Duarte Forero, J. Advance Exergo-Economic Analysis of a Waste Heat Recovery System Using ORC for a Bottoming Natural Gas Engine. Energies 2020, 13, 267. [Google Scholar] [CrossRef] [Green Version]
  4. Boca, G.D.; Saraçlı, S. Environmental Education and Student’s Perception, for Sustainability. Sustainability 2019, 11, 1553. [Google Scholar] [CrossRef] [Green Version]
  5. Noh, C.-H.; Kim, I.; Jang, W.-H.; Kim, C.-H. Recent Trends in Renewable Energy Resources for Power Generation in the Republic of Korea. Resources 2015, 4, 751–764. [Google Scholar] [CrossRef] [Green Version]
  6. Valencia, G.; Duarte, J.; Isaza-Roldan, C. Thermoeconomic Analysis of Different Exhaust Waste-Heat Recovery Systems for Natural Gas Engine Based on ORC. Appl. Sci. 2019, 9, 4017. [Google Scholar] [CrossRef] [Green Version]
  7. Núñez, A.J.; Benítez, P.I.; Proenza, Y.R.; Vázquez, S.L.; Díaz, M.D. Metodología de diagnóstico de fallos para sistemas fotovoltaicos de conexión a red. Rev. Iberoam. Automática Inf. Ind. 2020, 17, 94–105. [Google Scholar] [CrossRef]
  8. Ueckerdt, F.; Brecha, R.; Luderer, G. Analyzing major challenges of wind and solar variability in power systems. Renew. Energy 2015, 81, 1–10. [Google Scholar] [CrossRef]
  9. International Energy Agency. World Energy Outlook 2016; IEA Publications: Paris, France, 2016. [Google Scholar]
  10. Szymczak, P.D. Asia Pac Leads Global Solar Photovoltaic (PV) Market. 18 December 2018. Available online: https://oilandgaseurasia.com/2018/12/18/asia-pac-leads-global-solar-photovoltaic-pv-market/ (accessed on 30 December 2019).
  11. Fairley Peter. The Pros and Cons of the World’s Biggest Solar Park. 2020. Available online: https://spectrum.ieee.org/energy/renewables/the-pros-and-cons-of-the-worlds-biggest-solar-park (accessed on 21 December 2019).
  12. Moemken, J.; Reyers, M.; Feldmann, H.; Pinto, J. Future changes of wind speed and wind energy potentials in EURO-CORDEX ensemble simulations. J. Geophys. Res. Atmos. 2018, 123, 6373–6389. [Google Scholar] [CrossRef]
  13. Valencia Ochoa, G.; Vanegas Chamorro, M.; Polo Jiménez, J. Análisis Estadístico de la Velocidad y Dirección Del Viento en la Región Caribe Colombiana con Enfasis en la Guajira; Sello Editorial Universidad Del Atlántico: Barranquilla, Colombia, 2016; p. 51. [Google Scholar]
  14. Valencia, G.; Nuñez, J.; Acevedo, C. Research Evolution on Renewable Energies Resources from 2007 to 2017: A Comparative Study on Solar, Geothermal, Wind and Biomass Energy. Int. J. Energy Econ. Policy 2019, 9, 242–253. [Google Scholar]
  15. Ochoa, G.V.; Blanco, C.; Martinez, C.; Ramos, E. Fuzzy Adaptive Control Applied to a Hybrid Electric-Power Generation System (HEPGS). Indian J. Sci. Technol. 2017, 10, 1–9. [Google Scholar] [CrossRef] [Green Version]
  16. Milanes Batista, C.M.; Planas, J.A.; Pelot, R.; Núñez, J.R. A new methodology incorporating public participation within Cuba’s ICZM program. Ocean Coast. Manag. 2020, 186, 105101. [Google Scholar] [CrossRef]
  17. Sinay, L.; Carter, R.W.B. Climate Change Adaptation Options for Coastal Communities and Local Governments. Climate 2020, 8, 7. [Google Scholar] [CrossRef] [Green Version]
  18. Boden, T.A.; Marland, G.; Andres, R.J. Global, Regional, and National Fossil-Fuel CO2 Emissions, Carbon Dioxide Information Analysis Center, Oak Ridge National Laboratory; U.S. Department of Energy: Oak Ridge, TN, USA, 2017. Available online: https://cdiac.ess-dive.lbl.gov/trends/emis/meth_reg.html (accessed on 26 October 2019).
  19. Valencia, G.; Benavides, A.; Cárdenas, Y. Economic and Environmental Multiobjective Optimization of a Wind–Solar–Fuel Cell Hybrid Energy System in the Colombian Caribbean Region. Energies 2019, 12, 2119. [Google Scholar] [CrossRef] [Green Version]
  20. HOMER Pro. Available online: https://www.homerenergy.com/products/pro/index.html (accessed on 29 July 2017).
  21. Valencia, G.; Vanegas, M.; Villicana, E. Disponibilidad Geográfica y Temporal de la Energía Solar en la Costa Caribe Colombiana; Sello editorial de la Universidad del Atlántico: Barranquilla, Colombia, 2016. [Google Scholar]
  22. Valencia Ochoa, G.; Vanegas Chamorro, M.; Villicaña Ortiz, E. Atlas Solar de la Costa Caribe Colombiana; Sello Editorial Universidad Del Atlántico: Barranquilla, Colombia, 2016. [Google Scholar]
  23. Goldwind. Goldwind PMDD 1.5 MW Wind Turbine Brochure. 2017. Available online: https://www.goldwindamericas.com/sites/default/files/Goldwind%20Americas_Goldwind%201.5MW%20Brochure%20%282017%29_0.pdf (accessed on 2 February 2020).
  24. UPME. Escenarios de Oferta y Demanda de Hidrocarburos en Colombia; Ministerio de Minas y Energía: Bogota, Colombia, 2012. Available online: http://www.upme.gov.co/docs/publicaciones/2012/escenarios_oferta_demanda_hidrocarburos.pdf (accessed on 9 April 2018).
  25. Papoulis, A. Probability, Random Variables, and Stochastic Processes, 3rd ed.; McGraw-Hill: New York, NY, USA, 1991. [Google Scholar]
  26. Jafari, A.A.; Zakerzadeh, H. Inference on the parameters of the Weibull distribution using records. SORT 2015, 39, 3–18. [Google Scholar]
  27. Jung, S.; Arda Vanli, O.; Kwon, S.-D. Wind energy potential assessment considering the uncertainties due to limited data. Appl. Energy 2013, 102, 1492–1503. [Google Scholar] [CrossRef]
  28. Etghani, M.M.; Shojaeefard, M.H.; Khalkhali, A.; Akbari, M. A hybrid method of modified NSGA-II and TOPSIS to optimize performance and emissions of a diesel engine using biodiesel. Appl. Therm. Eng. 2013, 59, 309–315. [Google Scholar] [CrossRef]
  29. Ochoa, G.V.; Isaza-Roldan, C.; Duarte Forero, J. Economic and Exergo-Advance Analysis of a Waste Heat Recovery System Based on Regenerative Organic Rankine Cycle under Organic Fluids with Low Global Warming Potential. Energies 2020, 13, 1317. [Google Scholar] [CrossRef] [Green Version]
  30. Ochoa, G.V.; Peñaloza, C.A.; Rojas, J.P. Thermoeconomic Modelling and Parametric Study of a Simple ORC for the Recovery of Waste Heat in a 2 MW Gas Engine under Different Working Fluids. Appl. Sci. 2019, 9, 4526. [Google Scholar] [CrossRef] [Green Version]
  31. Valencia, G.; Núñez, J.; Duarte, J. Multiobjective optimization of a plate heat exchanger in a waste heat recovery organic rankine cycle system for natural gas engines. Entropy 2019, 21, 655. [Google Scholar] [CrossRef] [Green Version]
  32. Ochoa, G.V.; Isaza-Roldan, C.; Forero, J.D. A phenomenological base semi-physical thermodynamic model for the cylinder and exhaust manifold of a natural gas 2-megawatt four-stroke internal combustion engine. Heliyon 2019, 5, e02700. [Google Scholar] [CrossRef] [Green Version]
  33. Valencia Ochoa, G.; Acevedo Peñaloza, C.; Duarte Forero, J. Thermoeconomic Optimization with PSO Algorithm of Waste Heat Recovery Systems Based on Organic Rankine Cycle System for a Natural Gas Engine. Energies 2019, 12, 4165. [Google Scholar] [CrossRef] [Green Version]
Figure 1. Timeline of the legal and regulatory framework for energy management in Colombia [20,21].
Energies 13 01662 g001
Figure 2. Geographic locations of the different meteorological stations in La Guajira, Colombia.
Energies 13 01662 g002
Figure 3. Proposed energy system scheme.
Energies 13 01662 g003
Figure 4. Wind speed graph for different measurement points in La Guajira [13].
Energies 13 01662 g004
Figure 5. Seasonal profile of energy demand used in this study.
Energies 13 01662 g005
Figure 6. Adjusted frequency distributions of wind speed for Puerto Bolivar, (A) January, (B) February; and Almirante Padilla, (C) January, and (D) February.
Energies 13 01662 g006
Figure 7. Comparison between the rated power and energy production for the photovoltaic (PV) system.
Energies 13 01662 g007
Figure 8. Comparison between the number of wind turbines and the annual energy production for each location.
Energies 13 01662 g008
Figure 9. Comparison between the production and renewable fraction for each location.
Energies 13 01662 g009
Figure 10. Comparative results for Nazareth, Puerto Bolivar, and Rancho Grande: (A) PV units and net present cost, (B) comparison between PV units and total production.
Energies 13 01662 g010
Figure 11. (A) Comparison between PV units and renewable fraction for Nazareth, Puerto Bolivar, and Rancho Grande, (B) comparison between PV units and CO2 production for Nazareth and Rancho Grande.
Energies 13 01662 g011
Figure 12. Polynomial regression for NPC (Rancho Grande).
Energies 13 01662 g012
Figure 13. Polynomial regression for CO2 emission (Rancho Grande).
Energies 13 01662 g013
Figure 14. Pareto front for multi-objective optimization of NPC and CO2 emissions.
Energies 13 01662 g014
Table 1. Temperature [°C] matrix for the different measurement points in La Guajira [22].
LocationsJan.Feb.Mar.Apr.MayJun.Jul.Aug.Sep.Oct.Nov.Dec.
Camp. Intercor26.927.328.228.528.628.729.229.028.227.627.227.0
Carraipía25.926.327.027.727.928.228.428.627.927.226.726.1
La Mina27.027.628.328.728.929.329.529.428.427.727.326.9
Manaure27.827.827.928.429.130.029.929.529.128.628.628.1
Matitas26.726.827.227.727.928.828.928.427.727.127.126.6
Nazareth25.725.826.327.027.628.027.928.528.527.827.126.2
Puerto Bolivar27.026.927.428.229.029.529.429.529.328.828.327.5
Rancho Grande25.926.427.328.128.528.728.328.328.327.727.527.2
Urumita27.328.028.428.527.928.028.528.327.427.026.826.7
Table 2. Solar radiation [Wh/m2day] matrix for the different measurement points in La Guajira [17].
LocationsJan.Feb.Mar.Apr.MayJun.Jul.Aug.Sep.Oct.Nov.Dec.
Camp. Intercor418443684570362237093970473047694471346938143495
Carraipía360036483635298628183563416441523572322630533037
La Mina425843804350405336374308464645503904358733823761
Manaure371639174245382739314516452448664327352533463146
Matitas37513815352630453208402244514365367333733013355
Nazareth345237883978344334174146469048194137330230932851
Puerto Bolivar438149735254505047844692528755364747400437833899
Rancho Grande444147725072446543274630509752614601394336833802
Urumita440046424509366433913463399439033377329033693625
Table 3. Different parameters requested by HOMER Pro® for the specific economic and power calculations, where O&M means Operation & Maintenance and * indicates an estimated value.
ParameterDescriptionValueUnit
Grid power price *Price that the electric utility charges for energy purchased from the grid0.2USD/kWh
Simulation periodTime considered for the study10Years
Annual scaled averageParameter used to scale the whole array of hourly data up or down24,000kWh/day
PikeEnergy top value 1833.2kW
Discount rate *The rate considered to borrow money8%
Rate of inflation *The percentage at which money is devalued along time2%
Wind turbine hub heightHeight of the rotor measured from the ground80Meters
Grid CO2 *CO2 emission factor of the energy generated by the grid 0.1kg/kWh
PV O&M cost per unitOperation and maintenance cost per PV unit10USD/year
Wind O&M cost per unitOperation and maintenance cost per wind turbine unit30,000USD/year
Table 4. Multi-annual adjusted distributions of wind speed for Puerto Bolivar (PB) and Almirante Padilla (AP), from 2003 to 2013 [22].
DistributionWeibull PBWeibull AP
MonthJan.Feb.Mar.Apr.MayJun.Jan.Feb.Mar.Apr.MayJun.
Form3.623.944.033.843.063.631.842.052.061.871.8920.88
Scale7.127.667.707.567.147.893.513.763.803.523.453.73
MonthJul.Aug.Sep.Oct.Nov.Dec.Jul.Aug.Sep.Oct.Nov.Dec.
Form3.883.062.312.212.613.112.141.751.691.77-1.75
Scale8.117.135.735.115.446.424.023.312.682.48-2.94
DistributionRayleigh PBRayleigh AP
MonthJan.Feb.Mar.Apr.MayJun.Jan.Feb.Mar.Apr.MayJun.
Scale6.646.947.157.046.717.373.663.743.763.643.553.67
Lower threshold0.010.300.010.100.100.10−0.090.010.02−0.09−0.070.03
MonthJul.Aug.Sep.Oct.Nov.Dec.Jul.Aug.Sep.Oct.Nov.Dec.
Scale7.576.695.554.975.156.013.953.572.932.59-3.13
Lower threshold0.090.100.050.050.100.100.03−0.17−0.15−0.04-−0.10
Table 5. Data collected from previous multi-objective optimizations.
IndexPopulation f1Population f2f1(x,y)f2(x,y)
1162.351.009.3208424.2034
2455.862.8411.5792250.6008
3374.161.589.8313342.0218
4458.337.6821.8166169.9665
5450.507.5021.4097171.6429
6190.931.099.3685411.2848
7463.618.1022.7594166.4565
8464.547.0820.4920174.8915
9182.341.169.3980402.9515
10466.829.2725.4634159.7775
11459.109.0124.8412160.7772
12252.281.319.5272380.0974
13170.971.479.5804370.2378
14460.995.5817.1489188.2983
15204.761.519.6331363.7958
16162.351.009.3208424.2034
17467.558.5823.8424162.9501
18289.971.209.4879388.5064
19456.466.3918.9383181.0377
20452.186.7119.6354178.4340
21460.934.4114.6000203.6394
22435.817.9922.4599167.9836
23443.144.6515.0778200.5169
24447.403.7613.2597218.3149
25436.183.2312.2364235.6264
26294.451.599.7729348.1610
27453.425.8517.7357185.9505
28456.584.3814.5426204.2703
29292.952.8511.4068260.6003
30451.306.1418.3635183.4294
31390.022.2410.5965288.6604
32460.173.8713.5000214.7941
33440.813.0011.8483244.0983
34212.641.619.7231353.2899
35407.427.3420.9747174.1048
36466.608.4623.5835163.7199
37434.902.3110.7404280.7996
38458.709.0324.8764160.7231
39208.452.9911.5348259.4823
40295.982.0710.2843307.6137
41208.341.179.4170399.9407
42430.482.0210.3587300.6018
43391.204.9915.7236197.8553
44461.775.1216.1006193.4751
45445.795.7517.4817187.2504
46731.672.4910.9957270.3299
47443.033.4112.5793228.9088
48404.325.3016.4306193.4263
49468.149.5226.0469159.4742
50162.381.029.3261422.2238
Table 6. Feasible values to consider as an option, obtained from Table 4.
IndexPV DevicesWind UnitsNPC [million USD]CO2 Production [ton/yr]
116219.3208424.2034
11459924.8412160.7772
22436822.4599167.9836
33441311.8483244.0983
39208311.5348259.4823
43391515.7236197.8553
Table 7. Results from TOPSIS analysis for index 33 and 39.
IndexDxDySy
3389.1292181.45440.6706
39104.5021166.14860.6139

