Article

Techno-Economic Evaluation of Interconnected Nuclear-Renewable Micro Hybrid Energy Systems with Combined Heat and Power

by
Hossam A. Gabbar
1,2,*,
Muhammad R. Abdussami
1 and
Md. Ibrahim Adham
1
1
Faculty of Energy Systems and Nuclear Science, Ontario Tech University (UOIT), Oshawa, ON L1G 0C5, Canada
2
Faculty of Engineering and Applied Science, Ontario Tech University (UOIT), Oshawa, ON L1G 0C5, Canada
*
Author to whom correspondence should be addressed.
Energies 2020, 13(7), 1642; https://doi.org/10.3390/en13071642
Submission received: 7 March 2020 / Revised: 29 March 2020 / Accepted: 31 March 2020 / Published: 2 April 2020
(This article belongs to the Special Issue Smart Energy, Plasma and Nuclear Systems)

Abstract

:
Renewable energy sources (RESs) play an indispensable role in sustainable advancement by reducing greenhouse gas (GHG) emissions. Nevertheless, due to the shortcomings of RESs, an energy mix with RESs is required to support the baseload and to avoid the effects of RES variability. Fossil fuel-based thermal generators (FFTGs), like diesel generators, have been used with RESs to support the baseload. However, using FFTGs with RESs is not a good option to reduce GHG emissions. Hence, the small-scale nuclear power plant (NPPs), such as the micro-modular reactor (MMR), have become a modern alternative to FFTGs. In this paper, the authors have investigated five different hybrid energy systems (HES) with combined heat and power (CHP), named ‘conventional small-scale fossil fuel-based thermal energy system,’ ‘small-scale stand-alone RESs-based energy system,’ ‘conventional small-scale fossil fuel-based thermal and RESs-based HES,’ ‘small-scale stand-alone nuclear energy system,’ and ‘nuclear-renewable micro hybrid energy system (N-R MHES),’ respectively, in terms of net present cost (NPC), cost of energy (COE), and GHG emissions. A sensitivity analysis was also conducted to identify the impact of the different variables on the systems. The results reveal that the N-R MHES could be the most suitable scheme for decarbonization and sustainable energy solutions.

1. Introduction

According to the 2030 Agenda for Sustainable Development, seventeen Sustainable Development Goals (SDGs) are set for action by both developed and developing countries. Among the seventeen SDGs, one of the most crucial goals is “Affordable and Clean Energy.” The objective of the goal “Affordable and Clean Energy” is to ensure not only affordable, resilient, and modern forms of energy, but also sustainable and carbon-free electricity for the planet [1].
Electricity is a fundamental requirement for global advancement and economic growth. The demand for electricity is growing proportionally to the population and economic development. Currently, the world is undergoing two challenges for managing the high demand for electricity; one problem is how to support the high demand for electricity without exploiting finite energy resources (mainly fossil fuels), and another challenge is how to produce electricity without affecting the environment [2].
Currently, most of the electric energy is produced from conventional sources like coal, gas, and oil. The production of electricity by using these resources tends to raise the emission of greenhouse gases (GHGs) in the atmosphere. Research is ongoing to reduce the impact of using traditional sources for electricity generation in the environment. For instance, one such initiative is the implementation of carbon capture and storage (CCS) policies. In this process, the waste carbon dioxide from the power plant can be captured and transported to a storage site for disposal so that it cannot disperse in the environment [3].
In recent times, the world is looking for sustainable energy sources that will be used to meet today’s demand without putting them into danger for future usages. Consequently, renewable energy sources (RESs), such as solar, wind, geothermal, hydropower, and ocean energy, are being recognized as sustainable sources for electric energy production [4]. RESs are intermittent, and electricity cannot be stored economically for an extended period, so some other sources of energy that can provide a back-up for the RESs during their unavailability period and act as a base load or critical load supplier are needed.
The research and development plan for dynamic modeling and simulation of large scale nuclear-renewable hybrid energy system (N-R HES) is addressed in [5]. The N-R HES is interpreted as a combination of a nuclear reactor, a turbine for electricity generation from thermal energy, at least a RES, and a product produced from the N-R HES by an industrial process. In the report, the authors categorized the N-R HES into three types: tightly coupled HES, thermally coupled HES, and loosely coupled electricity-only HES. The potential vital benefits of N-R HES include GHG-free electricity, a resilient electric grid, and low COE. The authors have also regarded the integration of SMR and RES for future work.
A combination of renewable energy generation, nuclear reactors, and industrial processes, including the versatility of grid and making the best possible use of investment, have been explored in [6]. Six features of interconnection have been identified here—electrical, thermal, chemical, hydrogen, mechanical, and information. This study concluded that the integration of nuclear and renewable energy could be a potential solution for a long-term and ample amount of power and heat supply that is free from sudden price changes like fossil-fuels. This document also pointed out that the nuclear-renewable hybrid system can supply load-following power, and excess energy can be used for the production of secondary energy-intensive products. Nevertheless, system analysis, technical advancement, and optimization are required to implement this hybrid system in practice.
Currently, the International Atomic Energy Agency (IAEA) has published a technical document of nuclear-renewable integration. The report addresses the national strategies on nuclear and RESs, opportunities and challenges of nuclear-renewable integration, and the role of the small-scale reactors in nuclear-renewable hybridization [7].
A comparison of three scenarios, namely a nuclear power plant, a combination of a nuclear plant and a wind facility, and a mixture of nuclear and wind energy sources with a hydrogen generation facility, have been done in [8]. This study reported that with optimization, the nuclear-wind system with a hydrogen production facility could be an economically viable option in the future. Sensitivity analysis has also been carried out to realize the impact of the energy market, depreciation rate, discount rate, and time horizon in terms of internal rate of return (IRR), levelized cost of energy (LCOE), net present value (NPV), and payback period.
In [9], the author highlighted the critical challenges of nuclear-renewable integration, such as integration values, regulatory, financial, technological, plant testing, and plant operation. The author suggested that the information linkage-based nuclear-renewable coupling would be able to overcome the complexities of the integration process.
Three scenarios of N-R HES to supply thermal energy from the system have been examined in [10]. The first arrangement includes a nuclear reactor, thermal power cycle, wind power plant, and electric boiler; the second scenario comprises a nuclear reactor, thermal power cycle, wind power plant, and electric thermal storage; the third configuration is a combination of a nuclear reactor, thermal power cycle, wind power plant, electric boiler, and thermal storage. The electric thermal storage stores thermal energy that is generated by electricity. The financial performance analysis tells us that the third arrangement has the lowest NPV, lowest IRR, and highest TCI. The analysis results are evident because the thermal power supply is elevated significantly by introducing the electric boiler and the thermal storage simultaneously in the third scenario. The result is also evident since the authors assumed that the cost of heat generated from the nuclear reactor is less than the price of heat generated from gas (electric boiler) [10].
The Hybrid Optimization Model for Electric Renewable (HOMER) software has been used for predicting the viability of a HES in [11]. The HES consists of photovoltaic (PV) cells, diesel generator, and battery bank. Paper [11] summarized that the PV-diesel-battery system has one-third fuel-savings compared to the diesel-only system. It is also concluded that hydrogen technologies can technically replace the diesel-battery system. The PV-diesel-battery configuration will also reduce emissions and increase the penetration of renewable energy. Besides, the authors found that the implementation of 20% renewable energy would reduce a massive amount of CO2 compared to the present value of emission [11].
However, small scale nuclear reactors like the micro modular reactor (MMR) are gaining attention currently for their small size, affordability, security, reliability, and innovativeness. Several companies are now working on these types of reactors. For example, U-Battery, an MMR manufacturer, is expecting to demonstrate this type of reactor by 2026 [12]. Some other very small reactors are being developed, such as the eVinciTM micro reactor with combined heat and power (CHP) rated from 200 kWe to 5 MWe [13]. Consequently, these types of micro reactors can replace the FFTGs (diesel generators), which are now being employed with RESs either as the backup power supply or as the main electric power- generating source.
In this paper, the planning and optimization of different HES models have been developed and evaluated based on multiple techno-economic key performance indicators (KPIs). The grid-connected as well as off-grid mode have been analyzed in this paper. Five different scenarios with CHP have been developed and assessed using the HOMER software. Comparison among all situations has been made based on three KPIs - NPC, COE, and GHG emission. This document is divided as follows: the detailed nuclear-renewable hybrid energy system is discussed in Section 2. System configurations are addressed in Section 3. Section 4 covers the design considerations that are made for system evaluation. Part 5 illustrates the system simulations. The simulation results, based on selected KPIs, are compiled in Section 6. The discussion is presented in Section 7.

2. Nuclear-Renewable Micro Energy System

N-R HES is a collective network of different RESs, nuclear reactors, energy storage systems (ESSs), power electronic devices, and various energy users (e.g., electric, thermal, and hydrogen). Since no fossil fuel is combusted in the N-R HES, it is the cleanest HES with virtually zero GHG emissions. The N-R HES utilizes a substantial amount of waste heat energy from the thermal generator (e.g., nuclear reactor, geothermal energy, concentrated solar power, and biomass) to generate different products. Several advanced control algorithms are used in N-R HES to ensure the security and reliable performance of the system. Based on the size of the hybrid system, the coupling scheme can be categorized into two types [14], as discussed below.

2.1. Large-scale Coupling

In large-scale coupling, a traditional large-scale nuclear power plant (NPP) is collocated with regionally available RESs. The coupling may occur at either the electrical, thermal, or electrical-thermal levels. For example, the International Atomic Energy Agency (IAEA) recommends that a conventional large-scale NPP must have a bare area—called “exclusion zone”—around the NPP for safety purposes. A part of this exclusion zone can be used to install wind turbines to extract wind energy and integrate it with the NPP generation or electric grid [15]. Since the exclusion zone is typically a large empty area, it might be a favorable space of achieving high wind speeds, implying a high wind energy potential. Moreover, e PV panels can be fitted on the different facilities of the NPP to harness solar power.
The large-scale coupling also includes the mobile microgrid (MM) with traditional NPP for various purposes. An MM is a HES consisting of different RESs, such as wind and PV, with intelligent remote control capability for resilient off-grid power supply [16]. An MM can also be linked with large-scale NPP for emergency cases to support the essential electric system, Class I power supply, of the NPP. Class I, associated with a battery bank, is the most sensitive power class in NPP, and it can never be interrupted. Hence, a battery fast charging mechanism, powered by MM, can solve the drawbacks of the battery bank and ensure the safety of NPP. In summary, the integration of MM with traditional NPP works for both objectives – load demand fulfillment and NPP emergency back-up support [17].

2.2. Modular-scale Coupling

In modular-scale coupling, a small-scale reactor, called small modular reactor (SMR) or micro modular reactor (MMR), is conjoined with RESs at a site where the RESs are mostly available. There are notable advantages of MMR, explained in the later section, over the SMR. The MMR is moveable and modular in size; the MMR is towed into a suitable location to combine with RESs in modular-scale coupling schemes. The HES that uses a modular-scale coupling method is called nuclear-renewable micro hybrid energy system (N-R MHES). The N-R MHES has immense applications in remote community service, transportation electrification, distant oil and gas mining facilities, and remote chemical industries. The grid-connected N-R MHES also provides an excellent energy solution to the medium-level electricity demand with the lowest NPC and COE [14].

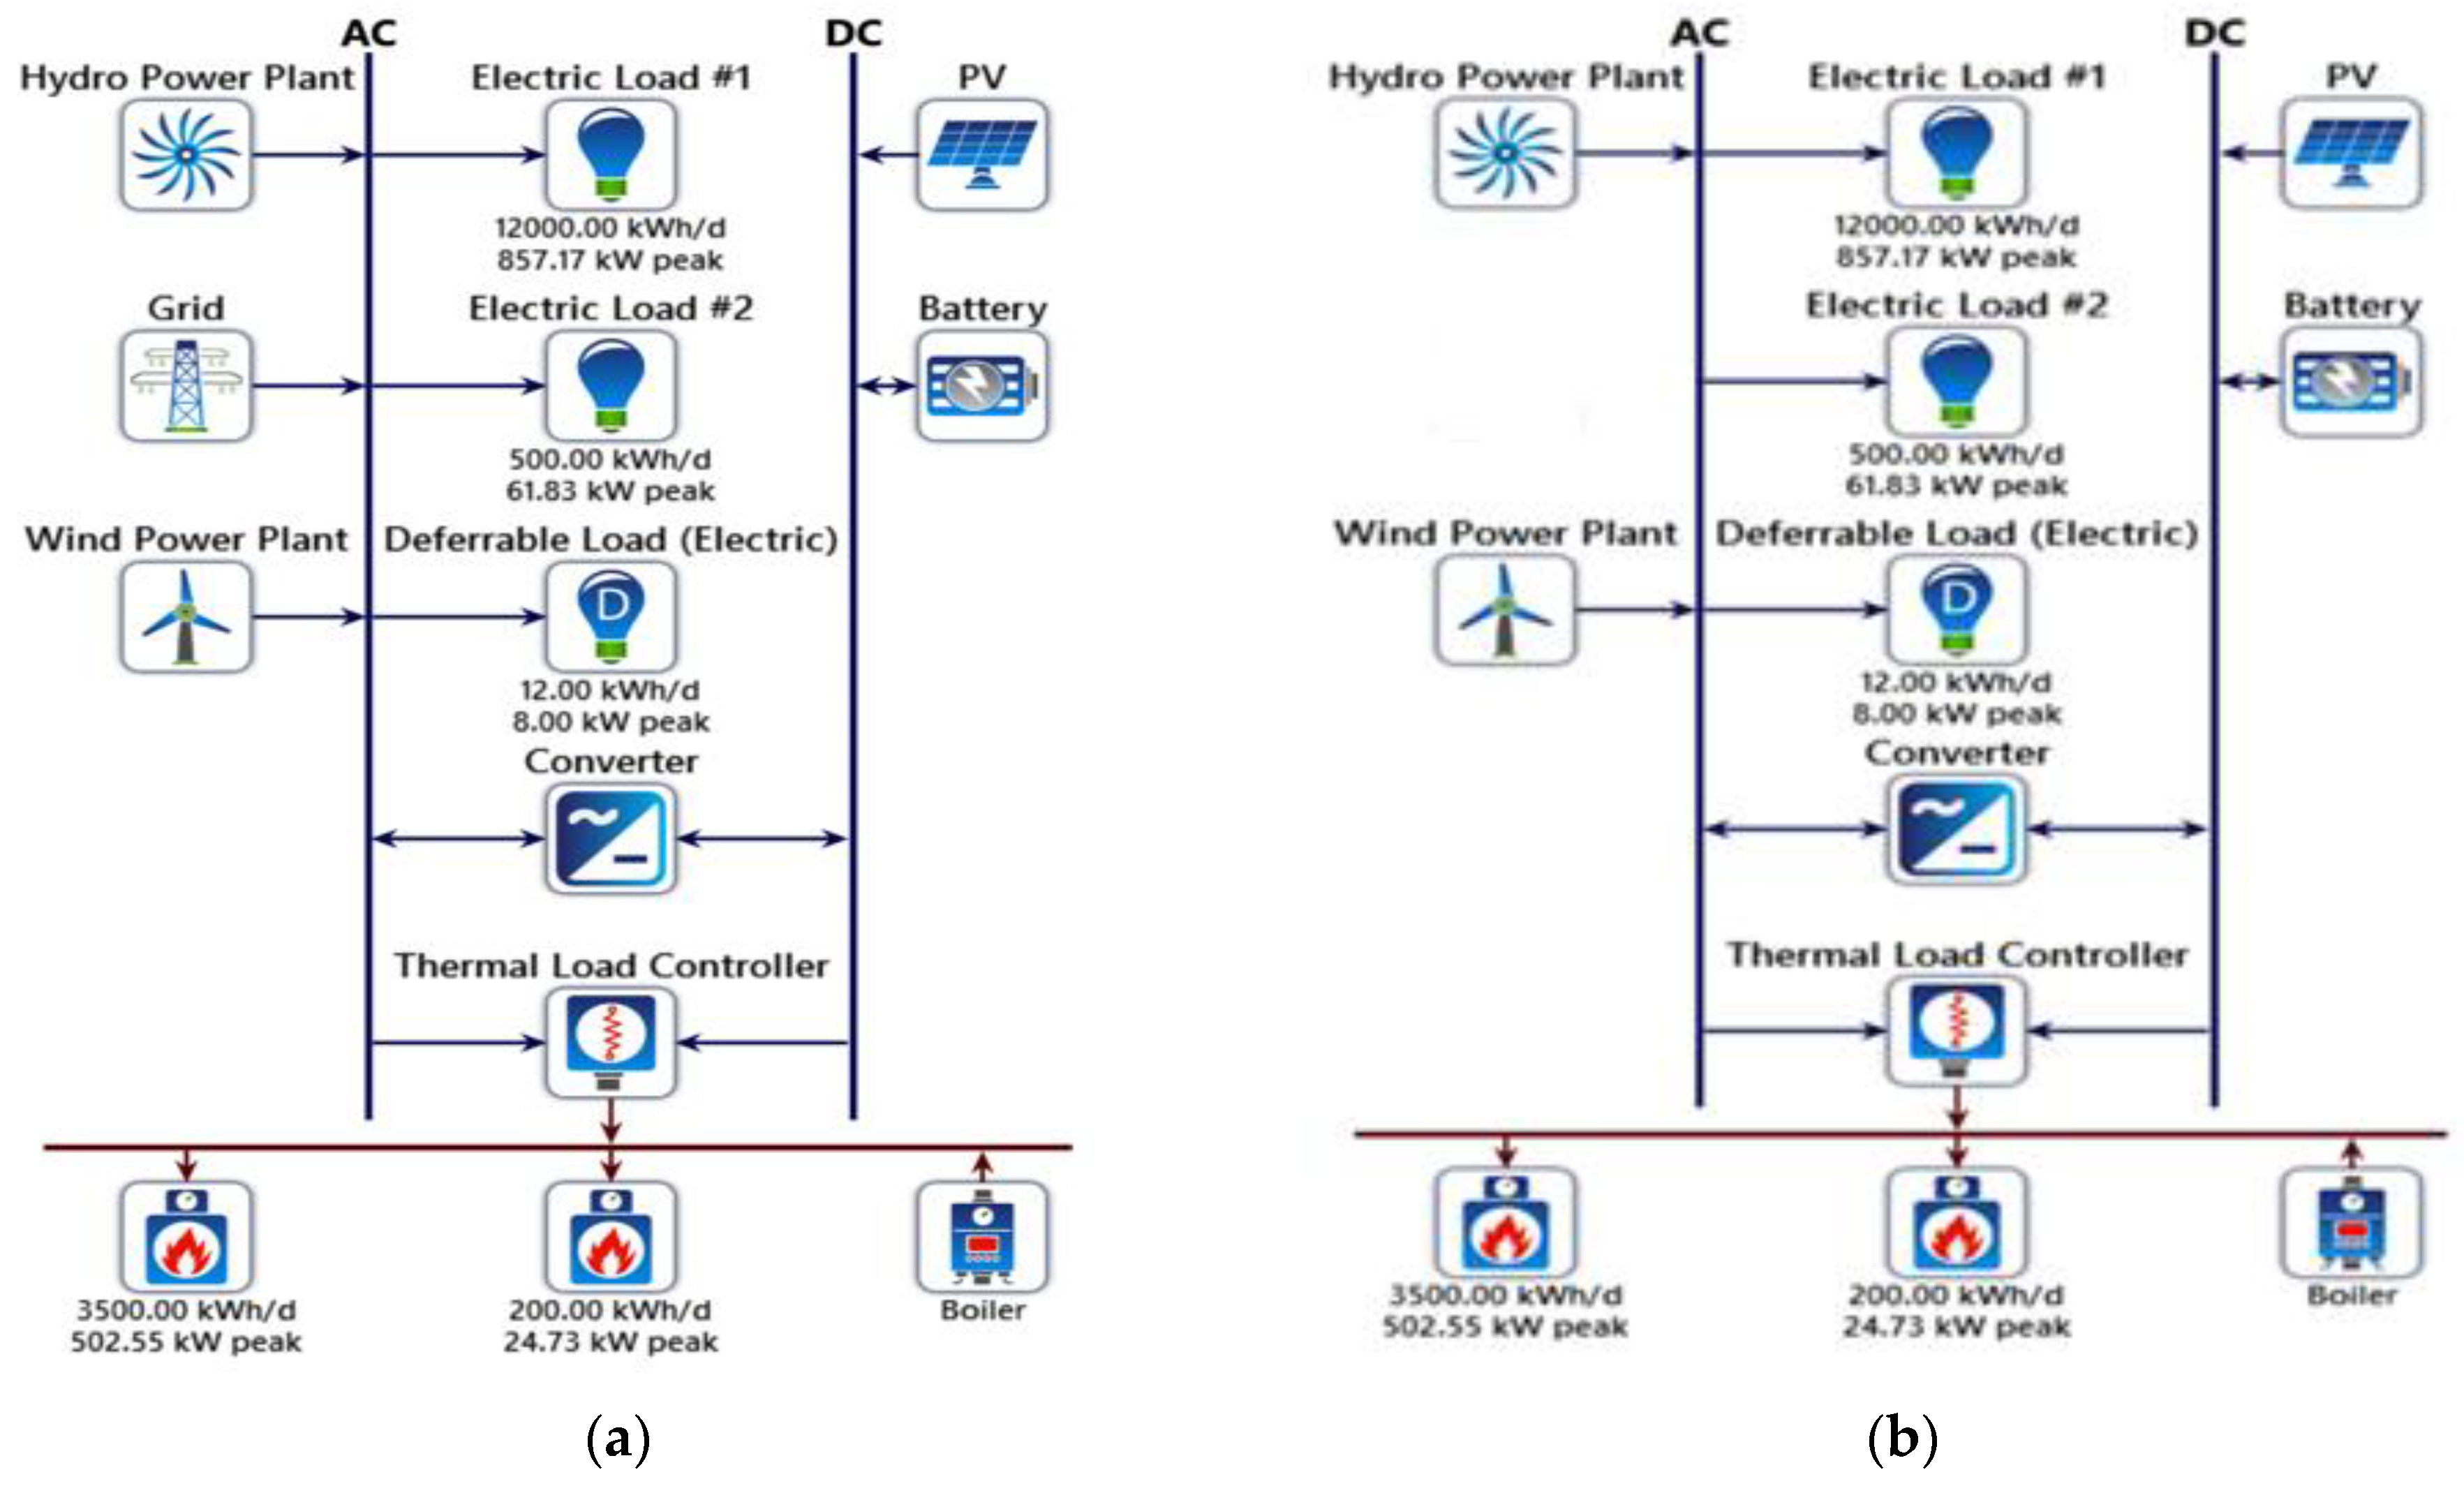
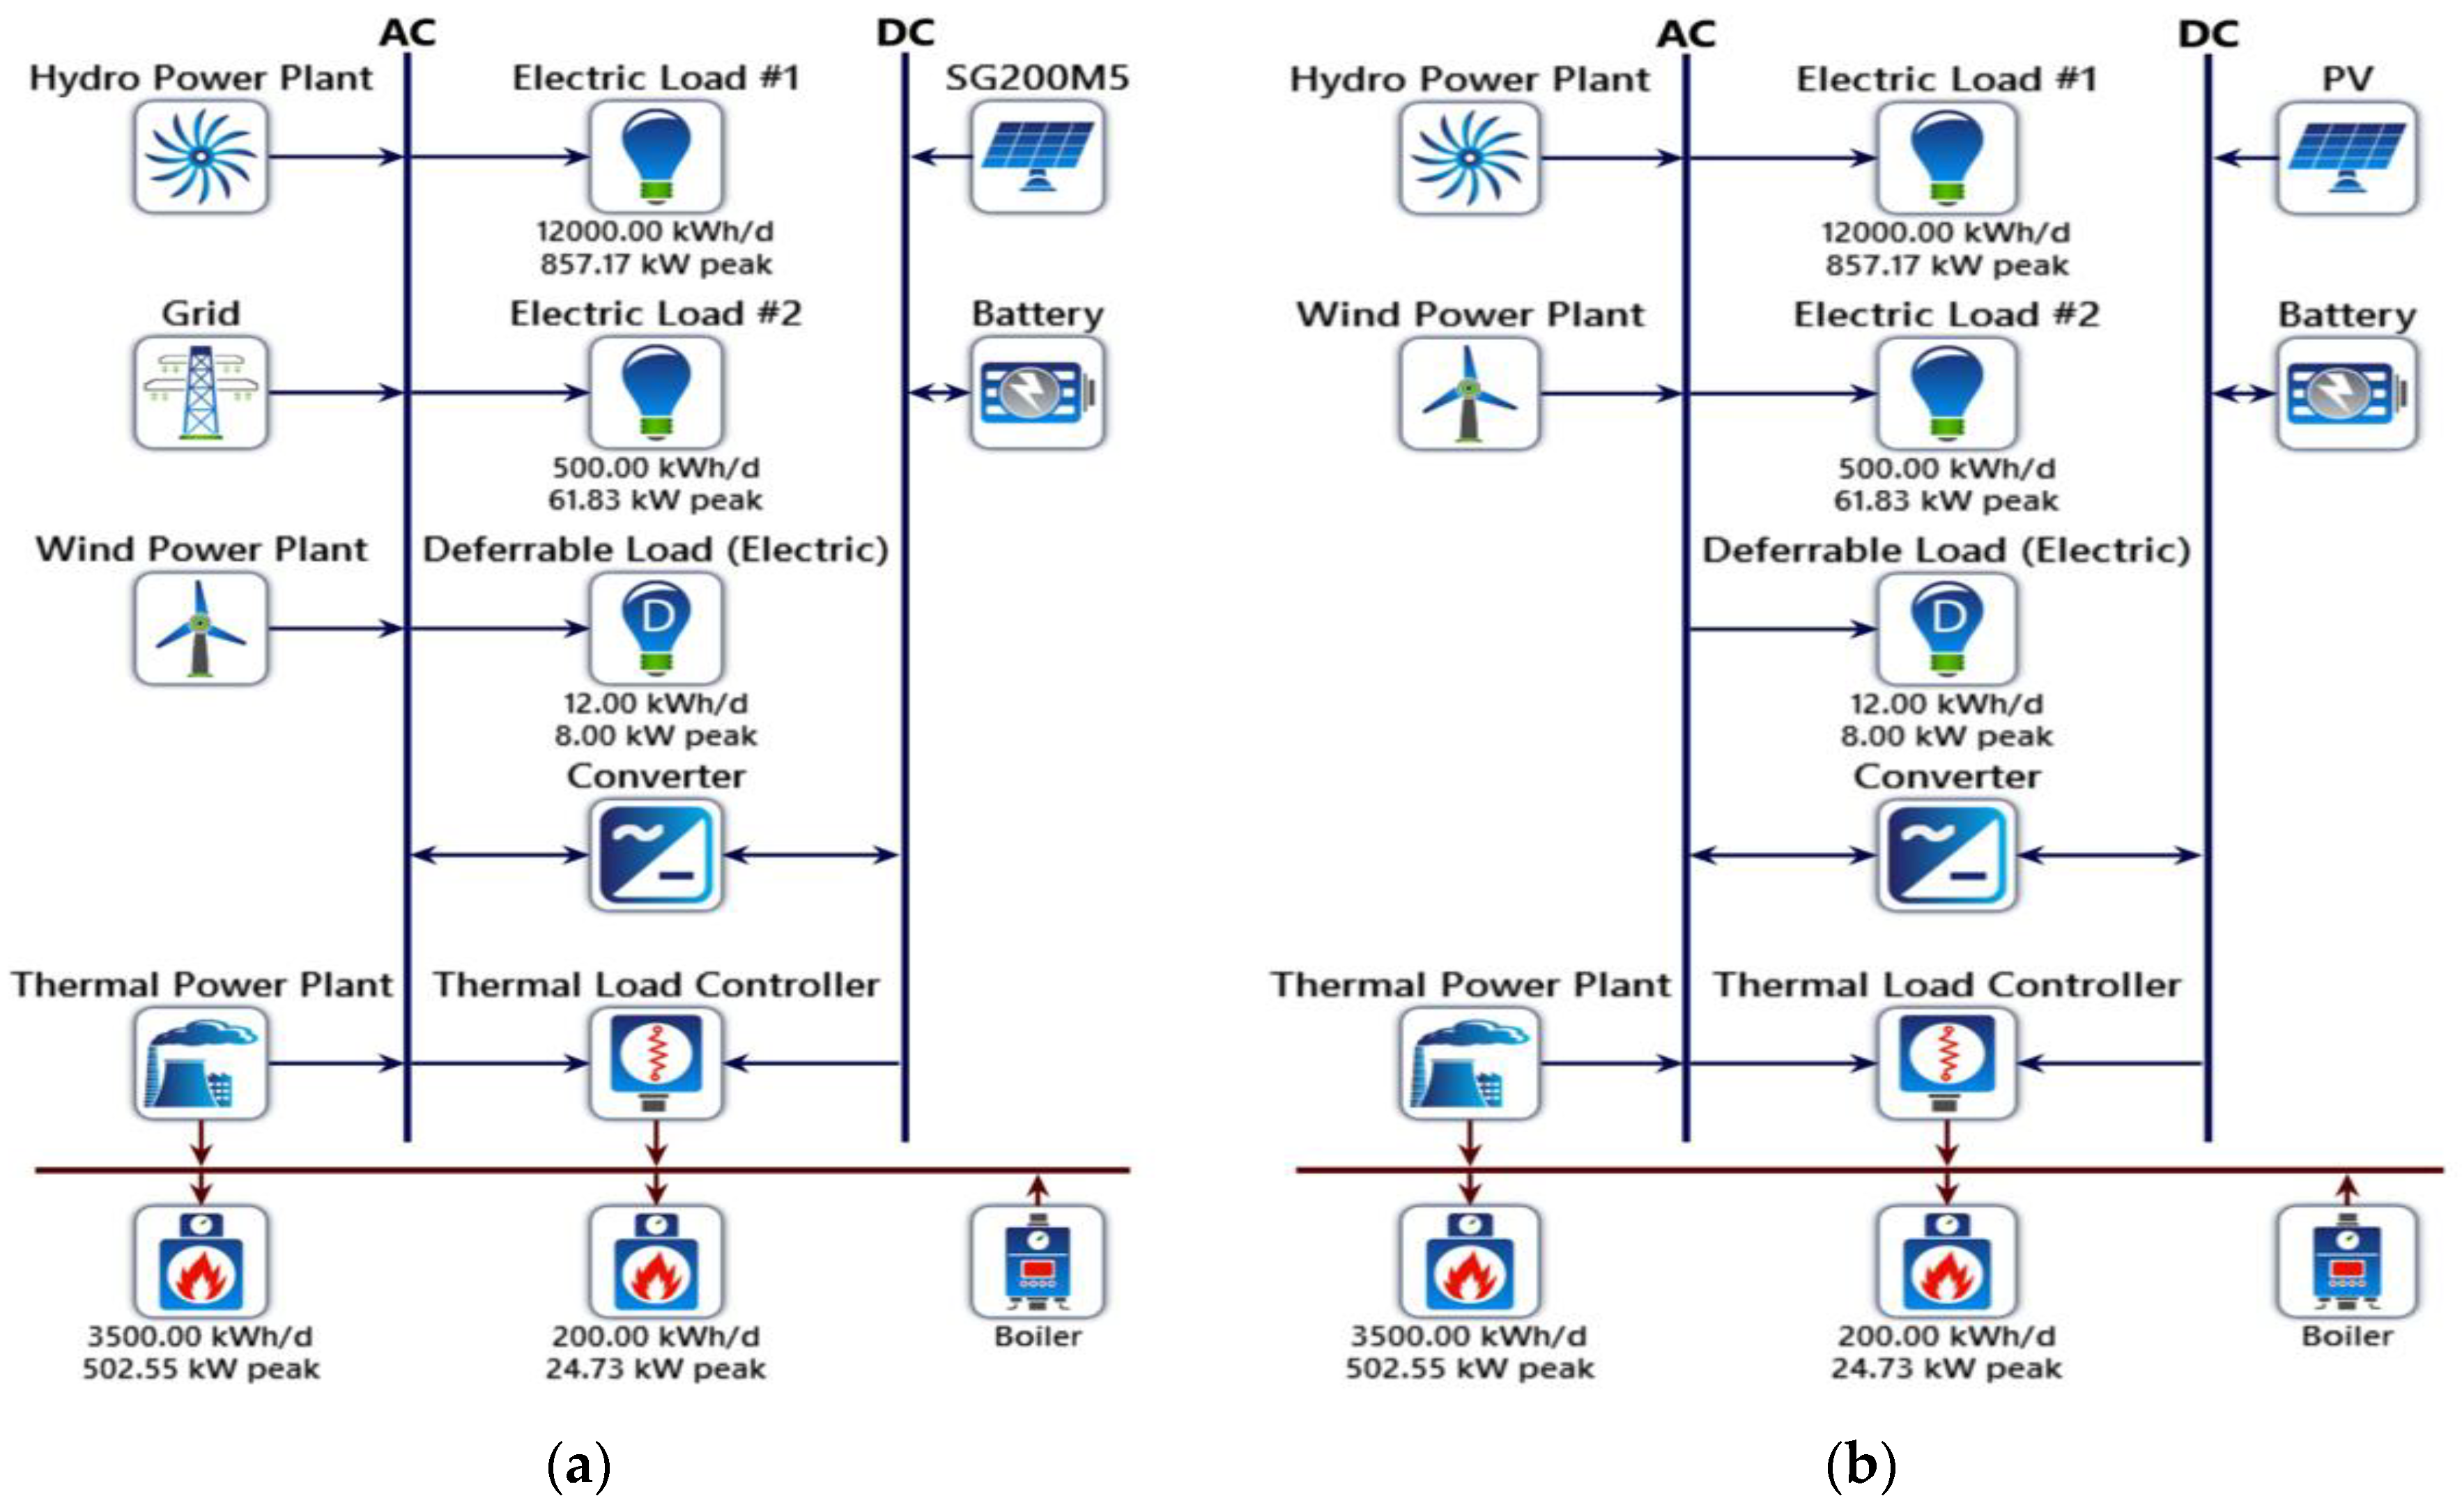
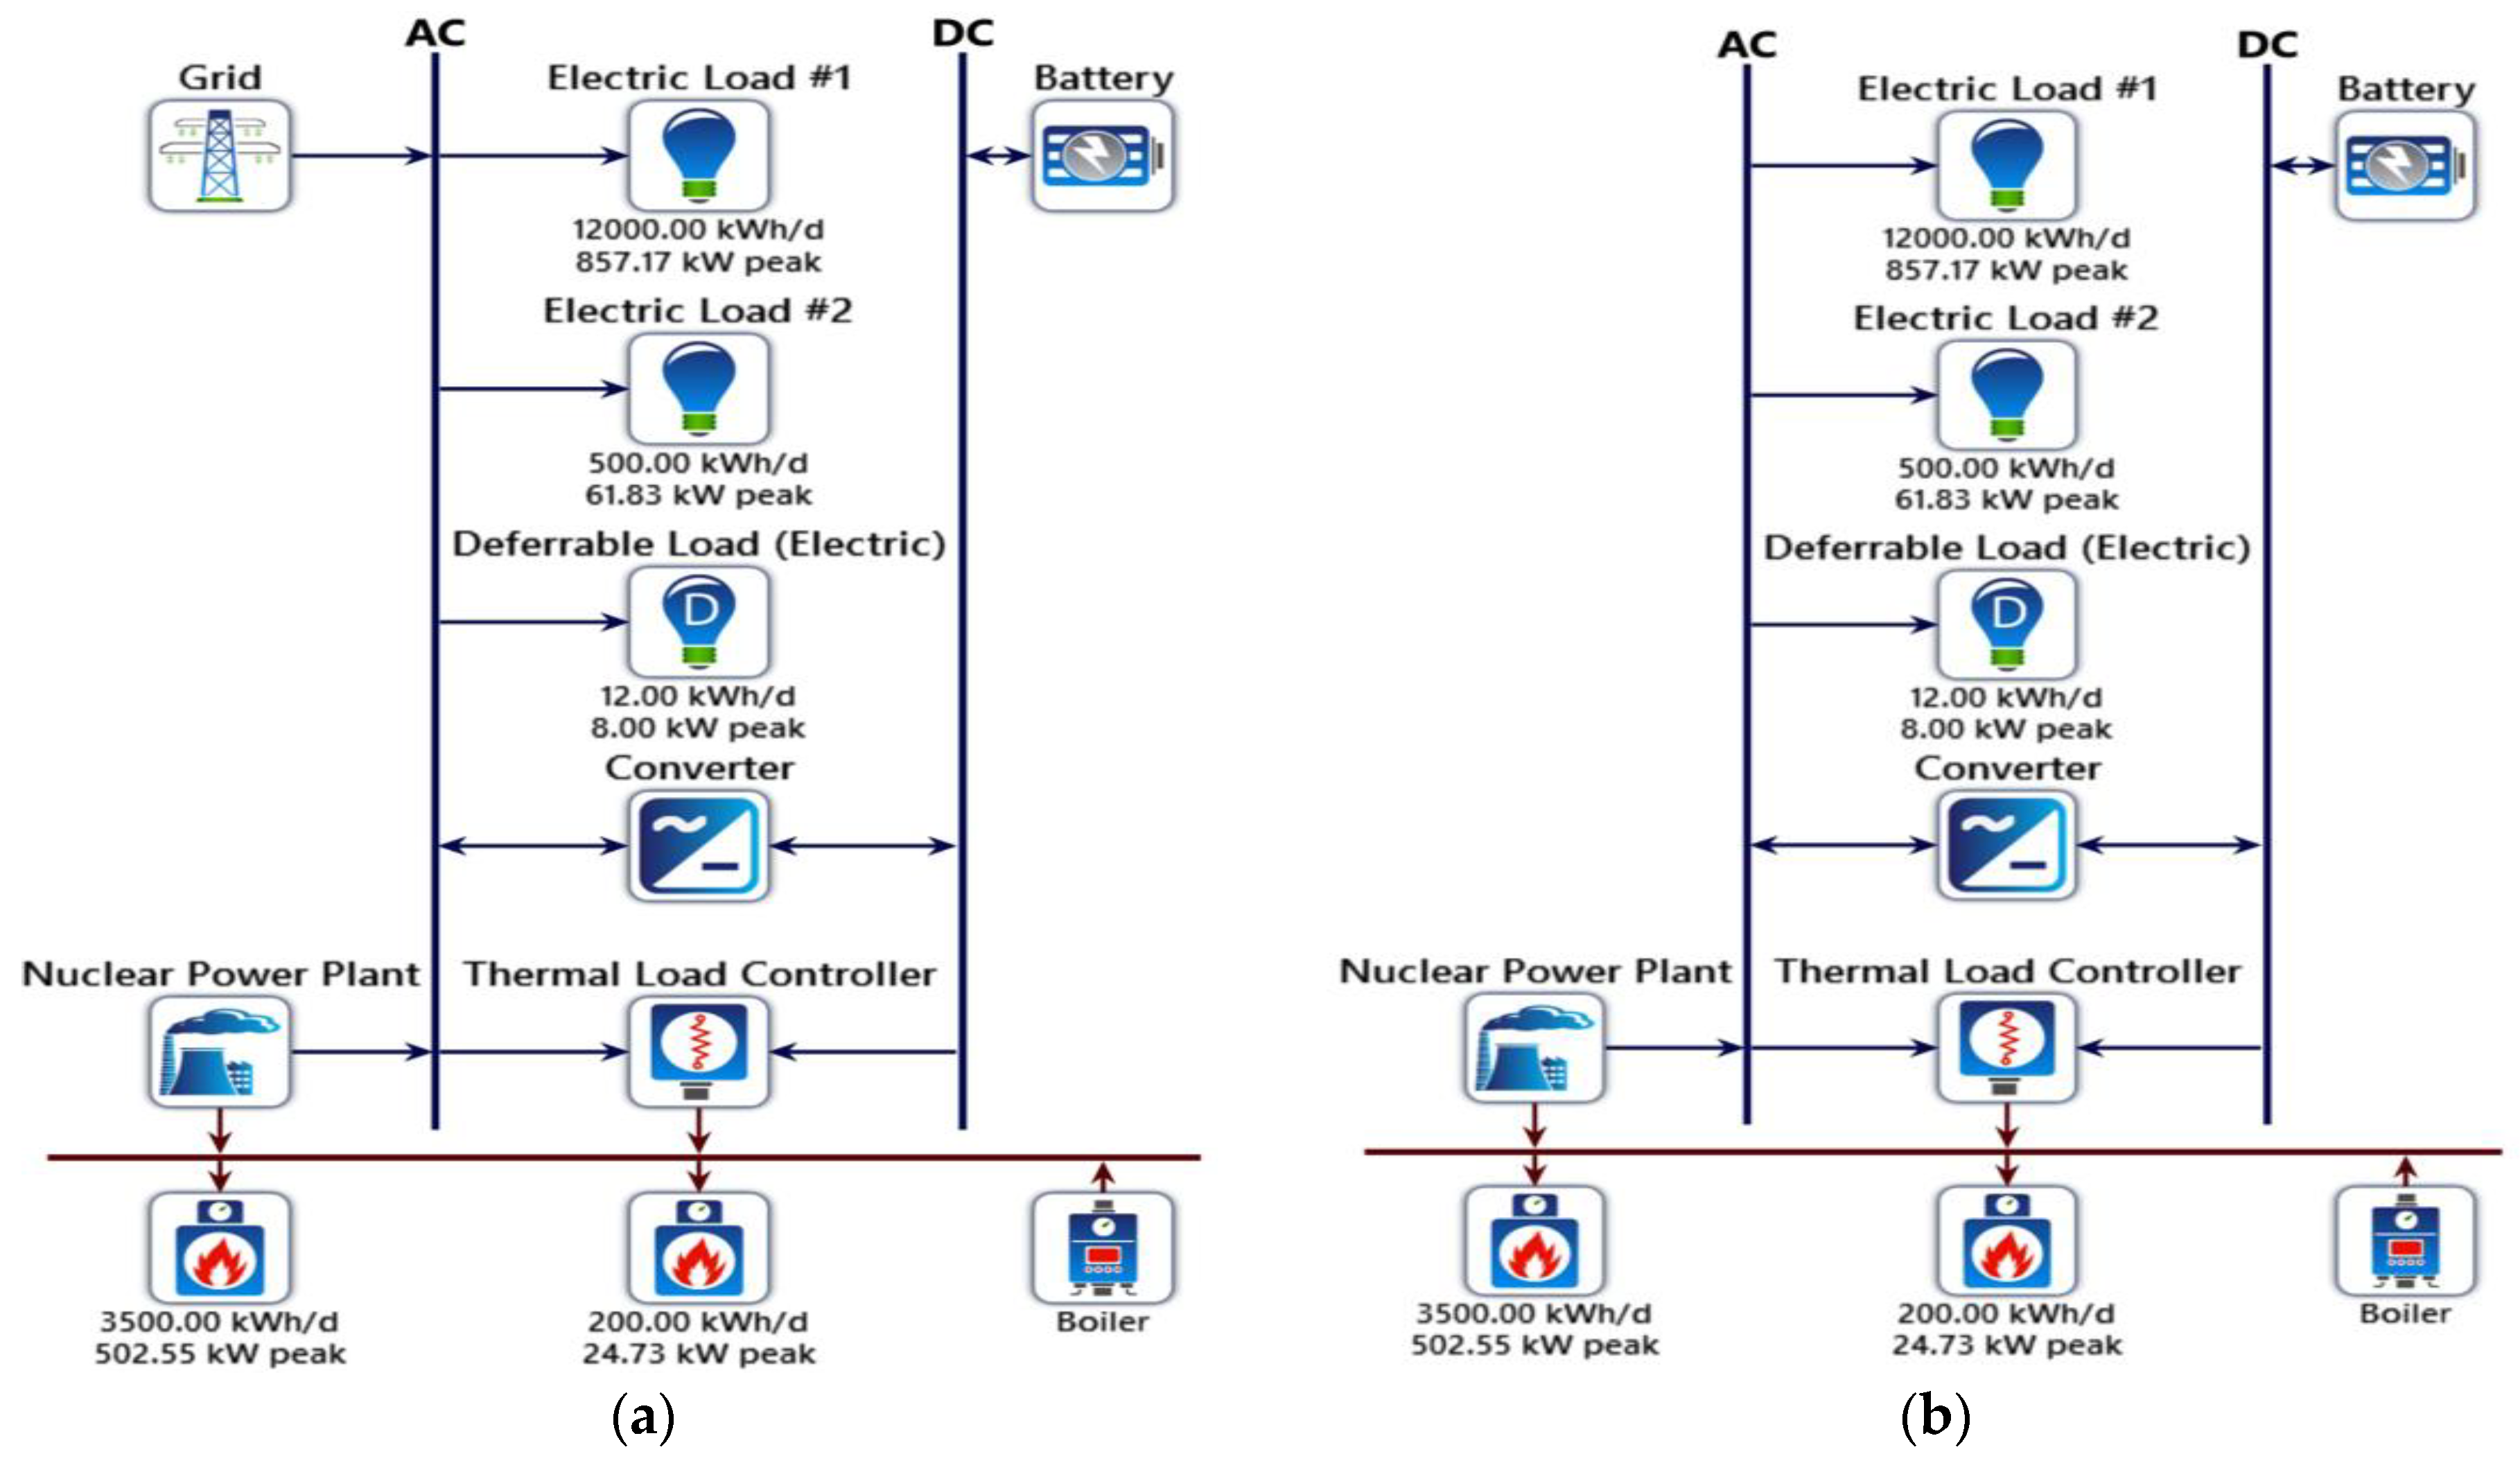
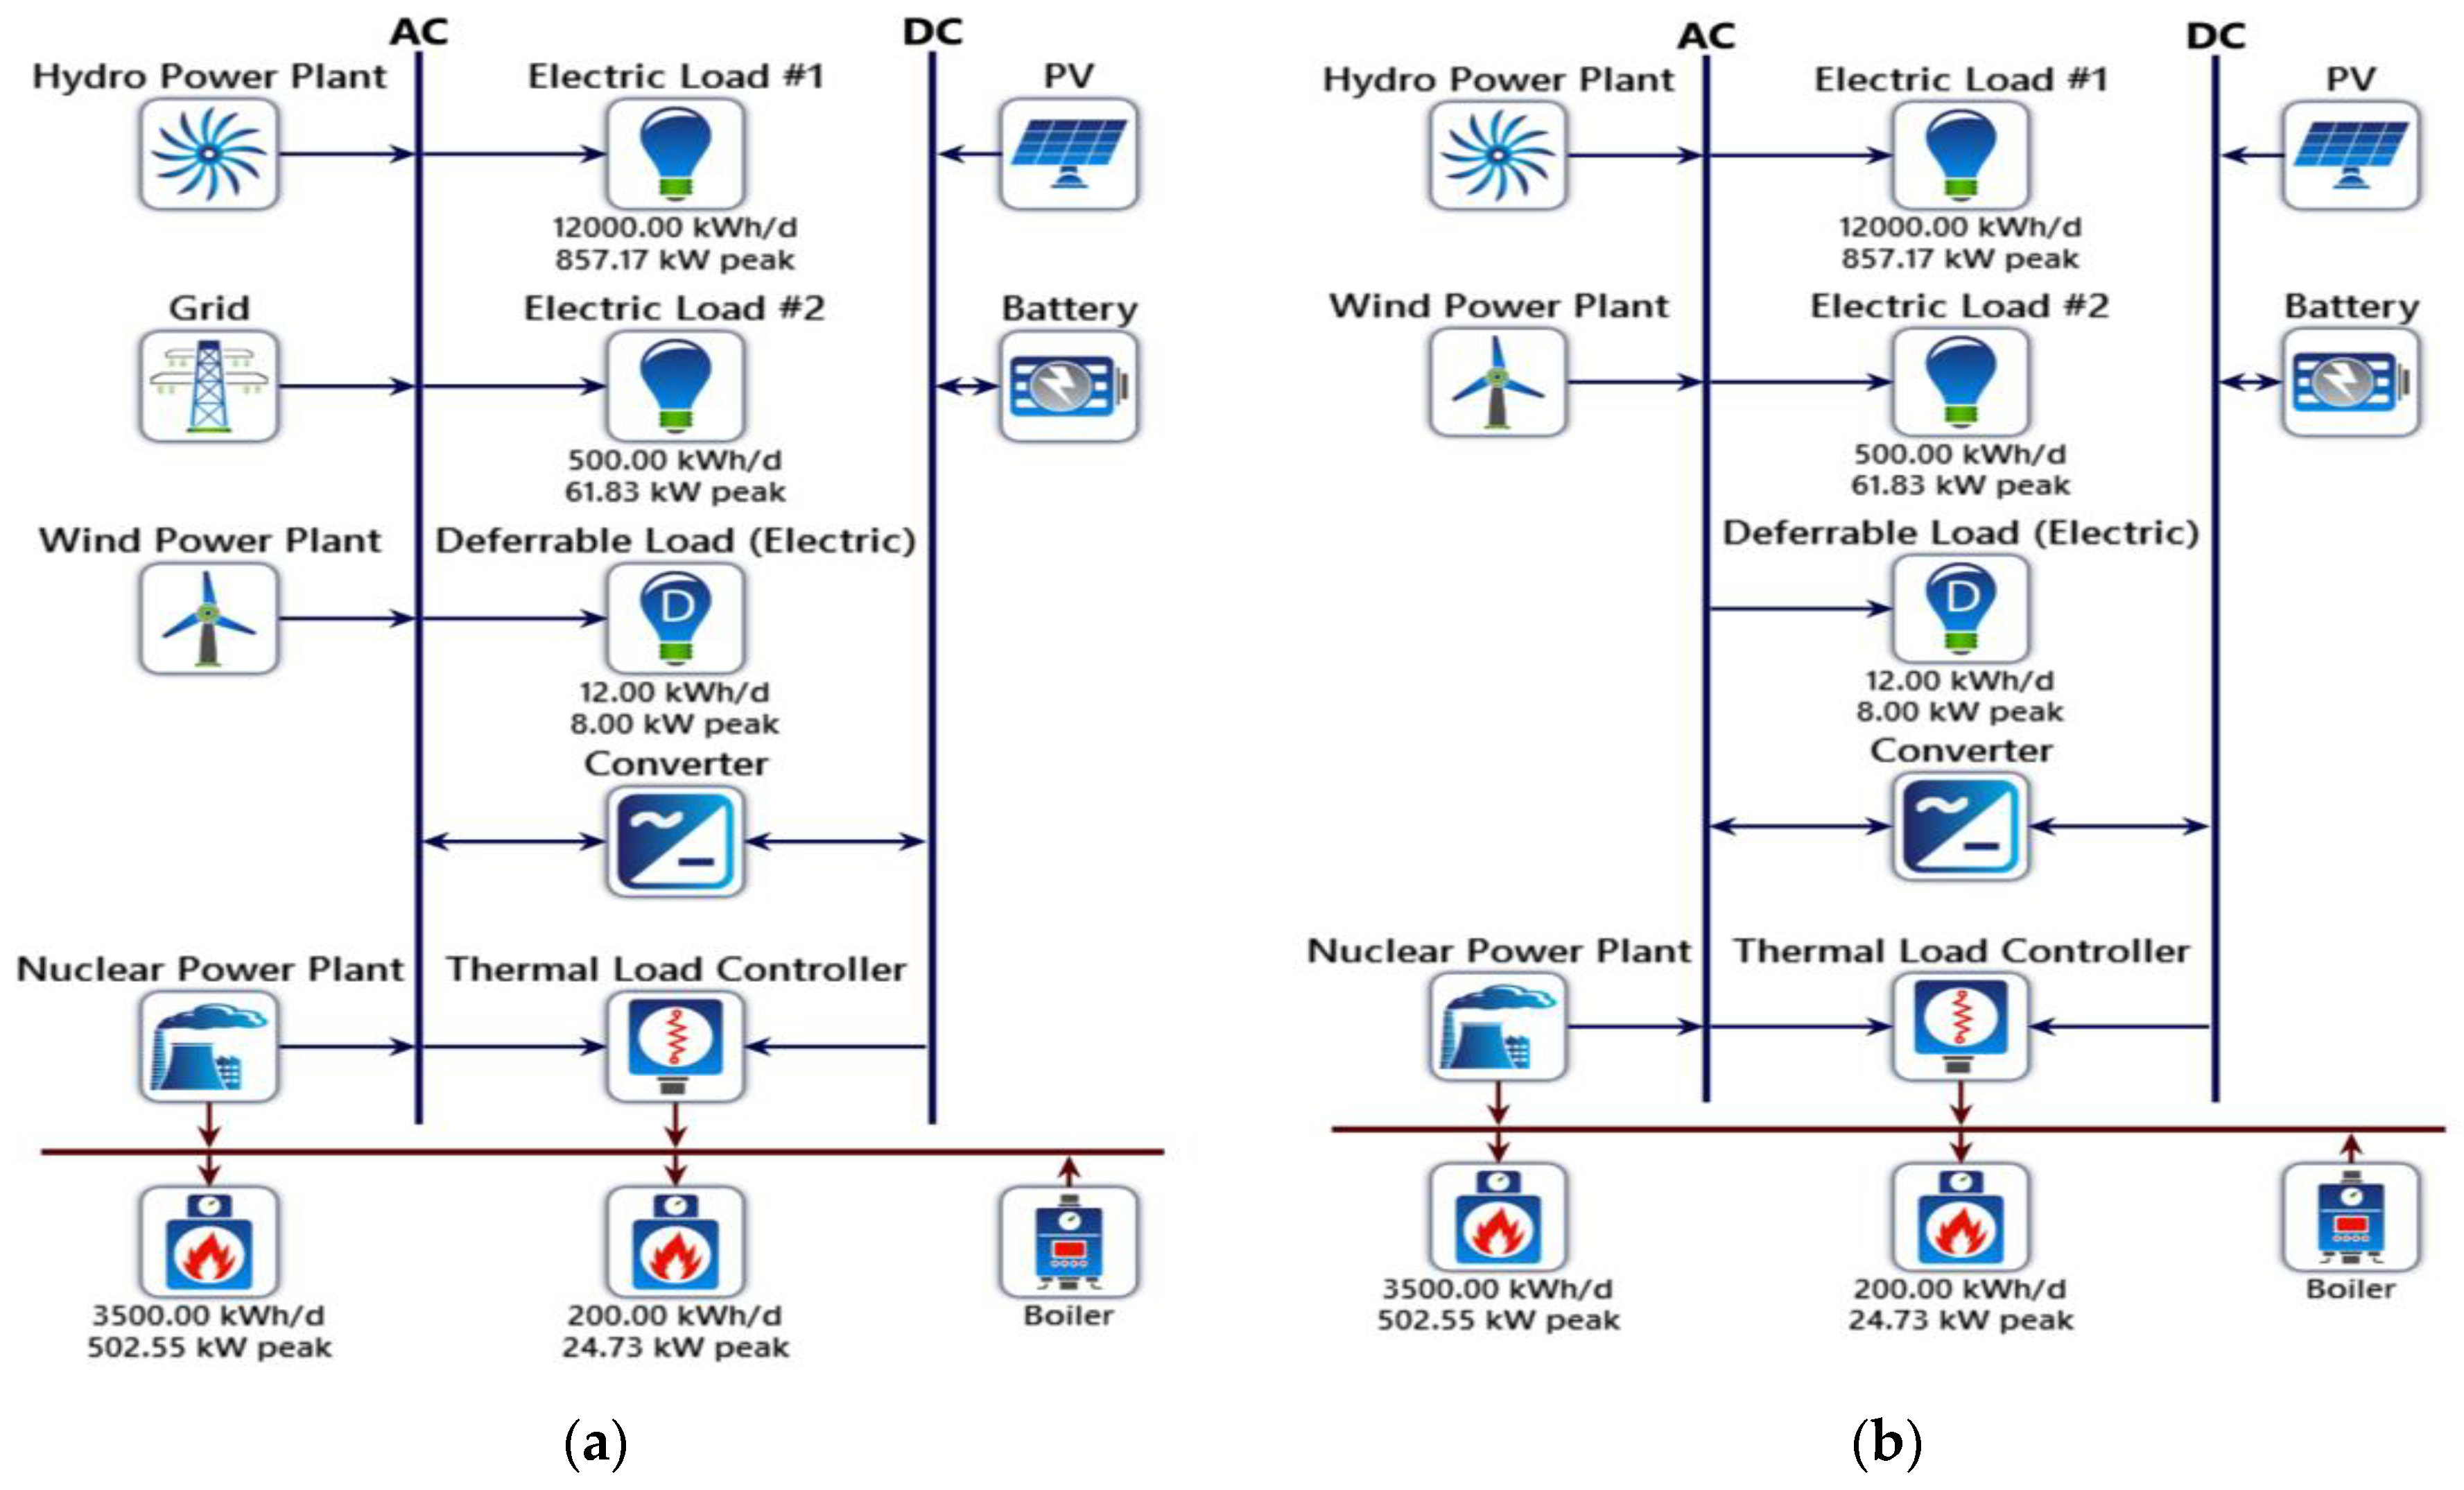
3. System Configuration

A case study has been conducted to assess some specific KPIs—net present cost (NPC), cost of energy (COE), and greenhouse gas (GHG) emissions—of an N-R MHES. The grid-level coupling method is reflected in the study. The case study includes the system equipment with some conservative assumptions that are listed with each component in the subsections. The load data are obtained from the National Aeronautics and Space Administration (NASA) Surface Meteorology and Solar Energy database [18]. The data are synthesized in a MATLAB simulator, and the Hybrid Optimization of Multiple Energy Resources (HOMER) Pro software is used for system modeling, simulations, and KPI analysis. In the study, the project lifetime is assumed as a whole 30 years – starting in 2007 and ending in 2036. The prices of the system component are pragmatic compared to the present market value. The RESs data, such as solar radiation, wind speed, and water flow of the hydro dam, are assumed to be the same during the complete project lifetime. However, some important system parameters, such as load demand and equipment cost, change in each year of project life. To address the effect of these variations on the whole system, an additional study is conducted by “Multiyear Analysis” module in the HOMER Pro software. The details of individual system equipment are demonstrated in the next few subsections. The project life, inflation rate, and discount rate are considered as 30 years, 2%, and 8%, respectively. The costs of all system equipment, mentioned in the specification table in this study, are the first-year cost of the whole project life.
The HOMER software uses the inflation rate and discount rate to calculate the actual discount rate. The actual discount rate is used to determine the discount factors and annualized costs. The inflation rate, discount rate, and actual discount rate are mathematically related as follows [19]:
r = d i 1 + i
where r, d, and i represent actual discount rate, discount rate, and inflation rate, respectively.

3.1. Electric Load

The electric load data has been collected for the year of 2018 from several facilities of Ontario Tech University (UOIT, Oshawa, ON, Canada). These data are deemed as input electric load data for the first year of the project life. The data are collected from UOIT since it has a significant variation in the load profile of the UOIT facilities. As a micro HES is considered for this analysis, the actual load profile is scaled-down to a comparable size to emulate the load profile of a small-scale energy system. The scaled-down data also reduces the simulation time. Nevertheless, the scaled-down process does not change the load characteristics.
The load profile that is collected from UOIT is designed and named “Electric Load #1” in the HOMER Pro software interface. Another electric load is modeled in HOMER Pro, entitled “Electric Load #2,” to create “diversity” in the system load profile. The peak occurs for “Electric Load #1” at noon, whereas the peak occurs for “Electric Load #2” at evening. Thus, the diversity is created. A deferrable electrical load is also designed in the HOMER Pro software. The value of average energy demand, storage capacity, peak power demand, and minimum load ration of the deferrable load are 12 kWh/day, 48 kWh, 8 kW, and 80%, respectively. The “Electric Load #1” and “Electric Load #2” are given the highest priority for demand fulfillment in the system and considered as the primary load in simulation; whereas, the deferrable electric load gets less priority. In the simulation, the resources always supply electricity to the primary load first, then go for the deferrable load. 
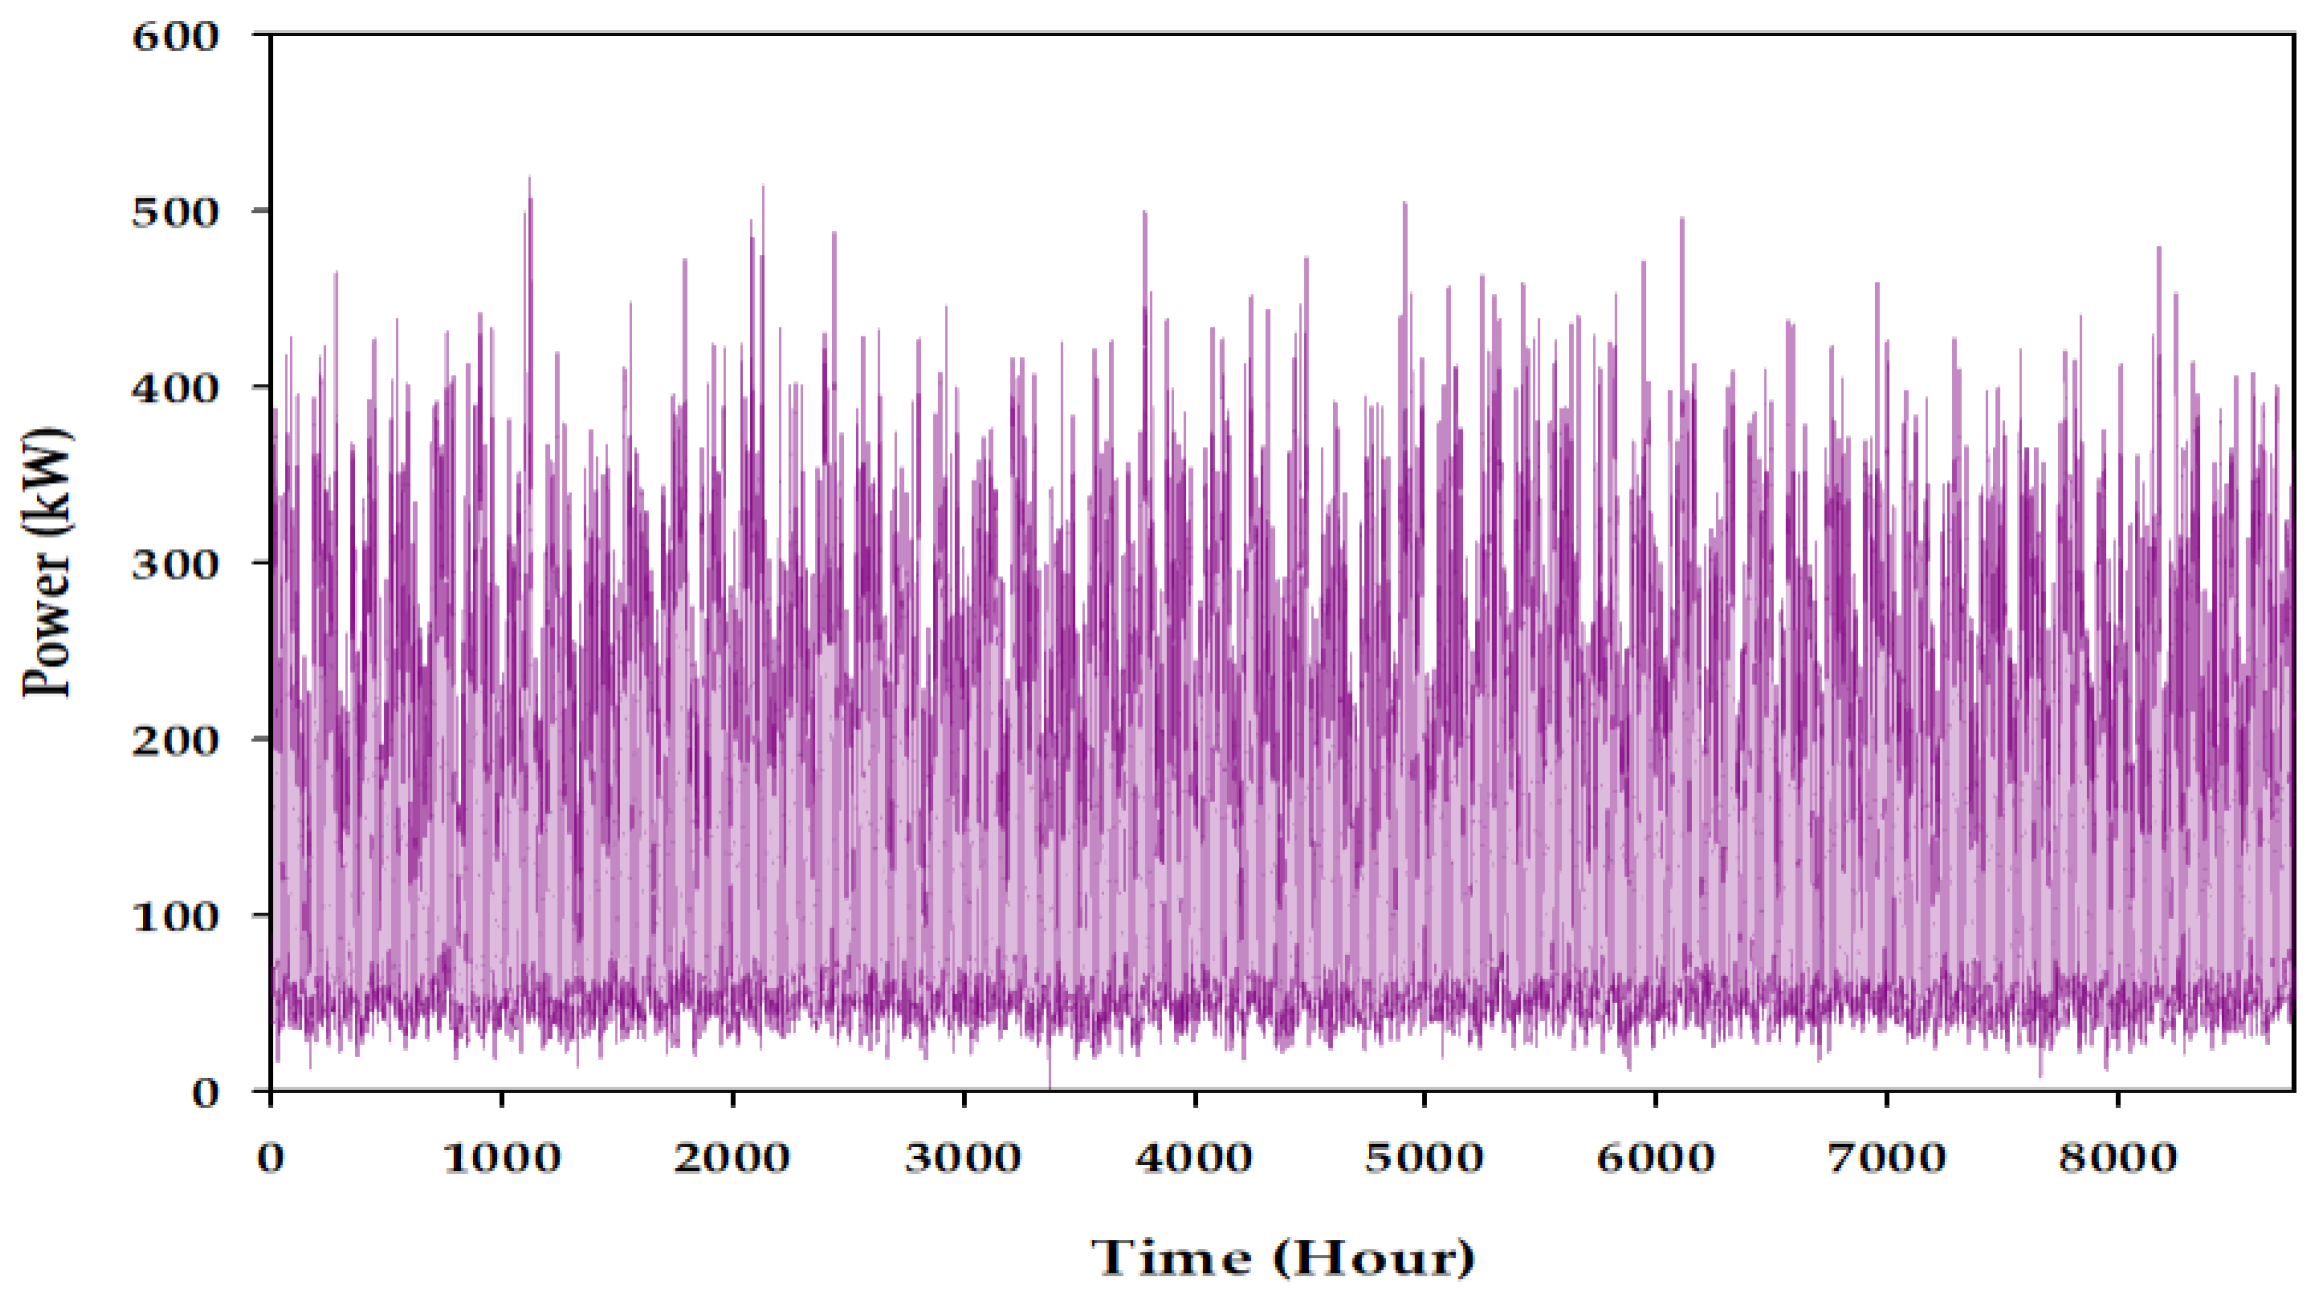
Figure 1 illustrates the total electric load profile - summation of Electric Load #1, Electric Load #2, and deferrable load - of the system. Table 1 represents the details of system electric load.
The yearly total electrical load profiles are depicted in Figure 1. The characteristics of the electrical loads are summarized in Table 1.

3.2. Thermal Load

Since the actual thermal load data is not available for the project, a standard thermal load profile is modeled in this study from HOMER Pro software library. Two types (commercial load and community load) of thermal loads are designed to introduce variety into the N-R MHES. The thermal loads are compatible and comparable to the typical hybrid energy system.
The yearly total thermal load profiles are depicted in Figure 2. The peak demand occurs at noon and evening for Thermal Load #1 and Thermal Load #2, respectively. The characteristics of thermal loads are summarized in Table 2.

3.3. Diesel Generator

Though the FFTG is not a compulsory part of N-R MHES, a Diesel genset is studied here to investigate and compare the KPIs between conventional fossil fuel-based thermal hybrid energy systems and N-R MHES. The traditional hybrid energy system combines FFTGs, RESs, energy storage, and power electronic components. In this project, a 1 MW diesel generator is compared with a 1 MW MMR, side by side, to obtain the most feasible system in terms of economic and environmental viewpoints. The heat recovery ratio and diesel price are assumed 40% and 0.79 UDS/Liter [20], respectively in this study. The economic parameters of a typical diesel generator, used in the simulation, is listed in Table 3. The HOMER Pro software automatically calculates the total emission by diesel generator while the Diesel genest produces electricity.

3.4. Solar Power

Solar photovoltaic (PV) technology is used in this project to convert solar radiation into useful electricity. The solar radiation data of UOIT have been collected from NASA Surface Meteorology and Solar Energy database. The solar radiation data are assumed to be the same throughout the 30 years of the project lifetime.
The output of the PV array is calculated as follows [21]:
P PV = Y PV f PV ( G T G T , STC ) [ 1 + α p ( T c T c , STC ) ]
where Y PV , f PV , G T , G T , STC , α p , T c , and T c , STC denote the rated capacity of the PV array under standard test conditions (kW), PV derating factor (%), solar radiation incident on PV in the current time step (kW/m2), solar incident radiation at standard test condition (1 kW/m2), temperature coefficient (%/°C), PV cell temperature in the current time step (°C), and PV cell temperature under standard test conditions (25 °C), respectively.
The manufacturers set the PV power rating at a specific condition called “Standard Test Conditions (STC).” In STC, the solar radiation is assumed to be 1 kW/m2, the cell temperature is taken as 25 °C, and no wind flow is considered around the PV cell. However, in practical cases, the full-sun cell temperature is always greater than 25 °C, and there is a significant wind flow encompassing the PV system. The derating factor is also regarded to model the PV cell explicitly since it is related to the panel losses, wiring losses, and aging. The derating factor is a scaling factor to match the PV rating of the manufacturers with the real-world conditions.
If the temperature effect is ignored to design the PV panel, Equation (3) can be simplified as follows:
P PV   = Y PV f PV ( G T G T , STC )
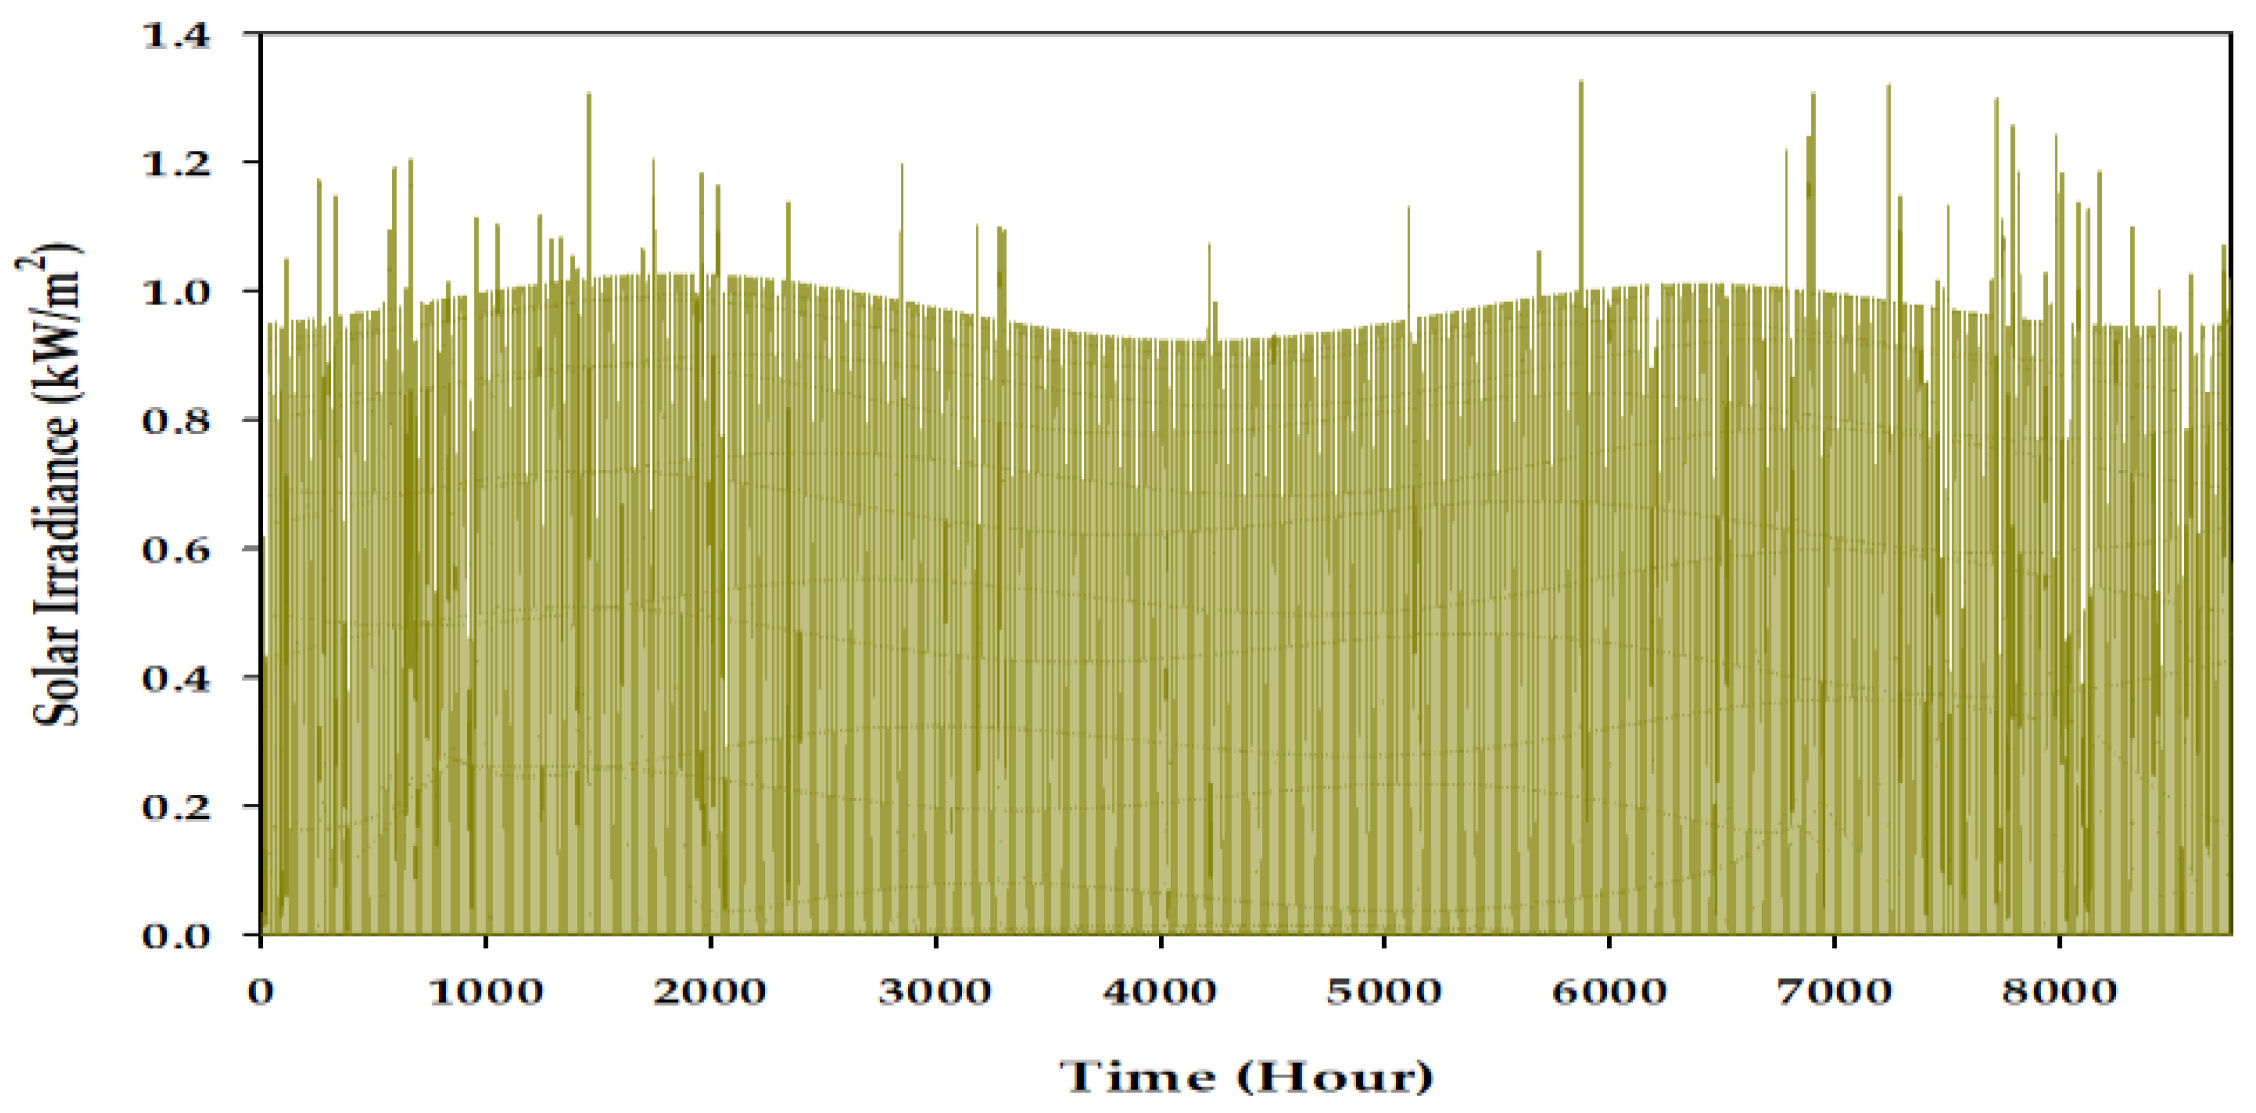
The yearly solar irradiance data are represented in Figure 3. A flat panel 400 kW PV array, having an operating temperature 25 °C, is used here. The PV array consists of 400 solar cell units; each unit is rated at 1 kW. The details specifications of the solar PV cell are summarized in Table 3.

3.5. Wind Power

Two (2) wind turbine units, each rated as 330 kW, are used in this N-R MHES. The hub height and rotor diameter of the turbine are 55 m and 33 m, respectively. It has been assumed that the wind speed is the same for the entire project life. The details of the wind turbine are presented in Table 3.
Three steps are maintained to calculate the output of the wind turbine in HOMER [22]. The first step is to estimate wind speed at the hub height of the wind turbine. The wind speed at the hub height is calculated by Equation (4):
V HUB = V A ln ( H HUB H 0 ) ln ( H A H 0 )
where V HUB , V A , H HUB , H 0 , and H A denote wind speed at the hub height of the wind turbine ( m / s ), Wind speed at the anemometer height ( m / s ), Hub height of the wind turbine ( m ) , Surface roughness length ( m ) , and Anemometer height ( m ) , respectively.
The second step is to calculate the turbine power at standard air density; this is done with the help of the turbine power curve given by the manufacturer. The wind power output at standard air density is estimated from the corresponding wind speed value, calculated in the previous step.
The third step deals with the application of density correction. The following equation is used for density correction to calculate the exact wind power extracted by the wind turbine:
P ACTUAL = ( ρ ρ 0 ) P STP
where P ACTUAL , ρ , ρ 0 , and P STP represent actual power output of the wind turbine ( kW ), actual air density ( kg / m 3 ), air density at standard temperature and pressure ( kg / m 3 ), and power output of the wind turbine at standard temperature and pressure ( kW ), respectively. 
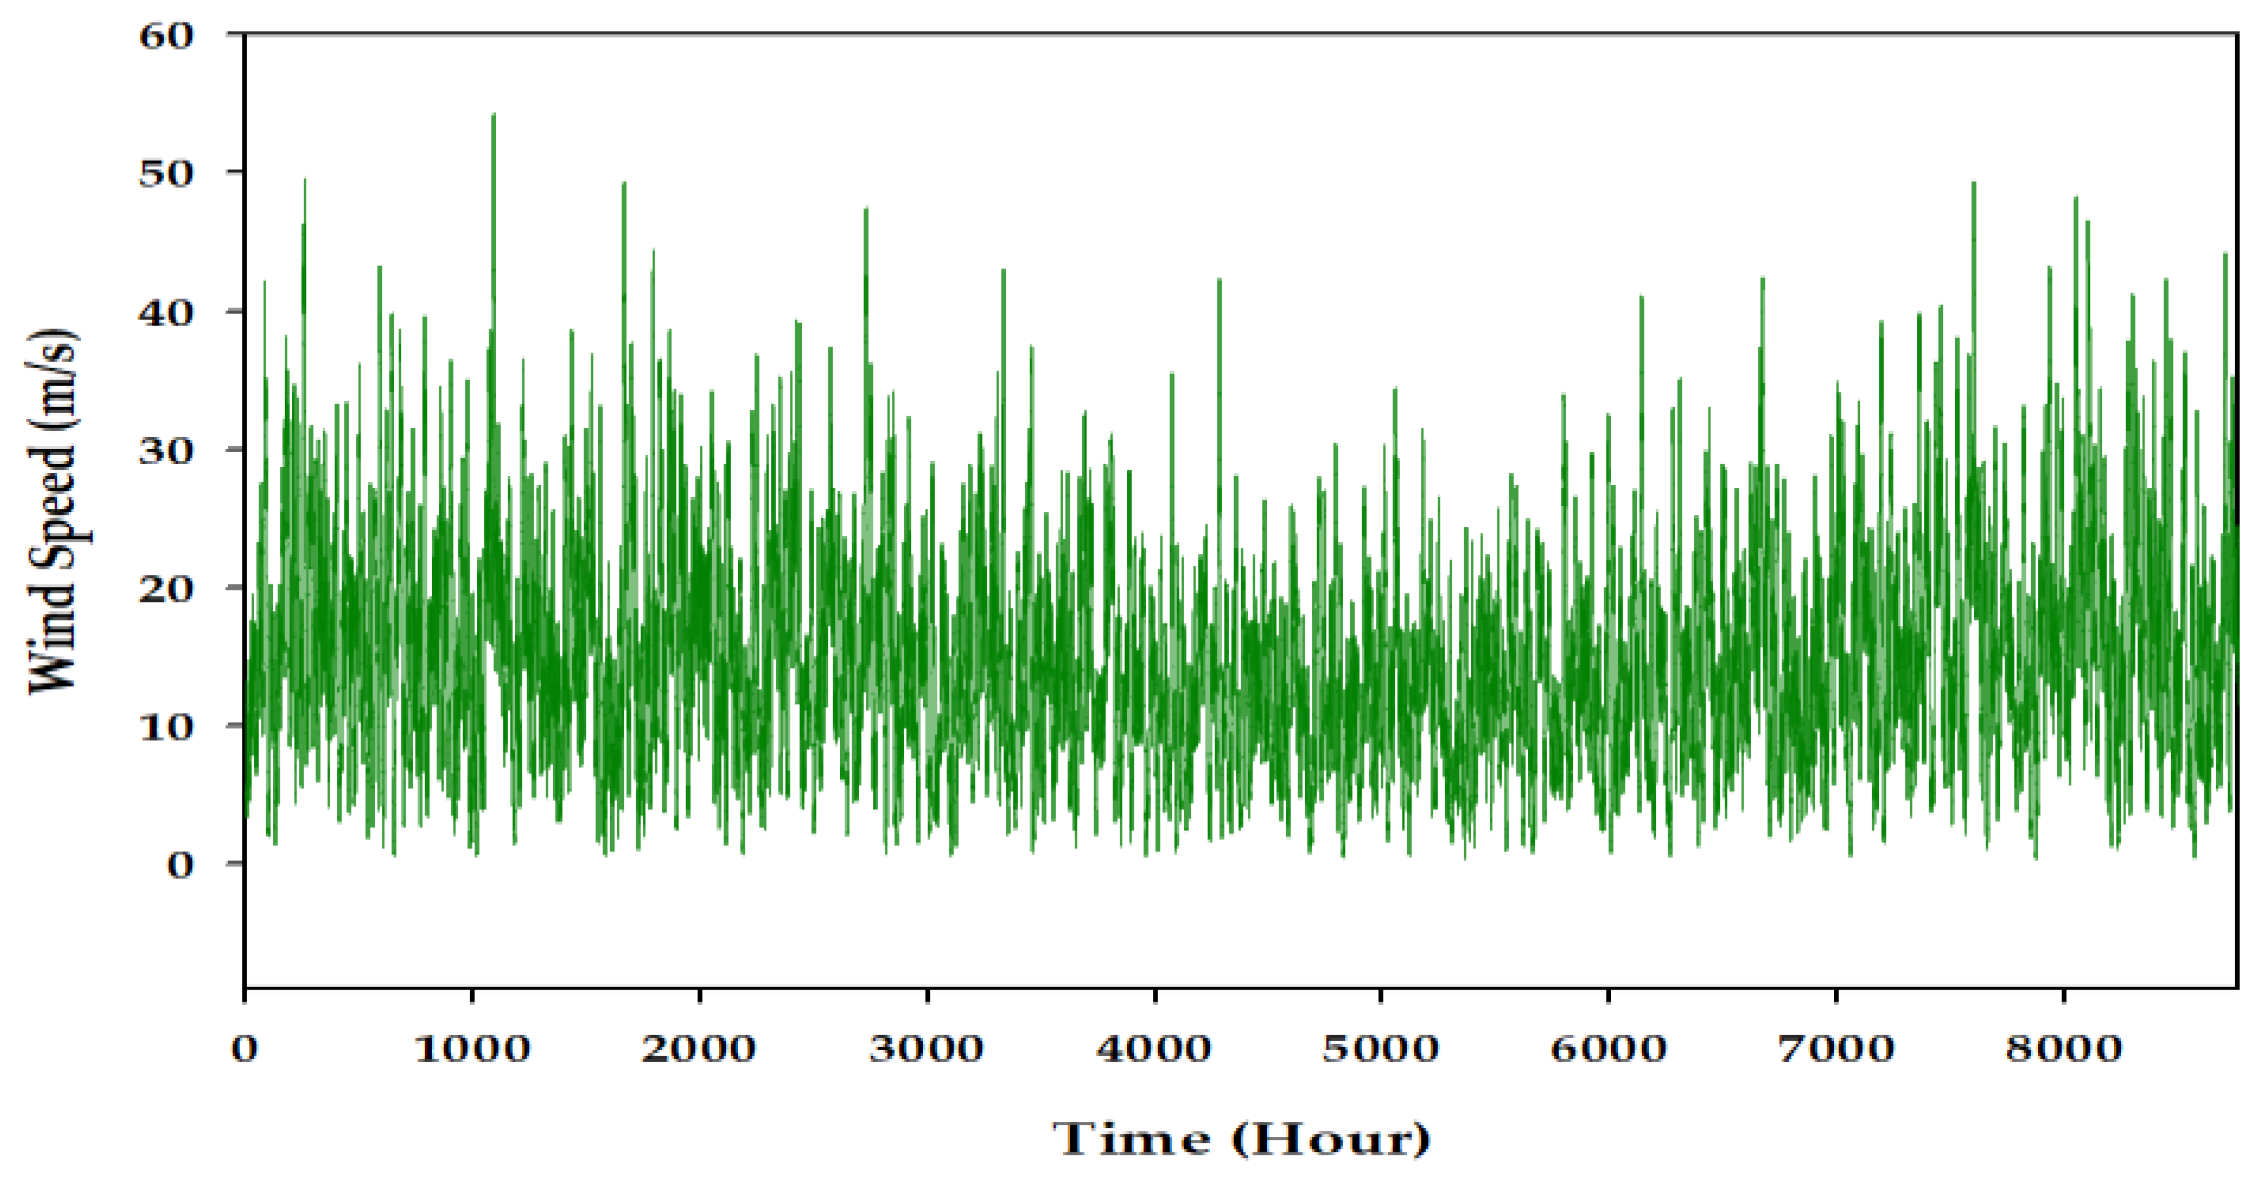
Figure 4 represents the wind speed profile at UOIT for one year.
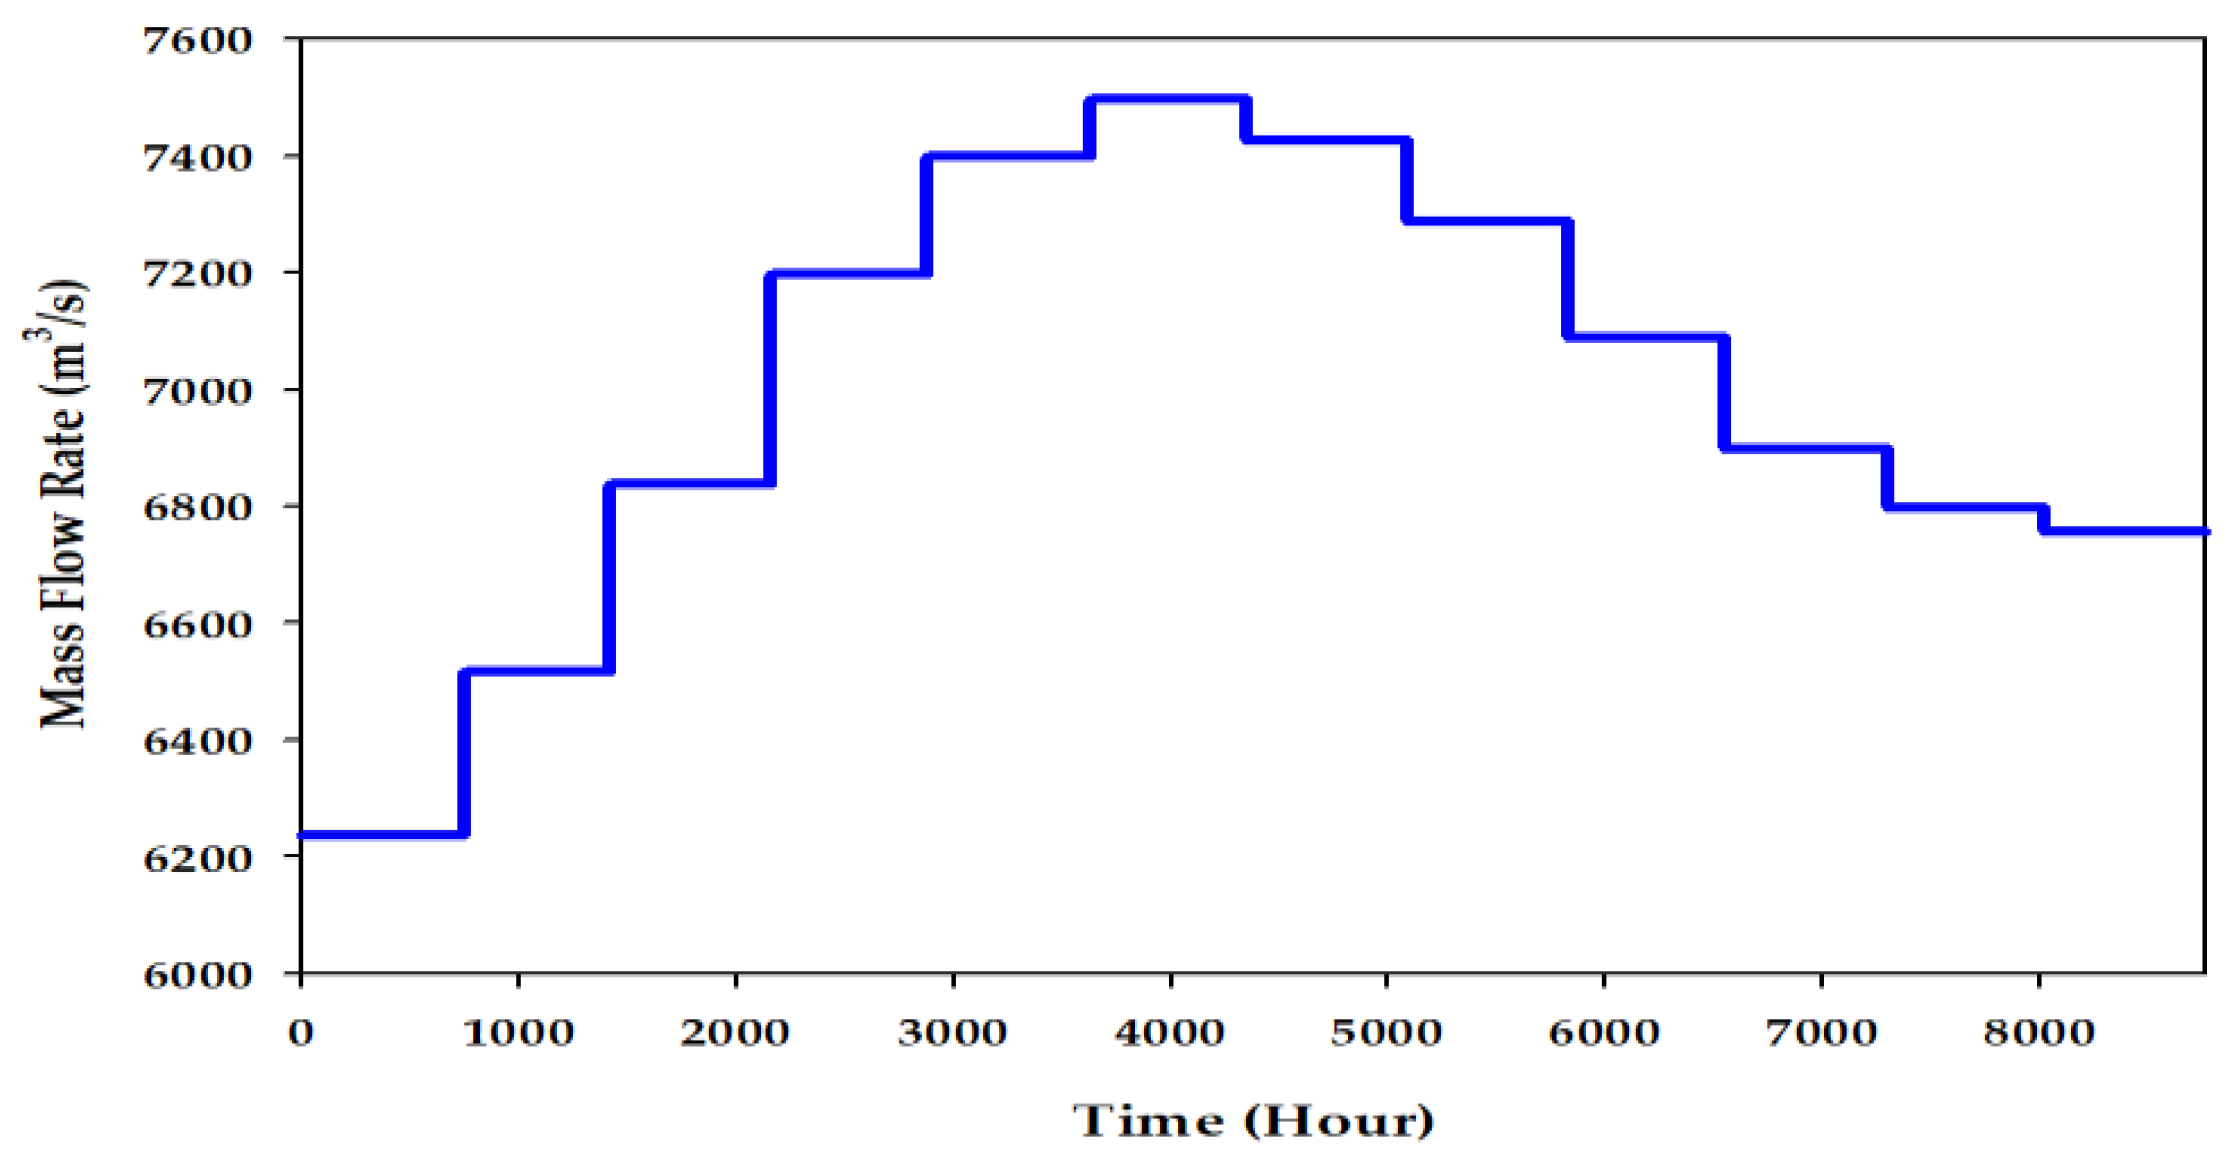
3.6. Hydro Power

A run-of-river hydroelectric plant is considered in this study. The average yearly (2018) mass flow rates of Lake Ontario, Canada are collected and shown in Figure 5. The economic specifications of the hydro plant and hydro turbine are summarized in Table 3.
The nominal power of a hydropower plant can be calculated from the following equation [23]:
P HYDRO = H A × ρ WATER × g × Q TURBINE × η TURBINE
where H A , ρ WATER , g , Q TURBINE , and η TURBINE denote available water head ( m ), water density ( kg m 3 ), gravitational constant ( m s 2 ), mass flow rate ( m 3 s ), and hydro turbine efficiency (%), respectively.
The mass flow rate or hydro turbine flow rate is the amount of water that flows through the hydro turbine. In this study, the mass flow rate is calculated using Equation (7) [23]:
Q TURBINE = { 0 , Q AVAILABLE < Q MINIMUM Q AVAILABLE ,   Q MINIMUM Q AVAILABLE Q MAXIMUM   Q MAX ,   Q AVAILABLE > Q MAXIMUM
where Q AVAILABLE , Q MINIMUM , and Q MAXIMUM represent available mass flow rate to hydro turbine ( m 3 s ), available minimum mass flow rate to hydro turbine ( m 3 s ), and available maximum mass flow rate to hydro turbine ( m 3 s ), respectively.
The available water head, design flow rate, minimum flow rate, and maximum flow rate of the hydroelectric plant are considered as 25 m, 500 L/s, 50%, and 150%, respectively, in this case study.

3.7. Nuclear Power Plant

Due to the high initial cost and necessity of a large installation site of the conventional NPP, a micro modular reactor (MMR) is a promising solution for reducing the capital cost and eliminating the need for a massive installation area. MMRs have some benefits over conventional NPPs; MMR takes a shorter time to construct, design of MMR is simple and flexible, and MMR is appropriate for small-scale electricity generation systems [24].
According to the IAEA, the NPP rated under 300 MWe can be interpreted as ’small’ NPP. IAEA defines the NPP as ’medium’ if the reactors have the power rating up to 700 MWe. The ’small’ and ’medium’ NPP collectively have been called ’small and medium reactor (SMR),’ but commonly, they are termed as ’small modular reactor (SMR).’ One subclass of SMR is ’very small reactors (vSMRs)’ that are rated under 15 MWe, and are very competent for remote communities [25].
The MMR, a generation-IV reactor, is a small-scale reactor, characterized by a power rating in between 1 MWe to 20 MWe. The MMR provides a safe, emission-free, and cost-efficient energy source for both on-grid and off-grid applications. Due to its modular nature, small footprint, in-factory construction, cogeneration capability, high-level safety measures, insignificant installation area, design simplicity, scalability, and transportability, the MMR has a high impact on energy system modeling consideration. The MMR could be an outstanding solution for large-scale generating station back-up power, remote industries, and transportation electrification [26]. A feasibility assessment of the MMR for military ground application has been conducted in [27]. Based on inherent risk, strategical complication, and cost associated with using diesel generators in a forward operating base (FOB), the authors found that the MMR is better than diesel generator for longer-term operation.
The TRISO fuel, a proven technology, is used in the MMR. TRISO is a uranium fuel coated with three layers; the uranium center is covered with a carbon layer, followed by silicon carbide, followed by an outer carbon layer. This extraordinary design ensures the utmost safety of the fuel under extreme conditions. The TRISO fuel can sustain up to 1800 °C, which is 200 °C hotter than the accident condition. The MMR is a gas-cooled reactor where helium is circulated in a primary circuit, and nitrogen is used in the secondary circuit. Since helium is an inert gas, clean, free of fission product, and does not react chemically with reactor or fuel, helium provides numerous benefits to the MMR. The fuel enrichment is around 9–12% for MMR. The molten salt is used in MMR as thermal storage to supply electricity and process heat. The power density, outlet temperature, and the process heat temperature of MMR are 1.24 W/cm3, 630 °C, and 750 °C, respectively. The active system is not required to extract heat in the MMR-based plant. Moreover, off-site service, such as electric power, is also not needed for the safe operation of this type of reactor [28].
A 1 MWe MMR is considered in this research. It always supplies a constant 1 MWe to the load. Since the MMR has the CHP capability, 40% of the waste heat of the MMR can be utilized to support the thermal load of the system. There are no GHG emissions to produce electricity from MMR and there is no GHG emissions during operation. However, if fossil fuel is burnt in the construction of NPP, or if the fossil fuel is used in mining or refining uranium ore, GHG will be produced; but, this types of GHG emissions are not considered in this study. A detail specification of MMR is listed in Table 4. The MMR can operate without refueling up to 5 years [29]. However, the spent fuel transportation cost is not considered in this study.
The capital cost of an exact 1 MW*e MMR is also not available. Therefore, the capital cost of a 1 MWe MMR is calculated as 11.25 million USD by linear estimation from the capital cost of a 2 × 10 MW**t (2 units, each having a power rating of 10 MWt) [30]. The refurbishment cost of the plant is approximated as 2.3 million USD [31]. (*MWe = megawatt electric, **MWt = megawatt thermal).

3.8. Electric Grid

The studied N-R MHES is analyzed for the grid-connected mode of operation. An electric grid, with the “net metering” provision, is considered here. The purchase and the sale capacity of the grid are determined and optimized by the HOMER software. The grid capacities (purchase and sale) are optimized in such a way that the availability of electric power is always guaranteed for all cases, discussed in Section 5.1, Section 5.2, Section 5.3, Section 5.4 and Section 5.5. The optimized grid capacities confirm that if the energy resources fail to supply the electricity demand, the grid is competent in providing the required electric power to the load. The measured purchase and sale capacity of the electric grid are 0.9 MW and 1000 MW, respectively. The purchase capacity is the maximum amount of power that can be consumed from the grid at a time. The sale capacity is the maximum power that can be sold to the grid by “net metering “at any time.
The electric energy that is being supplied to the grid is typically generated by burning fossil fuel. In this study, natural gas is considered as the fuel to generate the grid electricity. As the research also focuses on the environmental consequences of the N-R MHES, the grid emission is also considered. Though natural gas is a clean form of fuel, it still releases different types of gases to the atmosphere. The amount of emission from natural gas is listed in Table 5.
Furthermore, the energy rate is not the same for all day long; it varies with time and types of load, such as industrial load, community load, residential load, and commercial load. For example, the electricity price is not equal in the morning, and at the mid of the day. Even the cost of electricity in summer and winter also differs. Similarly, the electricity charge is different for household loads and industries. By studying all these perspectives, different electricity prices are discussed in this study for different times of the day and the year. The energy rates of the electric grid are summarized in Table 6.

3.9. Energy Storage

A lithium-ion battery bank, comprising 500 battery cells (each has nominal capacity of 1 kWh), is regarded as the energy storage component in this project. Both the capital and replacement cost of a single cell are considered as 180 USD. The battery lifetime, SOCmin, SOCmin are 15 years, 100%, and 30%, respectively, for this case.

3.10. Boiler

The boiler produces thermal power by heating fluids inside the boiler vessel to serve the thermal load. Though the generators, considered in this project, have CHP capability, the boiler is kept inside the scenarios to support the thermal load for severe cases. If the extracted heat from the generators is not adequate to serve the thermal load demand, the boiler supplies the rest of the thermal power. For this study, diesel is used as fuel for the boiler, and the boiler has an efficiency of 85%. The HOMER software assumes that the boiler is an existing infrastructure, and its capital cost is not included in the total project expenses. However, the fuel price is added to the project cash-flow.

4. Design Considerations

Several features are considered in this project to estimate an accurate techno-economic evaluation of N-R MHES. Although numerous KPIs can be evaluated in N-R MHES, the three most important KPIs – NPC, COE, and GHG emissions is conducted here as well. It is obvious that the fuel price, load demand, expenses of the equipment, and the efficiency of the machine would not be the same during the entire project life (30 years). Consequently, a multi-year analysis has been performed by varying the most significant parameters that influence the selected KPIs.

4.1. Key Performance Indicators

4.1.1. Net Present Cost

The NPC or life cycle cost of supplies is the present value of all cost (e.g., installation cost, operating cost, replacement cost, fuel expense, emission penalties, purchasing cost of power from the grid), minus the present value of all the revenues; over the project lifetime [34].
The NPC can be calculated from the following equations. Since, the net present value and the net present cost differ only in sign:
Net   Present   Cos t   ( NPC ) = Net   Present   Value   ( NPV )
NPV = Cash   flow ( 1 + i ) t Initial   Investment
where i   and   t indicate discount rate (%) and number of time periods, respectively.
If it is intended to calculate the NPC for longer project lifetime with multiple cash flows, the formula can be modified as:
NPV = t = 0 n R t ( 1 + i ) t
where R t and n denote net cash inflow-outflow in unit time period and project lifetime, respectively.

4.1.2. Cost of Energy

The COE is the average cost per unit useful electrical energy, kilowatt-hour (kWh). For a CHP system, the COE is calculated as follows [35]:
COE = C ANNUAL , TOTAL C BOILER H SERVED H SERVED
where C ANNUAL ,   TOTAL , C BOILER , H SERVED , and E SERVED represent total annualized cost of the system ($/year), boiler marginal cost ($/kWh), total annualized thermal load served (kWh/year), annualized total electrical load served (kWh/year), respectively.
The unit of cash can vary from region to region. The second term of the numerator is responsible for serving the thermal load. If the system does not serve the thermal load, then   C BOILER H SERVED = 0 .

4.1.3. Greenhouse Gas Emission

The emission of pollutants mostly results from the generation of electric energy from the conventional thermal generator, production of thermal energy from the boiler, and consumption of grid electricity. The pollutants that are usually emitted from the generator, boiler, and electric grid are carbon dioxide, carbon monoxide, particulate matter, sulfur dioxide, and nitrogen oxides.
In the simulation, the emission from the generator and boiler is determined in the same way; whereas, the emission from the grid is calculated differently. The annual emission from generator or boiler is estimated as follows:
Emission   of   any   Pollutant   by   Generator / Boiler = Emission   Factor   ( g kWh ) × Total   Annual   Fuel   Consumption   ( kWh )
Since the grid is capable of purchasing and selling energy, the annual grid emission is estimated by Equation (13):
Emission   of   any   Pollutant   by   Grid           = Emission   factor   ( g kWh ) × ( Grid   Purchase   Energy Grid   Sale   Energy ) ( kWh )
To calculate the total emission throughout the project lifetime, the annual emission amount is multiplied by the project lifetime.

4.2. Multi-year Analysis

For a multi-year analysis, six factors are examined that substantially affect the N-R MHES performance. The percentage of changes of the selected factors are noted in Table 7. The value of the parameters increases or decreases gradually according to the changes indicated in Table 7. For example, the grid electricity price is raised by 9.6% in each year throughout the total project lifetime.

4.3. Control Algorithm

A modified cycle charging control strategy is implemented in this project. In cycle charging strategy, renewable generators first supply electricity to meet the load demand, and the excess energy, if any, is occupied by the battery pack to charge in between SOCmax and SOCmin. If the renewable generators are incapable of fully supplying the electricity demand, standby battery bank comes to the scenario and supports the load along with the renewable generators. If the combination of renewable generators and batteries cannot fulfill the electricity demand, a back-up diesel generator will be initiated to supply energy [41].
The modified cycle charging strategy is same as “cycle charging” strategy except for the inclusion of the MMR. The MMR provides a continuous supply of electricity and is turned-on always throughout the year, if there is no forced shutdown of MMR. However, if the energy system does not have any renewable generator and the energy system includes conventional FFTG, battery, and electric grid, the electricity demand will be served by the electric grid first, then by the battery, then by the thermal generator.
Figure 6 demonstrates the working strategy of the modified cycle charging, which is applied in this study. Initially, the renewable generators, along with MMR, will be initiated to support the load. If there is any excess energy, it will be applied to charge the battery, and the rest of the electric energy, if any, will be sold to the grid. In this circumstance, S2, S3, S4, S7, S8, S9, and S10 will be closed. If the electricity demand is increased slightly, the grid will supply the required electricity to the load. In this state, S2, S3, S4, S7, S8, S9, and S10 will also be turned off. The further rise in the demand, the battery bank will be operated; so, S2, S3, S4, S5, S7, S8, S9, and S10 will be closed. If the electricity demand is increased more, the diesel generator (if any) will be started. Therefore, S1, S2, S3, S4, S5, S6, S7, S8, S9, and S10 will be operated. It should be noted that S10 is a bi-directional switch. For off-grid application, the excess energy will be consumed by dump load. A thermal load controller, rated as 1300 kW, is used in the system to covert the excess electricity into thermal energy to support the thermal load demand.
In a particular case, when the system has no renewable generators, the diesel generator will be initiated to charge the battery, and the grid will start supplying electricity to the load simultaneously (S1, S6, S7, and S10 will be closed). If the stand-alone gird is inadequate to accomplish the electricity demand, the battery will be discharged to satisfy the electric load (S1, S5, S6, S7, and S10 will be closed). If the combination of the grid and battery fails to satisfy the electricity demand completely, the diesel generator will be turned on. The diesel generator will always make sure that the battery bank is fully charged. The above-mentioned control algorithm is outlined in Figure 7.

5. Simulations

In this section, five different types of energy systems are simulated in the HOMER software. The simulations include several components, such as electric load, thermal load, solar power, wind power, hydro power, energy storage (battery), electric grid, diesel generator, boiler, and power electronics devices — various combinations of these components model the five different energy systems. The equipment ratings are assumed to be the same for all cases.

5.1. Case-01: Conventional Small-scale Fossil Fuel -based Thermal Energy System

In this case, no renewable generator is considered; this system model consists of electric load, thermal load, electric grid, battery, and boiler. The conventional small-scale grid-connected thermal energy system is the most common electrical power generation system arrangement. This scheme is considered for the sake of comparison with N-R MHES. The equipment ratings are previously stated in Section 3. Figure 8 shows the system configuration.
Table 8 presents the total electricity and thermal energy production and consumption scenario in the grid-connected system for the first year of the project period. Since the generated electricity and thermal energy production/distribution pattern are similar for each year of the project lifetime, only the first-year generation/consumption data of the five cases have been investigated in this paper. According to the control algorithm, the electric load demand is mostly fulfilled by the electric grid purchased energy (99.99) and the genset supplies very small amount of energy (0.09%) for a short time. As the electric grid has an adequate power rating, it is capable of supplying electricity sufficiently to the load. It should be remarked that the grid is always competent in handling any size of load demand; but, if the grid exceeds its’ rated capacity, the “demand charge” is applied to the user – causing a significantly high electricity bill for the customer. HOMER always optimizes the system to the most economical one; hence, the battery bank is operated to avoid the demand charge in this case.
Since the genset is operated for a short duration, the amount of cogenerated heat is very small. Moreover, there is no other thermal power generation sources in the system except genset and boiler. Therefore, 99.98% thermal demand is accomplished by the boiler. Table 9 presents the energy production and consumption profile of the off-grid system for case-01. The Genest fully meets the electric demand. The thermal demand is accomplished mostly by the cogenerated heat of genset.

5.2. Case-02: Small-scale Stand-alone Renewable Energy Sources-based Energy System

This is a RES-based energy system with the electric grid; no thermal generator is installed in this case. The boiler is included to serve the thermal load. The RESs include wind, solar, and hydro power in this case. Figure 9 shows the stand-alone grid-connected RES-based energy system.
Since the electricity production by RESs is insignificant compared to the electricity demand and the availability of RESs is irregular, a substantial amount of electricity (45.90%) is purchased from the grid, addressed in Table 10. The rest of the electricity demand is fulfilled by the combination of wind (31.10%), hydro (14.90%), and solar (8.10%). The primary electric load is the summation of Electric Load #1 and Electric Load #2.
The thermal demand is totally met by boiler since boiler is the only thermal power generator in this system architecture. The thermal load is also the summation of Thermal Load #1 and Thermal load #2. In case-02, the system equipment cannot fulfill the electric and thermal load demand without electric grid. Even the battery bank is not capable of fulfilling the electricity demand in case-02 (off-grid mode). Hence, there is no feasible energy distribution scenario for case-02 (off-grid mode).

5.3. Case-03: Conventional Small-scale Fossil Fuel-based Thermal and Renewable Energy Sources-based Hybrid Energy System

Figure 10 outlines a typical fossil fuel-based thermal-renewable micro hybrid energy system, which is a combination of case-01 and case-02. The power rating and costs are the same as the previous specification for all components.
Table 11 presents the amount of the electric and thermal energy production and consumption within the system. The contribution of electricity production by the sources is same as case-02. Though the diesel Genset is available in the system, HOMER optimizes the system for the lowest cost and prefers the electric grid over the Diesel genset to serve the electricity demand. Therefore, the electric demand is fulfilled without operating the genset. Moreover, the RESs are non-dispatchable and generates excess energy—higher than the need—for a definite period depending on the availability of RESs; this small amount of surplus electricity (6.19%) is sold to the grid, indicated in Table 11. As the genset is not operated at all, no cogenerated heat is available for this system. Hence, the thermal demand is fully supplied by the boiler.
In the off-grid mode, 46.47% and 75.70% of the total electric and thermal demand, respectively, are satisfied by the genset and cogenerated heat of the genset. Around 15.3% of the thermal demand is met by the surplus electric power, which is generated by wind, hydro, and solar. The thermal load controller, depicted in Figure 10b, converts the excess electric power into thermal power if needed by the thermal load. For this case, energy production and consumption scenario of off-grid mode for the first year of project have shown in the Table 12.

5.4. Case-04: Small-scale Stand-alone Nuclear Energy System

Figure 11 illustrates a stand-alone grid-connected small-scale nuclear power system. The system configuration is similar to case-01, except the Diesel genset is replaced by an MMR with the same power and CHP rating.
The MMR always provides a continuous supply of electricity at its’ rated capacity, and a single unit of MMR is capable of supplying full electricity demand (100%) in the case-04, indicated in Table 13. Table 13 also shows that a considerable amount of surplus energy (47.90%) is being sold to the grid; this ultimately causes profit for the system. Moreover, since the MMR has the 40% CHP rating and the MMR runs continuously throughout the year, the cogenerated heat from MMR is fully sufficient to serve the thermal load demand of the system, depicted in Table 11. The boiler is not contributing in this case to serve the thermal load.
As shown in Table 14, in off-grid mode, the total electric demand is fulfilled by the MMR. The thermal demand is partially (53.9%) met by the cogenerated heat of MMR, and the excess electricity accomplishes the rest (46.1%) of the demand.

5.5. Case-05: Nuclear-Renewable Micro Hybrid Energy System

This case represents an N-R MHES, similar to case-03, except the diesel generator is interchanged by an MMR. Figure 12 shows the schematic of an N-R MHES.
In N-R MHES, three-quarters (76.8%) of the total electricity demand is served by the MMR, and the rest of the electricity demand is achieved by the RESs, mentioned in Table 15. Since electricity production also is massive in this case, a substantial amount of excess energy (59.86%) is sold to the grid. Likewise, the case-04, the whole thermal demand is met by the cogenerated heat from MMR in this case; the boiler is kept in idle mode.
In off-grid mode, 76.8% electric load is served by the MMR which has been shown in Table 16. A significant amount of excess electric energy (58.2% of total thermal demand) generated by the combination of MMR and RESs is used to serve the thermal by the help of thermal load controller.

6. Results

The study has investigated three important KPIs of N-R MHES. To evaluate the KPIs, the N-R MHES is compared with four other different energy systems (from case-01 to case-04). The computed NPC, for both grid-connected and off-grid mode, of the five cases are recorded in Table 17. The HOMER Pro software optimizes the system based on the NPC of the system.
For the grid-connected mode, case-01 has the highest NPC and COE, whereas case-04 and case-05 has the lowest NPC and COE, respectively. In case-01 (grid-connected mode), 99.99% electricity of the total electric demand is purchased from the grid. Furthermore, a massive amount of Diesel fuel (161,438 L/year) is utilized in the boiler to serve the thermal load that raises the total system cost. Consequently, the NPC and COE are quite high for this case. Case-04 (grid-connected mode) has the lowest NPC due to lower capital cost and operating cost. In case-05 (grid-connected mode), a large number of surplus electric energy is being generated by the combination of MMR and RES, and the system makes a significant amount of revenue by selling the excess energy to the grid. Besides, the cogenerated heat from MMR is adequate to serve the thermal demand fully; thus, no additional fuel is required to serve the thermal load. Therefore, COE is the lowest for this case. The NPC of case-05 (grid-connected mode) is slightly higher than case-04 (grid-connected mode) due higher initial cost of different RES equipment, such as wind turbine, hydro turbine, and PV panel.
In the off-grid mode of operation, case-01 exhibits the highest NPC and COE. On the other hand, case-04 (off-grid mode) has the lowest NPC and COE. It should be remarked that case-02 does not provide any feasible solution, implying that the system cannot support the electric demand studied in this paper. In case-01 (off-grid mode), the genset supplies the total electric load by burning fuel, which increases the system cost significantly. However, boiler fuel cost is less in this case since the boiler provides only 2.57% of thermal demand. In case-04, the NPC is lowest because the system consists of only MMR; no RESs are involved here. The absence of RESs reduces the system cost significantly as there is no high initial cost.
Furthermore, the substantial excess electric energy is utilized by the thermal load controller to serve the thermal load. Since the boiler is not operated, and there is no additional fuel cost to fulfill the thermal demand, the NPC and COE of the overall system are reduced in case-04 (off-grid mode). Nevertheless, it should be mentioned that a vast amount of excess electric energy (6,210,660 kWh/year) and thermal energy (9,765,760 kWh/year) is generated in case-05 (off-grid mode) compared to the case-04 (off-grid mode). The excess electric and thermal energy produced in case-04 (off-grid mode) are estimated as 4,193,123 kWh/year and 7,748,223 kWh/year, respectively. Due to the absence of electric grid in case-05 (off-grid mode), the excess electric energy is not being sold to the grid; hence, both NPC and COE are higher in case-05 (off-grid mode) than case-04 (off-grid mode).
Table 18 presents the amount of GHG emissions in various cases. In this project, five types of GHGs are studied: carbon dioxide, carbon monoxide, sulfur dioxide, nitrogen oxide, and particulate matter. The particulate matter includes smoke, soot, and liquid droplets. For grid-connected mode, in case-01, all types of GHG emissions are highest because 99.99% of the electric demand is supplied by the electric grid in case-01 and the burning of natural gas produces the grid electricity. As there is no burning of fossil fuel in case-04 (both grid-connected and off-grid mode) and case-05 (both grid-connected and off-grid mode), and the MMR fulfills the demand (both electric and thermal) implicitly, GHG emissions are zero for these cases. It should be mentioned that the amount of GHG emissions is only accounted for the electricity production process in this study; the carbon footprint for construction of the site and equipment manufacturing (i.e., PV panel) are not reflected here. Surprisingly, the GHG emissions are significant in case-02 (grid-connected mode) and case-03 (grid-connected mode). Generally, the GHG emission should be minimal in both cases because these are RES-based grid-connected hybrid energy system, and only the fossil fuel is burnt to support the thermal demand. However, since the amount of purchased electricity from the grid is extensive in these cases and the grid electricity is being generated by burning natural gas, case-02 (grid-connected mode) and case-03 (grid-connected mode) cause a significant amount of GHG emissions.
For off-grid mode, case-01 also produces the maximum emissions due to the burning of diesel in the Genset and the boiler. Case-04 and case-05 show zero-emission since the full demand (both electrical and thermal) is satisfied by the combination of MMR, RESs, and cogenerated heat from MMR.
However, the discussion mentioned above cannot draw a single conclusion explicitly since this techno-economic study depends on several variables. Therefore, a sensitivity analysis is also carried out to identify the impact of three critical parameters- discount rate, inflation rate, and project lifetime – on the system performance. Three different values are taken for each parameter, and the system is evaluated based on these values, presented in Table 19. From Table 19, the stand-alone off-grid RES-based system (case-02) is not feasible despite the higher or lower discount rate, inflation rate, and project lifetime in this study. Case-01 (off-grid mode) and case-04 (off-grid mode) cannot also manage the selected electric and thermal load demand, studied here, for longer project lifetime (60 and 100 years), depicted in Table 19. Moreover, case-03 (off-grid mode) is not capable of fulfilling the studied electric and thermal load for a long project lifetime (100 years). All the system infeasibility happens due to capacity shortage. Since the electric and thermal demand is increasing at a certain percentage each year without increasing the capacities of the resources, the current resources cannot serve the demand fully. The higher inflation rate has a notable impact also in the infeasible system. However, the N-R MHES (case-05, both grid-connected and off-grid mode) shows that it can support the demand always with considerably lower NPC, regardless of the higher or lower discount rate, inflation rate, and project lifetime. Higher inflation rate increases the NPC of case-01, case-02, and case-03 significantly.
For the lower discount rate (3% and 8%) and short project lifetime (30 years), case-04 (off-grid mode) could have better performance than case-05 (off-grid mode) in terms of NPC, for instance, scenario No. 1,4,7,10,13, and 16 in Table 19. Sometimes, the NPC could also be lesser in case-04 (off-grid mode) in the high discount rate (10%) and small project lifetime (30 years), such as scenario No. 19,22, and 25.
For the lower value of project lifetime (30 and 60 years) or smaller value of inflation rate (2% and 4%), case-04 (grid-connected) may also show a slightly lower amount, compared to case-05 (grid-connected), of NPC for a few cases (e.g., scenario No. 10 and 19). However, for the higher value of project lifetime (60 and 100 years), case-05 always provides the most economical NPC.

7. Discussion

Large-scale N-R HES is not a new concept. Research and innovation for the expansion of N-R HES are taking place in several countries. Nevertheless, due to significant risk and high capital cost of large-scale NPP, small-scale NPP integration with RESs has been proposed and evaluated in this paper. Although the N-R MHES depends on the availability of the local RESs, the N-R MHES always provides a baseload supply to strengthen the resiliency and stability of the hybrid energy system. This paper is intended to provide a clear idea of the technical and economic aspects of small-scale N-R HES. The key findings of this study can be summarized as follows.
From the sensitivity analysis, it can be concluded that the N-R MHES could be a resilient energy supply source for sustainable energy solutions in the future. The N-R MHES shows a significant benefit for the long-term planning of a reliable energy system. Furthermore, the MMR can be a suitable replacement for a Diesel genset in terms of NPC, COE, and emissions. From case-02 (off-grid mode), it is observed that the off-grid RES-based energy system is rarely capable or not capable of handling large/medium-scale electricity demand adequately. However, the off-grid RES-based energy system can be an impactful solution for small-scale electric/thermal demand. The case-02 (grid-connected mode) shows that the grid-energy is not always a clear form of an electric power source if the grid-energy comes from the burning of fossil fuel, although the grid-energy is deemed to be clean. Grid-connected N-R MHES could be the most cost-effective solution in terms of COE to provide medium/large-scale electric power supply, depicted in case-05 (grid-connected mode). Moreover, as an extensive amount of excess electric and thermal energy is available in case-05 (off-grid mode), off-grid N-R MHES could be a suitable option for medium/large-scale remote industrial applications, such as desalination plants, mining stations, and EV charging platforms. Also, N-R MHES can provide the best solution for decarbonization pathways project since there are no emissions in case-05.
Few other parameters, e.g., availability of RES, extreme conditions of RES, and abrupt change in electric and thermal load demand, also may influence the whole system performance and system stability. But these kinds of severe conditions are not regarded in this study. Furthermore, the carbon tax incorporation with the NPC and COE is beyond this study. If the carbon tax is included in the study, the NPC and COE of the case-01, case-02, and case-03 would be increased further. In addition, grid stability consideration is beyond of the scope of this study.

Author Contributions

Conceptualization, H.A.G., M.R.A. and M.I.A.; methodology, M.R.A. and M.I.A.; software, M.R.A.; validation, H.A.G., M.R.A. and M.I.A.; formal analysis, M.R.A.; investigation, M.R.A.; resources, M.R.A.; data curation, M.R.A.; writing—original draft preparation, M.R.A. and M.I.A.; writing—review and editing, M.R.A. and M.I.A; visualization, H.A.G., M.R.A. and M.I.A.; supervision, H.A.G.; project administration, H.A.G.; funding acquisition, H.A.G. All authors have read and agreed to the published version of the manuscript.

Funding

This research was funded by Natural Sciences and Engineering Research Council of Canada, grant number 210320.

Conflicts of Interest

The authors declare no conflict of interest.

Nomenclature

CCSCarbon Capture and Storage
CHPCombined Heat and Power
COECost of Energy
ESSEnergy Storage System
FFTGFossil Fuel-based Thermal Generator
GHGGreenhouse Gas
HESHybrid Energy System
HOMERHybrid Optimization Model for Electric Renewable
IAEAInternational Atomic Energy Agency
IRRInternal Rate of Return
KPIKey Performance Indicator
LCOELevelized Cost of Energy
SDGSustainable Development Goal
STCStandard Test Condition
MMMobile Microgrid
MMRMicro Modular Reactor
NASANational Aeronautics and Space Administration
NPCNet Present Cost
NPPNuclear Power Plant
NPVNet Present Value
N-R HESNuclear-Renewable Hybrid Energy System
N-R MHESNuclear-Renewable Micro Hybrid Energy System
PVPhotovoltaic
RESRenewable Energy Source
SMRSmall Modular Reactor
SOCmaxState of Charge (maximum)
SOCminState of charge (minimum)
TCITotal Capital Investment
vSMRVery small reactors

References

  1. Goal 7: Affordable & Clean Energy—UN SDG. Available online: https://www.gvicanada.ca/goal-7-affordable-and-clean-energy/ (accessed on 10 December 2019).
  2. Usman, M.; Khan, M.T.; Rana, A.S.; Ali, S. Techno-economic analysis of hybrid solar-diesel-grid connected power generation system. J. Electr. Syst. Inf. Technol. 2018, 5, 653–662. [Google Scholar] [CrossRef]
  3. Freris, L.; Infield, D. Renewable Energy in Power Systems; John Wiley & Sons, Ltd.: Hoboken, NJ, USA, 2008. [Google Scholar]
  4. Conserve Energy Future What Is Sustainable Energy and Its Types. Available online: https://www.conserve-energy-future.com/sustainableenergy.php (accessed on 9 December 2019).
  5. Bragg-Sitton, S.M.; Boardman, R.; Rabiti, C.; Suk Kim, J.; McKellar, M.; Sabharwall, P.; Chen, J.; Cetiner, M.S.; Harrison, T.J.; Qualls, A.L. Nuclear-Renewable Hybrid Energy Systems: 2016 Technology Development Program Plan; Oak Ridge National Lab.: Oak Ridge, TN, USA, 2016; p. 1333006.
  6. Ruth, M.F.; Zinaman, O.R.; Antkowiak, M.; Boardman, R.D.; Cherry, R.S.; Bazilian, M.D. Nuclear-renewable hybrid energy systems: Opportunities, interconnections, and needs. Energy Convers. Manag. 2014, 78, 684–694. [Google Scholar] [CrossRef]
  7. IAEA TECDOC No: 1885. Nuclear-renewable hybrid energy systems for decarbonized energy production and cogeneration. In Proceedings of the Technical Meeting, Vienna, Austria, 22–25 October 2018; Technical Meeting on Nuclear-Renewable Hybdrid Energy Systems for Decarbonized Energy Production and Cogeneration, International Atomic Energy Agency. IAEA: Vienna, Austria, 2019. ISBN 978-92-0-161419-3. [Google Scholar]
  8. Boldon, L.; Sabharwall, P.; Bragg-Sitton, S.; Abreu, N.; Liu, L. Nuclear Renewable Energy Integration: An Economic Case Study. Int. J. Energy Environ. Econ 2015, 28, 85–95. [Google Scholar]
  9. Suman, S. Hybrid nuclear-renewable energy systems: A review. J. Clean. Prod. 2018, 181, 166–177. [Google Scholar] [CrossRef]
  10. Ruth, M.; Cutler, D.; Flores-Espino, F.; Stark, G.; Jenkin, T. The Economic Potential of Three Nuclear-Renewable Hybrid Energy Systems Providing Thermal Energy to Industry; National Renewable Energy Lab.: Golden, CO, USA, 2016; p. 1335586.
  11. Giatrakos, G.P.; Tsoutsos, T.D.; Mouchtaropoulos, P.G.; Naxakis, G.D.; Stavrakakis, G. Sustainable energy planning based on a stand-alone hybrid renewableenergy/hydrogen power system: Application in Karpathos island, Greece. Renew. Energy 2009, 34, 2562–2570. [Google Scholar] [CrossRef]
  12. U-Battery What Is U-Battery? Available online: https://www.u-battery.com/what-is-u-battery (accessed on 9 December 2019).
  13. Westinghouse Nuclear. New Plants: eVinciTM Micro Reactor. Available online: http://www.westinghousenuclear.com/new-plants/evinci-micro-reactor (accessed on 9 December 2019).
  14. Gabbar, H.A.; Abdussami, M.R. Feasibility Analysis of Grid-Connected Nuclear-Renewable Micro Hybrid Energy System. In Proceedings of the 2019 IEEE 7th International Conference on Smart Energy Grid Engineering (SEGE), Oshawa, ON, Canada, 12–14 August 2019; pp. 294–298. [Google Scholar]
  15. Mishra, M.; Saxena, N.K.; Mishra, P. ANN Based AGC for Hybrid Nuclear-Wind Power System. In Proceedings of the 2016 International Conference on Micro-Electronics and Telecommunication Engineering (ICMETE), Ghaziabad, India, 22–23 September 2016; pp. 410–415. [Google Scholar]
  16. Elma, O.; Gabbar, H.A. Design and Analysis of Mobile Hybrid Energy System for Off-Grid Applications. In Proceedings of the 2019 International Conference on Power Generation Systems and Renewable Energy Technologies (PGSRET), Istanbul, Turkey, 26–27 August 2019; pp. 1–6. [Google Scholar]
  17. Abdussami, M.R.; Gabbar, H.A. Flywheel-based Micro Energy Grid for Reliable Emergency Back-up Power for Nuclear Power Plant. In Proceedings of the 2019 International Conference on Smart Energy Systems and Technologies (SEST), Porto, Portugal, 9–11 September 2019; pp. 1–6. [Google Scholar]
  18. Finding Data to Run HOMER. Available online: https://www.homerenergy.com/products/pro/docs/latest/finding_data_to_run_homer.html (accessed on 26 December 2019).
  19. Real Discount Rate. Available online: https://www.homerenergy.com/products/pro/docs/latest/real_discount_rate.html (accessed on 5 January 2020).
  20. GlobalPetrolPrices.com Canada Diesel Prices. 18 November 2019. Available online: https://www.globalpetrolprices.com/Canada/diesel_prices/ (accessed on 25 November 2019).
  21. How HOMER Calculates the PV Array Power Output. Available online: https://www.homerenergy.com/products/pro/docs/latest/how_homer_calculates_the_pv_array_power_output.html (accessed on 25 November 2019).
  22. How HOMER Calculates Wind Turbine Power Output. Available online: https://www.homerenergy.com/products/pro/docs/latest/how_homer_calculates_wind_turbine_power_output.html (accessed on 25 November 2019).
  23. How HOMER Calculates the Hydro Power Output. Available online: https://www.homerenergy.com/products/pro/docs/latest/how_homer_calculates_the_hydro_power_output.html (accessed on 25 November 2019).
  24. Morales Pedraza, J. Small Modular Reactors for Electricity Generation; Springer: Cham, Switzerland, 2017; ISBN 978-3-319-52215-9. [Google Scholar]
  25. World Nuclear Association. Small Nuclear Power Reactors. Available online: https://www.world-nuclear.org/information-library/nuclear-fuel-cycle/nuclear-power-reactors/small-nuclear-power-reactors.aspx (accessed on 8 December 2019).
  26. U-Battery. Available online: https://www.u-battery.com/ (accessed on 31 December 2019).
  27. Allen, K.S.; Hartford, S.K.; Merkel, G.J. Feasibility Study of a Micro Modular Reactor for Military Ground Applications. J. Def. Manag. 2018, 8. [Google Scholar] [CrossRef]
  28. USNC. Available online: https://usnc.com/ (accessed on 9 December 2019).
  29. T. Abram et al., “Design of a U-Battery®,” p. 23, Nov. 2011. Available online: https://www.u-battery.com/media (accessed on 31 March 2020).
  30. Abram, T.; Marsden, B.; Wickham, T.; Ding, M.; Kloosterman, J.L.; Kooijman, T.; Linssen, R. Design of a U-Battery®. Delft Tech. Univ. 2011, 23. [Google Scholar]
  31. Nuclear Power Economics|Nuclear Energy Costs—World Nuclear Association. Available online: https://www.world-nuclear.org/information-library/economic-aspects/economics-of-nuclear-power.aspx (accessed on 20 March 2020).
  32. Natural Gas 1998, Issues and Trends. Available online: https://www.eia.gov/naturalgas/archive/056098.pdf (accessed on 27 December 2019).
  33. Ontario Time-of-Use Electricity Rates. Available online: http://www.ontario-hydro.com/current-rates (accessed on 27 December 2019).
  34. Arnaboldi, M.; Azzone, G.; Giorgino, M. Long-and Short-Term Decision Making. In Performance Measurement and Management for Engineers; Elsevier: Amsterdam, The Netherlands, 2015; pp. 107–115. ISBN 978-0-12-801902-3. [Google Scholar]
  35. Levelized Cost of Energy. Available online: https://www.homerenergy.com/products/pro/docs/latest/levelized_cost_of_energy.html (accessed on 27 December 2019).
  36. Jackson, T.; Stedman, A.; Aliakbari, E.P.; Green, K. Evaluating Electricity Price Growth in Ontario; FRASER Institute: Vancouver, BC, Canada, 2017. [Google Scholar]
  37. Commercial Solar Panel Degradation: What You Should Know and Keep in Mind. Available online: https://businessfeed.sunpower.com/articles/what-to-know-about-commercial-solar-panel-degradation (accessed on 25 November 2019).
  38. U.S Department of Energy; 2018 Uranium Marketing Annual Report; U.S. Energy Information Administration: Washington, DC, USA, 2018; Volume 70.
  39. Erwin, S. New marine fuel rules to boost diesel prices for at least a year: Analysts. Reuters 2019. Available online: https://www.reuters.com/article/us-imo-shipping-usa-refiners/new-marine-fuel-rules-to-boost-diesel-prices-for-at-least-a-year-analysts-idUSKCN1TB2CJ (accessed on 31 March 2020).
  40. Canada’s Energy Future 2018, An Energy Market Assessment. National Energy Board. Available online: https://www.cer-rec.gc.ca/nrg/ntgrtd/ftr/2018/2018nrgftr-eng.pdf (accessed on 31 March 2020).
  41. Upadhyay, S.; Sharma, M.P. Development of hybrid energy system with cycle charging strategy using particle swarm optimization for a remote area in India. Renew. Energy 2015, 77, 586–598. [Google Scholar] [CrossRef]
Figure 1. Total electrical load profile (first year of project lifetime).
Energies 13 01642 g001
Figure 2. Total thermal load profile (first year of project lifetime).
Energies 13 01642 g002
Figure 3. Solar irradiance.
Energies 13 01642 g003
Figure 4. Wind speed.
Energies 13 01642 g004
Figure 5. Mass flow rate.
Energies 13 01642 g005
Figure 6. Working strategy of the control algorithm.
Energies 13 01642 g006
Figure 7. Control algorithm.
Energies 13 01642 g007
Figure 8. (a) Conventional small-scale grid-connected fossil fuel-based thermal energy system; (b) Conventional small-scale Off-grid fossil fuel-based thermal energy system.
Energies 13 01642 g008
Figure 9. (a) Small scale stand-alone grid-connected renewable energy sources-based energy system; (b) Small scale stand-alone Off-grid renewable energy sources-based energy system.
Energies 13 01642 g009
Figure 10. (a) Conventional small-scale fossil fuel-based grid-connected thermal and renewable energy sources-based hybrid energy system; (b) Conventional small-scale fossil fuel-based off-grid thermal and renewable energy sources-based hybrid energy system.
Energies 13 01642 g010
Figure 11. (a) Small-scale grid-connected stand-alone nuclear energy system; (b) Small-scale off-grid stand-alone nuclear energy system.
Energies 13 01642 g011
Figure 12. (a) Grid-connected nuclear-renewable micro hybrid energy system; (b) Off-grid nuclear-renewable micro hybrid energy system.
Energies 13 01642 g012
Table 1. Specifications of the primary electric load.
ParameterValue
Electric Load #1Electric Load #2
Average Energy Demand (kWh/day)12,000500
Average Power Demand (kW)50020.83
Peak Power Demand (kW)857.1761.83
Load Factor (%)5834
Table 2. Specifications of the thermal load.
ParameterValue
Thermal Load #1Thermal Load #2
Average Thermal Energy Demand (kWh/day)3500200
Average Thermal Power Demand (kW)143.838.33
Peak Thermal Power Demand (kW)502.5524.73
Load Factor (%)2934
Table 3. Specifications of some system equipment.
ParametersSystem Equipment
Solar PVWind TurbineHydro GeneratorDiesel Genset
Nominal Capacity (kW)133098.11000
Capital Cost (USD)64040,000459,845300,000
Replacement Cost (USD)64030,000229,923200,000
Lifetime (Years)3020252.5
Operation and Maintenance Cost (USD/year)010013,79587,600
Table 4. Specifications of the MMR.
ParameterValue
Fuel TypeUranium
Nominal Capacity (kW)1000
Capital Cost (USD)11,250,000
Refurbishment Cost (USD)2,300,000
Operation and Maintenance Cost (USD/lifetime)1,510,000 [30]
Lifetime (Years)60 [29]
Efficiency (%)40 [30]
Heat Recovery Ratio (%)40
Fuel Price (USD/kg)1390 [31]
Table 5. Grid emissions [32].
PollutantEmission Factor (g/kWh)
Carbon Dioxide (g/kWh)181.1
Carbon Monoxide (g/kWh)0.062
Particulate Matter (g/kWh)0.0108
Sulfur Dioxide (g/kWh)0.00155
Nitrogen Oxides (g/kWh)0.1424
Table 6. Energy rates of the electric grid [33].
ScheduleTypes of Energy RateElectricity Price
(USD/kWh)
Sellback Price
(USD/kWh)
September-AprilWeekdayOff-peak (19.00–07.00)0.0650.025
Mid-peak (11.00–17.00)0.094
On-peak (07.00–11.00 & 17.00–19.00)0.134
WeekendOff-peak
(full day)
0.0650.025
May-AugustWeekdayOff-peak (19.00–07.00)0.0650.025
Mid-peak (07.00–11.00 & 17.00–19.00)0.094
On-peak (11.00–17.00)0.134
WeekendOff-peak
(full day)
0.0650.025
Table 7. Parameters of the multi-year analysis.
CriteriaValue (Change in %/year)
Grid Electricity Price Increment 9.6 [36]
PV Degradation1 [37]
Fuel Price Increment (Uranium)0.0257 [38]
Fuel Price Increment (Diesel)10 [39]
Electricity Demand Increment 0.3 [40]
Thermal Demand Increment 0.1 [40]
Table 8. Energy production and consumption scenario of grid-connected mode for the first year of project life (case-01).
Electricity ProductionAmount (%)Electricity ConsumptionAmount (%)Thermal Energy ProductionAmount (%)Thermal Energy ConsumptionAmount (%)
Grid Purchase99.99Primary Load99.91Boiler99.98Thermal load 100
Genset0.01Deferrable Load0.09Genset0.02
Total100Total100Total100Total100
Table 9. Energy production and consumption scenario of off-grid mode for the first year of project life (case-01).
Electricity ProductionAmount (%)Electricity ConsumptionAmount (%)Thermal Energy ProductionAmount (%)Thermal Energy ConsumptionAmount (%)
Genset100Primary Load99.91Genset97.42Thermal load 100
Deferrable Load0.09Boiler2.57
Excess Electricity0.01
Total100Total100Total100Total100
Table 10. Energy production and consumption scenario of grid-connected mode for the first year of project life (case-02).
Electricity ProductionAmount (%)Electricity ConsumptionAmount (%)Thermal Energy ProductionAmount (%)Thermal Energy ConsumptionAmount (%)
Grid Purchase39.30Primary Load94.70Boiler100Thermal Load100
Wind27.60Grid Sales5.19
Hydro22.60Deferrable Load0.11
Solar10.50
Total100Total100Total100Total100
Table 11. Energy production and consumption scenario of grid-connected mode for the first year of project life (case-03).
Electricity ProductionAmount (%)Electricity ConsumptionAmount (%)Thermal Energy ProductionAmount (%)Thermal Energy ConsumptionAmount (%)
Grid Purchase39.30Primary Load94.70Boiler100Thermal Load100
Wind27.60Grid Sales5.19
Hydro22.60Deferrable Load0.11
Solar10.50
Total100Total100Total100Total100
Table 12. Energy production and consumption scenario of off-grid mode for the first year of project life (case-03).
Electricity ProductionAmount (%)Electricity ConsumptionAmount (%)Thermal Energy ProductionAmount (%)Thermal Energy ConsumptionAmount (%)
Genset56.86Primary Load99.90Genset87.46Thermal Load 100
Wind14.3Excess Electricity2.77
Hydro23.4Deferrable Load0.10
Solar5.44Boiler9.77
Total100Total100Total100Total100
Table 13. Energy production and consumption scenario of grid-connected mode for the first year of project life (case-04).
Electricity ProductionAmount (%)Electricity ConsumptionAmount (%)Thermal Energy ProductionAmount (%)Thermal Energy ConsumptionAmount (%)
MMR100Primary Load52.05MMR100Thermal Load100
Grid Sales47.90
Deferrable Load0.05
Total100Total100Total100Total100
Table 14. Energy production and consumption scenario of off-grid mode for the first year of project life (case-04).
Electricity ProductionAmount (%)Electricity ConsumptionAmount (%)Thermal Energy ProductionAmount (%)Thermal Energy ConsumptionAmount (%)
MMR100Primary Load99.10MMR53.9Thermal Load100
Deferrable Load0.01Excess Electricity46.1
Total100Total100Total100Total100
Table 15. Energy production and consumption scenario of grid-connected mode for the first year of project life (case-05).
Electricity ProductionAmount (%)Electricity ConsumptionAmount (%)Thermal Energy ProductionAmount (%)Thermal Energy ConsumptionAmount (%)
MMR74.90Primary Load39.10MMR100Thermal Load100
Wind11.40Grid Sales60.86
Hydro9.37Deferrable Load0.04
Solar4.33
Total100Total100Total100Total100
Table 16. Energy production and consumption scenario of off-grid mode for the first year of project life (case-05).
Electricity ProductionAmount (%)Electricity ConsumptionAmount (%)Thermal Energy ProductionAmount (%)Thermal Energy ConsumptionAmount (%)
MMR81.25Primary Load99.90Excess Electricity55.9Thermal Load100
Wind6.19
Hydro10.2Deferrable Load0.10MMR44.1
Solar2.36
Total100Total100Total100Total100
Table 17. Case-wise comparison of NPC and COE.
ScenarioSystem StatusNPC (USD)COE (USD/kWh)
Case-01Grid-connected31,583,9600.3781
Off-grid57,040,9100.7656
Case-02Grid-connected19,877,2100.1907
Off-gridNFS *NFS *
Case-03Grid-connected20,142,2900.1946
Off-grid37,807,9600.4728
Case-04Grid-connected10,960,5800.0345
Off-grid12,371,0000.0856
Case-05Grid-connected10,987,9800.0262
Off-grid13,221,3800.0985
* NFS = Non-feasible Solution.
Table 18. Case-wise comparison of GHG emission.
PollutantSystem StatusCase-01Case-02Case-03Case-04Case-05
Carbon Dioxide (kg/year)Grid-connected1,254,395771,827771,82700
Off-grid3,261,052NFS1,700,90800
Carbon Monoxide(kg/year)Grid-connected28411811800
Off-grid16,742NFS846800
Sulfur Dioxide (kg/year)Grid-connected10671062106200
Off-grid7972NFS416000
Nitrogen Oxide (kg/year)Grid-connected65127127100
Off-grid3209NFS162300
Particulate Matter (kg/year)Grid-connected49.320.620.600
Off-grid143NFS72.400
Table 19. Sensitivity analysis.
No.Discount RateInflation RateProject LifetimeSystem StatusNPC
Case-01Case-02Case-03Case-04Case-05
13230Grid-connected79.4 M *48.8 M49.0 M9.75 M9.13 M
Off-grid144 MNFS94.5 M12.3 M13.4 M
23260Grid-connected1.11 B **687 M687 M12.4 M9.07 M
Off-gridNFS ***NFS1.42 BNFS16.3 M
332100Grid-connected36.1 BNFS22.2 B729 M23.0 M
Off-gridNFSNFSNFSNFS19.2 M
43430Grid-connected121 M73.8 M73.8 M8.61 M7.49 M
Off-grid220 MNFS144 M12.1 M13.3 M
53460Grid-connected2.94 B1.82 B1.82 B15.2 M6.27 M
Off-gridNFSNFS3.77 BNFS19.3 M
634100Grid-connected208 BNFS128 B4.37 B96.7 M
Off-gridNFSNFSNFSNFS29.7 M
73530Grid-connected149 M91.2 M91.1 M7.79 M6.32 M
Off-grid273 MNFS178 M11.9 M13.1 M
83560Grid-connected4.81 B2.99 B2.99 B18.4 M3.70 M
Off-gridNFSNFS6.19 BNFS21.8 M
935100Grid-connected499 BNFS306 B10.7 B233 M
Off-gridNFSNFSNFSNFS41.2 M
108230Grid-connected31.7 M19.9 M20.1 M11.0 M11.0 M
Off-grid57.0 MNFS37.8 M12.4 M13.2 M
118260Grid-connected128 M79.6 M79.9 M11.3 M11.2 M
Off-gridNFSNFS161 MNFS13.8 M
1282100Grid-connected666 MNFS411 M21.0 M11.4 M
Off-gridNFSNFSNFSNFS13.9 M
138430Grid-connected45.3 M28.1 M28.4 M10.6 M10.5 M
Off-grid81.9 MNFS54.0 M12.4 M13.3 M
148460Grid-connected296 M183 M183 M11.4 M10.7 M
Off-gridNFSNFS374 MNFS14.4 M
1584100Grid-connected3.19 B NFS1.96 B66.7 M11.7 M
Off-gridNFSNFSNFSNFS14.9 M
168530Grid-connected54.5 M33.7 M33.9 M10.4 M10.1 M
Off-grid98.9 MNFS65.0 M12.4 M13.4 M
178560Grid-connected459 M284 M284 M11.6 M10.3 M
Off-gridNFSNFS582 MNFS14.8 M
1885100Grid-connected7.19 BNFS4.43 B143 M12.8 M
Off-gridNFSNFSNFSNFS15.7 M
1910230Grid-connected23.2 M14.8 M15.0 M11.2 M11.3 M
Off-grid41.6 MNFS27.8 M12.3 M13.1 M
2010260Grid-connected63.5 M39.6 M39.9 M11.3 M11.4 M
Off-gridNFSNFS78.8 MNFS13.4 M
21102100Grid-connected178 MNFS110 M13.3 M11.5 M
Off-gridNFSNFSNFSNFS13.5 M
2210430Grid-connected32.3 M20.2 M20.5 M10.9 M11.0 M
Off-grid58.1 MNFS38.5 M12.4 M13.2 M
2310460Grid-connected134 M83.2 M83.5 M11.3 M11.1 M
Off-gridNFSNFS168 MNFS13.8 M
24104100Grid-connected724 MNFS446 M22.0 M11.4 M
Off-gridNFSNFSNFSNFS13.9 M
2510530Grid-connected38.4 M23.9 M24.2 M10.8 M10.7 M
Off-grid69.3 MNFS45.8 M12.4 M13.3 M
2610560Grid-connected201 M124 M125 M11.3 M10.9 M
Off-gridNFSNFS253 MNFS14.1 M
27105100Grid-connected1.55 BNFS953 M36.4 M11.4 M
Off-gridNFSNFSNFSNFS14.3 M
* M = million, ** B = billion, *** NFS = No Feasible Solution.

