Application of Multivariate Statistical Methods and Artificial Neural Network for Facies Analysis from Well Logs Data: an Example of Miocene Deposits
Abstract
1. Introduction
- Prepare data in pre-processing;
- Statistical data analysis (PCA, CA, DA);
- Design, train and test classifiers (ANN);
- Facies prediction;
- Analyse and compare results.
- 1)
- In the first step, analysis was performed for each well separately;
- 2)
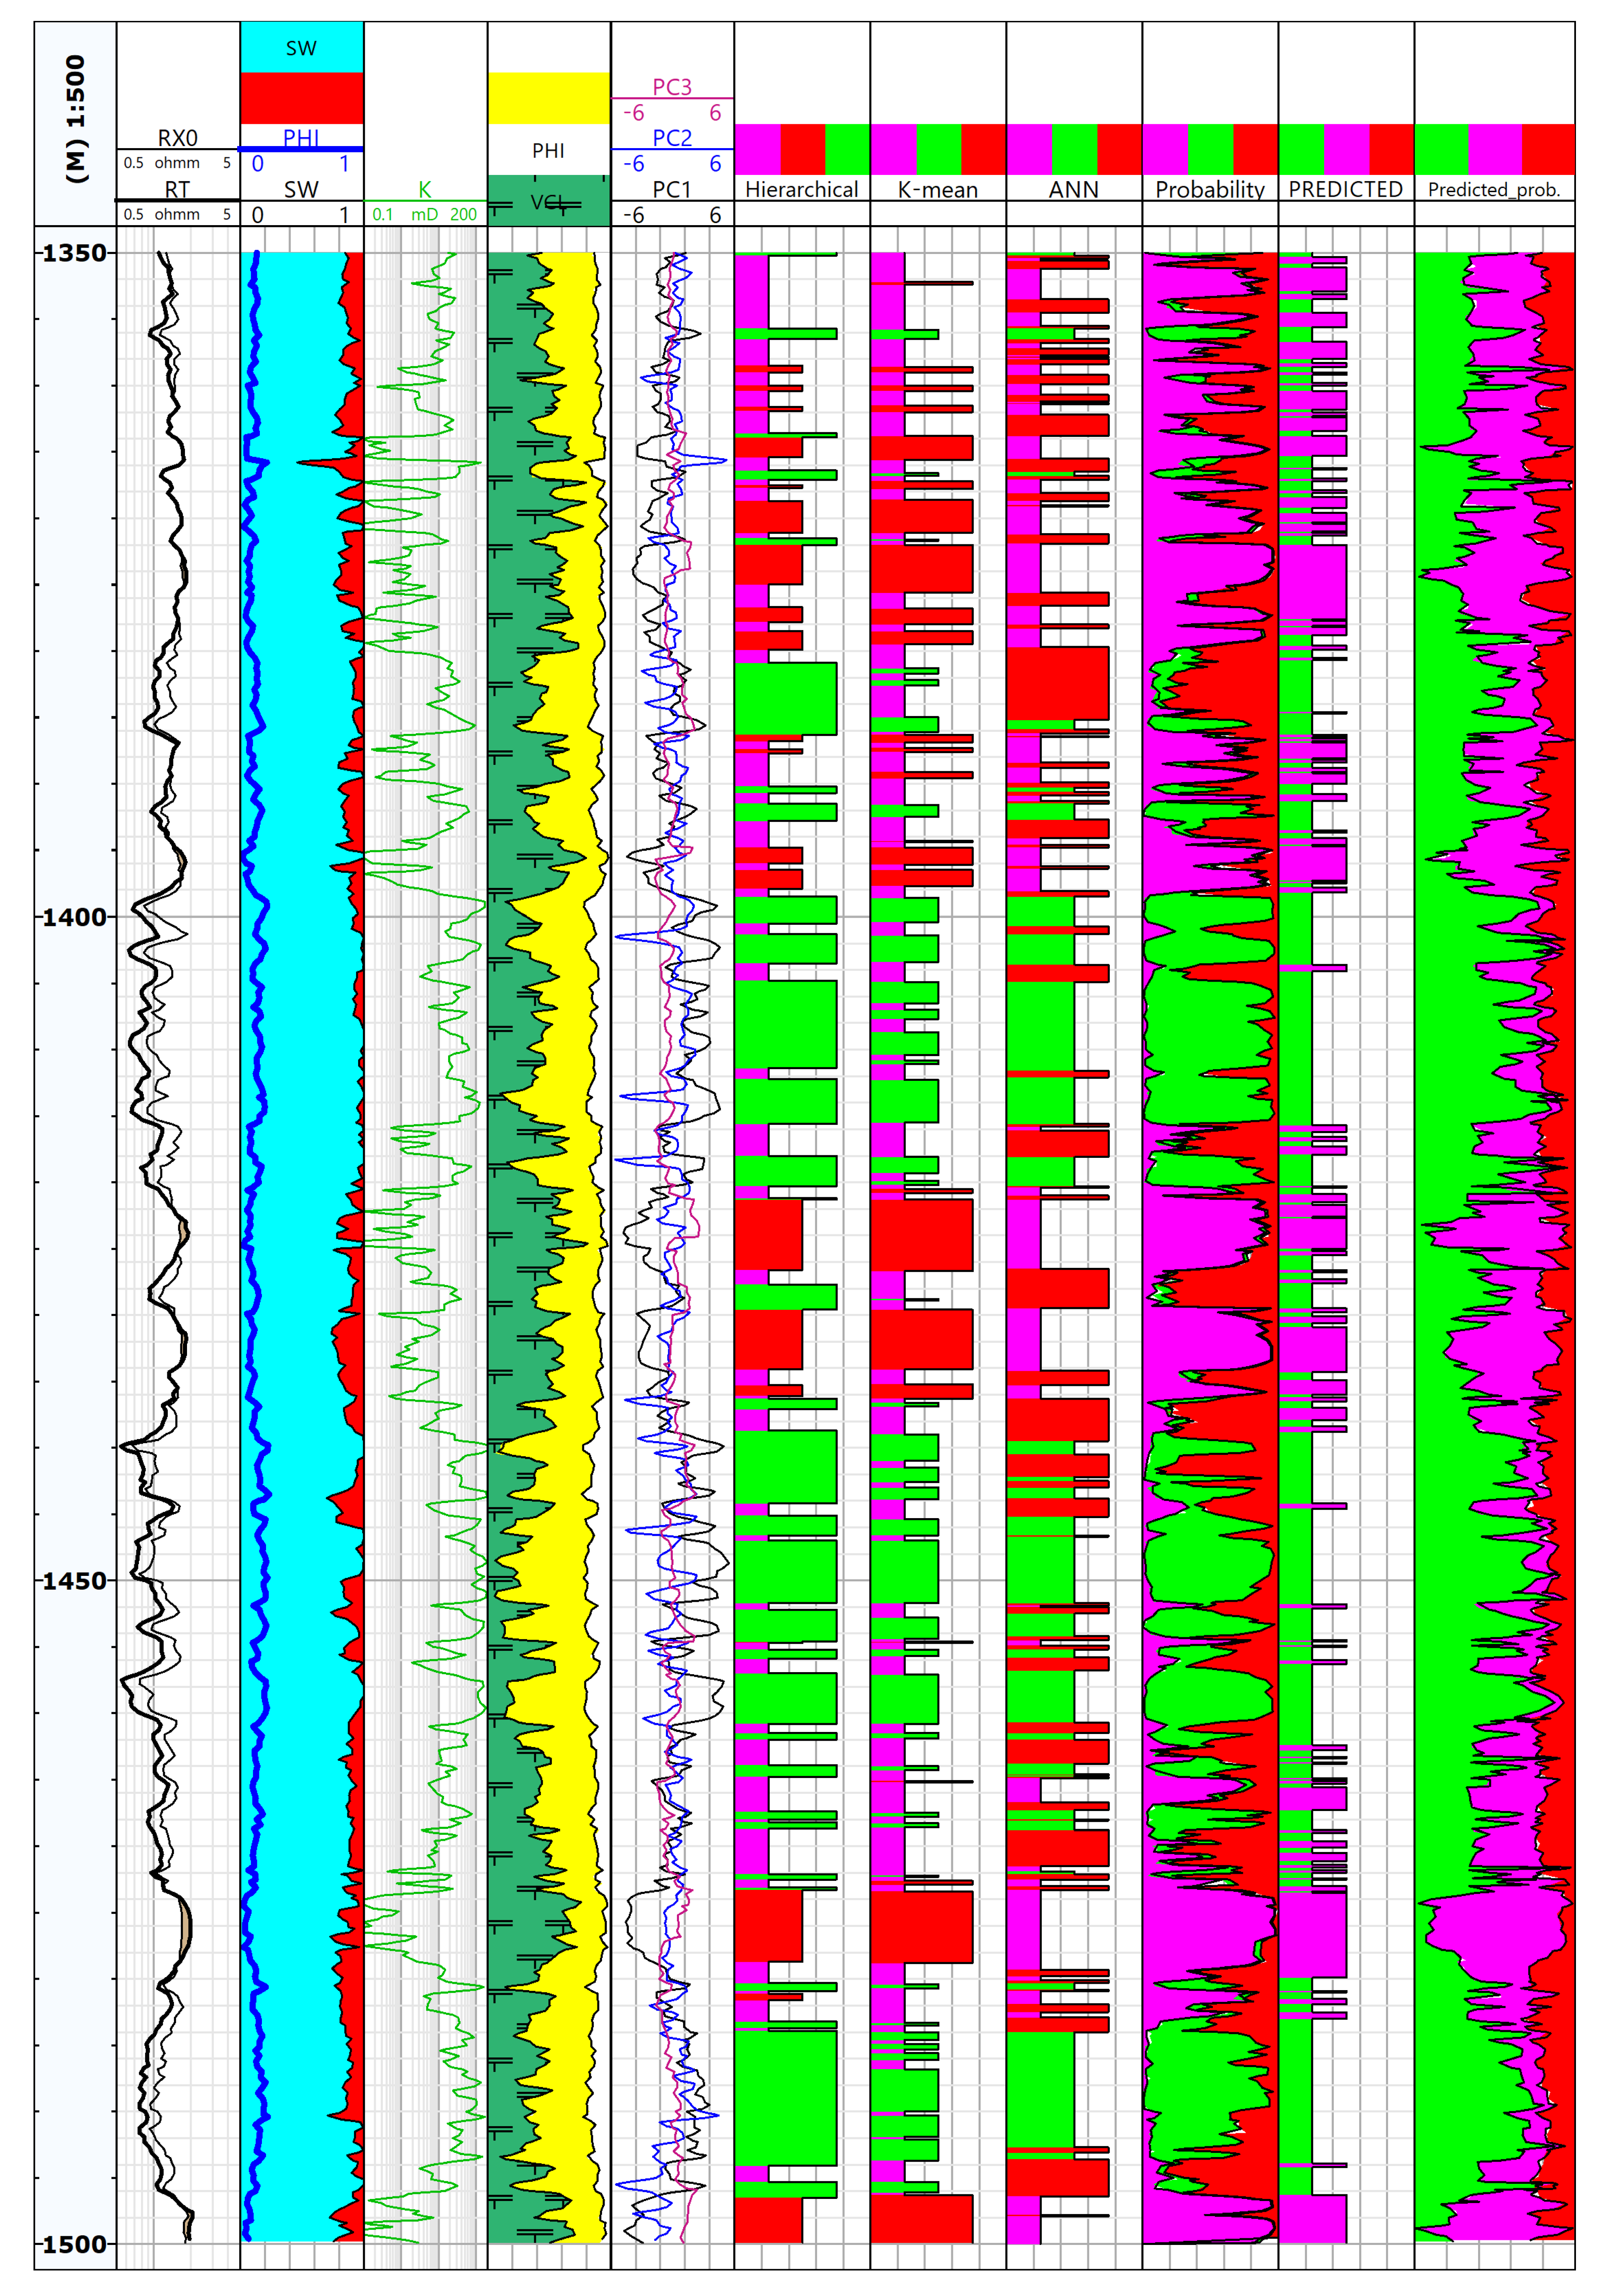
- in the second stage, the neural network taught on data from the W-1 well was applied to the second well and a prediction of the facies distribution in this well was made.
2. Materials and Methods
2.1. Well Log Measurements
2.2. Data Descriptions
2.3. Principal Component Analysis (PCA)
2.4. Cluster Analysis (CA)
2.4.1. Hierarchical Cluster Analysis (HCA)
- The similarity between the two samples is measured based on their distance. To calculate this parameter several metrics can be used, among which the Euclidean is more popular.
- The objects are linked together until one cluster is established. In this step, each object is considered as its cluster.
- To link objects together, based on different variables, various algorithms, such as single linkage, complete linkage, average linkage, median linkage and Ward linkage can be used. For this purpose, the last is preferred here [25].
2.4.2. K-mean Clustering
2.4.3. Discriminant Analysis (DA)
2.5. Artificial Neural Network (ANN)
Kohonen Algorithm
3. Results
3.1. Pre-processing
- Checking data continuity and the uniformity of the sampling step for all logs;
- applying the required environmental corrections before identifying and processing the electrofacies;
- combining logs from measurements from other intervals and depth shifting;
- depth matching between core and well logs; it was carried out based on the correlation between core GR measurement and log-derived one;
- detecting and removing the outliers and artificial anomaly;
- normalizing variables.
3.2. PCA Results
3.3. CA Results
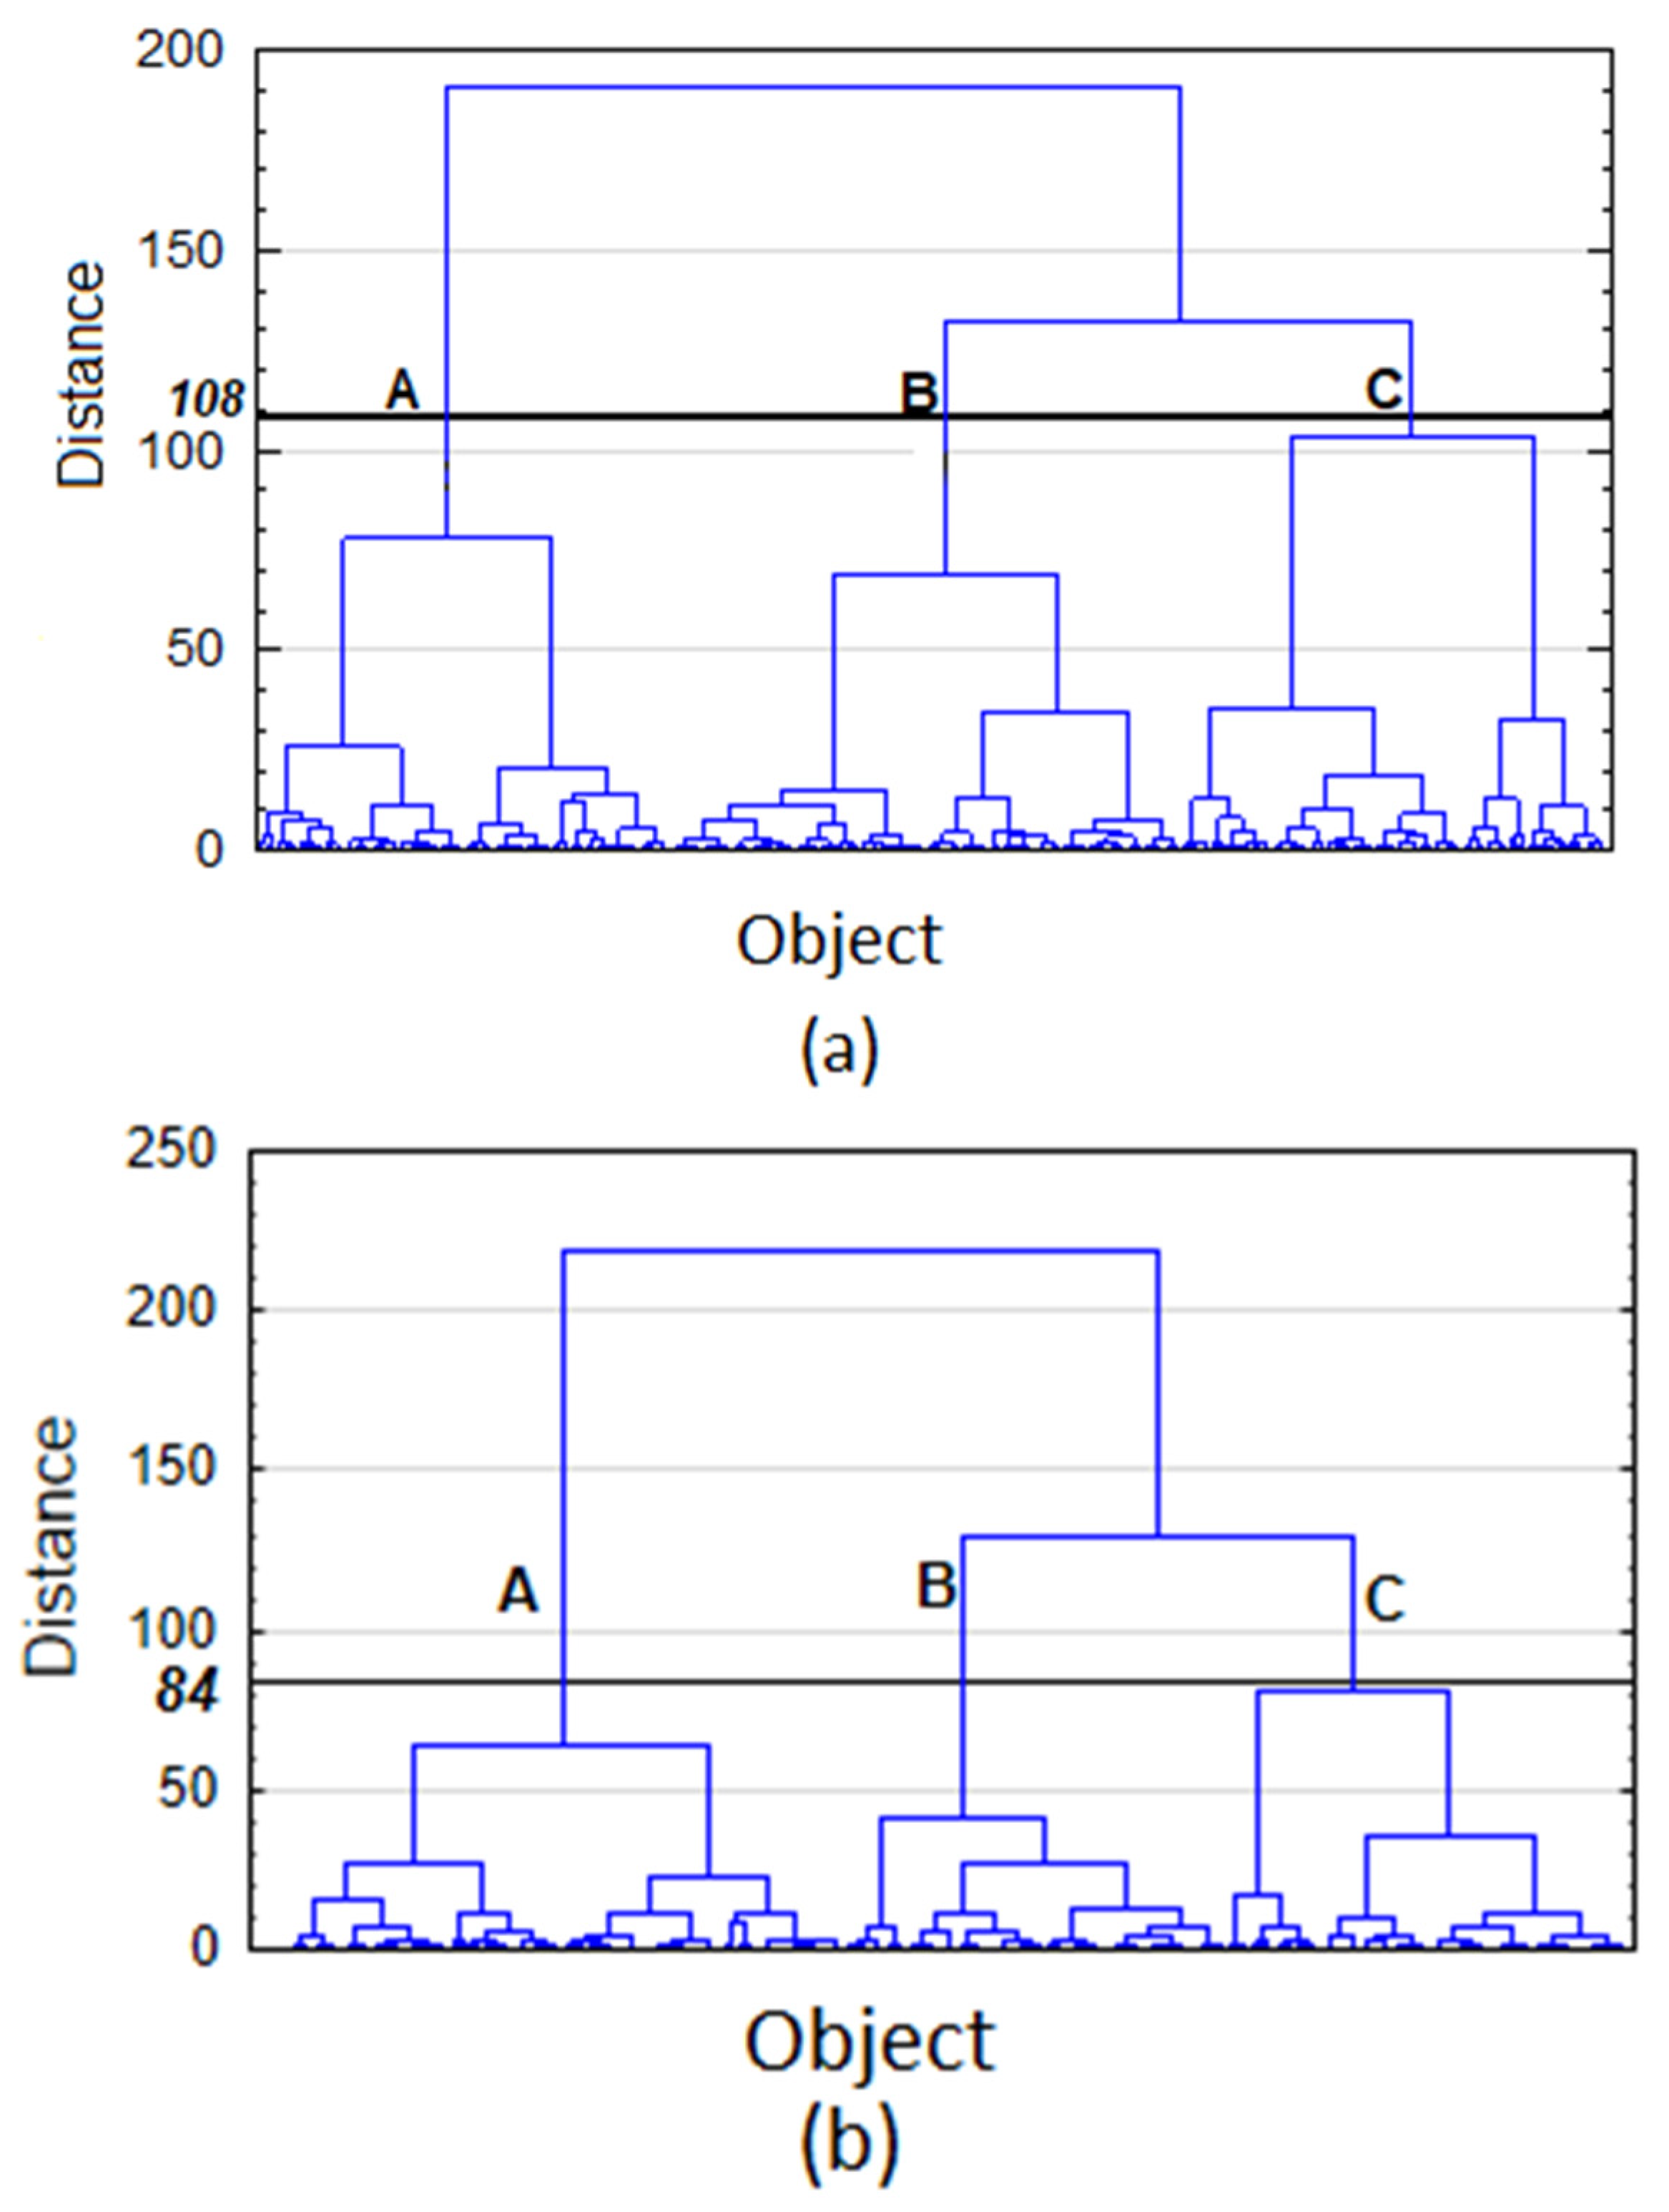
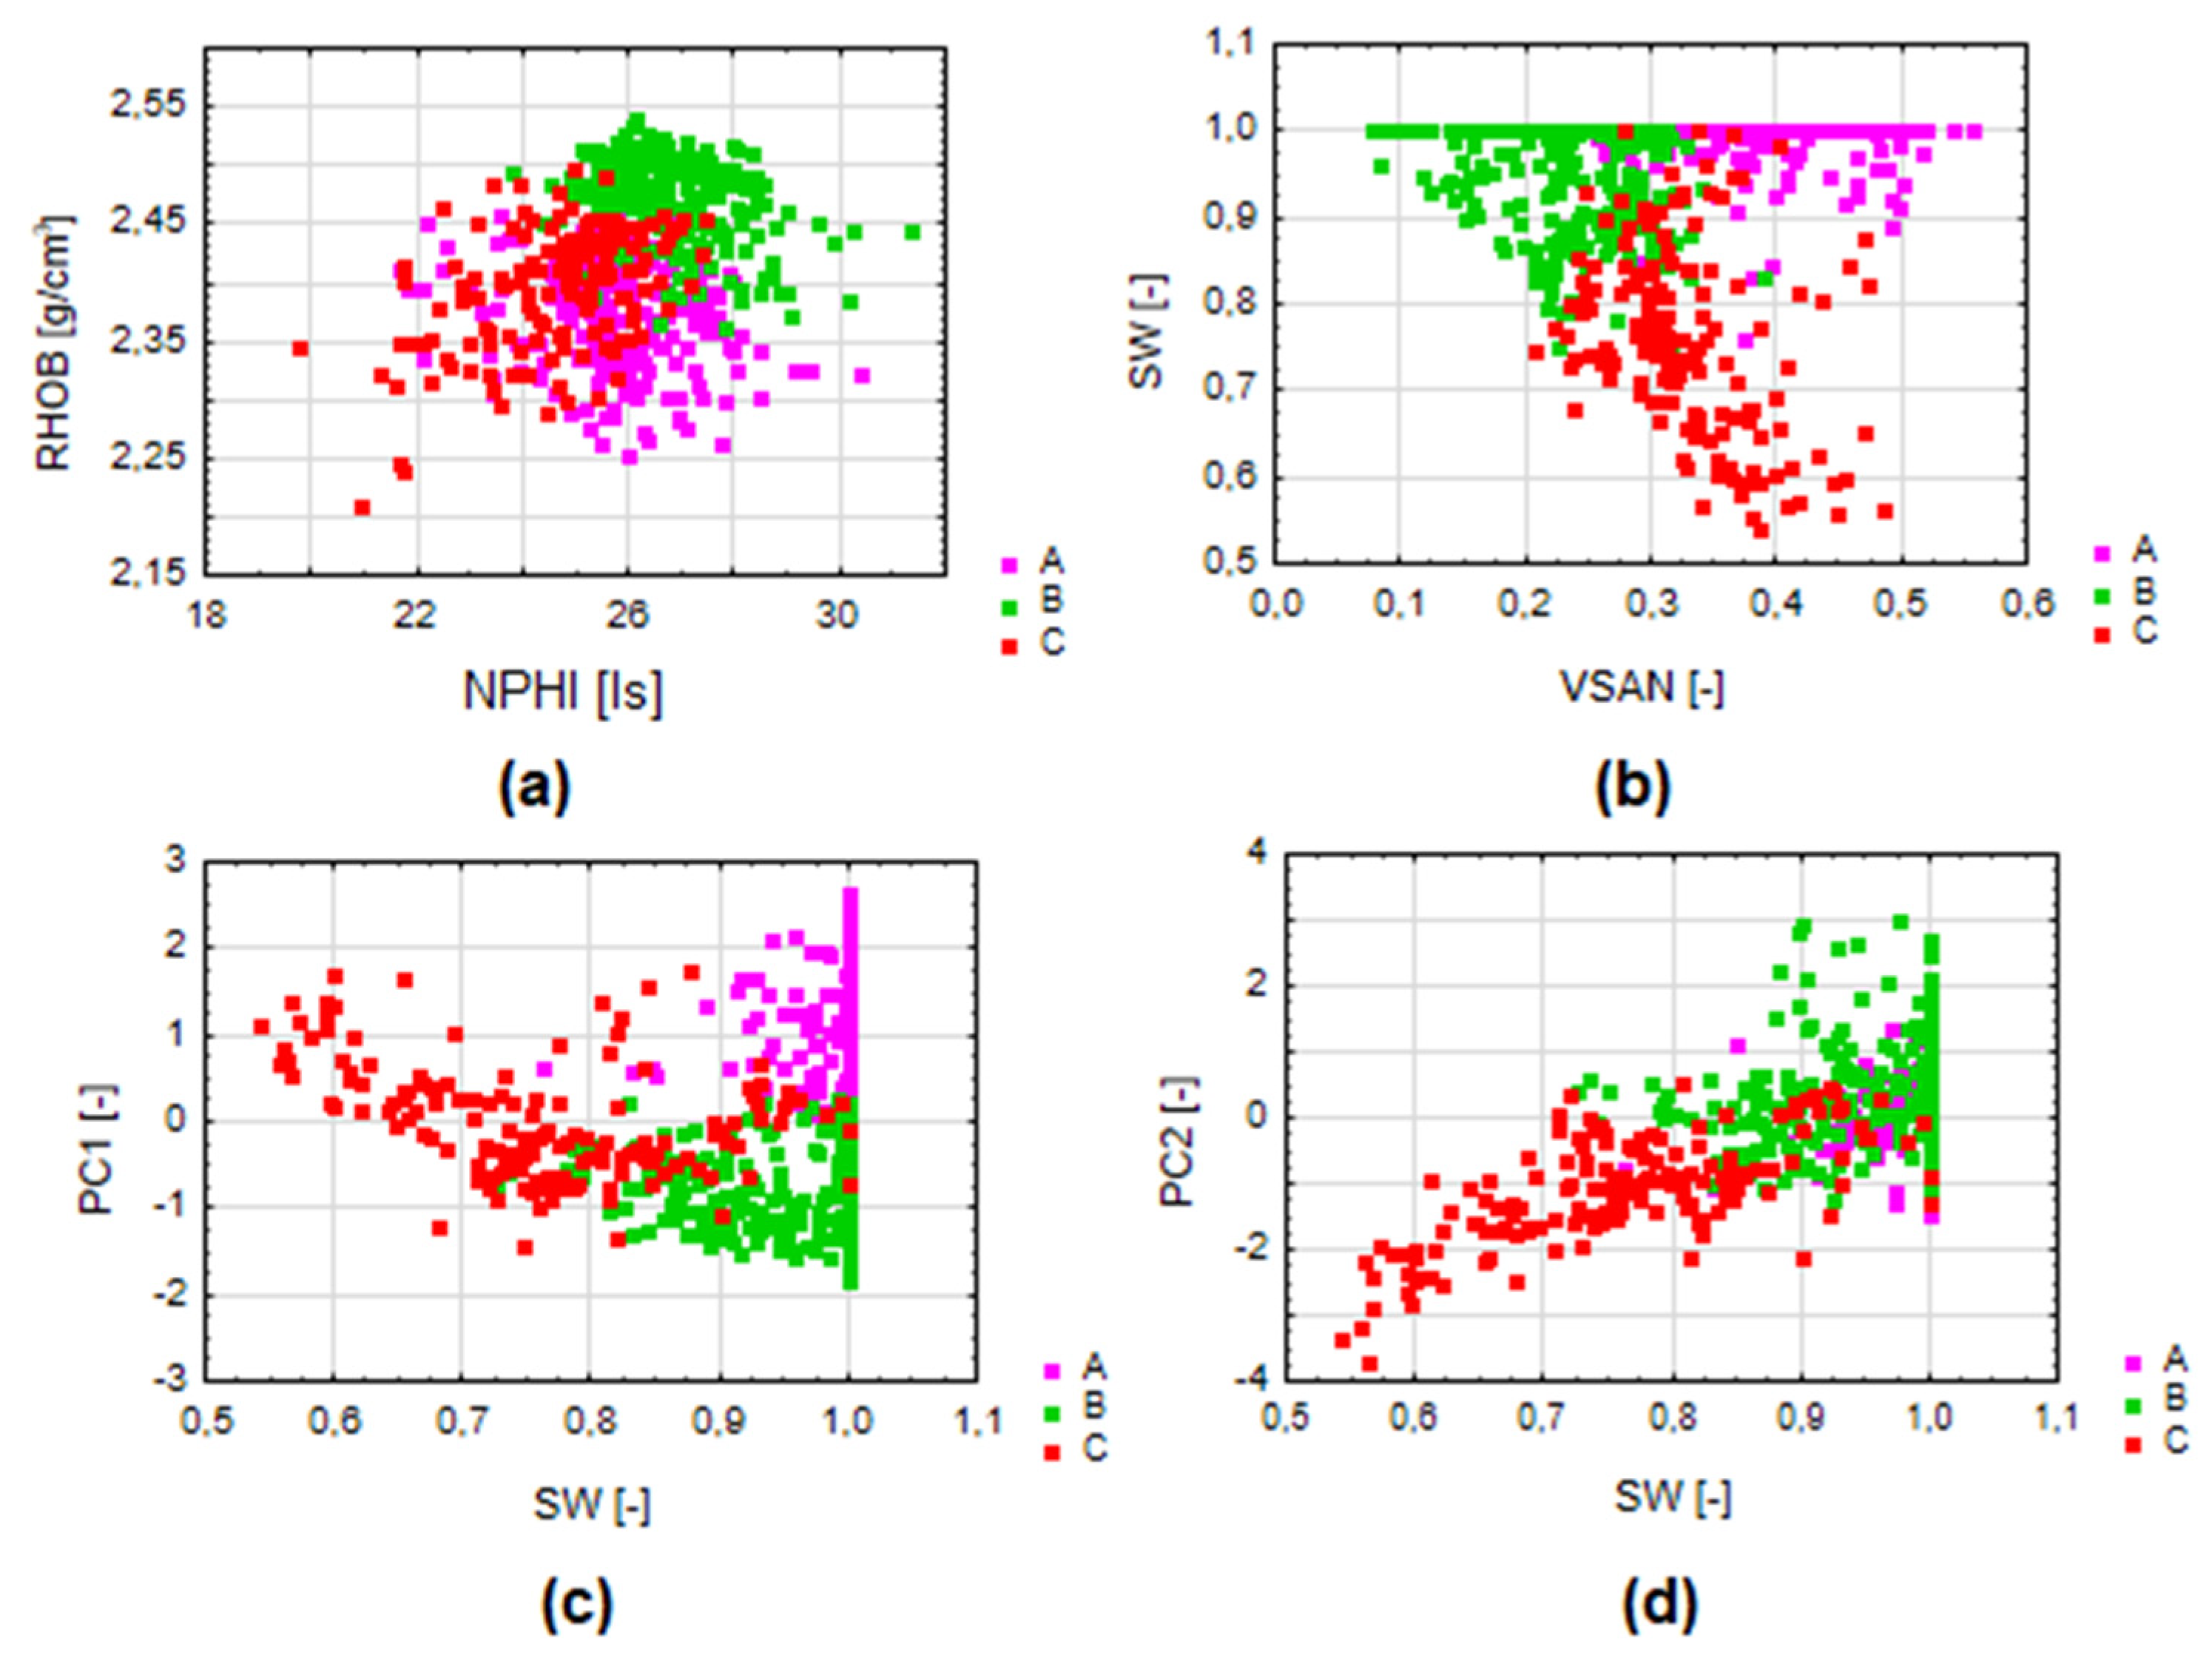
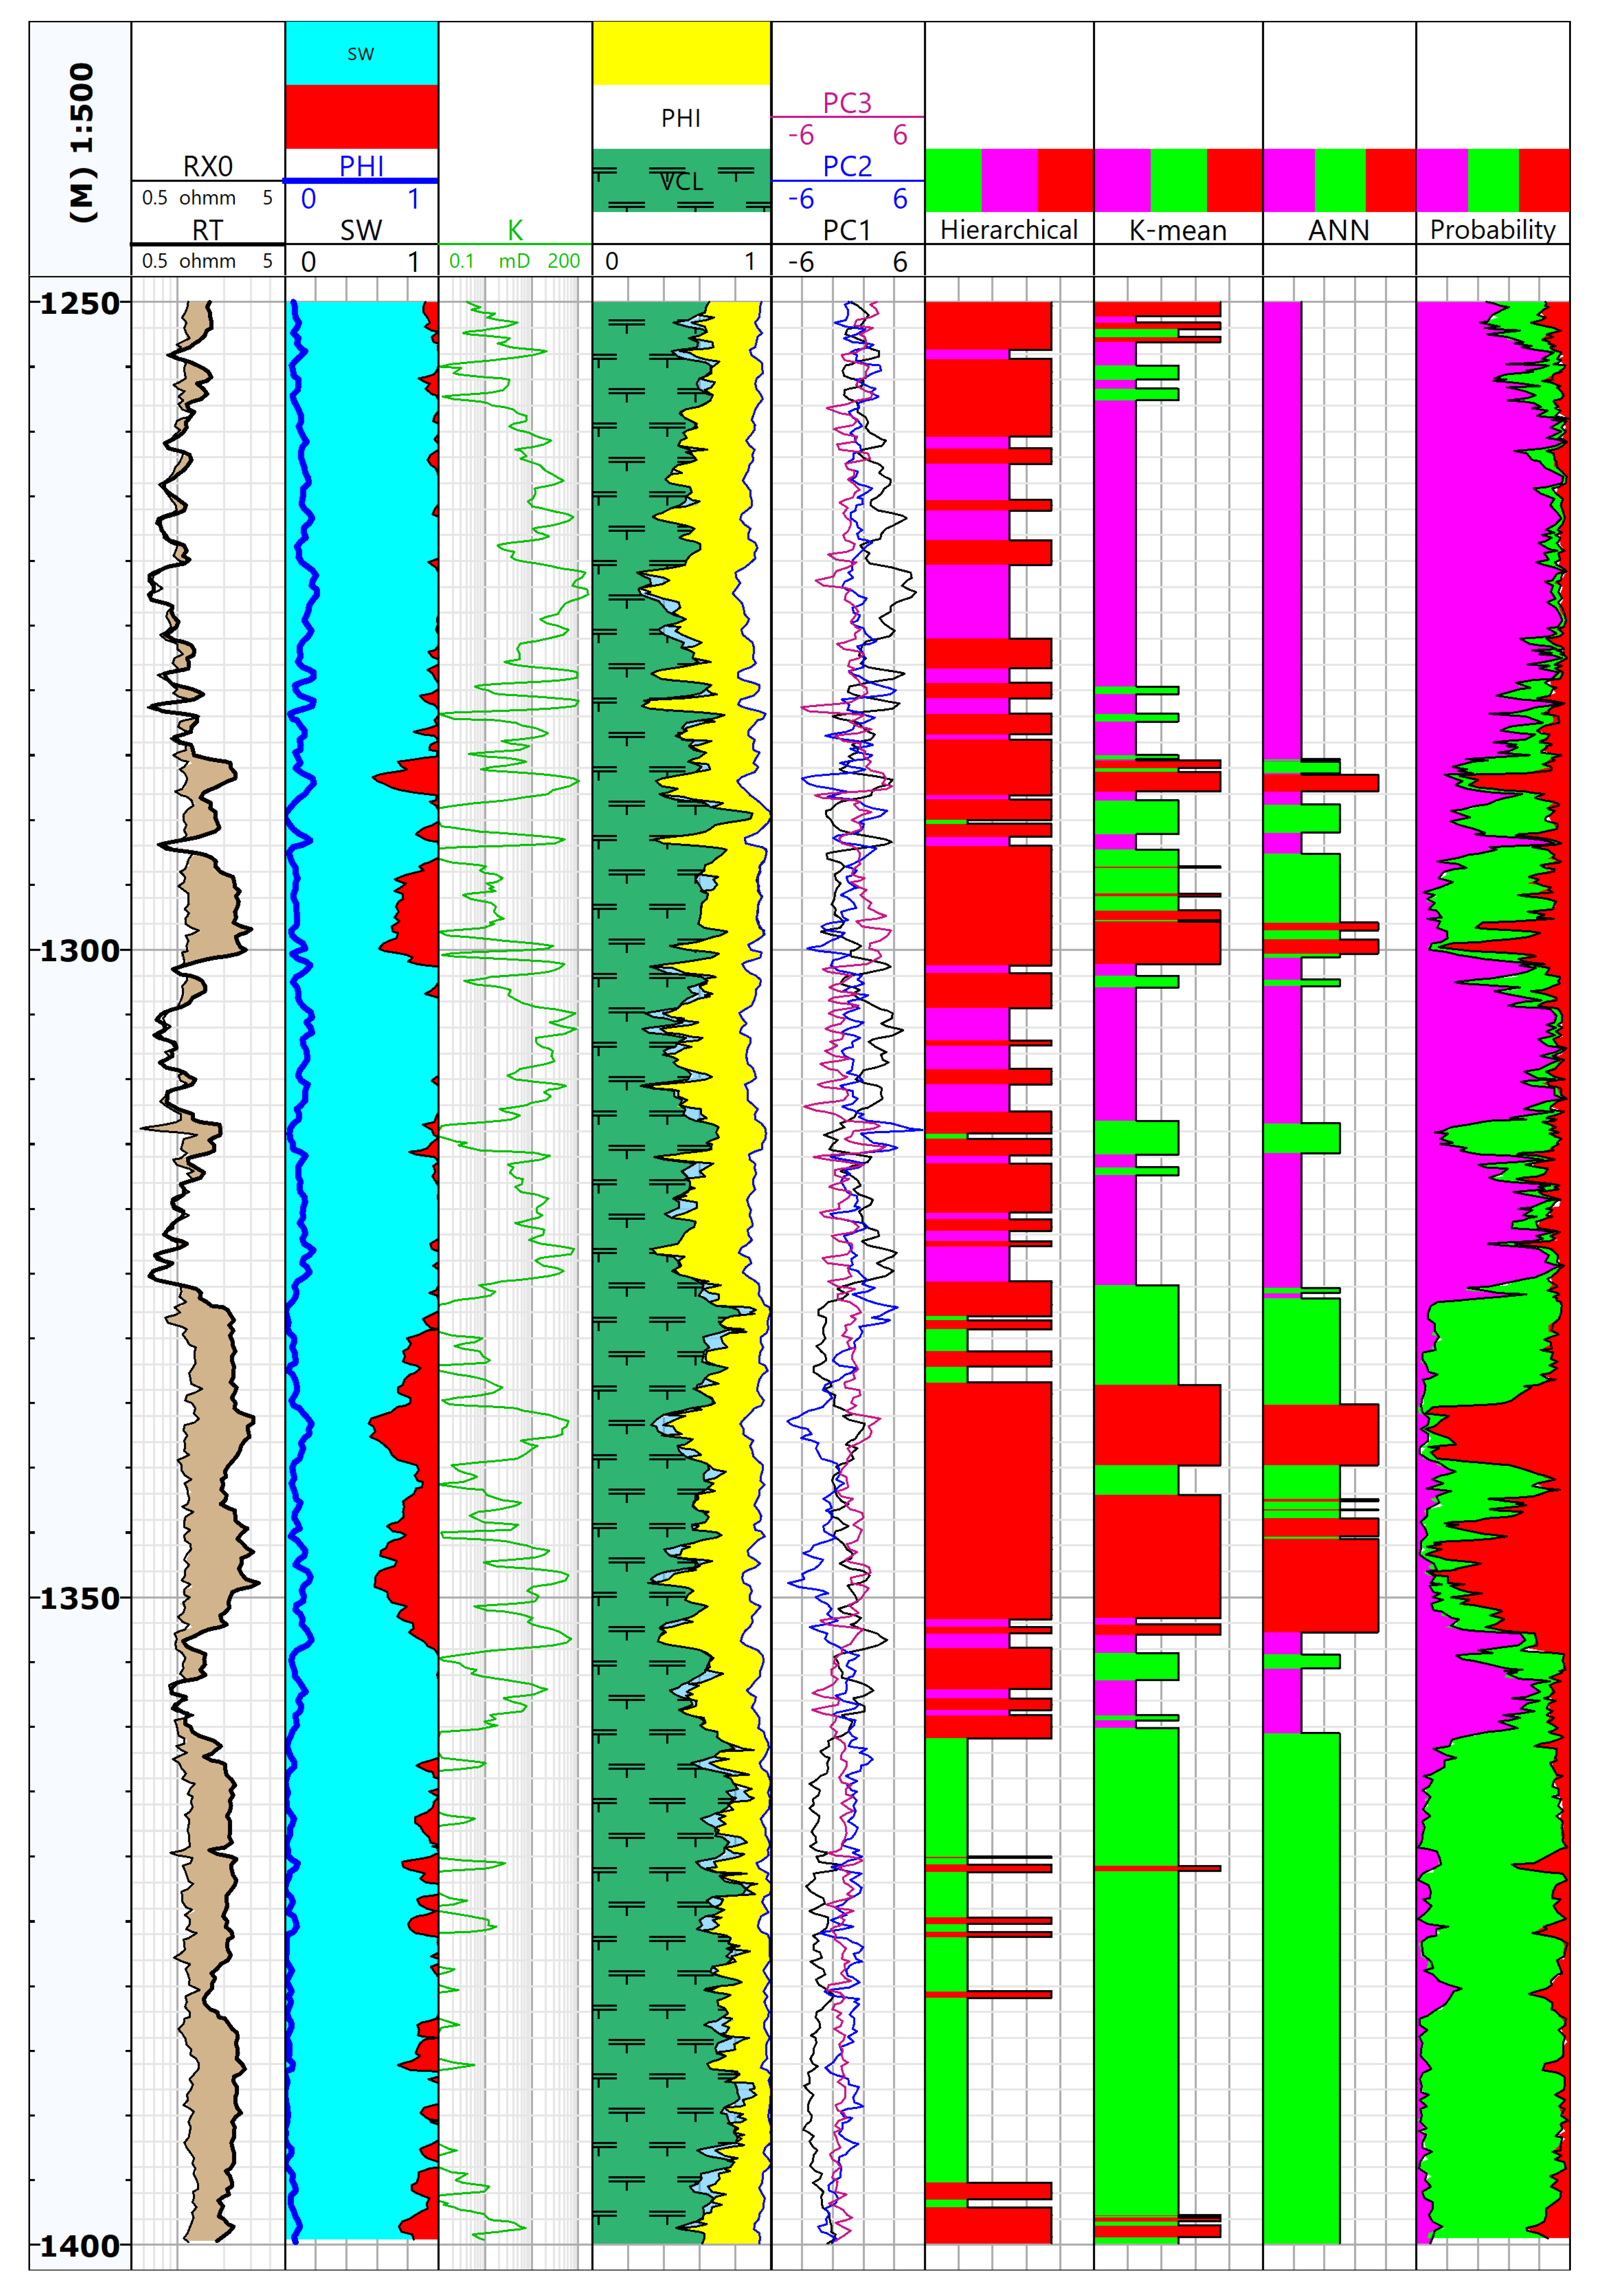
- Cluster A–sandstone-claystone deposits with poor to medium reservoir parameters (the highest water saturation, porosities in most cases do not exceed 15%);
- Cluster B–claystone-sandstone deposits with a predominance of clays, with poor reservoir parameters (high water saturation and low porosity);
- Cluster C–sandstone-claystone formations with good reservoir parameters (low water saturation and intermediate porosity values in relation to other groups).
- Cluster A–sandstone-claystone formations with poor to medium reservoir parameters (high water saturation, low porosity values);
- Cluster B–claystone-sandstone formations with poor reservoir parameters, but perspective in terms of the presence of gas (despite the lowest average water saturation and thus the probable presence of gas, there are low porosity and permeability values);
- Cluster C–sandstone-claystone formations with good reservoir parameters (low water saturation and high permeability compared to other groups).
3.4. DA Results
3.5. ANN Results
3.6. Facies Designated in ANN and CA in Comparison to the Standard Well Log Interpretation Results
- facies A–at the depths corresponding to facies A and C from previous analyses (CA and ANN separately for wells W-1 and W-2);
- facies B–at the depths corresponding to group B from previous analyses.
4. Discussion
5. Conclusions
- The ANN method has been successful for making a quantitative and qualitative correlation between predicted facies and reservoir parameters.
- Neural network models provide a robust method for predicting electrofacies from well logs in complex sandy-shaly reservoirs.
- Data examination, pre-processing, statistical analyses, and geological constraints are the most important factors to neural network modelling. The correct execution of these steps allows for the correct prediction of facies in new wells.
- Using neural network modelling, a combination of standard well logs interpretation and a modern approach to supporting reservoir modelling was achieved.
- ANN model speeds up evaluation of a reservoir. It increased the accuracy of investigation to minor thicknesses and to divide a formation into facies with characteristic petrophysical parameters.
- Statistical methods are a useful complement to comprehensive geophysical interpretation. In both wells, located in the area of the Carpathian Foredeep, thin-layered sandstone-claystone formations were found, gas saturated depth intervals were identified.
Acknowledgments
Conflicts of Interest
References
- Dorfman, M.H. New techniques in lithofacies determination and permeability prediction in carbonates using well logs. In Geological Applications of Wireline Logs; Hurst, A., Lovell, M.A., Morton, A.C., Eds.; Geological Society: London, UK, 1990; Volume 48, pp. 113–120. [Google Scholar]
- Serra, O.; Abbott, H.T. The Contribution of Logging Data to Sedimentology and Stratigraphy. Soc. Pet. Eng. J. 1982, 22, 117–131. [Google Scholar] [CrossRef]
- Lianshuang, Q.; Carr, T.R. Neural Network Prediction of Carbonate Lithofacies from Well Logs, Big Bow and Sand Arroyo Creek Fields, Southwest Kansas. Comput. Geosci. 2006, 32, 947–964. [Google Scholar]
- Dubois, M.K.; Bohling, G.G.C.; Chakrabarti, S. Comparison of Four Approaches to a Rock Facies Classification Problem. Comput. Geosci. 2007, 33, 599–617. [Google Scholar] [CrossRef]
- Saggaf, M.M.; Nebrija, E.L. A Fuzzy Logic Approach for the Estimation of Facies from Wireline Logs. Am. Assoc. Pet. Geol. Bull. 2003, 87, 1223–1240. [Google Scholar]
- He, J.; La Croix, A.D.; Wand, J.; Ding, W.; Underschultz, J.R. Using Neural Networks and the Markov Chain Approach for Facies Analysis and Prediction from Well Logs in the Precipice Sandstone and Evergreen Formation, Surat Basin, Australia. Mar. Pet. Geol. 2019, 101, 410–427. [Google Scholar] [CrossRef]
- Haykin, S. Neural Network: A Comprehansive Foundation; Prentice Hall: Upper Saddle River, NJ, USA, 1998. [Google Scholar]
- Horrocks, T.; Holden, E.J.; Wedge, D. Evaluation of automated lithology classification architectures using highly-sampled wireline logs for coal exploration. Comput. Geosci. 2015, 83, 209–218. [Google Scholar] [CrossRef]
- Yang, H.; Pan, H.; Ma, H.; Konaté, A.A.; Yao, J.; Guo, B. Performance of the synergetic wavelet transform and modified k-means clustering in lithology classification using nuclear log. J. Pet. Sci. Eng. 2016, 144, 1–9. [Google Scholar] [CrossRef]
- Borsaru, M.; Zhou, B.; Aizawa, T.; Karashima, H.; Hashimoto, T. Automated lithology prediction from pgnaa and other geophysical logs. Appl. Radiat. Isot. 2006, 64, 272–282. [Google Scholar] [CrossRef]
- Xie, Y.; Zhu, C.; Zhou, W.; Li, Z.; Tu, M. Evaluation of machine learning methods for formation lithology identification: A comparison of tuning processes and model performances. J. Pet. Sci. Eng. 2018, 139, 182–193. [Google Scholar] [CrossRef]
- Szabó, N.P. Shale volume estimation based on the factor analysis of well logging data. Acta Geophys. 2011, 59, 935–953. [Google Scholar] [CrossRef]
- Puskarczyk, E.; Jarzyna, J.; Porębski, S.J. Application of multivariate statistical methods for characterizing heterolithic reservoirs based on wireline logs—Example from the Carpathian Foredeep Basin (Middle Miocene, SE Poland). Geol. Q. 2015, 59, 157–168. [Google Scholar]
- Puskarczyk, E.; Jarzyna, J.; Wawrzyniak-Guz, K.; Krakowska, P.; Zych, M. Improved recognition of rock formation on the basis of well logging and laboratory experiments results using factor analysis. Acta Geophys. 2019, 67, 1809–1822. [Google Scholar] [CrossRef]
- Techlog. Available online: https://www.software.slb.com/products/techlog/techlog-petrophysics (accessed on 25 January 2020).
- Statistica. Available online: https://www.statsoft.pl/Pelna-lista-programow-Statistica/ (accessed on 25 January 2020).
- Myśliwiec, M. Mioceńskie skały zbiornikowe zapadliska przedkarpackiego. Przegląd Geol. 2004, 52/7, 581–592. (In Polish) [Google Scholar]
- Karnkowski, P. Miocene deposits of the Carpathian Foredeep (according to results of oil and gas prospecting). Geol. Q. 1994, 38, 377–394. [Google Scholar]
- Moss, B.; Seheult, A. Does principal component analysis have a role in the interpretation of petrophysical data? In Proceedings of the 28th Annual Logging Symposium Transactions, Society Professional Well Log Analysts, London, UK, 29 June–2 July 1987. [Google Scholar]
- Kaiser, H.F. The varimax criterion for analytic rotation in factor analysis. Psychometrika 1958, 23, 187–200. [Google Scholar] [CrossRef]
- Puskarczyk, E. Artificial neural networks as a tool for pattern recognition and electrofacies analysis in Polish Palaeozoic shale gas formations. Acta Geophys. 2019, 67, 1991–2003. [Google Scholar] [CrossRef]
- Szabó, N.P.; Dobroka, M.; Kavanda, R. Cluster analysis assisted float-encoded genetic algorithm for a more automated characterization of hydro-carbon reservoirs. Intell. Control Autom. 2013, 4, 362–370. [Google Scholar] [CrossRef]
- Sfidari, E.; Amina, A.; Kadkhodaie-Ilkhchi, A.; Chehrazi, A.; Zamanzadeh, S.M. Depositional Facies, Diagenetic Overprints and Sequence Stratigraphy of the Upper Surmeh Reservoir (Arab Formation) of Offshore Iran. J. Afr. Earth Sci. 2019, 149, 55–71. [Google Scholar] [CrossRef]
- Hand, D.; Mannila, H.; Smyth, P. Eksploracja Danych; Wydawnictwa Naukowo-Techniczne: Warszawa, Poland, 2005. (In Polish) [Google Scholar]
- Ward, J. Hierarchical Grouping to Optimize an Objective Function. J. Am. Stat. Assoc. 1963, 58/30, 236–244. [Google Scholar] [CrossRef]
- Stanisz, A. Przystępny Kurs Statystyki z Zastosowaniem STATISTICA PL na Przykładach z Medycyny Tom 3. Analizy Wielowymiarowe; StatSoft Polska Sp. z o. o.: Kraków, Poland, 2007. (In Polish) [Google Scholar]
- Gatnar, E. Symboliczne Metody Klasyfikacji Danych; Wydawnictwo Naukowe PWN: Warszawa, Polska, 1998. (In Polish) [Google Scholar]
- Shen, C.; Asante-Okyere, S.; Ziggah, Y.Y.; Wang, L.; Zhu, X. Group Method of Data Handling (GMDH) Lithology Identification Based on Wavelet Analysis and Dimensionality Reduction as Well Log Data Pre-Processing Techniques. Energies 2019, 12, 1509. [Google Scholar] [CrossRef]
- Nkurlu, B.M.; Shen, C.; Asante-Okyere, S.; Mulashani, A.K.; Chungu, J.; Wang, L. Prediction of Permeability Using Group Method of Data. Energies 2020, 13, 551. [Google Scholar] [CrossRef]
- Asante-Okyere, S.; Shen, C.; Ziggah, Y.Y.; Rulegeya, M.M.; Zhu, X. Investigating the Predictive Performance of Gaussian Process Regression in Evaluating Reservoir Porosity and Permeability. Energies 2018, 11, 3261. [Google Scholar] [CrossRef]
- Bishop, C. Neural Network for Pattern Recognition; Clearendon Press: Oxford, UK, 1995. [Google Scholar]
- McCleland, T.L.; Rumelhart, D.E. Parallel Distributed Processing; MIT Press: Cambridge, MA, USA, 1986. [Google Scholar]
- Kohonen, T. Self-Organized Formation of Topologically Correct Feature Maps. Biol. Cybern. 1982, 43, 59–69. [Google Scholar] [CrossRef]
- Stinco, P. Core and Log Data Integration the Key for Determining Electrofacies. In Proceedings of the SPWLA 47th Annual Logging Symposium, Veracruz, Mexico, 4–7 June 2006. [Google Scholar]


| W-1 | W-2 | |||||||
|---|---|---|---|---|---|---|---|---|
| PC | Eigenvalue | % of Total Variance | Cumulative Eigenvalue | Cumulative % of Variance | Eigenvalue | % of Total Variance | Cumulative Eigenvalue | Cumulative % of Variance |
| 1 | 4.14 | 46 | 4.14 | 46 | 5.55 | 62 | 5.55 | 62 |
| 2 | 1.87 | 21 | 6.00 | 67 | 1.75 | 19 | 7.30 | 81 |
| 3 | 1.24 | 14 | 7.24 | 80 | 0.79 | 9 | 8.09 | 90 |
| 4 | 0.61 | 7 | 7.85 | 87 | 0.31 | 3 | 8.40 | 93 |
| 5 | 0.34 | 4 | 8.19 | 91 | 0.25 | 3 | 8.65 | 96 |
| 6 | 0.31 | 3 | 8.50 | 94 | 0.19 | 2 | 8.83 | 98 |
| 7 | 0.25 | 3 | 8.75 | 97 | 0.09 | 1 | 8.92 | 99.1 |
| 8 | 0.13 | 1 | 8.88 | 99 | 0.04 | 0.5 | 8.96 | 99.6 |
| 9 | 0.12 | 1 | 9.00 | 100 | 0.04 | 0.4 | 9.00 | 100 |
| W-1 | W-2 | |||||
|---|---|---|---|---|---|---|
| PC1 | PC2 | PC3 | PC1 | PC2 | PC3 | |
| LLD | −0.74 | −0.47 | 0.29 | −0.90 | −0.20 | 0.03 |
| LLS | −0.74 | −0.42 | 0.16 | −0.85 | −0.34 | −0.16 |
| DT | 0.10 | −0.17 | 0.95 | −0.34 | 0.88 | 0.03 |
| NPHI | −0.19 | 0.81 | 0.14 | −0.52 | 0.79 | 0.10 |
| RHOB | −0.89 | 0.21 | −0.26 | −0.88 | −0.33 | −0.10 |
| PE | −0.87 | 0.20 | 0.03 | −0.95 | −0.11 | −0.11 |
| GR | −0.84 | 0.27 | 0.08 | −0.96 | 0.15 | −0.09 |
| GRKT | −0.84 | −0.26 | −0.21 | −0.88 | 0.13 | −0.11 |
| CALI | −0.17 | 0.75 | 0.30 | −0.50 | −0.20 | 0.84 |
| % of total variance | 46 | 21 | 14 | 62 | 19 | 9 |
| cumulative % of variance | 80 | 90 | ||||
| W-1 | W-2 | |||||||
|---|---|---|---|---|---|---|---|---|
| Training N = 451 % Correct | A p = 0.32 | B p = 0.42 | C p = 0.26 | Training N = 438 % Correct | A p = 0.13 | B p = 0.50 | C p = 0.37 | |
| A | 100.00 | 144 | 0 | 0 | 86.2 | 50 | 5 | 3 |
| B | 99.47 | 1 | 189 | 0 | 100.0 | 0 | 219 | 0 |
| C | 88.03 | 1 | 13 | 103 | 95.7 | 0 | 7 | 154 |
| All | 96.67 | 146 | 202 | 103 | 96.6 | 50 | 231 | 157 |
| Test N = 150 % Correct | A p = 0.38 | B p = 0.35 | C p = 0.27 | Test N = 163 % Correct | A p = 0.13 | B p = 0.53 | C p = 0.34 | |
| A | 100.00 | 57 | 0 | 0 | 81.82 | 18 | 2 | 2 |
| B | 98.08 | 1 | 51 | 0 | 100.00 | 0 | 86 | 0 |
| C | 95.12 | 0 | 2 | 39 | 90.91 | 0 | 5 | 50 |
| All | 98.00 | 58 | 53 | 39 | 94.48 | 18 | 93 | 52 |
© 2020 by the author. Licensee MDPI, Basel, Switzerland. This article is an open access article distributed under the terms and conditions of the Creative Commons Attribution (CC BY) license (http://creativecommons.org/licenses/by/4.0/).
Share and Cite
Puskarczyk, E. Application of Multivariate Statistical Methods and Artificial Neural Network for Facies Analysis from Well Logs Data: an Example of Miocene Deposits. Energies 2020, 13, 1548. https://doi.org/10.3390/en13071548
Puskarczyk E. Application of Multivariate Statistical Methods and Artificial Neural Network for Facies Analysis from Well Logs Data: an Example of Miocene Deposits. Energies. 2020; 13(7):1548. https://doi.org/10.3390/en13071548
Chicago/Turabian StylePuskarczyk, Edyta. 2020. "Application of Multivariate Statistical Methods and Artificial Neural Network for Facies Analysis from Well Logs Data: an Example of Miocene Deposits" Energies 13, no. 7: 1548. https://doi.org/10.3390/en13071548
APA StylePuskarczyk, E. (2020). Application of Multivariate Statistical Methods and Artificial Neural Network for Facies Analysis from Well Logs Data: an Example of Miocene Deposits. Energies, 13(7), 1548. https://doi.org/10.3390/en13071548


