Article

Multi-Criteria Optimisation of an Experimental Complex of Single-Family Nearly Zero-Energy Buildings

by
Małgorzata Fedorczak-Cisak
1,*,
Anna Kotowicz
2,
Elżbieta Radziszewska-Zielina
1,
Bartłomiej Sroka
1,
Tadeusz Tatara
1 and
Krzysztof Barnaś
3,*
1
Faculty of Civil Engineering, Cracow University of Technology, 24 Warszawska Street, 31-150 Krakow, Poland
2
Colliers International, 18A Pawia Street, 31-154 Krakow, Poland
3
PhD Student, Faculty of Architecture, Cracow University of Technology, 24 Warszawska Street, 31-150 Krakow, Poland
*
Authors to whom correspondence should be addressed.
Energies 2020, 13(7), 1541; https://doi.org/10.3390/en13071541
Submission received: 3 February 2020 / Revised: 2 March 2020 / Accepted: 11 March 2020 / Published: 25 March 2020
(This article belongs to the Special Issue Energy Performance in Buildings and Quality of Life)

Abstract

:
The Directive 2010/31/EU on the energy performance of buildings has introduced the standard of “nearly zero-energy buildings” (NZEBs). European requirements place the obligation to reduce energy consumption on all European Union Member States, particularly in sectors with significant energy consumption indicators. Construction is one such sector, as it is responsible for around 40% of overall energy consumption. Apart from a building’s mass and its material and installation solutions, its energy consumption is also affected by its placement relative to other buildings. A proper urban layout can also lead to a reduction in project development and occupancy costs. The goal of this article is to present a method of optimising single-family house complexes that takes elements such as direct construction costs, construction site organisation, urban layout and occupancy costs into consideration in the context of sustainability. Its authors have analysed different proposals of the placement of 40 NZEBs relative to each other and have carried out a multi-criteria analysis of the complex, determining optimal solutions that are compliant with the precepts of sustainability. The results indicated that the layout composed of semi-detached houses scored the highest among the proposed layouts under the parameter weights set by the developer. This layout also scored the highest when parameter weights were uniformly distributed during a test simulation.

1. Introduction

Designing and building a complex of single-family houses, with a holistic focus on sustainable development, and construction and occupancy costs, is a problem that is very difficult to solve. It is a multi-aspect problem, in which decision variables include, among others: selecting construction materials, building services, the parameters of the shape of the buildings, their placement on the site, the sequence in which individual buildings are to be constructed and the completion deadlines for individual tasks. During the occupancy stage, one should add an analysis of the impact of the change in energy costs. When considering the entire life-cycle of the buildings, renovation and repair costs should also be included, in addition to any remodelling and demolition expenses. In recent years, the focus on the energy efficiency and pollution emission of buildings has grown exponentially and has had an immense impact on the real estate market and property values. The paper [1] presents an analysis of the profitability of investing in a selection of three systems based on renewable energy sources, using a semi-detached house as an example.
One of the components of designing a complex of single-family houses is establishing its urban layout. Multi-criteria methods are proposed by scholars who specialise in the optimisation of spatial planning, urban and architectural design, as well as construction project organisation and management increasingly often. In practice, general urban layout planning decisions are typically made as a result of many different approaches and factors, as well as under the influence of numerous stakeholders who may have different goals and hierarchies of values. Decision-making at this level should be supported by decision-making support methods during various stages and at different scales of design and planning. This should particularly apply to land use management and planning, which has been widely discussed in [2]. The authors of [3] have discussed the problem of uncertainty mapping using Monte Carlo analysis plugged into the Analytic Hierarchy Process (AHP) method, using the case of Howth, Dublin, in this context. However, this approach primarily focused on allowing decision-makers to gain insight into how much expert opinions can be trusted, specifically focusing on the AHP method, which can be considered a limitation.
The use of multi-criteria decision-making methods to support the planning of complexes of buildings of various sizes—ranging from entire districts to smaller compounds—is a field that can be considered to be fragmented in terms of research focus. However, such methods have been used to analyse various aspects of designing building complexes, ranging from those of placement within the wider urban fabric, the layout of buildings within complexes themselves, construction costs, the sequence of constructing individual buildings, as well as matters related to sustainability. Therefore, the authors are of the opinion that a broad characterisation of this use is justified. In the field of spatial planning, numerous authors have discussed the use of geographic information system (GIS) tools in combination with multi-criteria analysis methods. The authors of [4] analysed the problem of the optimal placement of housing estates within the structure of the city. In [5], a fuzzy version of the Decision Making Trial and Evaluation Laboratory (DEMATEL) method, coupled with Covariance Matrix Adaptation Evolutionary Strategy (CMA-ES) and Weighted Linear Combination (WLC) was used to model the suitability of sites for specific forms of use. The authors of [6], in turn, performed a comprehensive and cross-sectional review of the use of multi-criteria analysis methods in the field in question. In [7], the Ordered Weighted Averaging method (OWA) was used in conjunction with GIS tools to analyse the suitability of the territory of the Shavur Plain in Iran for various forms of use. It can therefore be concluded that GIS tools offer considerable potential for application in conjunction with multi-criteria analysis methods and that this field merits further study, particularly in light of the constant development of said tools. However, the utility of GIS tools appears to largely be confined to their role as information repositories and many of the proposals remain vague on whether or not they intend to automate data collection from these systems in any way. Multi-criteria methods have also been used to determine and investigate various indicators associated with sustainability and resilience.
The authors of [8] investigated potential use of multi-criteria methods in assessing sustainability, noting that new alternatives constantly become available, which can make method choice and weight setting difficult. In [9], the authors proposed a process of selecting multi-criteria analysis methods for renewable energy projects, thereby highlighting the immense variety and complexity of decision problems in the field and that there is no single best method that can be applied to them all. The authors of [10] used an expert system based on multi-criteria decision-making support to assess the impact of climate change, proposing a new method called MCDM-based expert system for adaptation analysis under changing climate, abbreviated as MAEAC. The authors applied it to a large territory and primarily focused on policy analysis and its impact on climate change. A model of selecting a method of assessing sustainable urban revitalisation strategies was proposed in [11], while the authors of [12] discussed the use of multi-criteria methods in environmental planning and management, similarly as in [13], where the objective was to arrive at a decision-making process associated with a sustainable approach to energy. The authors of [14] used the Discrete Linear Programming method (DLP) to analyse development projects associated with urban revitalisation. A comprehensive overview of the suitability of the use of multi-criteria methods to assess building-integrated green technologies, ultimately using the AHP method, was featured in [15]. The same method was also used by the authors of [16] to investigate construction project management in which sustainability was deemed a key factor.
Multi-criteria methods have also found use in studies of urban and architectural design. In [17], the AHP method was used to organise an architectural competition held in Italy. The authors of [18] used the Evaluation Based on Distance from Average Solution (EDAS) and Step-wise Weight Assessment Ratio Analysis (SWARA) methods to assess the shape of the floor plan of a newly-designed building, while in [19] a hybrid model was proposed—based on game theory, the AHP method, the Simple Additive Weighting method (SAW), Multiplicative Exponential Weighting, the Technique for Order of Preference by Similarity to Ideal Solution method (TOPSIS), EDAS, New Additive Ratio Assessment (ARAS), Full Multiplicative Form, as well as the rules of Laplace and Bayes. This approach is particularly noteworthy as it explores the simultaneous use of numerous (six) multi-criteria analysis methods in a single problem, thereby highlighting the importance of experts’ opinions. The author of [20] studied the suitability of land for infill development using multi-criteria methods supported by GIS tools. In [21], the authors holistically investigated the problem of decision-making during the pre-design stage of an architectural design project. The impact of the shape of the building on its energy efficiency and the costs of its construction was analysed in [22], while [23] found use in architectural and urban design. The authors of [24] used the TODIM method (a Portuguese acronym for Interactive Multi-criteria Decision Making) to conduct a multi-criteria analysis of housing properties.
In summary, it can be stated that very few approaches that enhanced existing methods that had specifically been used to address problems in the field of spatial planning, urban and architectural design can be found, particularly as the range of problems said methods are applied to varies greatly between each case.
The works of Tawfik et al. [25], as well as Koenig etal. [26] merit particular attention, as they directly explore the problem of the multi-criteria selection of an urban layout or its determination. The proposals by Koenig et al. concerning the automated generation of pre-defined urban layouts for various plots currently occupied by informal settlements is also highly interesting [27,28,29].

1.1. The Scale of the Problem

According to the Eurostat Agency [30], in 2017, as much as 33.6% of the population of the European Union resided in detached single-family houses, while 24.0% of the population lived in semi-detached single-family houses. According to data provided by the Polish General Construction Inspector’s Office [31], in 2018, a total of 98,915 building permit applications were filed for residential buildings, out of which 93,714 building permits were issued for single-family houses (almost 94.8%), which constituted a 3% increase from the previous year [31]. The results of statistical studies presented by BPD Europe BV [32] indicate that 12% of respondents from The Netherlands, 16% of respondents from France and 17% of respondents from Germany who had been searching for a new place of residence pointed to a single-family house as a preferred option in a situation in which they would have to move to a different dwelling. This proves that single-family buildings remain popular in many developed countries, while in countries such as Poland they continue to enjoy very high popularity. The design of single-family building complexes can therefore be considered an important field, both to planners who design urban layouts for individual projects, as well as designers who work on projects composed of many such buildings.
The necessity of considering parameters associated with energy efficiency is dictated by, among other things, the current energy policy vector of the European Union, expressed by such documents as Directive 2010/31/EU on the energy performance of buildings [33]. This EU document introduced the following definition of nearly-zero energy buildings (NZEB): nearly zero-energy building’ means a building that has a very high energy performance, as determined in accordance with Annex I. The nearly zero or very low amount of energy required should be covered to a very significant extent by energy from renewable sources, including energy from renewable sources produced on-site or nearby”. However, every European Union Member State has adopted its own NZEB parameters, which are adapted to local conditions.
The implementation of the Directive into Polish state law has introduced a new standard of near zero-energy buildings (NZEBs). The document that has been amended to include the standard, as stipulated in the Directive, is the Ordinance on the Technical Conditions that Must be Met by Buildings and their Placement [34]. In the Polish definition of NZEBs there are two criteria. The first criterion is ensuring proper building envelope thermal insulation. The second criterion for NZEB buildings in Poland applies to Primary Energy (PE), which cannot exceed a set value for different types of buildings. For single-family residential buildings without cooling installations, the maximum PE value is 70 kWh/(m2/annum). The buildings analysed in the article meet both criteria, thus being compliant with NZEB standards as stipulated in Polish regulations.
Selecting the appropriate orientation of buildings, their shape, construction materials, building services and shading system solutions leads to lower energy demand and costs and affects the comfort of use of the buildings themselves, reducing overheating. This subject has been discussed in, among others, [35,36,37,38,39,40,41,42]. It can therefore be argued that the application of research findings in the field of energy efficiency and thermal comfort optimisation in the design of buildings and complexes that enjoy significant popularity on the real estate market should be incorporated into current design methodology. It can also be argued that by increasing the energy efficiency of buildings forming market-preferred layouts one can contribute to increasing the popularity of such solutions in areas where detached or semi-detached houses are the most popular.

1.2. Cost Estimation Methods

Calculating the overall costs of construction is a difficult task. Typically, the overall costs of construction are divided into indirect and direct costs. However, this is a major oversimplification. Situations that can significantly affect the expenditures of the contractor can take place over the course of working on a construction project. Some of these are difficult to predict (e.g., natural disasters, economic and social changes), while others can be prepared for during a project’s planning stage. The predicted additional costs can include penalties for failing to meet planned deadlines or penalties for failing to maintain the continuity of construction crew operation.
Furthermore, every project is subjected to certain technological and organisational constraints, such as the time during which construction crews or buildings are available, or technological and organisational requirements concerning ongoing work performed by a given crew on a specific building. Numerous cost estimation or total construction project cost optimisation methods have been developed. They usually utilise metaheuristic methods, such as simulated annealing, hybrid algorithms [43] and genetic algorithms [44]. Mathematical programming methods are also used, such as the Decision model for planning material supply channels in construction [45]. In [46], an innovative approach was proposed, in the form of a stochastic decision network. It enables the integration of random and decision-based aspects of planned projects. This approach allows the decision-maker to obtain a solution that is optimal in terms of the expected time and cost. They can do so by defining their preferences as to the results of the planned project and setting their risk aversion accordingly. In the case of multi-criteria analysis of time and cost, the decision-maker can also define weight values for the expected project time and cost. The methods listed above do not incorporate all of the essential costs of carrying out construction projects, such as direct costs, indirect costs, penalties for failing to meet contractual deadlines, as well as the costs of discontinuities in the work of construction crews. They also do not take into account technological and organisational constraints. Furthermore, metaheuristic methods involve lengthy calculations when compared to linear programming.

1.3. Previously Used Methods

Multi-criteria decision-making analysis methods that have been applied in urban design and spatial planning have been predominantly focused on large-scale planning. As Afshari and Vatanparast [6] have indicated, such proposals utilised the Preference Ranking Organisational method for Enrichment Evaluation (PROMETHEE and PROMETHEE-2) methods in combination with Hasse Diagram Technique (HDT), the AHP method, Fuzzy AHP, Weighted Linear Combination (WLC), a combination of the AHP and TOPSIS methods, the ELECTRE-2 method (ELimination Et Choix Traduisant la REalité), the EXPROM-2 method (an extended version of the PROMETHEE method), as well as evolutionary algorithms. Guarini, Battisti and Chiovitti [23] also pointed to the possible use of Multi-attribute Utility Theory (MAUT) and Measuring Attractiveness by a Categorical Based Evaluation methods (MACBETH).
The selection of the multi-criteria analysis method depends on the specificity of the decision problem at hand. For instance, in [47] the author referred to studies in which they used the ELECTRE III and AHP methods to analyse the possibility of using an alternative version of the BIPOLAR method to solve the problem of selecting a construction company for partnering cooperation during a construction project. The study included a calculation example and verified the results of previous studies by applying an alternative BIPOLAR method version. Ultimately, its use produced the same end result as when using two other methods.
Multi-criteria methods that incorporate co-dependencies between decision-making criteria and alternatives have seen considerable development in recent years. In [48] the authors analysed a multi-criteria problem of selecting a new function for historical buildings in light of the proposed selection criteria. Apart from the economic aspect and cultural heritage, these criteria also included sustainability. The Weighted Influence Non-linear Gauge System method (WINGS), which was extended to incorporate the uncertainty of expert opinions and their aggregation, was applied to model the structure of the problem and analyse the dependencies between alternatives and criteria. The method had to be extended because of the specificity of the problem discussed in the paper. The majority of previously used methods did not analyse interdependencies between decision-making criteria despite such interdependencies actually existing, as proven by the authors. Similarly, the authors of [49] proposed a multi-criteria hybrid model, using the Decision Making Trial and Evaluation Laboratory method (DEMATEL) and the Analytic Network Process (ANP) to select a utility function for the purpose of adapting the building of ‘Stara Polana’, located in Zakopane. Both in this publication and in [50], a group of experts and specialists used a questionnaire to assess dependencies between factors that affect the criterion of societal benefits and the benefits associated with preserving cultural heritage. These were some of the parameters selected for analysis and rating in association with the investigated alternative forms of adaptive reuse of the Stara Polana heritage site in Zakopane. The remaining parameters, associated with, among others, acoustics, vibrations or thermal comfort, were studied using specialist technical instruments. These interdisciplinary studies became a basis for a multi-criteria analysis performed using a proposed hybrid model of selecting a form of use for a heritage site adaptation project.

1.4. The Significance of the Method Proposed in the Article

The innovative method proposed in this paper is an important contribution to the professional toolkit of designers and can significantly aid real estate developers in tailoring their offering. The method presented by the authors includes elements and criteria that are important during many stages of the design process: the conceptual urban design and site plan stage, the conceptual and technical architectural stage, as well as the structural system design and building services design stages. It also pertains to project cost assessment in the context of building single-family residential NZEBs, which are an important part of the housing sector. This approach can be considered a holistic perspective of the design task and the project as a whole, which is both necessary and desirable from the point of view of sustainable design. The necessity of this approach has been confirmed by, among others, Garau and Pavan [51] in a broader context.
The method developed by authors assumes a multi-criteria analysis that includes aspects of sustainability, as well as the costs of the construction and occupancy of a complex of single-family houses. Sustainability parameters, such as the energy demand of the buildings and greenhouse gas emissions (depending on the given building variants and their siting) have been determined through analyses using the EnergyPlus tool [52]. The energy analysis took the life-cycle stages of the buildings into consideration. The cost parameter was determined by including direct and indirect costs, the costs of construction (taking technological and organisational constraints into consideration), as well as the costs of building occupancy—the authors performed calculations for different building types and urban layout alternatives. Indirect and direct costs, as well as construction costs, were determined using a specifically-tailored optimisation model and the concept of priority scheduling. Occupancy costs were calculated using energy demand and the discount rate. Using previously selected parameters as a basis, the authors carried out a multi-criteria analysis using the Weighted Aggregated Sum Product Assessment method (WASPAS). This made it possible to determine the optimal solution for the problem in question.

2. Methods

2.1. Method Overview

The design optimisation task analysed by the authors is an actual design problem. The analysed complex of forty experimental buildings was, at the time of the writing of thepaper, planned to be constructed in the municipality of Mogilany near Krakow, Poland. The developer must select one of several urban layout alternatives, which is to be optimal in terms of cost and energy demand minimisation, in addition to being compliant with the precepts of sustainable development and real estate market preferences. The urban layouts under analysis can differ in terms of building siting, as well as the size or type of buildings (detached, semi-detached, terraced). Criteria values were determined for these layouts. The criteria adopted for the analysis included: overall construction cost, building energy demand, greenhouse gas emissions associated with building occupancy, building thermal comfort and an assessment of the urban layout by potential buyers. After setting parameter values for all alternatives, the decision-maker (developer) can set the weights of each parameter. After preparing the data in the listed manner, the authors conducted a multi-criteria optimisation using the WASPAS method. A block scheme of the proposed method will be presented in Figure 1. The method of setting the values of individual criteria will be presented in the following sections of the article.

2.2. Setting Parameters

2.2.1. Overall Construction Cost

Despite the contribution of the aforementioned methods, the approach prepared by the authors of this paper features numerous advantages. Its greatest advantage is that it describes all of the included cost dependencies (direct costs, indirect costs, penalties for failing to meet contractual deadlines, penalties for failing to ensure continuity in the work of construction crews) and constraints in the form of a linear programming model. This allows one to quickly find the optimal solution (e.g., using the Simplex method). If we allow the possibility of altering the sequence of building the structures, the rapid calculation of the goal function in the discrete optimisation algorithm can be considered a significant advantage. The proposed model permits the overlap of the work of construction crews on different plots, which is a good reflection of the working conditions of an actual construction site. Furthermore, the model allows for flexible adherence to technological and organisational constraints. This means that the model permits certain departures from the constraints defined by the designer. However, these departures are optimal (minimal). This is of particular significance in the case of projects with a large (even exceedingly large) number of constraints, as one can encounter a situation where it is impossible to meet all of them. The model’s disadvantage is that it describes time-cost dependencies in linear form, which is a considerable simplification. Furthermore, the sequence of building the structures cannot be changed in the model. Both of these disadvantages will be studied further by the authors. The individual sections of the model have been discussed in [53,54].
The model has been defined as follows:
Given:
t g r i , j , k g r i , j , t n i , j , k n i , j , k i n d i r , k p i , k c j , T d i , T i S O , T i F O , T j S B , T j F B , C i , j O , C i , j B
where:
C i , j O = ( C T i , j O L , C W i , j O L , C T i , j O U , C W i , j O U )
C i , j B = ( C T i , j B L , C W i , j B L , C T i , j B U , C W i , j B U )
with decision variables:
t i , j , R i , j Z i , j , C K i , j O L , C K i , j O U , C K i , j B L , C K i , j B U , p i , n i
Goal function:
K ¯ = K d i r + K i n d i r + K p + K c + K C O + K C B m i n
where:
K d i r = i = 1 n j = 1 m ( t i , j · a i , j + b i , j )
K i n d i r = Z n , m · k i n d i r
K p = i = 1 n p i · k p i
K c = j = 1 m ( Z n , j R 1 , j i = 1 n t i , j ) k c j
K C O = i = 1 n ( C W i , j O L · C K i , j O L + C W i , j O U · C K i , j O U )
K C B = j = 1 m ( C W i , j B L · C K i , j B L + C W i , j B U · C K i , j B U )
Constraints:
t i , j t g r i , j
t i , j t n i , j
Z i , j = R i , j + t i , j
R i + 1 , j Z i , j + C T i , j O L C K i , j O L
R i + 1 , j Z i , j + C T i , j O U + C K i , j O U
R i , j + 1 Z i , j + C T i , j B L C K i , j B L
R i , j + 1 Z i , j + C T i , j B U + C K i , j B U
Z i , m p i T d i
R i , 1 T i S O
Z i , m T i F O
R 1 , j T j S B
Z n , j T j F B
t i , j , d i , j , s , R i , j , Z i , j , C K i , j O L , C K i , j O U , C K i , j B L , C K i , j B U , p i 0
In order for the presented model to be applied, the following data is required(1)–(3):
  • t g r i , j –limit completion time for task performed on building i by crew j;
  • k g r i , j —limit costs of task performed on building i by crew j;
  • t n i , j —standard completion time for task performed on building i by crew j;
  • k n i , j —standard completion cost of task performed on building i by crew j;
  • k i n d i r —indirect per unit cost of a multiple-structure project;
  • k p i —per unit cost of failing to meet a planned deadline for building i;
  • k c j —per unit cost of failing to maintain continuity of operation for crew j;
  • T d i —planned deadline for completing work on building i;
  • T i S O —earliest availability window of building i;
  • T i F O —latest availability window of building i;
  • T j S B —earliest availability window of crew j;
  • T j F B —latest availability window of crew j;
The parameters C i , j O = ( C T i , j O L , C W i , j O L , C T i , j O U , C W i , j O U ) and C i , j B = ( C T i , j B L , C W i , j B L , C T i , j B U , C W i , j B U ) are additional given data in the model, enabling the establishment of technological and organisational constraints. They have been described in the article at length [52].
The model’s decision variables (4) are as follows:
  • t i , j —task duration (i,j);
  • R i , j —task initiation time (i,j);
  • Z i , j . —task completion time (i,j);
  • p i —delay value relative to the planned deadline for building i;
  • in addition to variables that make it possible to establish technological and organisational constraints: C K i , j O L ,   C K i , j O U ,   C K i , j B L , C K i , j B U .
The goal function (5) is the sum of all essential project costs. Direct cost K d i r (6) is the sum of the costs of all works performed by all crews on all buildings, depending on the completion time of a given task. Direct cost includes the cost of labour, materials and equipment. It is assumed that a reduction in the task completion time, from a standard completion time to a limit time, is possible, but requires additional expenses. The dependency between the cost of completing a given task depends on the set standard and limit costs and is assumed to be linear. Therefore, the popular Critical Path Method Cost (CPM-COST) approach was incorporated into the model [55].The CPM-COST method enables the calculation of minimum direct costs, assuming the ability to shorten task completion time by incurring additional expenses when a fixed contractual deadline is imposed. Element (6) of the goal function and constraints (12)–(18) apply the assumptions of the CPM-COST method, extended to include flexible time couplings. Had the model included only (6) and (12)–(18), with parameters CT and CK removed, with the addition of the condition of meeting a contractual deadline, it would have been a classical CPM-COST model. The values ai,j and bi,j can be calculated using equations (25) and (26).
a i , j = k g r i , j k n i , j t g r i , j t n i , j  
b i , j = k g r i , j a i , j t g r i , j
Indirect cost K i n d i r (7) depends on the value of indirect per unit cost or the completion time of the entire multiple-structure project. Indirect per unit cost can be assessed using either a detailed or indicator-based method.
Costs associated with failing to meet planned deadlines K p (8) are set as the sum of the products of the per unit cost of failing to meet a deadline and the length of the delay for all buildings. the per unit cost of failing to meet a planned deadline can vary between buildings. The penalties for such are defined in the contract between the developer and the buyer and typically range between 0.05 and 1% of the contract value for every day of delay. For instance, in [56] the authors define the cost of failing to meet contractual deadlines as ca. 0.1% of contract value per day of delay. Additional conditions depend on the country and its legal environment.
Costs associated with pauses in the operation of crews K c (9) are calculated as the sum of the products of the per unit cost of pauses in crew operation and the length of the pause for all crews. The pause length is calculated on the basis of the earliest time the crew can complete its tasks on all buildings, the earliest time of initiation of work on the first building and the task completion times of the crew on all buildings.
In addition, the goal function includes the costs associated with failing to meet flexible couplings between tasks performed on successive buildings performed by the same crew K C O (10) as well as flexible time couplings between tasks performed by successive crews on each building K C B (11). The impact value of these couplings on the goal function for both types of couplings is calculated as the sum of the product of failing to meet the lower value of the flexible time coupling and the unit value for coupling failure, as well as the product of failing to meet the upper value of the flexible time coupling and the per unit value for coupling failure.
The following constraints have been included in the model. Constraints (12) and (13) constrain the task completion time to the limits between limit time and normal time. Constraint (14) enables the calculation of task completion times. Constraints (15)–(18) make it possible to determine the value of failing to meet appropriate flexible time couplings. Constraint (19) makes it possible to calculate the value of failing to meet the deadline of completing a given building. Constraints (20)–(23) implement the assumptions concerning the availability of every building and every crew. All decision variables used in the model are to take on non-negative values (24).
The goal function and all constraints are linear, which makes this a linear programming model. The Simplex method was used to solve the model [57].
The model described above is used to optimise a pre-set sequence of constructing buildings. In general, this sequence can be modifiable. Changing the building completion sequence affects the time and cost of completing the project. The authors plan to expand the model so that it will be able to optimise the sequence of constructing buildings. The proposed model was implemented using the Python programming language. The program can be obtained from the authors.

2.2.2. Energy Consumption

One of the criteria of assessing near-zero energy buildings (NZEBs) that are applicable in Poland is Primary Energy (PE), which cannot exceed the values stipulated in [34], and which differ depending on building type. For single-family residential buildings without cooling installations, the maximum PE value is 70 kWh/(m2/annum). The Primary Energy (PE) values for the analysed buildings are lower than the maximum values allowed by Polish law. Primary Energy values predominantly refer to the building’s sources of heating and electric power. Final Energy (FE) is a more precise indicator of material and building services solutions, as it results from a building’s overall energy performance balance. This is why this indicator was incorporated into the multi-criteria analysis presented in the article.
The energy consumption simulation for all of the analysed alternatives was performed using DesignBuilder, a program enabling dynamic simulations. It is based on an hourly calculation method. The calculation engine of the program is based on EnergyPlus. DesignBuilder uses EnergyPlus format hourly weather data to define external conditions during simulations. These hourly weather data sets are data derived from hourly observations at the chosen location—in this case, Krakow, Poland.

2.2.3. CO2 Emissions

A building consumes various natural resources, including water, materials and energy, and releases many pollutants and emissions during its life-cycle, i.e., from the raw material extraction to the final treatment of waste from the building’s demolition [58]. The authors assume that emissions generated by construction material production, the construction of the buildings or their demolition, will be highly similar for both building variants (detached, semi-detached). This is why only occupancy-related CO2 emissions were incorporated into the analysis, particularly as it is concordant with building energy performance calculations stipulated in Polish law [34].
The CO2 emission in EnergyPlus is calculated from Fuel Totals using a locally published CO2 emission factor for the specific region—in this case, Krakow. The consumed fuel (electricity for lighting and gas for DHW and Heating) is multiplied by the carbon emission factor. Based on emissions factors entered for a specific location, EnergyPlus calculates the mass or volume of CO2 (carbon dioxide) [52] The amount of CO2 produced depends on the carbon content of the fuel, and the amount of heat produced depends on its carbon and hydrogen content. Because natural gas, which is mostly methane (CH4), has a high hydrogen content, combustion of natural gas produces less CO2 for the same amount of heat produced from burning other fossil fuels [59].

2.2.4. Thermal Comfort

The methodology for determining thermal comfort is based on PN-EN ISO 7730 [60]. The thermal insulation of clothing was determined based on the PN-EN ISO 9920:2009 standard [61].
According to the ANSI/ASHRAE Standard 55-2010, Thermal comfort analyses were processed for indoor winter clothing (Icl  =  1 clo) for a typical winter week period, and summer clothing (Icl  =  0.5 clo) for a typical summer period. The lclo value of 0.7 is assumed for transitional periods over the year. The insulation of clothing was determined as the value for the transitional season of clothing worn indoors Iclo = 0.7 (clo). Determining the PMV (Predicted Mean Vote) indicator requires the calculation of the physical parameters of the analysed space, while considering energy expenditure and the thermal insulation properties of the clothes of the persons working inside. The calculated PMV value is compared with a seven-point psychophysical scale of thermal sensation which has been developed by Fanger [62] (Table 1). A comfortable environment in terms of microclimate (thermally neutral) can be considered to be within the 0.5 < PMV < +0.5 range [63]. Thermal comfort sensations on the Fanger scale have been presented in Table 1.
Thermal comfort evaluation analysis was performed for two periods:
  • A typical summer week—a week identified by the weather data translator software as being typical of summer.
  • A typical winter week—a week identified by the weather data translator software as being typical of winter.
The authors assumed that these periods will be suitable for the purpose of this paper as they represent weather conditions that are repeatable and most likely to happen every year. The Polish thermal comfort standard [60] does not indicate specific periods of the year for measurements.
Design Builder uses three different mathematical models to calculate Thermal Comfort: the one by Fanger (the Fanger Comfort Model), the Pierce Foundation model (the Pierce Two-Node Model), and the model developed by researchers from Kansas State University (the KSU Two-Node Model). For the purpose of this paper, the Fanger model was chosen and implemented for thermal comfort analysis based on the equation from ISO 7730. All PMV values are taken from dynamic simulation outputs.
The results of the thermal comfort simulation analysis will be compared with in-situ measurements when similar conditions occur once all of the buildings have been completed. One of the hottest days of the year was selected for the comparative analysis, i.e., 12.07.2018. The simulation was performed for the living rooms of each building.

2.2.5. Urban Layout

The selection of the urban layout of a housing complex must take the preferences of future residents into consideration. In order to determine the optimal layout, a survey was conducted among the potential users of the housing complex’s buildings. The respondents were presented with three urban layouts (Layout A, Layout B and Layout C) and asked to select the optimal urban layout in terms of housing comfort, their preferences and convenience. The survey was filled out by 31 middle-aged persons (30–50 years of age). The survey featured a three-point scale: a rating of 1; a rating of 2; a rating of 3. A rating 1 was given to the layout considered to be the most desirable by the respondent, a rating of 2 was given to the next-to-best layout and a rating of 3 was given to the least desirable of the layouts from the point of view the adopted assessment criteria.

2.3. MCDM Analysis—The WASPAS Method

The parameter sets selected by the authors (construction cost, energy demand, CO2 emission, thermal comfort, urban layout assessment) are diverse and cannot be directly compared. This is why the authors decided to utilise a multi-criteria decision-making approach. There are numerous MCDM methods, such as AHP, ANP, ELECTRE, BIPOLAR, TOPSIS and many others [64,65]. For this specific problem, the authors selected the WASPAS method. It is a method that combines two other methods: the Weighted Sum Model (WSM) and the Weighted Product Model methods (WPM) [66,67,68]. The WASPAS method was selected because of its mathematical simplicity and capacity to provide highly precise results when compared to the WSM and WPM methods. The WASPAS method is currently widely accepted as an effective decision-making support tool [68]. It is continuously being developed (e.g., by integrating a fuzzy approach) [69,70].
The WASPAS method requires a decision matrix to be prepared: X = [ x i , j ] m × n where x i , j is the value of alternative i in relation to criterion j, m is the number of alternatives and n is the number of criteria. Afterwards, matrix X is to be standardised according to the following formulae:
x ¯ i , j = x i , j m a x i   x i , j   for   criteria   which   are   stimulants
x ¯ i , j = m i n i   x i , j   x i , j   for   criteria   which   are   inhibitors
In order to calculate the importance of alternative i, the following formula is to be used:
Q i = λ j = 1 n x ¯ i , j w j + ( 1 λ ) j = 1 n ( x ¯ i , j ) w j
The optimal value of parameter λ can be calculated based on the formula below:
λ = σ 2 ( Q i ( 2 ) ) σ 2 ( Q i ( 1 ) ) + σ 2 ( Q i ( 2 ) )
where the values σ 2 ( Q i ( 1 ) ) and σ 2 ( Q i ( 2 ) ) can be calculated from the following formulae:
σ 2 ( Q i ( 1 ) ) = j = 1 n w j 2 σ 2 ( x ¯ i , j )
σ 2 ( Q i ( 2 ) ) = j = 1 n ( j = 1 n ( x ¯ i , j ) w j w j   ( x ¯ i , j ) w j ( x ¯ i , j ) ( 1 w j ) ) 2 σ 2 ( x ¯ i , j )
The approximate variance value for the standardised criteria is calculated using the formula:
σ 2 ( x ¯ i , j ) = ( 0.05 x ¯ i , j ) 2
The criteria adopted for the analysis using the WASPAS method have been presented in Figure 2. Of note is the weight selection process in the WASPAS method. The proposed method has been formulated with the developer in mind and it is they who make autonomous decisions concerning weight values, based on their own preferences. The method is a decision-making support tool for use by the developer and models their preferences.
In specific cases, the developer can use a different method of setting weights, e.g., using experts’ opinions. The WASPAS method was applied by the authors using a Microsoft Excel spreadsheet. It is a simple solution that can be helpful to the developer. All that needs to be done is to set the weights and individual numerical values for parameters. The spreadsheet will calculate a score for each layout and produce a ranking of said layouts. The Excel file can be obtained from the authors.

3. Case Study—Housing Complex in Mogilany near Krakow, Poland

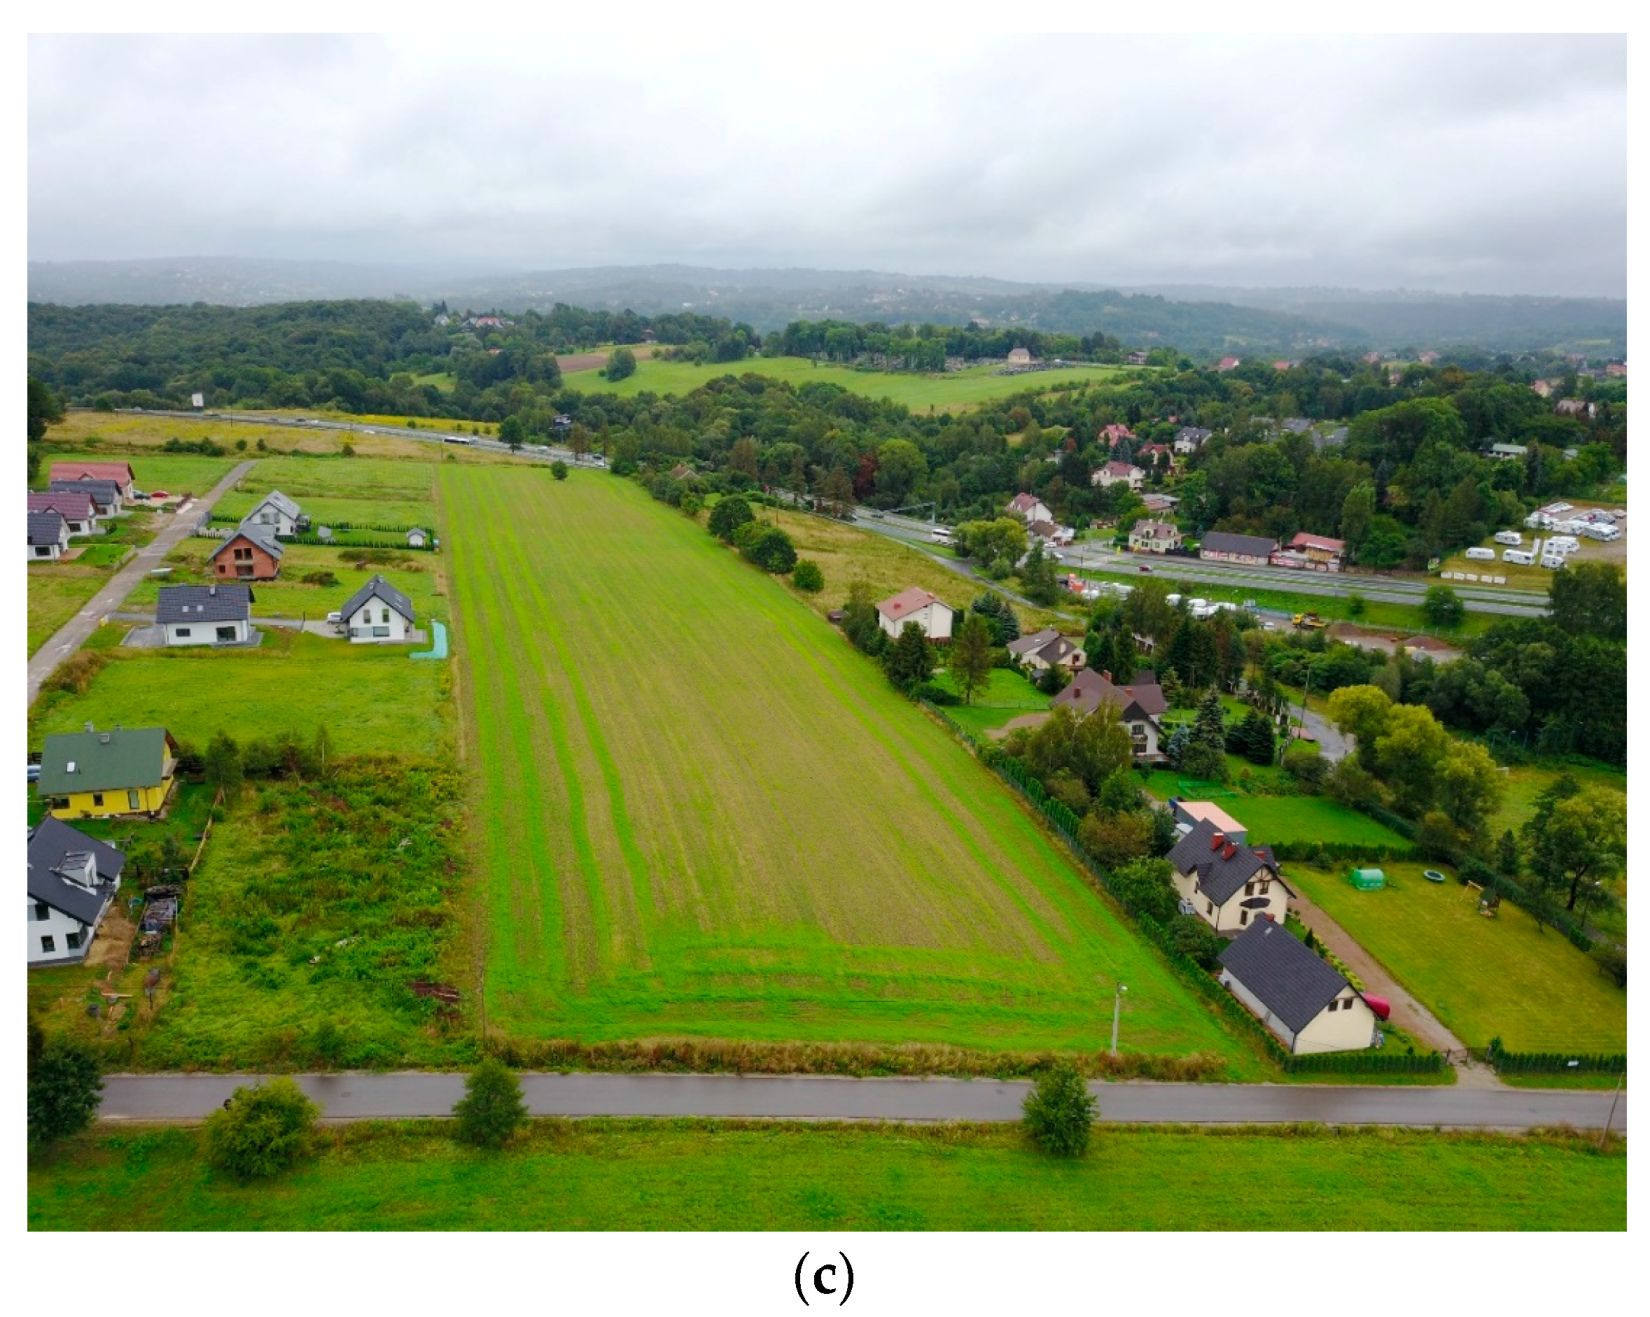
The planned housing complex which is the subject of the case study in this article is planned to be built on a 3-hectare plot in Libertów, in the municipality of Mogilany near Krakow, in the Lesser Poland Voivodship (Poland). The site is adjacent to an expressway which leads in the direction of Zakopane, a popular tourist destination located in the mountains. There is a lot of traffic along this road, particularly during weekends and holidays. The location of the experimental housing complex has been shown in Figure 3.
The site plan for the plot (MU1) has been shown in Figure 3b. Figure 3c shows an aerial view of the plot. The housing complex was assumed to be composed of 40 single-family residential buildings, with various building layouts (detached and/or semi-detached buildings).
Three proposals of the urban layout of the complex’s buildings were analysed (Layout A, B and C). They will be presented in Figure 4. The expressway runs near the plot, to its south-east (SE). To the north of the plot is the direction towards Krakow, while from the south, to the holiday resort—Zakopane. The urban layouts that were analysed are a reflection of the preferences of persons who buy single-family houses in Poland in terms of their view of property desirability. Their selection is the result of the actual housing market situation in Poland. The proposed urban layouts are options that the developer offers for sale to their clients on the open market. The authors are aware of the precepts of sustainable design concerning the planning of small-scale urban complexes, but in this case the intent is to provide an iteration of the method for a more market-oriented approach. The authors do not rule out preparing a modification of the method that would feature other sustainability metrics in the future.
Table 2 features a listing of the number of detached and semi-detached buildings for each layout alternative.
The housing complex will be composed of buildings with different floor areas and layouts. The types of individual buildings will be presented in Figure 5.
The buildings under analysis were assumed to be built using timber framing technology with thermal insulation composed of wood wool. The ground floor plan, assumed to have a usable floor area of 110 m2, in a detached building, is to be presented in Figure 5a, and in a semi-detached building—in Figure 5b. The geometric models of the buildings subjected to the analysis have been presented in Table 3. B1 type buildings are linked with a common wall that separates the bathrooms of both buildings.
The cost of individual buildings was calculated based on “Biuletyn cen obiektów budowlanych (BCO) część I a—obiekty kubaturowe” (in English: Construction price bulletin, Part Ia—buildings) [71]. It is a cost bulletin that lists the mean prices of buildings in Poland. The BCO can be used to estimate the cost of constructing buildings or their fragments for the purposes of cost assessment or preparing financial schedules for construction projects. Direct cost was assessed using the construction price bulletin and includes labour, construction materials and machinery. The completion time for individual works was estimated on the basis of available material costs catalogues. The values for completion times and costs were assessed for both types of buildings featured in the case under analysis. Table 4 includes the values for a detached building with a usable floor area of 110 m2.
In order to determine the overall construction costs, the following parameter values were assumed:
  • indirect construction costs, estimated at 400 €/day; Indirect costs include the general costs of construction (wages for the site director, works managers, construction site infrastructure costs), as well as management costs (the cost of maintaining the project, company offices, costs of office work, etc.). Indirect costs were assessed as per the construction price bulletin. The bulletin lists the value of indirect costs at a level of ca. 15% of the total cost. The cost per day was calculated using an estimate of the project’s duration.
  • costs of failing to meet planned deadlines, estimated at 150 €/per day of delay; Penalties for failing to meet planned deadlines are defined in contracts between the developer and the buyer of the building. There is no official data on this subject and in the experience of the authors such penalties in Poland can range from 0.05% to even 1% of a contract’s value per day of delay. It should be noted that penalties amounting to 0.5% of a contract’s value per day are not considered unjustified by Polish courts of law. Furthermore, it should be noted that the penalty is not applied when the developer cannot be held responsible for the cause of the delay. It is impossible to factor in unforeseen events that can cause delays and for which the developer is not responsible during the construction planning stage, which is why this aspect was ignored in the paper. A penalty value of 0.2% per day per individual building was assumed in the paper.
  • it was assumed that agreements with some contractors specified penalties for failing to ensure the continuity of crew operation. For the third crew, a 150 € penalty for each day of pause in the work was assumed, with 200 € per day assumed for the fourth crew. The penalty value for failing to ensure crew work continuity is a direct result of contracts with specific contractors. If a contractor performs a highly specialised section of the work, these penalties will be higher. This is why the third crew, which was assumed to assemble the innovative roof structure, and the fourth crew, which was assumed to handle building services installation, were assigned such high penalties for work discontinuity.
  • it was determined that the first building is to be completed within 90 days. Every subsequent building was to be completed 14 days after the completion of the previous one. Planned deadlines are a direct consequence of contracts or agreements between potential buyers and the developer.
In addition, it was assumed that technological continuity was to be maintained between footing, foundation wall construction and insulation application, as well as the construction of load-bearing walls, decks, roof structure and roofing.
Table 4 includes the standard and limit costs of construction work, as well as the standard and limit completion times for individual works.
The optimisation process produced schedules for each of the analysed layouts that were optimal in terms of cost. For layout A, an overall cost of 3034 thousand euro was obtained, along with an overall completion time of 629 days. For layout B, the costs amounted to 2928 thousand euro, while the overall completion time was 629 days. For layout C, the costs amounted to 3233 thousand euro and the overall completion time was 680 days. The completion time was taken into consideration when calculating the costs of failing to meet planned deadlines for each building.
The buildings under analysis were designed to have a timber frame structure. The external partitions of the analysed buildings were assumed to be built using timber framing technology. The technology selection was primarily dictated by the developer’s guidelines, who had the technical infrastructure enabling them to manufacture prefabricated timber elements. Figure 6 is to show a cross-section of the external wall.
U heat transfer coefficients [W/(m2K)] for elements of the buildings’ envelope were calculated in accordance with the methodology outlined in [72,73]. The U heat transfer coefficients have been listed in Table 5, along with the standard requirements for NZEBs applicable in Poland [34].
The windows of the buildings meet Polish requirements for NZEBs. They were partially fitted with external blinds. The geometry of the buildings was also subjected to optimisation. Their massing is simple and thermal bridges were minimised. Their orientation relative to the cardinal directions is determined by local development guidelines. The structure of the buildings, material choices and their mass were determined by the developer. The air-tightness of the external envelope of the buildings was assumed to be n50 = 1.5 [1/h]. In Polish regulations concerning building design [34] there are two requirements concerning building air-tightness. For buildings with gravitational ventilation it is a value of 3.5 air exchanges per hour [1/h], while for buildings with mechanical ventilation, the number of air exchanges per hour is 1.5 [1/h]. This is why the authors assumed a value of 1.5 [1/h]. The analysis was performed during the buildings’ design stage. At present, the first buildings have already been built. Air-tightness inspections performed on site indicate that the precise construction of the buildings has ensured a much greater air-tightness than initially assumed during the design stage. The air-tightness achieved during construction has a value of n50 = 0.6 [1/h], and is at a level expected of passive buildings [34]. The internal temperatures were assumed in accordance with the PN-EN 12831 standard [74].
Occupancy-related (metabolic) gains were defined in accordance with the ASHRAE 140/BESTEST standard [75], depending on the form of use of the spaces.
The buildings were assumed to be equipped with mechanical supply and exhaust ventilation with heat recovery. Supply air streams were assumed as in [76].
The Central Heating installation was designed in the form of gas-powered heating using a dual purpose gas-powered condensation boiler with a total efficiency rating of 0.95.
The indoor air temperature was assumed per PN-EN 12831:2006. Instalacje ogrzewcze w budynkach—Metoda obliczania projektowego obciążenia cieplnego—a Polish standard for heating installations governing methods of calculating heat loads during the design stage [74]. Per this standard, spaces for permanent occupancy by persons without outdoor clothing should be designed to have a temperature of +20 °C, while spaces meant for occupancy by persons potentially without clothing (such as bathrooms), should have a temperature of +24 °C. This temperature difference can be obtained by properly setting a building’s thermostats or by using BMS installations. Concerning the schedule, it was assumed that such temperatures should be kept 24 h per day throughout the entire year. In residential buildings with building automatics systems it is much easier to assume periods of lowered temperature (e.g., at night) or when residents leave the building to work. However, most buildings in Poland do not feature elaborate BMS installations. The analyses assumed the buildings to have such systems, which is why no temperature drops were accounted for.
Design Builder Software uses Occupancy model data which defines the number of people in a space and occupancy times according to a set schedule. The Occupancy schedule setting is also used to control internal gains and/or HVAC systems. In DesignBuilder, schedules can be used to define:
  • Occupancy times
  • Equipment, lighting HVAC operation
  • Heating and Cooling temperature setpoints
For the purpose of the simulation, the authors used a slightly modified Design Builder template with default data for residential buildings occupancy was used, to better reflect Polish living conditions, hours of work etc.
Lighting was designed in compliance with the PN-EN 12464-1:2012 standard [77]. Lighting was assumed to be energy-efficient, with a value of 3.3 [W/m2] per 100 [lux]. The lighting intensity level was assumed as in [78].
The remaining parameters were assumed in accordance with the principles of construction, technical knowledge and applicable standards.

4. Results

4.1. Energy Consumption of Central Heating and Domestic Hot Water Preparation

The yearly final energy consumption for the purposes of heating, ventilation, domestic hot water preparation and lighting is to be presented in Figure 7. The yearly final energy consumption for the analysed buildings has been presented in Table 6.
In the case of the 110 m2 house (B1/110), its external wall touches its “twin”, which results in an adiabatic zone and a heat transfer value of zero for these walls. This results in a lower final energy consumption for each pair of semi-detached buildings. Table 7 presents the yearly energy consumption for heating, ventilation and domestic hot water preparation for the entire complex.
The high operational energy demand has its source in the Polish definition of NZEBs. The general definition of nearly-zero energy buildings is provided in the Energy performance of buildings directive 2010/31/UE as “‘nearly zero-energy building’ means a building that has a very high energy performance, as determined in accordance with Annex I. The nearly zero or very low amount of energy required should be covered to a very significant extent by energy from renewable sources, including energy from renewable sources produced on-site or nearby”. However, every European Union Member State has adopted its own NZEB parameters, adapted to local conditions. In Poland, NZEBs are defined by the Ordinance on the Technical Conditions that Must be Met by Buildings and their Placement [34]. In the Polish definition of NZEBs there are two criteria. The first criterion is ensuring the proper building envelope thermal insulation. The heat transfer coefficients for external partitions in the analysed buildings are compliant with the values for NZEB buildings in Poland. The second criterion is for NZEBs in Poland pertains to Primary Energy value (PE), which cannot exceed a value set for different types of buildings. For single-family residential buildings without cooling, the maximum PE value is 70 kWh/(m2annum). In the article, the authors based their analyses on operational energy (OE), even though it is not listed in the requirements of the Polish NZEB definition. However, operational energy is more useful for the analyses performed by the authors than primary energy, which is a criterion for NZEBs in Poland. A definition of near-zero energy buildings for Poland has been included in the article. PE values were compared with maximum values for the Polish standard for NZEBs. The PE values for the analysed buildings are lower than the maximum values stipulated in Polish law, despite the fact that they are not fitted with renewable energy sources. This is why the authors define the buildings under analysis as NZEBs in their discussion. Table 8 shows the energy demand values for type A and type B buildings.

4.2. CO2 Emission in the Analysed Building Types

Calculation of CO2 emissions was based on [52,59]. The calculation of CO2 emissions is shown in Table 9.
The yearly CO2 emission for the entire complex (40 buildings) has been presented in Table 10.
CO2 emissions are associated with the amount of fuel consumed for heating, as well as other types of fuel, such as electric power associated with, among other things, lighting. The low CO2 emission of the buildings is also a product of their structural system. A reinforced concrete structure is associated with greater CO2 emissions relative to a timber structure [78].

4.3. Thermal Comfort in the Analysed Building Layouts

The thermal comfort assessment analysis was carried out in a typical summer week, characteristic of climate data considered in this article (Southern Poland, around Krakow). The authors assumed that this period would be appropriate for the purposes of this paper, because it represents weather conditions that are repetitive and will most likely occur every year at a given location (this is also an option resulting from the software). The thermal comfort analysis includes building use schedules and HVAC system operation, which are discussed in the article. Graph 11 shows the daily average PMV values that are used for comparison between the buildings analyzed. Figure 8 presents the average values of thermal comfort for the analysed buildings.
The buildings were designed as low energy and have a high degree of air tightness. In addition, they are not equipped with external solar screens, so they receive high solar heat gains thanks to large glazed surfaces. The PMV value of 0.7—1.27 during a sunny and warm summer week can be considered a predictable result [79].
Overheating in buildings, as simulations show, is a real problem in heavily insulated, airtight buildings with windows facing south. It was assumed that no shading elements, such as blinds, venetian blinds or brise-soleils would be installed on buildings. Such assumptions were intentional and are part of another research project, which aims to determine the extent to which solar barriers improve the comfort of using buildings with almost zero energy consumption. The buildings analysed in the article did not have solar barriers, which is why their interiors were overheated.
In order to improve the thermal comfort of the analysed buildings, additional shading mechanisms should be added (external louvers, blinds, etc.). The shape of greenery around the buildings should be adjusted to increase the amount of air supplied to the mechanical ventilation or air conditioning installations. The authors calculated the average value of thermal comfort for each system to compare different urban layouts. The thermal comfort value for system A is 1.075, 1.21 for system B and 0.94 for system C.

4.4. Assessment of the Analysed Urban Layouts

The results of the survey performed among the potential residents of the experimental housing complex have been presented in Figure 9. The number of persons listing a given layout as the most desirable one is indicated by the blue column (no. 1), the red column shows the number of persons who rated the given layout as the second-most desirable (no. 2), while the number of persons who rated the layout as the least desirable has been shown in green (no. 3).
The mean result of the surveys and the ranking of each layout has been presented in Table 11.
The respondents who selected Layout C as the most desirable reported that it was the layout that provided the most privacy (no adjacent neighbour). This layout was ranked as the most desirable by the greatest amount of respondents (16). Layout B was reported to be the least desirable by the largest amount of respondents (19). The respondents who rated this layout as the most desirable (rank 1) stressed their opinion as to lower construction and occupancy costs in semi-detached buildings when compared to other alternatives.

5. Results of the Multi-Criteria Analysis

Table 12 will present all of the results for each layout. As mentioned previously, the weights for each criterion, as included in the analysis, were set by the developer. They reflect the developer’s preferences concerning each criterion. The developer decided that the most important criterion was total construction cost (a weight of 0.55). As the buildings will be sold to individual clients, their price was a key factor. The developer also took thermal comfort (a weight of 0.2) and energy consumption (0.15) into consideration, as this was intended to encourage potential clients and raise the price of buildings. The developer saw CO2 emissions and urban layout assessment (each with a weight of 0.05) as the least important. Other weight values would produce different multi-criteria analysis results, which is why the authors also performed an analysis of the impact that weights can have on scores, as presented later in the paper.
The scores for each urban layout produced by the analysis have been presented in Table 13. The scores have been presented on the scale of the entire complex (40 buildings). The authors used the WASPAS method to obtain the results. This made it possible to determine the optimal solution in light of the analysed factors (assessment criteria).
We also performed a simulation for different criteria weight values using the WASPAS method. The randomly generated weights and their respective results are presented in Table 14.

6. Discussion and Conclusions

The results presented in Table 13 can aid the decision-maker in making decisions in selecting an architectural design alternative. The results were obtained for weights as defined by the developer and formulated to their individual preferences. An initial analysis of standardised values can provide valuable information about each alternative. Alternative B appears to clearly outrank the two other alternatives (highest value in four parameters). It also appears that alternative A is better than alternative C, as it has higher Q i scores in all parameters except thermal comfort. The WASPAS method confirms this analysis. Alternative B was selected as the best, followed by alternative A, with alternative C ranked the lowest. The differences in Q i scores were not significant (a difference of 1.5% and 2.8% relative to alternative B, for alternatives A and C, respectively).
An analysis of different weight values on the final results of the overall analysis was also performed (see Table 14). Generated with a uniform distribution, the weights and values from the Case Study were used to calculate Q i score values in the WASPAS method. Statistically, alternative B was indicated to be the best (it ranked first in 80% of cases). Of note is that alternative C (ranked first in 20% of cases) was shown to be markedly better than alternative A (no first ranks). Therefore, it can be concluded that alternative A was dominated by alternatives B and C, which indicates that it can be excluded from the decision-making process. Alternative C outranked alternative B when a sufficiently high value (ca. 0.3) was assigned to the weight associated with thermal comfort. It is interesting that alternative B received the lowest rank in 10% of cases. It was even outranked by alternative A when thermal comfort was assigned a weight with an appropriately high value (ca. 0.3) and urban layout assessment was assigned a low value (ca. 0.05). However, alternative C was shown to outrank the remaining alternatives each time when this was the case.
In the presented Case Study, only three alternatives of the design of the housing complex were formulated. The proposed model can be used to support decision-making problems with a greater number of alternatives. The method can also support the decision-maker in rejecting dominated alternatives, reducing the number of analysed alternatives.
It should be noted that analysing such complex cases, which incorporate parameters with different units, value ranges and significance, is impossible without using multi-criteria analysis methods. Despite the significant contribution of these methods to analysis, the decision-maker is irreplaceable. It is up to the individual to quantify their preferences and expectations and it is they who make the final decision. The method presented in the paper can only support them in this.
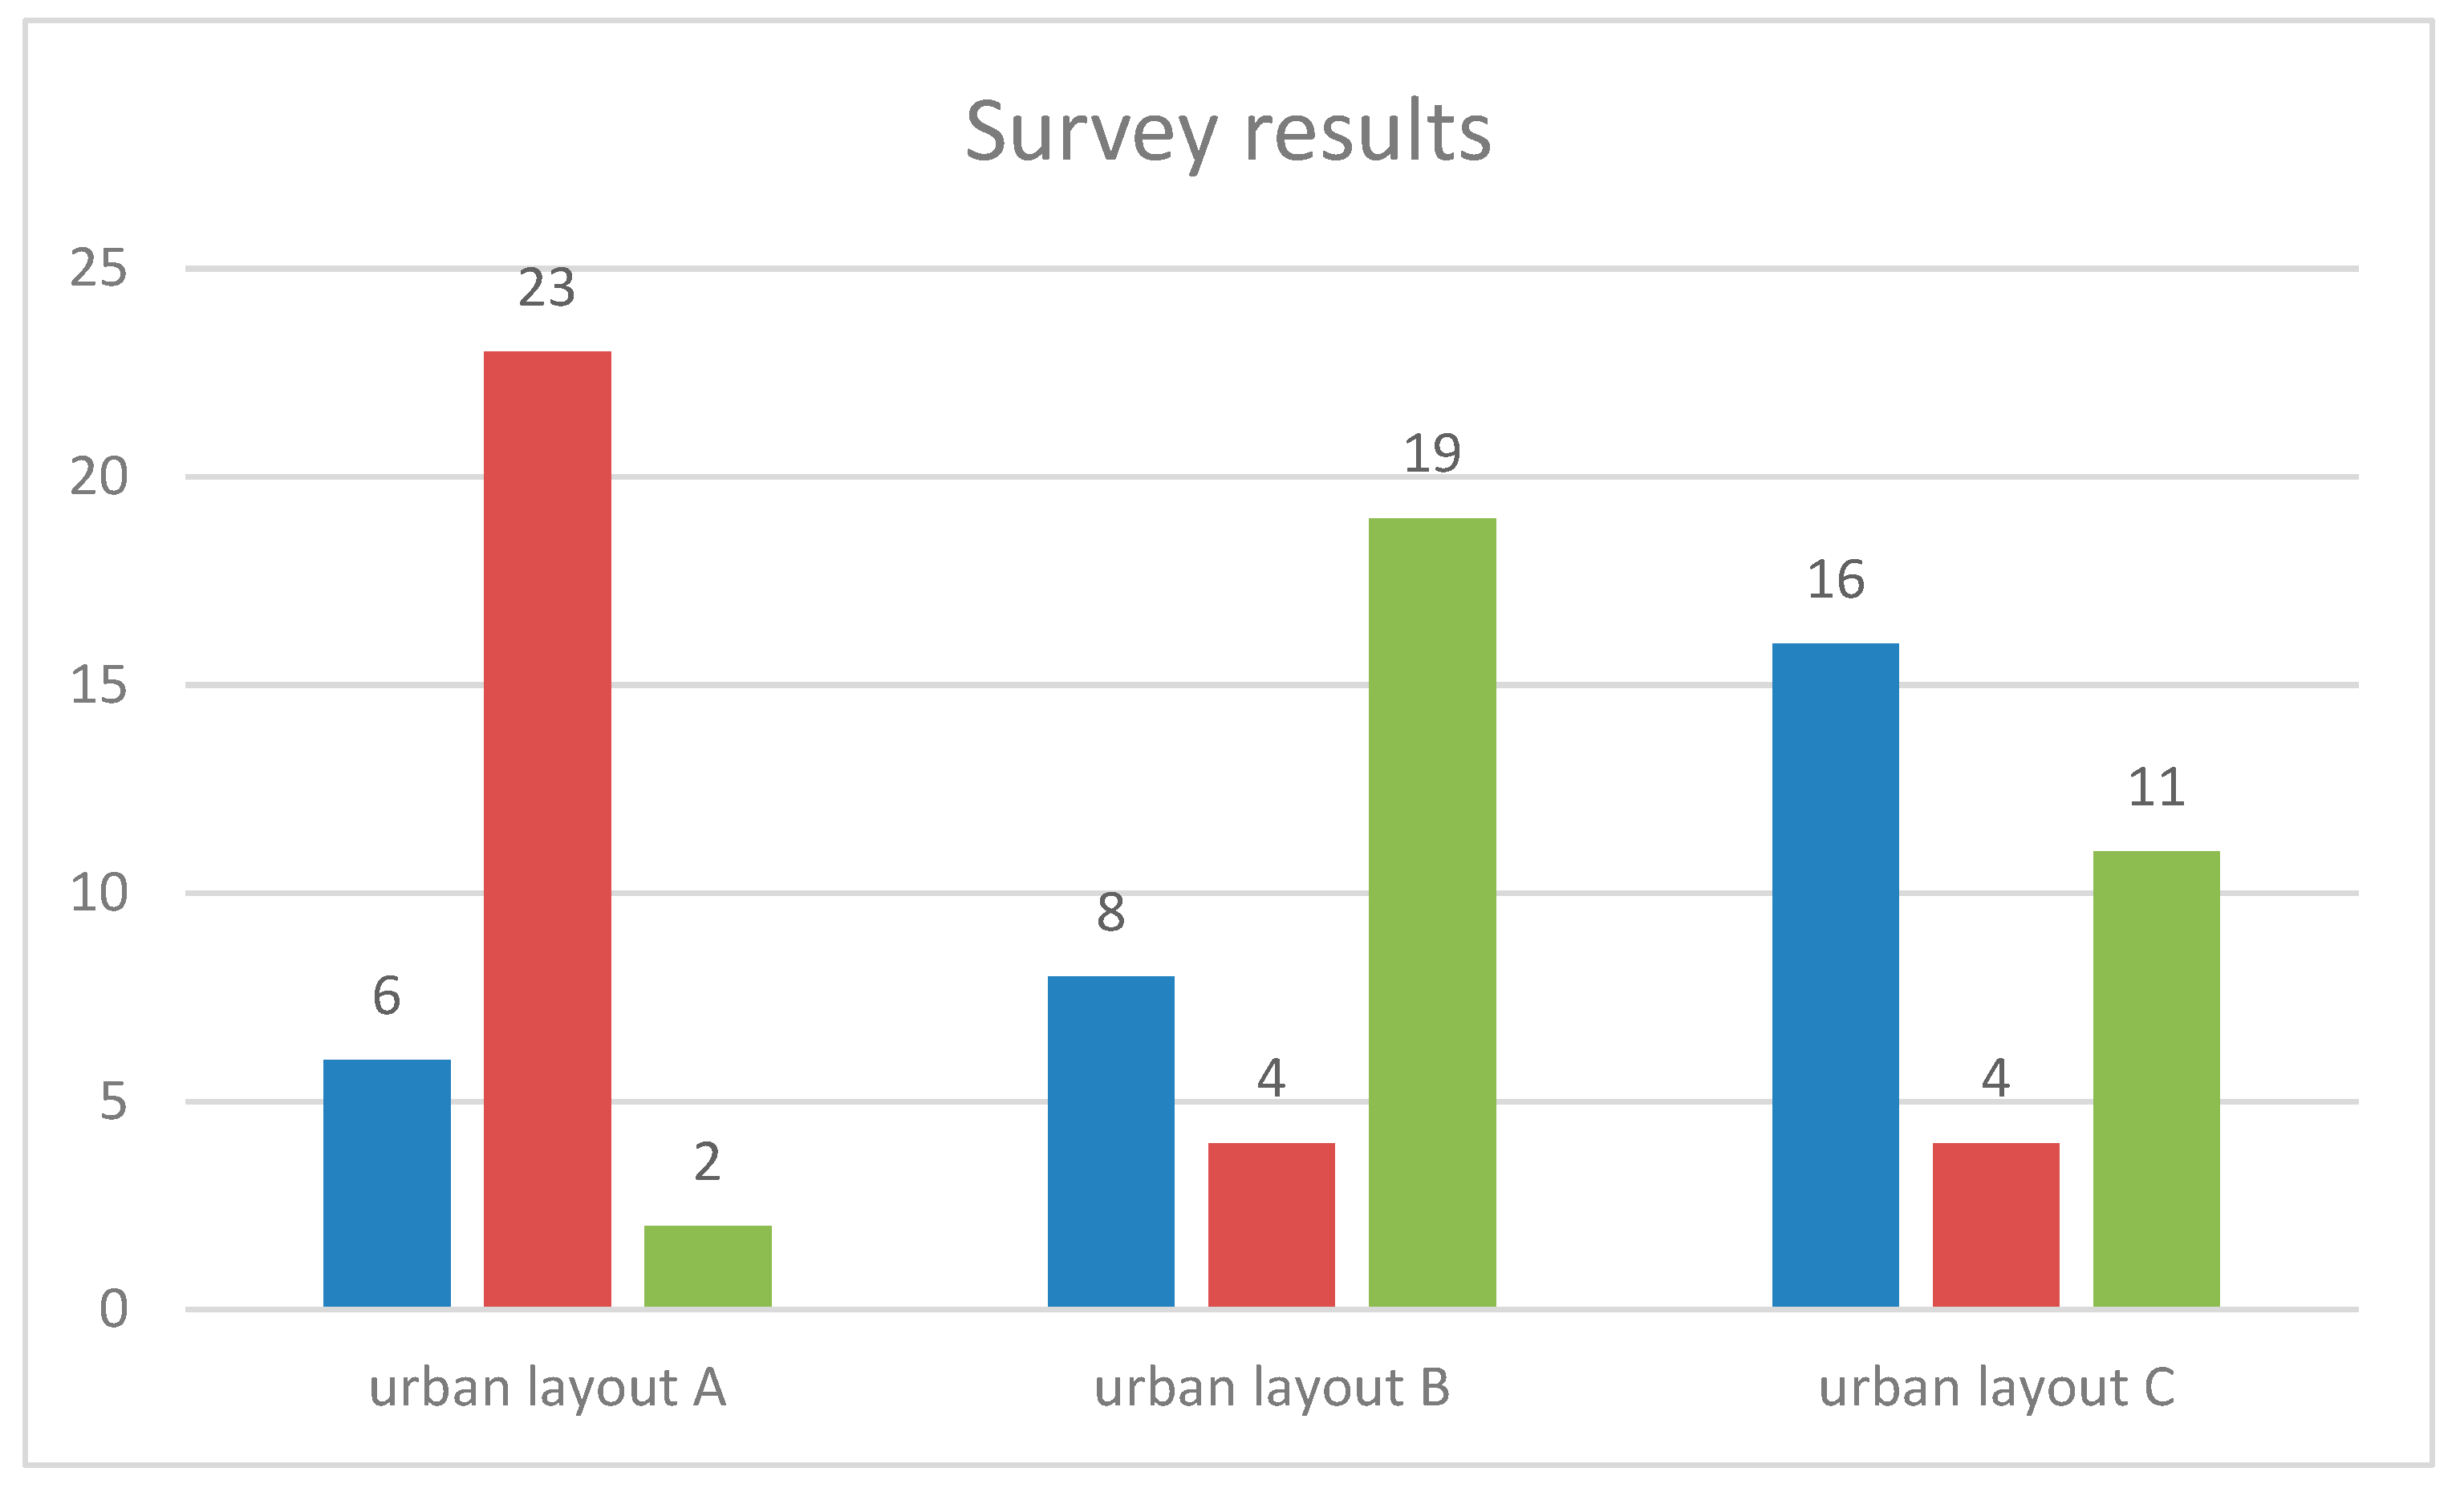
The work presents pioneering research associated with formulating a method of determining the optimal urban layout of a complex of single-family houses. The study took various cost factors into consideration. The method presented in the article is compliant with the concept of sustainable development. The article does not refer to the results of the work of other scholars as no direct counterparts were found in the literature. The discussion presented in the article covers the results of a multi-criteria assessment meant to aid in the selection of an optimal urban layout of timber single-family houses while taking different types of building layouts into account. The discussion concerning the results of the study took into consideration energy demand, the direct costs of construction and its organisation, occupancy costs, thermal comfort, energy consumption, greenhouse gas emissions and the results of a survey concerning preferences as to the proposed architectural and urban layouts conducted among potential home buyers. The authors assumed a goal function in the form of a sum of all essential costs, which, along with the constraints, is linear. The Simplex method was used to solve the linear model. Sustainability parameters were determined through analyses employing EnergyPlus code. Afterwards, using the procured data, a multi-criteria optimisation was performed, using the WASPAS method. The results of this optimisation made it possible to report a solution that can be considered optimal in light of the adopted assessment criteria.

Future Research Directions

Future analyses should automatically include the possibility of selecting construction materials, the shape of the buildings themselves and their placement. The user would define permissible alternatives and a computer program would, through discrete optimisation, set parameters that could prove useful in multi-criteria optimisation.

Author Contributions

Conceptualization, E.R.-Z. and M.F.-C.; methodology, E.R.-Z., B.S.; software, B.S., A.K.; validation, B.S., A.K., M.F.-C.; formal analysis, M.F.-C., B.S.; investigation, E.R.-Z., M.F.-C.; resources, M.F.-C.; data curation, T.T., E.R.-Z., M.F.-C.; writing—original draft preparation, B.S., A.K.; writing—review and editing, E.R.-Z., M.F.-C., K.B.; visualization, A.K., M.F.-C.; supervision, T.T., E.R.-Z., M.F.-C.; project administration and conclusion, T.T. All authors have read and agreed to the published version of the manuscript.

Funding

This research has received no external funding.

Conflicts of Interest

There are no conflicts of interest from authors.

References

  1. Radziszewska-Zielina, E.; Rumin, R. Analysis of investment profitability in renewable energy sources as exemplified by a semi-detached house. In Proceedings of the International Conference on the Sustainable Energy and Environment Development, SEED 2016, E3S Web Of Conferences, Kraków, Poland, 17–19 May 2016; Volume 10, p. 00079. [Google Scholar]
  2. Nijkamp, P.; Beinat, E. (Eds.) Multi-Criteria Analysis for Land Use Management; Kluwer Academic Publishers: Dordrecht, The Netherlands, 1998. [Google Scholar]
  3. Quinn, B.; Schiel, K.; Caruso, G. Mapping uncertainty from multi-criteria analysis of land development suitability, the case of Howth, Dublin. J. Maps 2015, 11, 487–495. [Google Scholar] [CrossRef]
  4. Blachowski, J.; Rybatkiewicz, W.; Warczewski, W.; Malczewski, P. Application of multi-criteria analysis in GIS for optimal planning of house development areas. Case study of Wrocław Functional Area. Roczniki Geomatyki 2016, 14, 561–571. [Google Scholar]
  5. Zeydan, M.; Bostanci, B.; Oralhan, B. A New Hybrid Decision Making Approach for Housing Sustainability Mapping of an Urban Area. Math. Probl. Eng. 2018. [Google Scholar] [CrossRef]
  6. Afshari, A.R.; Vatanparast, M.; Cockalo, D. Application of multi-criteria decision making to urban planning—A review. J. Eng. Manag. Comp. 2016, 6, 46–53. [Google Scholar] [CrossRef] [Green Version]
  7. Mokarram, M.; Aminzadeh, F. GIS-based Multicriteria Land Suitability Evaluation Using Ordered Weight Averages with Fuzzy Quantifier: A Case Study in Shavur Plain, Iran. Int. Arch. Photogram. Remote Sens. Spat. Inf. Sci. 2010, 38 Pt II, 508–512. [Google Scholar]
  8. Cinelli, M.; Stuart, R.; Coles, K.K. Analysis of the potentials of multi criteria decision analysis methods to conduct sustainability assessment. Ecol. Indic. 2014, 46, 138–148. [Google Scholar] [CrossRef] [Green Version]
  9. Kurka, T.; Blackwood, D. Selection of MCA methods to support decision making for renewable energy developments. Renew. Sustain. Energy Rev. 2013, 27, 225–233. [Google Scholar] [CrossRef]
  10. Qin, X.S.; Huang, G.H.; Chakma, A.; Nie, X.H.; Lin, Q.G. A MCDM-based expert system for climate change impact assessment and adaption planning—A case study for the Georgia Basin, Canada. Expert Syst. Appl. 2008, 34, 2164–2179. [Google Scholar] [CrossRef]
  11. Del Giudice, V.; de Paola, P.; Torrieri, F. An Integrated Choice Model for the Evaluation of Urban Sustainable Renewal Scenarios. Adv. Mater. Res. 2014, 1030–1032, 2399–2406. [Google Scholar] [CrossRef]
  12. Lahdelma, R.; Salminen, P.; Hokkanen, J. Using Multi-criteria Methods in Environmental Planning and Management. Environ. Manag. 2000, 26, 595–605. [Google Scholar] [CrossRef]
  13. Wang, J.-J.; Jing, Y.-Y.; Zhang, C.-F.; Zhao, J.-H. Review on multi-criteria decision analysis aid in sustainable energy decision-making. Renew. Sustain. Energy Rev. 2009, 13, 2263–2278. [Google Scholar] [CrossRef]
  14. Nesticò, A.; Sica, F. The sustainability of urban renewal projects: A model for economic multi-criteria analysis. J. Property Invest. Financ. 2017, 35, 397–409. [Google Scholar] [CrossRef]
  15. Si, J.; Marjanovic-Halburd, L.; Nasiri, F.; Bell, S. Assessment of building-integrated green technologies: A review and case study on applications of Multi-Criteria Decision Making (MCDM) method. Sustain. Cities Soc. 2016, 27, 106–115. [Google Scholar]
  16. Erdogan, S.A.; Saparauskas, J.; Turskis, Z. A Multi-Criteria Decision-Making Model to Choose the Best Option for Sustainable Construction Management. Sustainability 2019, 11, 2239. [Google Scholar] [CrossRef] [Green Version]
  17. Guarini, M.R.; D’Addabbo, N.; Morano, P.; Tajani, F. Multi-Criteria Analysis in Compound Decision Processes: The AHP and the Architectural Competition for the Chamber of Deputies in Rome (Italy). Buildings 2017, 7, 38. [Google Scholar] [CrossRef] [Green Version]
  18. Juodagalviene, B.; Turskis, Z.; Saparauskas, J.; Endriukaityte, A. Integrated multi-criteria evaluation of house’s plan shape based on the EDAS and SWARA methods. Eng. Struct. Technol. 2017, 9, 117–125. [Google Scholar] [CrossRef] [Green Version]
  19. Turskis, Z.; Juodagalvienė, B. A novel hybrid multi-criteria decision-making model to assess a stairs shape for dwelling houses. J. Civ. Eng. Manag. 2016, 22, 1055–1065. [Google Scholar] [CrossRef] [Green Version]
  20. Kamal, A. Suitability for Infill Development: A multi-criteria and Spatial Assessment Approach. In Proceedings of the EAAE-ARCC International Architectural Research Conference, Honolulu, HI, USA, 12–15 February 2014; pp. 336–345. [Google Scholar]
  21. Elango, M.; Devadas, M.D. Multi-Criteria Analysis of the Design Decisions in Architectural Design Process during the Pre-Design Stage. Int. J. Eng. Technol. 2014, 6, 1033–1046. [Google Scholar]
  22. Bostancioglu, E. Effect of building shape on a residential buildings construction cost, energy and life cycle costs. Archit. Sci. Rev. 2010, 53, 441–467. [Google Scholar] [CrossRef]
  23. Guarini, M.R.; Battisti, F.; Chiovitti, A. A Methodology for the Selection of Multi-Criteria Decision Analysis Methods in Real Estate and Land Management Processes. Sustainability 2018, 10, 507. [Google Scholar] [CrossRef] [Green Version]
  24. Uysal, F.; Tosun, O. Multi criteria analysis of the residential properties in Antalya using TODIM method. 2nd World Conference on Business, Economics and Management—WCBEM 2013. Procedia—Soc. Behav. Sci. 2014, 109, 322–326. [Google Scholar] [CrossRef] [Green Version]
  25. Tawfik, H.; Nagar, A.; Fernando, T. Multi-Criteria Spatial Analysis of Building Layouts. Issus Inf. Sci Inf. Technol. 2007, 4, 781–789. [Google Scholar]
  26. Koenig, R.; Standfest, M.; Schmitt, G. Evolutionary multi-criteria optimization for building layout planning. In Proceedings of the 32nd eCAADe Conference, Newcastle upon Tyne, UK, 10–12 September 2014; Volume 2, pp. 567–574. [Google Scholar]
  27. Koenig, R.; Schmitt, G.; Standfest, M.; Chirkin, A.; Klein, B. Cognitive computing for urban planning. In The Virtual and the Real in Planning and Urban Design; Routledge: London, UK, 2017; pp. 93–111. [Google Scholar]
  28. Koenig, R. Urban Design Synthesis for Building Layouts Based on Evolutionary Many-Criteria Optimization. Int. J. Archit. Comput. 2015, 13, 257–269. [Google Scholar]
  29. Miao, Y.; Koenig, R.; Knecht, K.; Buš, P.; Chang, M.C. Computational urban design prototyping: Interactive planning synthesis methods—A case study in Cape Town. Int. J. Archit. Comput. 2018, 16, 212–226. [Google Scholar] [CrossRef]
  30. Eurostat. Housing Statistics 2017. Available online: https://ec.europa.eu/eurostat/statistics-explained/index.php/Housing_statistics#Type_of_dwelling (accessed on 3 February 2020).
  31. Główny Urząd Nadzoru Budowlanego, Ruch Budowlany w 2018 r. Available online: https://www.gunb.gov.pl/aktualnosc/ruch-budowlany-w-2018-r (accessed on 3 February 2020).
  32. Joosten, H.; Wisman, H.; Klaver, S. Housing Markets in Perspective 2016, BPD Ontwikkeling BV 2016. Available online: https://www.bpdeurope.com/media/107467/q540_bpd_dunefra-2016_engels-lr-web.pdf (accessed on 3 February 2020).
  33. Directive 2010/31/EU of The European Parliament and of The Council of 19 May 2010 on the energy performance of buildings. Off. J. Eur. Union 2010, 18, 13–35.
  34. Rozporządzenie Ministra Infrastruktury w Sprawie Warunków Technicznych, Jakim Powinny Odpowiadać Budynki i ich Usytuowanie (Codified Text: Dz. U. RP 2019 pos. 1065 as amended). Available online: http://prawo.sejm.gov.pl/isap.nsf/download.xsp/WDU20150001422/O/D20151422.pdf (accessed on 3 February 2020).
  35. Markiewicz, P. Smart Project & building—BIM-standard design of energy efficient buildings. Hous. Environ. 2017, 21, 72–82. [Google Scholar]
  36. Fedorczak-Cisak, M.; Furtak, M.; Knap, K.; Kotowicz, A. Energy and cost analysis of windows in low-energy buildings: The influence of windows on the comfort of use of rooms. In Proceedings of the WMCAUS 2018: World Multidisciplinary Civil Engineering—Architecture—Urban Planning Symposium, Prague, Czech Republic, 18–22 June 2018. [Google Scholar]
  37. Piasecki, M.; Kostyrko, K. Indoor environmental quality assessment, part 2: Model reliability analysis. J. Build. Phys. 2018, 42, 288–315. [Google Scholar] [CrossRef]
  38. Zastawna-Rumin, A.; Nowak, K. Experimental thermal performance analysis of building components containing phase change material (PCM). Procedia Eng. 2015, 108, 428–435. [Google Scholar] [CrossRef] [Green Version]
  39. Yarbrough, D.; Bomberg, M.; Romanska-Zapala, A. On the next generation of low energy buildings. Adv. Build. Res. 2019. [Google Scholar] [CrossRef]
  40. Romanska-Zapala, A.; Bomberg, M.; Yarbrough, D. Buildings with environmental quality management: Part 4: A path to the future NZEB. J. Build. Phys. 2019, 43, 3–21. [Google Scholar] [CrossRef]
  41. Yarbrough, D.; Bomberg, M.; Romanska-Zapala, A. Buildings with environmental quality management, part 3: From log houses to environmental quality management zero-energy buildings. J. Build. Phys. 2019, 42. [Google Scholar] [CrossRef]
  42. Romanska-Zapala, A.; Furtak, M.; Dechnik, M. Cooperation of Horizontal Ground Heat Exchanger with the Ventilation Unit During Summer—Case Study. In Proceedings of the World Multidisciplinary Civil Engineering-Architecture-Urban Planning Symposium—WMCAUS, IOP Conference Series-Materials Science and Engineering, World Multidisciplinary Civil Engineering-Architecture-Urban Planning Symposium (WMCAUS), Prague, Czech Republic, 12–16 June 2017. [Google Scholar] [CrossRef]
  43. Rogalska, M.; Bożejko, W.; Hejducki, Z. Time/cost optimization using hybrid evolutionary algorithm in construction project scheduling. Autom. Constr. 2008, 18, 24–31. [Google Scholar] [CrossRef]
  44. Agrama, F. Multi-objective genetic optimization for scheduling a multi-storey building. Autom. Constr. 2014, 44, 119–128. [Google Scholar] [CrossRef]
  45. Ipsilandis, P.G. Multiobjective linear programming model for scheduling linear repetitive projects. J. Cosntr. Eng. Manag. 2007, 133, 417–424. [Google Scholar] [CrossRef]
  46. Śladowski, G.; Szewczyk, B.; Sroka, B.; Radziszewska-Zielina, E. Using stochastic decision networks to assess costs and completion times of refurbishment work in construction. Symmetry 2019, 11, 398. [Google Scholar] [CrossRef] [Green Version]
  47. Radziszewska-Zielina, E. The Application of Multi-Criteria Analysis in the Evaluation of Partnering Relations and the Selection of a Construction Company for the Purposes of Cooperation. Arch. Civ. Eng. 2016, 2, 167–182. [Google Scholar]
  48. Radziszewska-Zielina, E.; Śladowski, G. Supporting the Selection of a Variant of the Adaptation of a Historical Building with the Use of Fuzzy Modelling and Structural Analysis. J. Cult. Herit. 2017, 26, 53–63. [Google Scholar] [CrossRef]
  49. Fedorczak-Cisak, M.; Kowalska, A.; Radziszewska-Zielina, E.; Sladowski, G.; Pachla, F.; Tatara, T. A multicriteria approach for selecting the utility function of the historical building “Stara Polana” located in Zakopane. MATEC Web Conf. 2019, 262, 07002. [Google Scholar] [CrossRef]
  50. Fedorczak-Cisak, M.; Kowalska-Koczwara, A.; Nering, K.; Pachla, F.; Radziszewska-Zielina, E.; Śladowski, G.; Tatara, T.; Ziarko, B. Evaluation of the Criteria for Selecting Proposed Variants of Utility Functions in the Adaptation of Historic Regional Architecture. Sustainability 2019, 11, 1094. [Google Scholar] [CrossRef] [Green Version]
  51. Garau, C.; Pavan, V.M. Evaluating Urban Quality: Indicators and Assessment Tools for Smart Sustainable Cities. Sustainability 2018, 10, 575. [Google Scholar] [CrossRef] [Green Version]
  52. Big Ladder Software; Engineering Reference—EnergyPlus 8.0,). Available online: https://bigladdersoftware.com/epx/docs/8-0/engineering-reference/ (accessed on 3 February 2020).
  53. Radziszewska-Zielina, E.; Sroka, B. Priority Scheduling in the Planning of Multiple-Structure Construction Projects. Arch. Civ. Eng. 2017, 64, 21–23. [Google Scholar] [CrossRef] [Green Version]
  54. Radziszewska-Zielina, E.; Sroka, B. Linearised CPM-COST model in the planning of construction projects. Procedia Eng. 2017, 208, 129–135. [Google Scholar] [CrossRef]
  55. Jaśkowski, P.; Sobotka, A.; Czarnigowska, A. Decision model for planning material supply channels in construction. Autom. Constr. 2018, 90, 235–242. [Google Scholar] [CrossRef]
  56. Sonmez, R.S.; Bettemir, Ö.H. A hybrid genetic algorithm for the discrete time-cost trade-off problem. Exp. Syst. A 2012, 39, 11428–11434. [Google Scholar] [CrossRef] [Green Version]
  57. Nelder, J.A.; Mead, R. A Simplex Method for Function Minimization. Comput. J. 1965, 7, 308–313. [Google Scholar]
  58. De Ruggiero, M.; Forestiero, G.; Manganelli, B.; Salvo, F. Buildings Energy Performance in a Market Comparison Approach. Buildings 2017, 7, 16. [Google Scholar] [CrossRef]
  59. U.S. Energy Information Administration. Where Greenhouse Gases Come From. Mon. Energy Rev. 2017. Environment. Available online: https://www.eia.gov/energyexplained/energy-and-the-environment/where-greenhouse-gases-come-from.php (accessed on 3 February 2020).
  60. Polski Komitet Normalizacyjny. PN-EN ISO 7730:2006 Ergonomia Środowiska Termicznego—Analityczne Wyznaczanie i Interpretacja Komfortu Termicznego z Zastosowaniem Obliczania Wskaźników PMV i PPD oraz Kryteriów Miejscowego Komfortu Termicznego; PKN: Warszawa, Poland, 2006. [Google Scholar]
  61. Polski Komitet Normalizacyjny. PN-EN ISO 9920:2009 Ergonomia środowiska Termicznego—Szacowanie Izolacyjności Cieplnej i Oporu Pary Wodnej Zestawów Odzieży; PKN: Warszawa, Poland, 2009. [Google Scholar]
  62. Fanger, P.O. Komfort Cieplny; Arkady: Warszawa, Poland, 1974. [Google Scholar]
  63. Klemm, P. Budownictwo Ogólne—Fizyka Budowli; Arkady Publishing House: Warszawa, Poland, 2010; pp. 54–55. [Google Scholar]
  64. Suárez, R.; Escandón, R.; López-Pérez, R.; León-Rodríguez, A.; Klein, T.; Silvester, S. Impact of Climate Change: Environmental Assessment of Passive Solutions in a Single-Family Home in Southern Spain. Sustainability 2018, 10, 2914. [Google Scholar] [CrossRef] [Green Version]
  65. Surahman, U.; Kubota, T.; Higashi, O. Life Cycle Assessment of Energy and CO2 Emissions for Residential Buildings in Jakarta and Bandung, Indonesia. Buildings 2016, 5, 1131. [Google Scholar] [CrossRef] [Green Version]
  66. Chakraborty, S.; Zavadskas, E.; Antucheviciene, J. Applications of WASPAS method as a multi-criteria decision-making tool. Econ. Comput. Econ. Cybern. Stud. Res. 2015, 49, 5–22. [Google Scholar]
  67. Chakraborty, S.; Zavadskas, E.K. Applications of WASPAS Method in Manufacturing Decision Making. Inform. Lith. Acad. Sci. 2014, 25, 1–20. [Google Scholar]
  68. Zavadskas, E.; Antucheviciene, J.; Šaparauskas, J.; Turskis, Z. MCDM methods WASPAS and MULTIMOORA: Verification of robustness of methods when assessing alternative solutions. Econ. Comput. Econ. Cybern. Stud. Res. 2013, 47, 5. [Google Scholar]
  69. Turskis, Z.; Zavadskas, E.K.; Antucheviciene, J.; Kosareva, N. A hybrid model based on fuzzy AHP and fuzzy WASPAS for construction site selection. Int. J. Comput. Commun. Control 2015, 10, 873–888. [Google Scholar] [CrossRef]
  70. Turskis, Z.; Goranin, N.; Nurusheva, A.; Boranbayev, S. A Fuzzy WASPAS-Based Approach to Determine Critical Information Infrastructures of EU Sustainable Development. Sustainability 2019, 11, 424. [Google Scholar] [CrossRef] [Green Version]
  71. SEKOCENBUD. Biuletyn cen Obiektów Budowlanych (BCO) część I a—Obiekty Kubaturowe; SEKOCENBUD: Warszawa, Poland, 2019. [Google Scholar]
  72. Polski Komitet Normalizacyjny. PN-EN 6946 Komponenty budowlane i elementy budynku—Opór cieplny i współczynnik przenikania ciepła—Metoda obliczani; PKN: Warszawa, Poland, 2017. [Google Scholar]
  73. Polski Komitet Normalizacyjny. PN-EN 13370 Cieplne właściwości użytkowe budynków—Przenoszenie ciepła przez grunt—Metody obliczania; PKN: Warszawa, Poland, 2017. [Google Scholar]
  74. Polski Komitet Normalizacyjny. PN-EN 12831 Charakterystyka energetyczna budynków—Metoda obliczania projektowego obciążenia cieplnego—Część 1: Obciążenie cieplne; PKN: Warszawa, Poland, 2017. [Google Scholar]
  75. American Society of Heating, Refrigerating and Air-Conditioning Engineers. Standard 140-2017—Standard Method of Test for the Evaluation of Building Energy Analysis Computer Programs (ANSI Approved); American Society of Heating, Refrigerating and Air-Conditioning Engineers: Atlanta, GA, USA, 2017. [Google Scholar]
  76. Firląg, S. Zrównoważone Budynki Biurowe; PWN Scientific Publisher: Warszawa, Poland, 2018; Volume I, pp. 260–270. [Google Scholar]
  77. Polski Komitet Normalizacyjny. PN-EN 12464-1:2012 Światło i oświetlenie—Oświetlenie miejsc pracy—Część 1: Miejsca pracy we wnętrzach; PKN: Warszawa, Poland, 2011. [Google Scholar]
  78. Michałowski, B.; Marcinek, M.; Tomaszewska, J.; Czernik, S.; Piasecki, M.; Geryło, R.; Michalak, J. Influence of Rendering Type on the Environmental Characteristics of Expanded Polystyrene-Based External Thermal Insulation Composite System. Buildings 2020, 10, 47. [Google Scholar] [CrossRef] [Green Version]
  79. Dudzińska, A.; Kotowicz, A. Features of Materials versus Thermal Comfort in a Passive Building. Procedia Eng. 2015, 108, 108–115. [Google Scholar] [CrossRef] [Green Version]
Figure 1. Method of selecting the urban layout of a complex of single-family houses.
Energies 13 01541 g001
Figure 2. Criteria adopted for the WASPAS analysis.
Energies 13 01541 g002
Figure 3. (a): Location of the experimental housing complex relative to the Krakow agglomeration; (b): Zoning plan of the plot assigned for the construction of the experimental housing complex; (c): View of the plot assigned for the construction of the experimental housing complex, as seen from a birds-eye view.
Energies 13 01541 g003aEnergies 13 01541 g003b
Figure 4. (a): Urban layout for alternative A; (b): Urban layout for alternative B; (c): Urban layout for alternative C.
Energies 13 01541 g004aEnergies 13 01541 g004b
Figure 5. (a): Ground floor plan of a detached building with a usable floor area of 110 m2 (variant W1); (b): semi-detached building (variant B1).
Energies 13 01541 g005
Figure 6. Cross-section through the external walls of the analysed buildings.
Energies 13 01541 g006
Figure 7. Yearly energy consumption for heating, domestic hot water preparation and lighting in the analysed buildings. B1 (semi-detached building), W1 (detached building).
Energies 13 01541 g007
Figure 8. Thermal comfort for building B1/110.
Energies 13 01541 g008
Figure 9. Survey results concerning the preferences of potential residents of the housing complex in Libertów.
Energies 13 01541 g009
Table 1. The seven-point PMV scale by Fanger.
+3 hot0 neutral (thermal comfort)−1 slightly cool
+2 warm−2 cool
+1 slightly warm−3 cold
Table 2. List of buildings of each type for layout alternatives A, B and C.
Building Version/DescriptionNumber of Buildings
Layout alternativeABC
W1/110m2 detached20040
B1/110m2 semi-detached20400
Table 3. Geometric models of the analysed buildings.
TypeUsable Floor Area [m2]Geometric Model
W1110 Energies 13 01541 i001
B1110 × 2 Energies 13 01541 i002
Table 4. Standard and limit costs of construction work and standard and limit construction work completion times, listed for individual works for a detached building with a floor area of 110 m2.
Crew NumberTask DescriptionStandard Work Cost [Euro]Total Limit Cost [Euro]Standard Completion Time [Days]Limit Time [Days]
123456
1Excavation1100125032
2Footing, foundation wall and damp proof course915010,150128
3Load-bearing walls, decks, roof and roofing23,15025,4002516
4Building services assembly16,10017,4001711
5Interior finishes (plasters, painting, door and window fitting, partition wall construction)14,60016,0002013
6External finishes34503850106
Table 5. Heat transfer coefficients for elements of the buildings’ envelope.
Item No.Envelope ElementU Coefficient (Analysed Building) [W/(m2K)]U Coefficient (Requirements for NZEBs in Poland) [W/(m2K)]
1External wall0.120.20
2Roof0.130.15
3Slab on grade0.100.30
4External doors1.31.3
6Windows0.8 (g = 0.64)0.9
7Roof windows1.1 (g = 0.64)1.1
Table 6. Yearly final energy consumption for the analysed buildings.
Building Type/CharacteristicFinal Energy (FE) for Heating [KWh/(m2annum)]FE Domestic Hot Water [KWh/(m2annum)]Total FE [KWh/(m2annum)]
W1/110 m2 detached32.014.946.9
B1/110 m2 semi-detached28.714.943.6
Table 7. Summary for Layouts A, B and C, comprised of 40 buildings each.
Building Type/CharacteristicLayout A
Number of Buildings in the LayoutEnergy Consumption for Heating [kWh/(m2annum)]Total Energy Consumption [kWh/(m2annum)]
W1/110 m2 detached2046.920 × 46.9 = 938.00
B1/110 m2 semi-detached2043.620 × 43.6 = 872.00
TOTAL 1810.00
Layout B
W1/110 m2 detached046.90.00
B1/110 m2 semi-detached4043.640 × 43.6 = 1 744.00
TOTAL 1744.00
Layout C
W1/110 m2 detached4046.940 × 46.9 = 1 876.00
B1/110 m2 semi-detached043.60.00
TOTAL 1876.00
Table 8. Demand for different types of energy for type A and type B buildings
Building ABuilding BRequirements for NZEBs in Poland
Building floor area [m2]114.2114.2-
FEH + W [kWh/(m2annum)]46.943.6-
FEpom [kWh/(m2annum)]5.95.9-
wi (gas)1.11.1-
wi (electric power)3.03.0-
PEH + W + pom [kWh/(m2annum)]46.9 × 1.1 + 5.9 × 3.0 = 69.343.6 × 1.1 + 5.9 × 3.0 = 65.770
Table 9. CO2 emission calculations.
Building W1Building B1
Gas
QKH + W [kWh/annum]5355.984979.12
QKH + W [GJ/annum]19.2817.92
WE kg [CO2/GJ]55.4155.41
ECO2, H + W [kg CO2/annum]1068.39993.21
Electric Power
QKpom [kWh/annum]675.67675.67
QKpom [GJ/annum]2.432.43
WE [kg CO2/GJ]217217
ECO2, pom [kg CO2/annum]527.70527.70
ECO2 [kg CO2/annum]1596.091520.91
Table 10. Summary of CO2 emissions per building type and for each layout alternative.
Building Type/CharacteristicCO2 Emission per Building [kg/annum]Number of Buildings Within the ComplexTotal CO2 Emission [kg/annum]
Layout A
W1/110 m2 detached1596.092031,921.80
B1/110 m2 semi-detached1520.912030,418.20
Total62,349.00
Layout B
W1/110 m2 detached1596.0900
B1/110 m2 semi-detached1520.914060,836.40
Total60,836.40
Layout C
W1/110 m2 detached1596.094063,843.60
B1/110 m2 semi-detached1520.9100
Total:6843.60
Table 11. Mean layout ratings as reported in the survey.
Layout ALayout BLayout C
Mean value as reported in the survey1.872.351.84
Rank231
Table 12. The numerical values entered into the WASPAS method for all layouts.
Weight0.550.20.150.050.05
P1P2P3P4P5
Construction Cost [Thousand Euro]Thermal Comfort [-]Overall Energy Consumption [kWh/(m2annum)]CO2 Emission [kg/annum]Urban Layout Assessment [-]
AlternativeA30341.075181089,230.81.87
B29281.210174487,750.02.35
C32230.940187690,711.61.84
Max32231.21187690,711.62.35
Min29280.94174487,7501.84
Table 13. Results of the multi-criteria analysis using the WASPAS method.
Standardised Values
Construction Cost [thousand Euro]Thermal Comfort [-]Overall Energy Consumption [kWh/m2annum]CO2 Emission [kg/annum]Urban Layout Assessment [-] j = 1 n x ¯ i , j w j j = 1 n ( x ¯ i , j ) w j σ 2 ( Q i ( 1 ) ) σ 2 ( Q i ( 2 ) ) λ Q i Rank
AlternativeA0.9650.8740.9640.9830.7960.9390.9380.0008430.0006040.4180.9382
B1.0000.7771.0001.0001.0000.9550.9510.0008850.0007270.4510.9531
C0.9081.0000.9300.9670.7830.9270.9250.0007820.0006070.4370.9263
Wj0.550.20.150.050.05
Table 14. Simulation showing scores for different weight values.
ScorePlace
lpP1P2P3P4P5ABCABC
10.3030.2580.2480.1390.0520.9340.9400.938312
20.3250.0620.1580.2340.2200.9250.9850.902 w j 13
30.0980.0690.2730.2840.2760.9150.9840.901213
40.1600.1750.2390.1870.2390.9100.9590.909213
50.2030.3800.1460.0890.1840.9000.9120.927321
60.1030.3700.1400.2100.1770.9040.9140.934321
70.2950.0410.1160.3420.2050.9310.9900.908213
80.0430.2530.3610.1300.2130.9060.9410.918312
90.1270.2590.2770.1510.1870.9110.9390.922312
100.1630.2450.2360.2230.1330.9230.9430.931312
110.3830.1550.2690.1610.0310.9480.9630.933213
120.2030.3350.2640.0620.1370.9110.9220.930321
130.0760.2330.2600.2790.1530.9210.9450.931312
140.2110.0190.3480.3410.0810.9550.9960.927213
150.2650.3340.1640.2090.0280.9330.9220.951231
160.2810.2660.1690.1830.1010.9260.9380.933312
170.2340.2160.1300.1890.2310.9080.9490.911312
180.3420.1050.3200.0750.1580.9280.9750.908213
190.1970.1460.0590.2240.3740.8910.9660.887213
200.1940.2010.1780.2150.2130.9130.9530.915312
210.4580.0480.3100.0480.1370.9370.9890.904213
220.2340.2110.2140.3080.0320.9450.9500.946312
230.3150.0730.2730.0800.2600.9140.9830.892213
240.1420.2790.1310.2590.1880.9110.9350.927312
250.3200.1970.0220.3530.1080.9340.9540.933213
260.2960.2630.0210.2330.1880.9120.9390.921312
270.3210.2740.1370.2390.0300.9390.9360.946231
280.1090.2950.0910.2140.2910.8910.9310.911312
290.1760.0350.1450.2420.4010.8960.9920.877213
300.1490.1270.2950.2990.1300.9350.9700.926213
310.3170.1430.0970.1240.3200.8980.9660.889213
320.3560.0370.3620.1100.1350.9390.9910.908213
330.2280.2160.1520.2890.1140.9300.9490.933312
340.3050.0190.1510.1930.3320.9080.9950.882213
350.1640.0890.3110.1160.3210.9030.9790.888213
360.0600.1630.3110.1240.3430.8920.9620.892213
370.2310.1850.2500.2820.0520.9430.9560.940213
380.0910.1970.0910.2420.3790.8860.9540.893312
390.1120.2900.2570.1580.1820.9090.9320.925312
400.1290.0630.2590.2970.2520.9200.9850.904213
410.0480.0560.1520.3770.3680.9020.9870.891213
420.0800.4180.0450.3680.0900.9180.9030.957231
430.1870.2040.1910.2130.2040.9140.9520.916312
440.2230.3110.3530.0460.0670.9250.9280.938321
450.2040.3250.1410.2620.0680.9280.9250.947231
460.0470.3310.2080.0810.3350.8780.9230.903312
470.4590.3310.1100.0330.0660.9230.9230.934231
480.3850.1170.0290.2050.2640.9120.9720.897213
490.1760.3140.0960.2260.1880.9070.9270.927321
500.1440.2930.0630.0720.4280.8660.9320.885312
Sum of first ranks04010
Sum of second ranks27518
Sum of third ranks23522

