Article

A Study of Temperature-Dependent Hysteresis Curves for a Magnetocaloric Composite Based on La(Fe, Mn, Si)13-H Type Alloys

1
Department of Semiconductor and Optoelectronics Devices, Łódź University of Technology, 90-924 Łódź, Poland
2
Department of Physics, Częstochowa University of Technology, 42-201 Częstochowa, Poland
3
Faculty of Electrical Engineering, Częstochowa University of Technology, 42-201 Częstochowa, Poland
*
Author to whom correspondence should be addressed.
Energies 2020, 13(6), 1491; https://doi.org/10.3390/en13061491
Submission received: 26 February 2020 / Revised: 15 March 2020 / Accepted: 19 March 2020 / Published: 21 March 2020
(This article belongs to the Special Issue Modelling, Control and Optimisation of Complex Energy Systems)

Abstract

:
In the present paper, the effect of temperature on the shape of magnetic hysteresis loops for a magnetocaloric composite core was studied. The composite core, based on La(Fe, Mn, Si)13-H, was set up using three component disks with different Curie temperatures. The magnetic properties of the components and the outcome composite core were determined using a self-developed measurement setup. For the description of hysteresis loops, the phenomenological T(x) model was used. The presented methodology might be useful for the designers of magnetic active regenerators.

Graphical Abstract

1. Introduction

One of the most intriguing phenomena examined during studies on energy conversion is hysteresis. The word is derived from Greek υ σ τ ε ρ ε σ ε σ , which literally means “to lag behind”. One of the pioneering scientists working on the issue, Sir James Ewing, wrote in 1895: “When there are two quantities M and N, such that cyclic variations of N cause cyclic variation of M, then if the changes of M lag behind those of N, we may say that there is hysteresis in the relation of M and N the value of M at any point of the operation depends not only on the actual value of N, but on all the preceding changes (and particularly on the immediately preceding changes) of N, and by properly manipulating those changes, any value of M within more or less wide limits may be found associated with a given value of N.” [1].
The lag between the input and the output signals manifests itself in the occurrence of the so-called hysteresis curve, cf. Figure 1, whose analytical description by itself is a challenging and interesting task both for physicists and engineers. As pointed out in the preface and the introductory chapter of a well-known monograph by Italian researcher G. Bertotti [2], the scientists asked about the most distinctive fingerprint of ferromagnetism might indicate either the existence of the Curie point (the transition from ferro- to paramagnetic regime, important in particular for physicists), or the occurrence of hysteresis loop (interesting for engineers, who design magnetic circuits of electrical machines and devices, cf. e.g., [3,4,5]).
In the present paper we would like to attempt both these problems using a simple approach. We would like to examine the effect of temperature on the shapes of hysteresis loops for temperatures approaching the Curie point and to describe it using a phenomenological T(x) model [6]. In order to make the problem more challenging, we focus our attention on the modeling of a macroscopic composite structure, composed of three materials with different characteristics.
There are several hysteresis models, each differing in their complexity and background. The bottom-up approach proposed in 1935 by F. Preisach [7], further scrutinized by I. D. Mayergoyz [8], and the top-down description proposed by D. C. Jiles and D. L. Atherton [9] have attracted a lot of attention of the engineering community [10]. In the present paper, we focus on a simpler alternative, namely the phenomenological T(x) model proposed by J. Takács [6]. This model relies extensively on hyperbolic tangent relationship between the input and the output variables. Its developer writes the model equations in the dimensionless form and does not introduce any interpretation for the considered variables, which makes the description universal and easily customizable for any application. In the present paper, we identify the input variable as the reduced applied field strength intensity H and the output variable as the reduced magnetization M, however it is also possible to consider more complicated relationships, e.g., by taking into account the internal positive feedback within the material [11,12].
As already pointed out, the ultimate goal of the paper is to examine the usefulness of the considered description taking into account in a reasonably wide range the effect of temperature on the shape of hysteresis curves. Other existing hysteresis models may also be extended for this purpose, cf. e.g., [13,14,15,16,17]. As an alternative, it is also possible to avail of loss vs. temperature dependencies [18], however it can be mentioned that the use of a reliable hysteresis model is more flexible, since loss dissipated as heat may always be obtained by integration of the loop area [19].
Modeling temperature-dependent hysteresis loops might provide a better insight into the issue of energy dissipation for temperatures close to the Curie point, and thus it might be useful for the design and optimization of magnetic circuits in Active Magnetic Regenerators (AMRs). The studies on the possible applications of AMRs in magnetic refrigeration systems have recently been in the spotlight of the scientific community because of both the environmental burden caused by conventional solutions and the increasing energy consumption (around 15% worldwide) for refrigeration purposes [20]. So far, the modeling of magnetocaloric materials has been carried out most often within the framework of the Preisach model [21,22,23].
Modeling of magnetic response of multi-component composite materials is theoretically possible with the Jiles–Atherton [24] or Preisach formalisms [25], however the abovementioned references provided the results at ambient temperature only. In the considered T(x) model, it is straightforward to describe the response of a composite material by the appropriate weighting of contributions from individual components [26]. On the other hand, this model may be extended to describe temperature-dependent hysteresis curves [27]. It should be mentioned that, so far, scientific papers on the application of composite materials in magnetic refrigeration systems are focused mostly on experimental work [28,29,30].

2. Materials and Methods

The magnetocaloric effect (MCE) is a magneto-thermodynamic phenomenon in which a reversible change of the temperature of a magnetic material is triggered by the application or removal of external magnetic field. Despite the effect being discovered long ago (P. Weiss and A. Piccard, 1917), an exponential increase of scientific publications devoted to MCE can be observed after a successful attempt to develop a working prototype of a magnetic refrigerator by the researchers from Ames Laboratory, Iowa, U.S. and Astronautics Corporation of America in 1998 [31,32,33].
The growing interest of scientific community in magnetocaloric effect stems from two facts:
  • conventional cooling systems based on vapor-compression cycles of chlorofluorocarbons, hydrochlorofluorocarbons and hydrofluorocarbons are inefficient (theoretical efficiency of Carnot’s cycle does not exceed 40%) and may contribute to environmental burden (depletion of the ozone layer); on the other hand, MCE refrigeration systems can attain 60% efficiency and are environment-friendly;
  • around 15% of the world’s electricity consumption is used for refrigeration and air-conditioning purposes and this value is expected to rise, especially in developed countries [34,35,36,37].
There are several materials exhibiting MCE at near-room temperature. These include gadolinium-based compounds, in particular, the paradigm material Gd5Si2Ge2, La(Fe, Mn, Co, Mn)13−x Six(H,N,C)y intermetallics, Laves phases, MnAs1−x Sbx magnetocalorics, ferromagnetic lanthanum manganites and Heusler alloys. Lanthanium-based compounds are relatively cheap and are composed of abundant materials, thus they are at present the subject of intensive research [38,39]. In this paper we study the magnetic response of samples composed of sintered La(FeMnSi)13-Hx alloy.
Commercially available samples of La(FeMnSi)13-Hx in the form of square 30 mm plates, 0.5 mm thick were used for fabrication (by water-jet cutting) of ring-type samples examined in the paper. The plates were prepared in Vacuumschmelze GmbH by high temperature sintering of micro-powder La(FeMnSi)13-Hx [40]. The stacked core (Figure 2) was made of three rings with Curie temperatures 298K, 313K and 318K. Weight compositions and magnetocaloric properties have been collected in Table 1 and Figure 3.
Measurements of magnetic properties for the composite core were carried out using an author-developed setup [41]. The measurement setup met the recommendations of EN 60404-6: 2004 standard. Instantaneous values of magnetic field strength H(t) were calculated according to relationship (1)
H ( t ) = u H ( t )   w 1 L MCE R SHUNT
where: w 1 —number of turns of exciting coil, RSHUNT—shunt resistance (Ω), LMCE—average magnetic path of the sample (m), u H ( t ) —voltage drop across the RSHUNT (V).
Magnetic polarization J(t) of the sample was measured by means of the pickup coil w2 and calculated from Equation (2).
J ( t ) = 1 w 2 S MCE 0 T u J ( t ) d t μ 0 μ H ( t )   w 1 L MCE R SHUNT
where: u J ( t ) —voltage of the pickup coil w 2 (V), w 2 —number of turns of the coil w 2 , µ0—magnetic constant (H/m), S MCE —cross-section of the core (m2).
The standard uncertainty of the H(t) and J(t) measurements was estimated as B-type uncertainty according to constituents collected in Table 2. Assumed and fixed parameters LMCE, w1, w2, SMCE, ρ and µ0 were excluded from the budget of uncertainty.
The core geometry was as follows: the outer diameter d o = 2 r o was equal to 28 mm, the inner one d i = 2 r i − 18 mm, cf. Figure 2. The height of each component was l = 0.5 mm (flat disks). It should be mentioned that the ratio r o / r i exceeded the value 1.1, which implied that the magnetic field distribution in the radial direction was inhomogeneous. This can be proven by the inspection of Figure 4, which presents the computation results for this geometry in accordance to the hyperbolic dependence proposed in [42,43],
H ( x ) = H m r m r m + x
where the radius for the mean magnetic flux was calculated from
r m = r o r i log r o r i
For the considered case r m 11.32 mm. The values at the inner and at the outer radii were equal to 126% and 81% of the value for r m . This means that the field strength distribution within the sample cross-section was quite inhomogeneous. Figure 4 depicts the variations of magnetic field strength in the rings upon the update of the instant value of radius r (r runs from r i up to r o , the value depicted with dot denotes r m ).
In the past, there were some attempts to take into account the geometrical effects for the cylinder-shaped cores, which in most cases were made of conventional soft magnetic materials. The Cardiff team examined eighteen wound M4 cores with various heights, inner and outer diameters and build-ups r o r i [42]. The authors found that better performance might be achieved for cores with increased aspect ratios, defined as l / ( r o r i ) . Moreover, they found that lower losses might be obtained by increasing the winding ratio 2 r i / l provided the build-up ratio and the aspect ratio were kept constant. In a subsequent study [43] the authors discussed theoretical effects of the radial magnetic field and flux density variation, inter-laminar normal flux and winding stress on the real and apparent power loss and the permeability of a range of cylinder-shaped cores. They concluded that to obtain low losses and magnetizing currents, the cores should be designed using wide strips, having large internal diameter and low build-up. Koprivica et al. arrived at similar conclusions in the paper [44], which additionally focused on the issue of digital feedback control during loss measurements for this core geometry. Nakata et al. focused on the problem of an intrinsic measurement error for cylinder-shaped cores due to the common assumption that the mean magnetic path length might be equal to the mean geometric path length [45,46]. The authors suggested a method to take into account the true B = B ( H ) dependence. Tutkun and Moses examined the geometrical effects for non-standard excitation conditions (pulse width modulation excitation) [47]. The qualitative conclusions from their analysis were similar to those obtained previously, yet in this study the authors stressed the importance of aspect ratio, the worst properties were obtained for its value, approaching two.
It should be mentioned that in spite of the internal field distribution inhomogeneity in the considered setup shown in Figure 3, all disks are subject to exactly the same maximum field strength, since the excitation windings embrace all disks and the operation mode is similar to that of a current transformer (H-type excitation), which simplifies the analysis.
Figure 5 depicts the measurement results of polarization vs. temperature dependence for the constant field strength ( H m = 3000 A/m) of the composite core and its components. Similar qualitative dependencies were obtained for the P = P ( T ) (power loss density vs. temperature) curve. From the figure, it can be noticed that as temperature increased above one of the critical values (Curie points of the components, marked with stars), a sudden drop of the J m = J m ( T ) dependence was observed. In the paper [48], Curie temperatures of individual components are relatively close to each other, which in the case of the outcome recorded response M = M(T) for the composite, yields a monotonous drop of M upon the increase of T. In the case considered in this paper, the Curie temperatures of individual components are relatively distant from each other, which results in the jumps of M vs. T dependence. Similar jumps have been observed for gadolinium-based alloys in the recent paper [49].
Figure 6 presents the measured J m = J m ( H ) dependencies of the examined core and its components at room temperature.
Figure 7 depicts an exemplary family of temperature-dependent minor (non-saturating) hysteresis loops of the composite core. The effect of temperature on the shape of magnetization curves is clearly visible. The value of the maximum field strength was fixed here at Hm = 2000 A/m. It is interesting to remark that even for the highest considered temperature T = 325.65 K (which was higher that the Curie points of all constituents), a tiny residual hysteresis loop was still observed. This means that the full transition from ferromagnetic to paramagnetic regime did not take place even at this temperature. This phenomenon is related to residual ferromagnetism corresponding to a small amount of α-Fe phase.
The lanthanum-based alloys are produced during solid state diffusion. As shown in a previous work of one of the authors [50], this type of alloy in the as-cast state has a dendrite-like microstructure. During annealing, the evolution of the microstructure occurs and a homogenous microstructure is finally obtained with some islands built mainly from the α-Fe phase with some small Si and Co content.
In order to confirm the existence of the α-Fe phase in the examined composite, the X-ray diffraction (XRD) measurements were carried out. The XRD studies were made using a Bruker D8 Advance diffractometer with CuKα radiation, equipped in an ultrafast semiconductor LynxEye detector. In Figure 8, small reflexes corresponding to 2 θ = 44.7 degrees are clearly visible. These were recognized as related to the (110) plane typical for the α-Fe phase. Moreover, the characteristic shift of reflexes corresponding to La(Fe, Mn, Si)13-H type phase towards lower angles suggests an increase in lattice constant of the La(Fe, Mn, Si)13-H, which, on the other hand, is related to the increase of the Curie temperature of every component. This effect has been described elsewhere [48].
Table 3 contains the measured values of magnetic properties of the composite core and its constituents at room temperature and for Curie points of the components.
Figure 9 depicts the measured dependence of the coercive field strength on temperature for the examined composite core. This dependence shall be used in the modeling shown in the subsequent section. It is interesting to note that the minimal values of the coercive field strength are obtained for temperature range <311; 315> K, which includes the Curie temperature for the intermediate sample. However, it is hard to speak on the monotonicity trend within this range. For lower temperature levels, the value of the coercive field strength decreases upon temperature increase, and for T > 316.75  K, a sudden Hc jump is observed, whereas above T = 352.65 K the value is practically constant. Additionally, in the figure, the corresponding dependences are shown for the constituent cores.
During the measurements, the excitation frequency was kept as low as possible (about 1 Hz) to avoid the distorting effect of eddy currents on the shape of hysteresis loop.

3. Modeling

The T(x) description is based on hyperbolic tangent transformation. For a single phase material, the following relationships may be written for symmetrical hysteresis loops:
M = M s   tan h   ( H H c a ) ± b
b = M s   [ tan h   ( H max + H c a ) tan h   ( H max H c a ) ]
where M s (A/m) is saturation magnetization, H c (A/m) is coercive field strength, whereas a (A/m) is a normalization constant (it controls the loop slope). b is introduced in order to match the loop branches at tips, where magnetic field strength takes the maximum value H max .
Figure 10 illustrates how the value of the normalization constant a affects the shape of modeled hysteresis loops. In the simulation, the normalized units were used, and the value of coercive field strength was set to unity. It is easily noticeable that variation of the a parameter value alone allows us to obtain hysteresis curves that are in qualitative agreement with those depicted in Figure 7.
The response of a multi-component alloy is obtained by summing weighted contributions from individual components. In our case, the weights are taken as equal to 1/3, which corresponds to the volumetric content of each component (in the first approximation we neglect the volumetric changes during phase transition). The assumption of constant weighting means that the coupling between individual rings, as well as the interface-related phenomena, are neglected. Moreover, the leakage fields are not taken into account.
In order to verify the correctness of the above-given assumptions, we have taken advantage of the measurement data depicted in Figure 6. It was found that the relative difference for the points on the measured curve for the composite core and those from the averaged Jm = Jm(T) dependence was in the order of 10%. The highest discrepancies were obtained for the extreme values of field strength (in the low and the high field regions), yet they did not exceed 15%.
Our previous experience with modeling temperature dependent hysteresis curves with T(x)-derived descriptions for a single component alloy [27] allowed us to assume that the values of all model parameters might be highly sensitive to temperature. Therefore, we treated a and M s as free parameters for all constituents and repeated the modeling for elevated temperatures. The only assumption was that value of saturation magnetization for a given sample should be higher than that for loop amplitude, H m = 3000 K. The values of H c were taken from data depicted in Figure 9.
Figure 11 depicts the descending branches of hysteresis loops at room temperature, when all components remained in ferromagnetic phase. It can be observed that the shape of measured outcome hysteresis branch is well reproduced with the proposed model. The average deviation between the measured and the modeled curves was 16.3%. The quantity at the ordinate axis is magnetization, related to polarization with the relationship M = J / μ 0 , where μ 0 is free space permeability.
Figure 12 presents a visual comparison between the measured and the modeled hysteresis loops for T = 307.65 K (above the Curie point for the first sample). It can be stated that in this case the model also yields reasonable agreement with the experiment. The average deviation between the measured and the modeled curves was 22.5%.
Modeling was also attempted for a temperature exceeding the Curie point values of all constituent rings (T = 329.65 K). In this case, however, significant discrepancies between the measured and the modeled curves were observed, cf. Figure 13. This effect may be due to the assumption that the volumetric effects could be neglected in the analysis. We decided to include the Figure in the paper, since it illustrates the fact mentioned previously clearly, namely the presence of the tiny residual ferromagnetic phase even above the Curie point.
The values of model parameters for some chosen temperatures are listed in Table 4.

4. Conclusions

In this paper, a simple phenomenological description was applied to model temperature-dependent hysteresis loops of a La(Fe, Mn, Si)13-H magnetocaloric alloy. The composite consisted of three disks with different Curie temperatures. The resulting hysteresis loop was obtained by weighting the magnetic responses from individual constituents. For modeling purposes, the T(x) description was used.
The temperature dependencies Jm(T) and Hc (T) for composite magnetocaloric alloys (shown in Figure 5) allowed us to carry out an unambiguous identification of phase transformations and Curie temperatures. However, it was not possible to determine the true value of the total magnetic polarization from the superposition of the polarizations of individual components because of the inhomogeneity of magnetic flux distribution. The application of phenomenological T(x) model made it possible to estimate the values of magnetic parameters of practical interest, like Hc or Br, which in turn made it possible to estimate power losses that dissipated in the composite.
Experimental research has shown that even above the highest Curie temperature of the constituent samples the outcome magnetic response still exhibited tiny hysteresis, which implies that there existed a residual α-Fe phase in the material.
Future work shall be devoted to fine-tuning of the description to take into account the volumetric effects during phase transitions. We believe that the proposed model might be useful for the design and optimization of magnetic regenerators.

Author Contributions

Conceptualization, R.G. and P.G.; methodology, R.G. and K.C.; software, K.C.; validation, P.G.; formal analysis, P.G.; investigation, R.G.; resources, R.G. and P.G.; data curation, R.G.; writing—original draft preparation, K.C.; writing—review and editing, R.G.; visualization, K.C.; supervision, R.G.; project administration, R.G.; funding acquisition, K.C. All authors have read and agreed to the published version of the manuscript.

Funding

This research received no external funding.

Conflicts of Interest

The authors declare no conflict of interest.

References

  1. Ewing, J.A.X. Experimental researches in magnetism. Philos. Trans. R. Soc. Lond. 1885, 176, 523–640. [Google Scholar]
  2. Bertotti, G. Hysteresis in Magnetism, 1st ed.; Elsevier/Academic Press: San Diego, CA, USA, 1998. [Google Scholar]
  3. Liu, C.; Chau, K.T. Electromagnetic Design of a New Electrically Controlled Magnetic Variable-Speed Gearing Machine. Energies 2014, 7, 1539–1554. [Google Scholar] [CrossRef] [Green Version]
  4. Chen, W.; Ma, J.; Huang, X.; Fang, Y.-T. Predicting Iron Losses in Laminated Steel with Given Non-Sinusoidal Waveforms of Flux Density. Energies 2015, 8, 13726–13740. [Google Scholar] [CrossRef] [Green Version]
  5. Gallicchio, G.; Palmieri, M.; Di Nardo, M.; Monopoli, V.G. Fast Torque Computation of Hysteresis Motors and Clutches Using Magneto-static Finite Element Simulation. Energies 2019, 12, 3311. [Google Scholar] [CrossRef] [Green Version]
  6. Takacs, J. A phenomenological mathematical model of hysteresis. COMPEL Int. J. Comput. Math. Electr. Electron. Eng. 2001, 20, 1002–1015. [Google Scholar] [CrossRef]
  7. Preisach, F. Über die magnetische Nachwirkung. Z. Phys. 1935, 94, 277–302. [Google Scholar] [CrossRef]
  8. Mayergoyz, I.D. Mathematical Models of Hysteresis and Their Applications; Elsevier: Amsterdam, The Netherlands, 2003. [Google Scholar]
  9. Jiles, D.; Atherton, D. Theory of ferromagnetic hysteresis. J. Magn. Magn. Mater. 1986, 61, 48–60. [Google Scholar] [CrossRef]
  10. Cardelli, E. Advances in Magnetic Hysteresis Modeling; Elsevier BV: Amsterdam, The Netherlands, 2015; Volume 24, pp. 323–409. [Google Scholar]
  11. Chwastek, K. A dynamic extension to the Takács model. Phys. B Condens. Matter 2010, 405, 3800–3802. [Google Scholar] [CrossRef]
  12. Jastrzębski, R.; Jakubas, A.; Chwastek, K. A Comparison of Two Phenomenological Descriptions of Magnetization Curves Based on T(x) Model. Acta Phys. Pol. A 2019, 136, 720–723. [Google Scholar] [CrossRef]
  13. Raghunathan, A.; Melikhov, Y.; Snyder, J.E.; Jiles, D.C. Theoretical Model of Temperature Dependence of Hysteresis Based on Mean Field Theory. IEEE Trans. Magn. 2010, 46, 1507–1510. [Google Scholar] [CrossRef]
  14. Sutor, A.; Rupitsch, S.J.; Bi, S.; Lerch, R. A modified Preisach hysteresis operator for the modeling of temperature dependent magnetic material behavior. J. Appl. Phys. 2011, 109, 7. [Google Scholar] [CrossRef] [Green Version]
  15. Górecki, K.; Rogalska, M.; Zarȩbski, J.; Detka, K. Modelling Characteristics of Ferromagnetic Cores with the Influence of Temperature. J. Physics: Conf. Ser. 2014, 494, 012016. [Google Scholar] [CrossRef] [Green Version]
  16. Gozdur, R.; Gębara, P.; Chwastek, K. Modeling hysteresis curves of La(FeCoSi)13 compound near the transition point with the GRUCAD model. Open Phys. 2018, 16, 266–270. [Google Scholar] [CrossRef]
  17. Longhitano, M.R.; Sixdenier, F.; Scorretti, R.; Krähenbühl, L.; Geuzaine, C. Temperature-dependent hysteresis model for soft magnetic materials. COMPEL Int. J. Comput. Math. Electr. Electron. Eng. 2019, 38, 1595–1613. [Google Scholar] [CrossRef]
  18. Górecki, K.; Detka, K. Influence of Power Losses in the Inductor Core on Characteristics of Selected DC–DC Converters. Energies 2019, 12, 1991. [Google Scholar] [CrossRef] [Green Version]
  19. McKeehan, L.W.; Bozorth, R.M. Hysteresis Losses and the Area of the Hysteresis Loop. Phys. Rev. 1934, 46, 526–527. [Google Scholar] [CrossRef]
  20. Almanza, M.; Kedous-Lebouc, A.; Yonnet, J.-P.; Legait, U.; Roudaut, J. Magnetic refrigeration: Recent developments and alternative configurations. Eur. Phys. J. Appl. Phys. 2015, 71, 10903. [Google Scholar] [CrossRef]
  21. Basso, V.; Bertotti, G.; LoBue, M.; Sasso, C. Theoretical approach to the magnetocaloric effect with hysteresis. J. Magn. Magn. Mater. 2005, 290, 654–657. [Google Scholar] [CrossRef]
  22. Basso, V.; Sasso, C.; Bertotti, G.; LoBue, M. Effect of material hysteresis in magnetic refrigeration cycles. Int. J. Refrig. 2006, 29, 1358–1365. [Google Scholar] [CrossRef]
  23. Von Moos, L.; Bahl, C.R.H.; Nielsen, K.K.; Engelbrecht, K. The influence of hysteresis on the determination of the magnetocaloric effect in Gd 5 Si 2 Ge 2. J. Phys. D: Appl. Phys. 2014, 48, 25005. [Google Scholar] [CrossRef]
  24. Raghunathan, A.; Melikhov, Y.; Snyder, J.E.; Jiles, D.C. Modeling of two-phase magnetic materials based on the Jiles-Atherton theory. J. Magn. Magn. Mater. 2012, 324, 20–22. [Google Scholar] [CrossRef]
  25. Frydrych, P.; Nowicki, M. Two phase magnetic material modelling using two dimensional extended Preisach model. J. Electr. Eng. 2018, 69, 464–466. [Google Scholar] [CrossRef] [Green Version]
  26. Takacs, J.; Mészáros, I. Separation of magnetic phases in alloys. Phys. B Condens. Matter 2008, 403, 3137–3140. [Google Scholar] [CrossRef]
  27. Gozdur, R.; Gębara, P.; Chwastek, K. The effect of temperature on magnetization curves near Curie point in LaFeCoSi. Acta Phys. Pol. A 2020, in press. [Google Scholar]
  28. Govindappa, P.; Trevizoli, P.V.; Campbell, O.; Niknia, I.; Christiaanse, T.V.; Teyber, R.; Misra, S.; Schwind, M.A.; Van Asten, D.; Zhang, L.; et al. Experimental investigation of MnFeP1−xAsxmultilayer active magnetic regenerators. J. Phys. D Appl. Phys. 2017, 50, 315001. [Google Scholar] [CrossRef]
  29. Christiaanse, T.V.; Trevizoli, P.; Misra, S.; Carroll, C.; Van Asten, D.; Zhang, L.; Teyber, R.; Govindappa, P.; Niknia, I.; Rowe, A.M. Experimental study of 2-layer regenerators using Mn–Fe–Si–P materials. J. Phys. D Appl. Phys. 2018, 51, 105002. [Google Scholar] [CrossRef]
  30. Shen, H.; Luo, L.; Xing, D.; Jiang, S.; Liu, J.; Huang, Y.; Guo, S.; Sun, H.; Liu, Y.; Sun, J.; et al. The Magnetocaloric Composite Designed by Multi-Gd-Al-Co Microwires with Close Performances. Phys. Status Solidi 2019, 216, 1900090. [Google Scholar] [CrossRef]
  31. Zimm, C.; Jastrab, A.; Sternberg, A.; Pecharsky, V.; Gschneidner, K.; Osborne, M.; Anderson, I. Description and Performance of a Near-Room Temperature Magnetic Refrigerator. Adv. Cryog. Eng. 1998, 43, 1759–1766. [Google Scholar]
  32. Tishin, A.M.; Spichkin, Y. The Magnetocaloric Effect and Its Applications; Informa UK Limited: London, UK, 2003. [Google Scholar]
  33. Gschneidner, K.; Pecharsky, V. Thirty years of near room temperature magnetic cooling: Where we are today and future prospects. Int. J. Refrig. 2008, 31, 945–961. [Google Scholar] [CrossRef] [Green Version]
  34. Gutfleisch, O.; Willard, M.A.; Brueck, E.; Chen, C.H.; Sankar, S.G.; Liu, J.P. ChemInform Abstract: Magnetic Materials and Devices for the 21st Century: Stronger, Lighter, and More Energy Efficient. Chemin 2011, 42. [Google Scholar] [CrossRef]
  35. Franco, V.; Blázquez, J.; Ingale, B.; Conde, A. The Magnetocaloric Effect and Magnetic Refrigeration Near Room Temperature: Materials and Models. Annu. Rev. Mater. Res. 2012, 42, 305–342. [Google Scholar] [CrossRef] [Green Version]
  36. Gómez, J.R.; Garcia, R.F.; Catoira, A.D.M.; Gómez, M.R. Magnetocaloric effect: A review of the thermodynamic cycles in magnetic refrigeration. Renew. Sustain. Energy Rev. 2013, 17, 74–82. [Google Scholar] [CrossRef]
  37. Balli, M.; Jandl, S.; Fournier, P.; Kedous-Lebouc, A. Advanced materials for magnetic cooling: Fundamentals and practical aspects. Appl. Phys. Rev. 2017, 4, 021305. [Google Scholar] [CrossRef]
  38. Krautz, M.; Beyer, M.; Jäschke, C.; Schinke, L.; Waske, A.; Seifert, J. A Magnetocaloric Booster Unit for Energy-Efficient Air-Conditioning. Crystals 2019, 9, 76. [Google Scholar] [CrossRef] [Green Version]
  39. Kagathara, J.; Wieland, S.; Gärtner, E.; Uhlenwinkel, V.; Steinbacher, M. Heat Treatment and Formation of Magnetocaloric 1:13 Phase in LaFe11.4Si1.2Co0.4 Processed by Laser Beam Melting. Materials 2020, 13, 773. [Google Scholar] [CrossRef] [PubMed] [Green Version]
  40. Barcza, A.; Katter, M.; Zellmann, V.; Russek, S.; Jacobs, S.; Zimm, C. Stability and Magnetocaloric Properties of Sintered La(Fe, Mn, Si)_{13}H_{z} Alloys. IEEE Trans. Magn. 2011, 47, 3391–3394. [Google Scholar] [CrossRef]
  41. Gozdur, R.; Lebioda, M.; Bernacki, Ł. Power Losses in LaFexCoySi1.1Intermetallics near the Magnetic Phase Transition. Acta Phys. Pol. A 2015, 128, 98–103. [Google Scholar] [CrossRef]
  42. Moses, A.J.; Ling, P.C.Y. Dimensional factors affecting magnetic properties of wound cores. Phys. Scr. 1989, 40, 249–251. [Google Scholar] [CrossRef]
  43. Grimmond, W.; Moses, A.; Ling, P. Geometrical factors affecting magnetic properties of wound toroidal cores. IEEE Trans. Magn. 1989, 25, 2686–2693. [Google Scholar] [CrossRef]
  44. Koprivica, B.; Milovanović, A.; Djekić, M. Effects of wound toroidal core dimensional and geometrical parameters on measured magnetic properties of electrical steel. Serbian J. Electr. Eng. 2013, 10, 459–471. [Google Scholar] [CrossRef] [Green Version]
  45. Nakata, T.; Takahashi, N.; Fujiwara, K.; Nakano, M.; Ogura, Y. Accurate measurement method of magnetization curve using ring specimen. J. Magn. Magn. Mater. 1992, 112, 71–73. [Google Scholar] [CrossRef]
  46. Nakata, T.; Takahashi, N.; Fujiwara, K.; Nakano, M.; Ogura, Y.; Matsubara, K. An improved method for determining the DC magnetization curve using a ring specimen. IEEE Trans. Magn. 1992, 28, 2456–2458. [Google Scholar] [CrossRef]
  47. Tutkun, N.; Moses, A. Effects of geometrical factors on iron loss increase in wound toroidal cores energized by pulse width modulated voltage sources. J. Magn. Magn. Mater. 2004, 281, 110–114. [Google Scholar] [CrossRef]
  48. Gębara, P.; Pawlik, P. Broadening of temperature working range in magnetocaloric La(Fe,Co,Si)13- based multicomposite. J. Magn. Magn. Mater. 2017, 442, 145–151. [Google Scholar] [CrossRef]
  49. Gębara, P.; Díaz-García, Á.; Yan Law, J.; Franco, V. Magnetocaloric response of binary Gd-Pd and ternary Gd-(Mn,Pd) alloys. J. Magn. Magn. Mater. 2020, 500, 166175. [Google Scholar] [CrossRef]
  50. Gębara, P.; Pawlik, P.; Kulej, E.; Wysłocki, J.J.; Pawlik, K.; Przybył, A. The evolution of microstructure in annealed LaFeSi-type alloys. Opt. Appl. 2009, 39, 761–764. [Google Scholar]
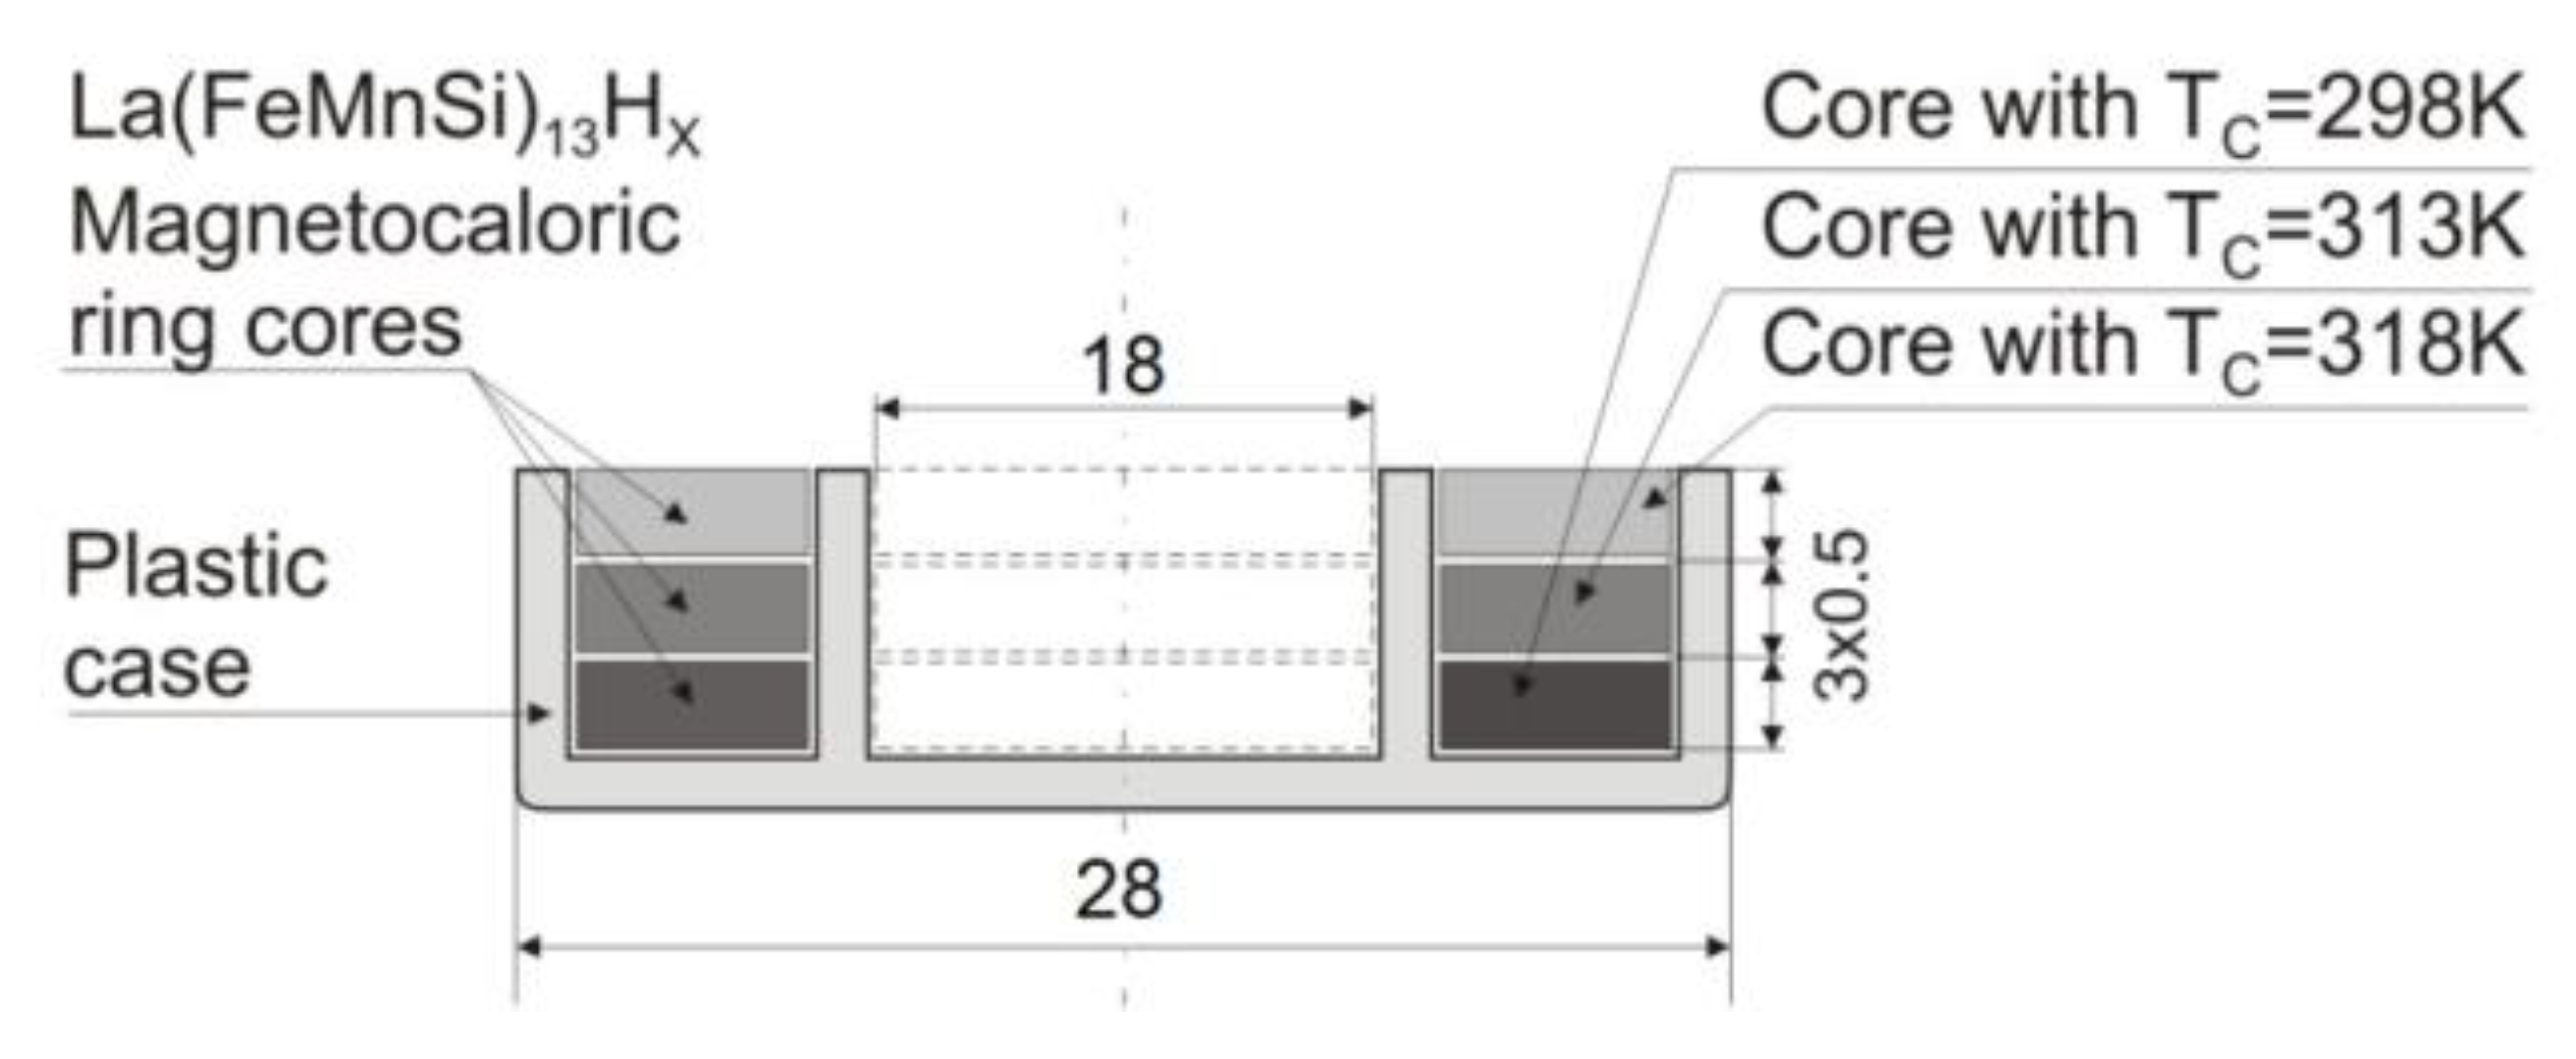
Figure 1. A family of hysteresis loops for a soft ferromagnetic material. The largest loop, exhibiting saturation, is referred to as the major loop.
Energies 13 01491 g001
Figure 2. Schematic cross-section of the sandwich sample made of three rings exhibiting different Curie temperatures.
Energies 13 01491 g002
Figure 3. Influence of temperature and magnetic field on the induced magnetocaloric effect (MCE) of the examined samples with La(FeMnSi)13-Hx composition.
Energies 13 01491 g003
Figure 4. Calculated distribution of field strength in the radial direction for the considered core geometry.
Energies 13 01491 g004
Figure 5. The measured Jm vs. T dependencies for the examined composite core.
Energies 13 01491 g005
Figure 6. The measured Jm vs. Hm curves of the examined composite core and its components at room temperature.
Energies 13 01491 g006
Figure 7. The effect of temperature on the shape of minor hysteresis loops for the composite core, Hm = 2 kA/m.
Energies 13 01491 g007
Figure 8. The XRD patterns for the considered La(Fe,Mn,Si)13-H samples.
Energies 13 01491 g008
Figure 9. Coercive field strength vs. temperature for the composite core and the constituent cores, Hm = 3 kA/m.
Energies 13 01491 g009
Figure 10. The effect of variation of a value on the shape of hysteresis loops simulated with the T(x) model.
Energies 13 01491 g010
Figure 11. The measured descending branches of hysteresis loops of the composite core and its components at room temperature; additionally, the modeled descending branch for the composite core is shown as solid line.
Energies 13 01491 g011
Figure 12. The measured and the modeled hysteresis curve for the composite core at T = 307.65 K.
Energies 13 01491 g012
Figure 13. The measured and the modeled hysteresis curve of the composite core at T = 329.65 K.
Energies 13 01491 g013
Table 1. Weight composition (wt%) of the tested samples.
Tc (K)FeLaSiMn
318K78.916.04.10.9
313K76.618.44.01.0
298K77.516.64.11.8
Table 2. B-type uncertainty of the measurement method.
Source of UncertaintyInstrumentation
/Method
Intrinsic ErrorAssumed Distribution Relative Uncertainty
Voltage u H ( t ) ,DAQ card NI-PCI-4462, Range ±1 V5.81 mVuniform0.30 %
Voltage u J ( t ) DAQ card NI-PCI-4462, Range ±3.16 V15.1 mVuniform2.38 %
Resistance RSHUNTKeysight 3458 A
Range 10 Ω
0.12 mΩuniform0.01 %
Frequency fKeysight 3458 A
Range 40 Hz
0.005 Hztriangular0.05%
TemperatureLTC29830.25 deguniform1.0%
Table 3. Magnetic parameters of the tested samples at room temperature and Curie points.
Core TypeTemperature|Jr||Hc|HmJmPs
(K )(T)(A/m)(A/m)(T)(mW/kg)
Composite293.80.1751296.02998.20.615262.99
Tc = 298 K293.80.0732222.03000.50.433234.16
Tc = 313 K293.80.2046291.73000.50.702868.98
Tc = 318 K293.80.2311304.23002.40.780486.70
Tc = 298 K298.00.0039204.12999.20.05243.26
Tc = 313 K313.00.0110288.83000.00.08377.95
Tc = 318 K318.00.0471211.33000.80.286725.68
Composite298.00.1340293.72997.10.442746.83
Composite313.00.0450269.12999.60.189418.68
Composite318.00.0086319.13003.90.05576.167
Table 4. Values of model parameters for chosen temperature values.
T (K) a, (A/m)Hc, (A/m)Ms (A/m)
293.85sample with TC = 298 K 1948.9192.01.12 × 105
-sample with TC = 313 K1184.6286.45.31 × 105
-sample with TC = 318 K1188.6299.55.92 × 105
307.65sample with TC = 298 K3569.3201.93.84 × 105
-sample with TC = 313 K1383.5231.93.95 × 105
-sample with TC = 318 K1330.4260.75.24 × 105
329.65sample with TC = 298 K3857.2185.03.80 × 104
-sample with TC = 313 K2839.5325.54.98 × 105
-sample with TC = 318 K1182.2417.41.98 × 105

