Abstract
Shale oil exploration has been a key area of onshore oil and gas exploration in China in recent years. In this study, organic geochemistry and element geochemistry are united to study the shale oil and source rock in the Lucaogou formation of Jimusar sag, in order to reveal the paleoclimate, paleoenvironment, source of organic matter, and factors affecting organic matter accumulation and shale oil generation. The shale oil in the study area is mainly accumulated in two strata with good reservoir properties and oiliness, known as the upper sweet spot and lower sweet spot. Indexes of biomarkers and sensitive elements revealed the warm and semi-arid paleoclimate during Lucaogou formation, and the water column was brackish to salty. Water stratification caused a suboxic to anoxic environment in the deep-water column and coincided with the anoxic photic zone phenomenon. Compared with the lower sweet spot, the more humid climate, deeper and fresher water, and stronger water stratification characterize the upper sweet spot during sedimentation. This made the photic zone with freshwater more suitable for the reproduction of algae in the upper sweet spot. Meanwhile, the organic matter was well-preserved in the anoxic zone. Volcanic ash caused algae bloom, which promoted primary productivity and ensured the supply of organic matter. The composition and distribution pattern of biomarkers prove that phytoplankton is the most important source of organic matter in the study area and the contribution of higher plants is insignificant. The relationship between parameters of paleoproductivity and the redox condition versus total organic carbon (TOC) suggests that compared with the preservation conditions, the input of organic carbon is the most important controlling factor of organic matter accumulation in the study area.
1. Introduction
The mechanism of organic matter (OM) accumulation and hydrocarbon generation in continental lacustrine basins has always been an important research area in petroleum geology and geochemistry [1,2,3,4,5,6]. Although different scholars have different comprehensions of the main factors controlling the accumulation of OM and generation of petroleum, it is generally believed that the three most important controlling factors are (i) high primary productivity, which is the material basis for OM accumulation; (ii) the decomposition of OM, which determines the abundance of OM preserved in sedimentary rocks; and (iii) the input of detrital material, which dilutes the OM [7,8,9,10,11,12,13,14]. Changes in the paleoenvironment directly affect the characteristics of the plant community, the condition of water, the depth of lakes, the scale of lacustrine basins, and the intensity of weathering and transportation of clastic material [15,16,17,18,19]. Therefore, they influence the primary productivity, decomposition of OM, and clastic material input. Rich paleoenvironment information is recorded in the source rocks and crude oil geochemical characteristics, which provides a clue for deciphering the lake characteristics that prevailed during source rock sedimentation.
Jimusar sag is a dustpan sag in the south-eastern Junggar basin. In recent years, shale oil exploration in Jimusar sag has made a series of breakthroughs in the Lucaogou formation, because many wells with commercial oil flow have been drilled, and this makes Jimsar sag one of the most significant areas of shale oil exploration in China. Lucaogou formation was mainly developed in a saline lacustrine sedimentary system, which is more sensitive to high-frequency climate change than a marine sedimentary system. Saline and alkaline lakes, as extreme environments, have become a research front due to their high biological, environmental, and economic significance [20,21].
Due to the high ambient temperature, the high light intensity, and the supply of huge amounts of CO2, saline and alkaline lakes often have several times the primary productivity of freshwater lakes [22], so saline and alkaline lacustrine sediments often contain a lot of petroleum and alkaline mineral resources. For example, the widely studied alkaline lacustrine sediments of the Green River Formation in the Uinta Basin, USA, have a high abundance of OM [23,24] and contain more than 1.3 trillion barrels of shale oil in-place resources [25], with about 77 billion barrels as a potential economic resource [26].
However, different from the Green River Formation alkaline lacustrine sediments which were only formed by evaporation [27], many shale oil reservoirs in northwest China, such as the Middle Permian Lucaogou formation in Jimsar and Malang Sag, and the Lower Permian Fengcheng formation in Mahu sag, have been proved to be associated with volcanic activity [28,29,30,31]. Volcanic eruptions can eject enormous amounts of ash into the water body and then release the macronutrients and trace elements [32,33,34,35]. Although excessive Cd, Cu, Pb, Zn, and other elements have potential toxicity to plankton [36,37], there is growing evidence that primary productivity increases greatly after volcanic ash deposition due to algae bloom [35,38,39,40].
Some studies have focused on the lithology, source rocks, reservoirs, and shale oil exploitation of the Lucaogou formation in Jimusar sag [41,42,43,44,45]. However, the geochemistry of crude oil and source rocks remains to be further studied, especially an analysis of the paleoclimate and paleoenvironment of the Lucaogou formation. This study focuses on the mechanism of OM enrichment and hydrocarbon genesis of the Lucaogou formation in Jimusar sag by geochemical methods. It not only provides the basis for shale oil exploration and development, but also delivers key evidence for revealing the history of interaction between the atmosphere, lithosphere, and biosphere in the Middle and Lower Permian in northwest China.
2. Geological Settings
Jimusar sag, with an area of about 1300km2, is located in the south eastern margin of the Junggar basin. The sag is bounded by the Jimsar fault in the north, Xidi and Laozhuangwan fault in the south, and Fukang fault in the south, and overlies the Guxi uplift to the east (Figure 1c). Jimusar sag is a polycyclic sedimentary basin, with the Upper Carboniferous flexure as the basement, and has experienced several stages of tectonic movements, such as Hercynian, Indosinian, Yanshan, and Himalayas movement [46,47]. Jimusar sag received Lucaogou formation lacustrine facies sediments as an independent sedimentary unit in the Middle Permian. Lucaogou strata are distributed in the whole sag, which is thick in the south and west and thin in the north and east [48]. The average thickness is more than 200m, and up to 350m. The Lucaogou formation is deposited in a shallow to semi-deep lake environment and is mainly composed of siltstone, mudstone, carbonate rock, and tuff [44,49,50]. The Lucaogou formation has undergone a sedimentary cycle of regressive–transgressive–regressive–transgressive and can be upward divided into four strata as P2l12, P2l11, P2l22, and P2l21 in turn [51,52]. Because P2l12 and P2l22 strata have relatively better reservoir properties and oiliness, they are respectively called the lower sweet spot (LSS) and the upper sweet spot (USS) (Figure 1d).
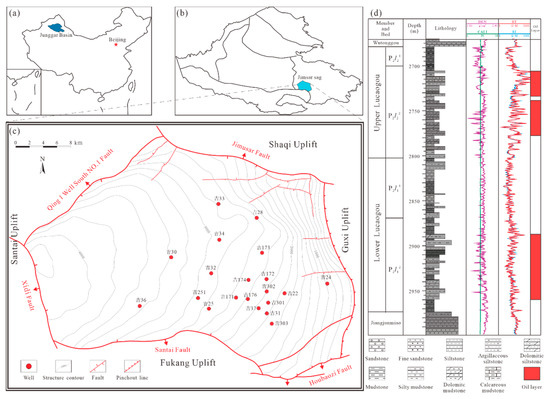
Figure 1.
(a) Location of the Junggar Basin in north-western China; (b) location of Jimsar sag in the south-eastern Junggar Basin; (c) structural configuration of the Jimsar sag and location of wells sampled in this study; and (d) generalized stratigraphy and lithology of Jimsar sag with oil layer information.
3. Materials and Methods
In this study, 16 crude oil samples were collected from 12 wells, including nine from the upper sweet spot (USS) and seven from the lower sweet spot (LSS). To limit contamination, all crude oil samples were sealed in brown glass bottles rinsed with trichloromethane. In addition, 113 core samples from USS and LSS, including mudstone, siltstone, dolomite, etc., were collected from 13 wells which cover the major study area, and the lithology was defined by a description. The crude oil samples were studied by whole oil gas chromatography (GC) and the saturated hydrocarbons and aromatic hydrocarbons were analyzed by gas chromatography-mass spectrometry (GC-MS) after the separation process. Rock pyrolysis and a TOC test were carried out on all core samples, and major and trace element analyses were performed on 16 selected core samples.
The whole oil GC analysis was performed at the Key Laboratory of Shale Gas Exploration and Evaluation, Ministry of Land and Resources, China University of Geosciences, using an Agilent HP 7890A instrument, equipped with a DB-5 ht capillary column (30 m × 0.32 mm × 0.1 μm). The inlet temperature and flame ionization detector (FID) temperature were set at 350 and 370 °C, respectively. The oven temperature started at 40 °C (hold for 3 min), and was raised to 230 °C at 4 °C/min and then to 370 °C at 10 °C/min, with a final hold of 20 min. Helium was used as the carrier gas at a flow rate of 1.0 mL/min. The injection volume was 1 μL with a 20:1 split ratio.
The GC-MS analysis of samples was performed on an Agilent HP 7890A GC interfaced with an Agilent HP 5975 MSD (ionization energy 70 eV) instrument at the Key Laboratory of Shale Gas Exploration and Evaluation, Ministry of Land and Resources, China University of Geosciences. Samples were analyzed in full scan mode (m/z 50−580). An HP-5 MS capillary column (30 m × 0.25 mm × 0.25 μm) was used and helium was the carrier gas. The oven temperature was programmed to start at 50 °C (held for 1 min) and increase to 120 °C at 20 °C/min, before then increasing to 300 °C at 2 °C/min and being maintained for 30 min.
X-ray fluorescence spectrometry (XRF) was used to analyze the main element oxides according to the industry standard GB/T 14506.28-2010 [53] at the Beijing Key Laboratory of Unconventional Natural Gas Geological Evaluation and Development Engineering. For trace element and rare earth element (REE) analyses, 50 mg rock powders were pre-treated by HF and HNO3 and analyzed by a Finnigan MAT Element inductively coupled plasma mass spectrometry (ICP-MS) system in accordance with the industry standard of GB/T 14506.30-2010 [54] at the Analytical Laboratory Beijing Research Institute of Uranium Geology.
The TOC content of the samples was determined using a LECO CS-744 analyzer, following the procedures of industry standard GB/T 19145-2003 [55], at the Key Laboratory of Shale Gas Exploration and Evaluation, Ministry of Land and Resources, China University of Geosciences. A Rock-Eval 6 instrument was used to obtain free and volatile hydrocarbon (S1), the remaining hydrocarbon generative potential (S2), and the temperature of the maximum pyrolysis yield (Tmax), according to the industry standard GB/T 18602−2012 [56], at the Chinese Academy of Geological Sciences National Research Center for Geoanalysis. Physical properties and carbon isotope data of crude oil samples and organic petrology, lithology, porosity, and permeability data of cores were provided by the Xinjiang Oilfield Company.
4. Results
4.1. Total Organic Carbon and Rock-Eval Pyrolysis
The TOC values of the 113 samples range from 0.24% to 13.86%, with an average of 2.82%. S1 + S2 is mostly distributed between 0.15 mg HC/g Rock and 41.96 mg HC/g Rock, with a mean of 13.73 mg HC/g Rock. Tmax is in the range of 424–455 °C (ave. 445.93 °C), indicating that the source rocks are early mature to mature. The hydrogen index (HI) of more than 90% of samples varies between 65.03 and 723.85 mg HC/g TOC, with an average of 324.60 mg HC/g TOC.
Lucaogou formation source rocks have a quite good hydrocarbon generation potential (Figure 2). The proportion of good and excellent source rocks of USS is 50%, and the proportion of poor source rocks is only 17%. These two proxies of LSS source rocks are 44% and 31%. Classified by lithology, the proportion of good and excellent source rocks in mudstone is 63%, and that of carbonate rock is 29%; however, there are no good and excellent source rocks in the siltstone (Figure 2). No significant difference is shown in the types of OM between the USS and LSS source rocks, which are primarily type I, II1, and II2 kerogen, and a few are type III kerogen (Figure 2). In accordance with lithologic classification, mudstone and carbonate rock are principally type I and II1 kerogen, while siltstone is principally II1 and II2 kerogen (Figure 2). The oil generation capacity of mudstone and carbonate rock is better than that of siltstone.
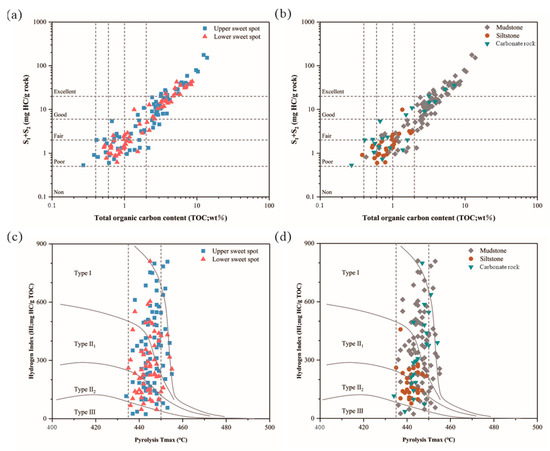
Figure 2.
(a) Plot of the TOC content vs. S1+S2 of the upper and lower sweet spots in the samples, to evaluate the hydrocarbon generation potential; (b) plot of the TOC content vs. S1+S2 of mudstone, siltstone, and carbonate rock source rocks, to evaluate the hydrocarbon generation potential; (c) plot of HI vs. Tmax of the upper and lower sweet spot source rocks, to evaluate organic matter types; (d) plot of HI vs. Tmax of mudstone, siltstone, and carbonate source rocks, to evaluate organic matter types.
S1/TOC represents the hydrocarbon generation per unit mass of organic carbon. It indicates that the interval has good oil when the ratio is greater than 75. Additionally, it suggests that the interval has potentially producible oil when the ratio is greater than 100 [57]. The difference between the upper and lower sweet spots is small (Figure 3). The median of S1/TOC of the USS samples is 81.96, and the median of the ratio of LSS samples is 85.58, indicating a favorable exploitation prospect. From a lithology perspective, siltstone has the best oil content, and the median of S1/TOC is 133.24, while the median of the ratio of carbonate rock and mudstone is 80.00 and 76.95, respectively (Figure 3).

Figure 3.
Plot of S1/TOC vs. Tmax to evaluate the oil-bearing level and the effect of hydrocarbon expulsion or migration.
The oil-bearing property of the reservoir is affected by both hydrocarbon expulsion from source rocks and the migration of non-indigenous hydrocarbons. There is a hydrocarbon expulsion effect in the lower right area (S1/TOC < 100, Tmax > 450 °C) of Figure 3: mature source rocks expel hydrocarbons, so the amount of S1 in the sample decreases and the S1/TOC decreases, while in the upper left area (S1/TOC > 150, and Tmax < 440 °C) of Figure 3, there is a hydrocarbon migration effect: the migration of crude oil causes the interval to accumulate non-indigenous hydrocarbons, so the amount of S1 in the sample increases and the S1/TOC value is abnormally high.
4.2. Molecular Marker Composition of Crude Oil Samples
4.2.1. N-Alkanes and Isoprenoids
The N-alkane and isoprenoid parameters for 16 samples are tabulated in Table 1. Crude oil contains n-alkanes and isoprenoid between C9 and C35 (Figure 4). The mean value of nC23-/nC24+ is 2.14. Compared with the high carbon number n-alkanes (nC24—nC35), the middle and low carbon number N-alkanes (nC9—nC23) have obvious advantages. Except for a few samples from LSS, which take nC17 as the main carbon, the rest of the samples take nC23 as the main carbon (Figure 4). The carbon preference index (CPI) index gradually approaches 1 with the increase of thermal maturity. The CPI is greater than 1 (1.26–1.52), showing a weak odd carbon advantage. Pristane (Pr) and phytane (Ph) are the most abundant acyclic isoprene compounds. The ratio of Pr/Ph of USS crude oil is between 1.20 and 1.44, while that of LSS crude oil is between 0.96 and 1.12. In the case of source rocks, the Pr/Ph of the USS samples varies between 0.68 and 2.30, and the Pr/Ph of the LSS samples ranges from 0.67 to 1.63. In addition, the nC17 and nC18 in LSS are significantly lower than Pr and Ph (Figure 4). The ratios of Pr/nC17 and Ph/nC18 in USS are 0.11–2.06 and 0.12–1.42, while those of LSS are 0.71–2.38 and 0.62–5.10, respectively. Abundant β-carotane was detected in all samples (Figure 4). In the LSS oil samples, β-carotane/nCmax ranges from 0.74 to 2.07 (ave. 1.41), while in the USS oil samples, β-carotane/nCmax ranges from 0.16 to 0.47 (ave. 0.33).

Table 1.
Saturated hydrocarbon gas chromatogram parameters of Lucaogou Formation shale oil in Jimsar sag.
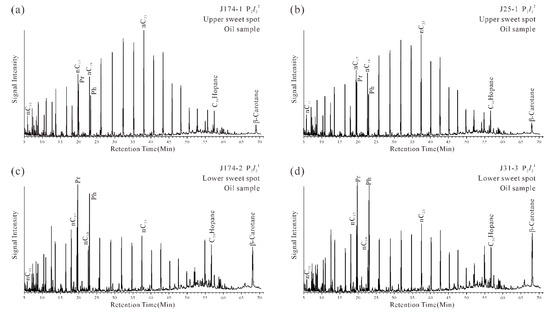
Figure 4.
Representative gas chromatograms of whole oil samples from the (a,b) upper sweet spot and (c,d) lower sweet spot.
4.2.2. Terpanes and Steranes
The parameters of terpanes and steranes of 16 samples are tabulated in Table S1. The mass chromatograms of the m/z191 fragment of all samples show that the hopane relative content has significant advantages over tricyclic terpanes (TT) and tetracyclic terpanes (TeT) (Figure 5). The ratio of TT/17 α-hopane in crude oil ranges from 0.033 to 0.052, with an average of 0.040, of which the ratio of LSS crude oil (ave. 0.044) is higher than that of USS crude oil (ave. 0.037). The extended tricyclic terpanes ratio [ETR = C28TT + C29TT)/(C28TT + C29TT + Ts)] of the USS samples is in the range of 0.68–0.77, and that of the LSS samples is between 0.73 and 0.88.

Figure 5.
(a) Representative mass chromatograms (m/z 191) showing the tricyclic terpanes, tetracyclic terpanes; and (b) hopanes of saturated hydrocarbon fraction samples from the upper sweet spot and lower sweet spot.
High concentrations of C29 norhopane (C29Hop), C30 hopane (C30Hop), and C31—C35 homohopane (C31Hop—C35Hop), dominated by C30Hop, were detected in all crude oil samples. The ratios of source parameters like C29Hop/C30Hop and C35Hop 22S/C34Hop 22S lie in the ranges of 0.42–0.75 and 0.34–0.54, respectively. The USS and LSS samples have almost the same C31Hop 22S/(22S + 22R) (0.56–0.60 for the USS samples and 0.56–0.59 for the LSS samples). This demonstrates that the maturity of the oil samples from the two members is barely different, and both are close to the equilibrium point and in the main stage of oil generation. The ratio Ts/Tm of crude oil in the study area is fairly low, the ratio of the USS oil samples is within the range of 0.10–0.18, and the ratio of LSS oil samples is between 0.04 and 0.14. Gammacerane (Ga) was detected in all samples. The maximum value of the Ga/C31Hop 22R ratio is 1.95, the minimum value is 1.30, and the average value is 1.58.
The regular sterane (Ster) distributions in the upper and lower sweet spot samples all show the distribution law of C29Ster > C28Ster > C27Ster (Figure 6). The proportions of USS samples are 41.19–46.34%, 38.38–43.64%, and 10.63–20.05% in turn, while those of the LSS samples are 48.12–52.03%, 39.26–41.95%, and 6.02–11.33%. There is no significant difference in C29Ster 20S/(20S+20R) and C29Sterββ/(ββ+αα) among the USS and LSS samples (Table S1). According to Figure 7, the samples of Lucaogou formation are in the mature stage, which is similar to the result indicated by other maturity indexes.
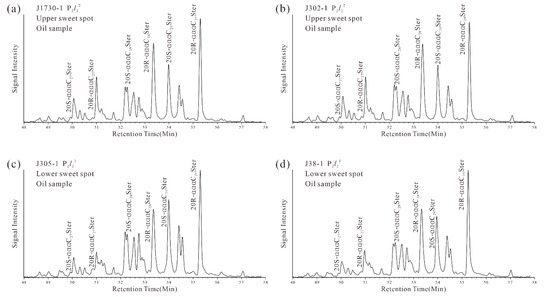
Figure 6.
Representative mass chromatograms (m/z 217) showing the sterane distribution of saturated hydrocarbon fraction samples from the (a) upper sweet spot; and (b) lower sweet spot.
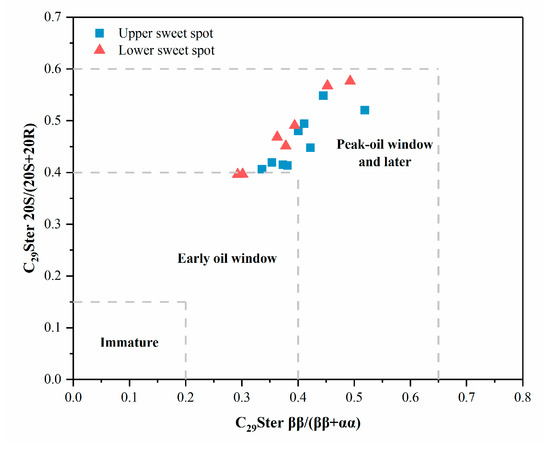
Figure 7.
Plot of C29Ster 20S/(20S+20R) vs. C29Ster ββ/(ββ+αα) showing the similar thermal maturity of upper and lower sweet spot oil samples.
4.2.3. Chromans and Aryl Isoprenoids
2-methyl-4,8,12-trimethytridecyl chromans (MTTCs) have homologs, such as mono-methyl (δ-MTTC), dimethyl (γ-MTTC, β-MTTC, and ζ-MTTC), and trimethyl (α-MTTC) based on the number of methyl substituents. In the crude oil of the Lucaogou formation, except for ζ-MTTC, all the other four homologs can be identified (Figure 8a, b). The MTTCI [α-MTTC/(γ-MTTC + β-MTTC + δ-MTTC)] of USS crude oil is between 0.59 and 0.90, while the LSS crude oil MTTCI is between 0.43 and 0.69. Aryl isoprenoid compounds with C15 homologs as the main peak can also be detected in crude oil samples (Figure 8c). These compounds are thought to derive from isorenieratene or β-isorenieratene in green sulfur bacteria (Chlorobiaceae), which is a kind of anoxygenic phototrophic bacteria that depends on both light and H2S for its survival.
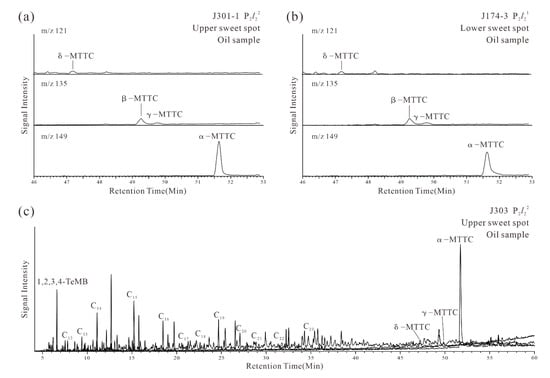
Figure 8.
(a,b) Representative mass chromatograms (m/z = 121, 135, and 149) showing the 2-methyl-4,8,12-trimethytridecyl chroman (MTTC) distribution of upper and lower sweet spot oil samples; and (c) combined mass chromatograms of m/z 120 + 121 + 133 + 134 showing MTTC and aryl isoprenoid distributions for crude oils from Jimsar sag.
4.3. Elemental Geochemistry Characteristics of Core Samples
4.3.1. Distribution of Major and Trace Elements.
The source rocks of the Lucaogou formation in Jimusar sag contain SiO2, Al2O3, TiO2, Fe2O3, MnO, P2O5, CaO, MgO, K2O, and Na2O, as shown in Table S2. Using the upper continental crust (UCC) [58] to normalize the oxide data, most samples depleted in SiO2, Al2O3, Na2O, K2O, and TiO2. P2O5 and Fe2O3 generally showed enrichment in USS samples and depletion in LSS samples. Because the Lucaogou formation rocks are primary dolomitic mudstone, limestone, and dolostone, most of the samples were enriched in MgO and CaO (Figure 9a). The content of Sc, V, Cr, Mo, and Cd shows little difference between the USS and LSS samples. For the content of Co, Ni, Cu, Zn, Rb, Ba, and Pb, the USS samples exhibit significantly higher values than those in the LSS samples, while the content of Sr is more abundant in the LSS samples (Table S2). Compared with the Post-Archean Australian shale average (PAAS) [59], the source rocks of the Lucaogou formation are significantly enriched in Ni, Cu, Zn, Sr, Mo, Cd, and U, but lack Rb, Nb, Th, and other elements (Figure 9b).
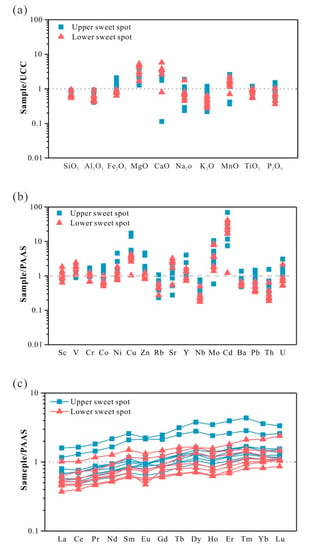
Figure 9.
Plot of the enrichment index of (a) the major elemental oxides (relative to the upper continental crust); (b) trace elements; and (c) rare earth elements (relative to the Post-Archean Australian shale average) in upper and lower sweet spot source rocks. The dashed line represents an enrichment index with a value of 1.
4.3.2. REE Distribution and PAAS Normalized Patterns.
The total rare earth element (ΣREE) content in the samples is between 56.71 and 282.42 ppm (ave. 118.63 ppm). The average ΣREE in the USS samples is 127.19 ppm, which is slightly higher than 99.06ppm in the LSS samples (Table S2). The light rare earth element (LREE)/heavy rare earth element (HREE) that varies from 3.29 to 6.89 shows that LREE is more enriched than HREE; however, the value is lower than 9.54 for PAAS. Therefore, the REE distribution pattern normalized by PAAS shows that the LREE of the samples is deficient compared with PAAS, and the HREE of the samples is enriched compared with PAAS (Figure 9c). Cerium anomalies (Ce/Ce* = 3CeN/(2LaN + NdN)) were calculated [60], where N refers to the normalization of concentrations against the PAAS. The Ce/Ce* values show negative Ce anomalies, and vary between 0.89 and 1.04, with little difference between upper and lower sweet spots.
5. Discussion
5.1. Paleoclimate and Paleoenvironment
The paleoclimate is key to determining the water depth, weathering, clastic transport, and aquatic conditions, all of which control the characteristics of deposited OM. Zhao, et al. [61], Cao, et al. [62], and Moradi, et al. [63] applied the C-value [C-value = Σ(Fe + Mn + Cr + Ni + V + Co)/Σ(Ca + Mg + Sr + Ba + K + Na)] as a pointer of paleoclimate. This value may decrease due to paleoclimate changes from warm and humid to hot and arid, because Fe, Mn, Cr, Ni, V, and Co are enriched under humid circumstances, whereas Ca, Mg, Sr, Ba, K, and Na are concentrated under arid circumstances. The C-value of USS samples averaged out at 0.23 and that of the LSS samples averaged out at 0.14, indicating a warm and semiarid paleoclimate and that the LSS was more arid during the deposition period. Other frequently used paleoenvironmental geochemical indicators, such as Sr/Cu (averaged out at 3.88 for USS samples and averaged out at 10.06 for LSS samples) and Rb/Sr (averaged out at 0.20 for USS samples and averaged out at 0.09 for LSS samples), all support the conclusion drawn from the C-value in the above. The higher (Al + Fe)/(Ca + Mg) ratio can reflect the deeper lake water, and this ratio of the USS samples is higher than that of the LSS sample, with their average values being 0.79 and 0.62, respectively, signifying that the water was deeper throughout the sedimentary period of the USS. The parameters of the major and trace elements of 16 samples are presented in Table 2.

Table 2.
Element geochemistry parameters of Lucaogou Formation source rocks in Jimsar sag.
β-carotane, which evolves from carotenoids, is principally associated with anoxic, saline lacustrine, or highly restricted marine settings [64,65]. Because precursors of extended tricyclic terpanes are rich in saline lacustrine settings, extended tricyclic terpane ratio (ETR) is an effective indicator for evaluating the water salinity [65,66]. The relative abundance of β-carotane, as well as the value of ETR, in the LSS crude oil is obviously higher than that in the upper sweet spot crude oil (Table S1), indicating that the water salinity was higher during the LSS period. Ts/Tm is often used to characterize the maturity of OM. The higher the maturity, the larger the Ts/Tm; however, this ratio for samples in Jimsar sag is extremely low (Table S1), demonstrating that it was affected by the sedimentary environment and can no longer be used as a maturity indicator. Peters [65], Moldowan, et al. [67], and Li [68] believe that saline lacustrine environments and carbonate rock with low clay mineral will restrict the formation of Ts. Therefore, the low Ts content in the shale oil may due to the high salinity water condition and low clay mineral content.
Although the origin and precursors of MTTCs are still controversial [69], using MTTCs’ relative abundance to evaluate the water salinity can be useful [70,71,72]. This investigation applies MTTCI (MTTCI = α-MTTC/∑MTTCs) to estimate the paleosalinity and the MTTCI of the LSS samples is significantly lower than that of the USS samples (Table S1). Since the abundance of αMTTC tends to decrease in a saline setting, the result indicates that the LSS had a higher salinity during sedimentation. The salinity of USS and LSS periods was estimated by a Pr/Ph versus MTTCI diagram [70]. The diagram shows that the LSS samples primarily fell into the normal marine-like salinity zone. In contrast, the USS samples primarily fell into the semi-saline to freshwater zone (Figure 10). The above conclusion is supported by the effective inorganic geochemical index Sr/Ba of LSS samples (ave. = 2.42), which is significantly higher than that of USS samples (ave. = 1.39) (Table 2).
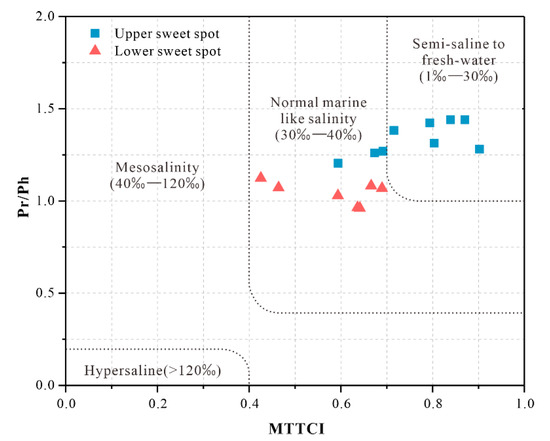
Figure 10.
Correlation of Pr/Ph vs. MTTCI and lacustrine water salinity assessment of the Lucaogou formation [70].
Gammacerane is highly specific for water-column stratification (commonly due to hypersalinity) because the principal source of its precursor tetrahymanol appears to be bacterivorous ciliates, which occur at the interface between oxic and anoxic zones in stratified water columns [65]. The higher the Ga/C31Hop, the more obvious the stratification of the water-column. According to Figure 11, the Ga/C31Hop is positively correlated with MTTCI. Meanwhile, the Ga/C31Hop and MTTCI of USS samples are higher than the LSS samples, which seems a bit contradictory. However, this is because the water was stratified intensively during the USS period, and the salinity of the bottom water (aphotic zone) is obviously higher than that of the top water (photic zone). Additionally, MTTCs are most likely derived from direct biosynthesis by photosynthetic primary producers [73,74,75], so more α-MTTC was synthesized in the photic zone with the freshwater setting. Nevertheless, during the LSS period, resulting from factors such as the relatively shallow water body, the salinity stratification of the lacustrine was not obvious, and the bottom water has a similar salinity to the top water, so more δ-MTTC was synthesized in the brackish lake setting. The investigations of Zhang, Jiang, Sun, Xie and Chai [69] and Kenig, et al. [76] have evidenced this inference.
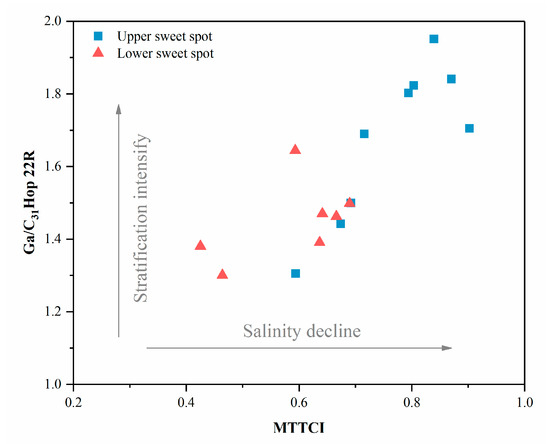
Figure 11.
Positive correlation of gammacerane/C3122R hopane and MTTCI reflecting the relationship between water-column salinity and the stratification level.
5.2. The Provenance of Organic Matter
The distribution pattern of n-alkane with nC23 as the main carbon is common in saline lacustrine settings and relates to the prosperity of some special algae [70,77]. The Paq index [(nC23 + nC25)/(nC23 + nC25 + nC29 + nC31)] can indicate the relative relationship between submerged and floating macrophytes and the input of terrestrial higher plants [78]. The average Paq values of USS and LSS samples are 0.78 and 0.75 (Table 1). The predominance of nC23 and nC25 suggests that an abundant input of submerged and floating macrophytes were the main provenance of OM. The relationship between Pr/nC17 and Pr/nC18 indicates that the OM principally originates from phytoplankton (Figure 12), consistent with the results obtained through Paq.
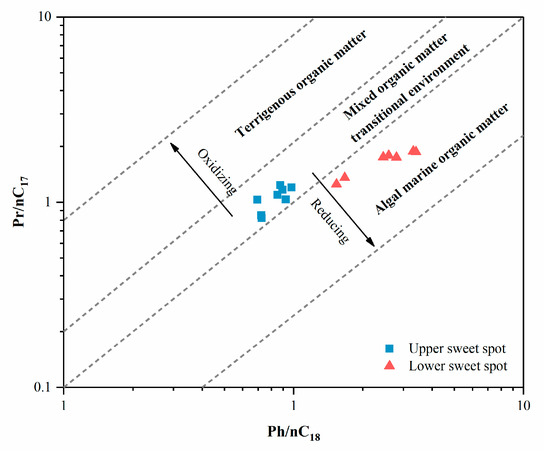
Figure 12.
Plot of phytane to nC18 alkane (Ph/nC18) vs. pristane to nC17 alkane (Pr/nC17), showing depositional conditions and types of organic matter.
Neither crude oil nor source rock samples detected the oleanane, which was produced by angiosperms [79]. Meanwhile, tricyclic diterpanes and tetracyclic diterpanes, with a high specificity for various gymnosperm and angiosperm inputs [65], were not detected. The macerals of the source rocks in the Jimusar Lucaogou formation are primarily sapropelinite, with a content of 5% to 43.1%, while the sum content of the vitrinite and liptinite is between 0.5% and 4.1%, according to the data from Xinjiang Oilfield Company. Except for biomarkers and macerals, the average stable δ13C values of the whole oil, saturated hydrocarbon, and aromatic hydrocarbon in crude oil samples are -31,59‰, -32.60‰, and -30.30‰. These show that the higher plants barely contributed to the OM.
The relative amount of C27, C28, and C29 regular sterane in oil can determine the sedimentary setting. Cao, et al. [80] inferred a significant contribution from terrigenous OM of the Lucaogou formation due to the C29Ster content being the highest and C27Ster content being the lowest. Through the correlation between the abundance of C29Ster and the abundance of β-carotane, Ding, et al. [81] considered the biological origin of β-carotane as mainly terrigenous OM transported into the Jimsar Sag, not OM derived from aquatic bacteria and algae. It must be noted, however, that C29Ster is not only derived from terrestrial vascular plants. Volkman [82], Volkman, et al. [83], and Moldowan, et al. [84,85] mentioned that some non-marine benthos brown algae, green algae, and even cyanobacteria may produce β-sitosterol and C29Ster. Therefore, it is necessary to be careful when using the C29Ster abundance as an input evaluation criterion for higher plants. Combined with the previous analysis, the terrestrial higher plant input in the study area is insignificant, and it is considered that the high abundance of C29Ster is likely to have originated from some special algae related to the saltwater setting. This also explains why a higher abundance of C29Ster is displayed in the LSS samples with a higher water salinity. The low sterane/hopane ratio and TT/17 α-hopane ratio (Table S1) in the Jimsar sag samples may reflect the microbial transformation of dead phytoplankton during deposition.
5.3. Factors Affecting the Enrichment of Organic Matter
Phosphorus (P) is the most important nutrient element of phytoplankton, and also an important part of the biotic skeleton. According to the DSDP and ODP drilling data, there is often a positive correlation between the buried phosphorus and the organic carbon [86]. Here, the average P/Ti of the USS samples is 0.25, which is higher than the 0.18 value of the LSS samples (Table 2). Iron (Fe) is a necessary limiting nutrient element for photosynthesis. Fe can effectively promote the growth of phytoplankton in high-nutrient/low-chlorophyll (HNLC) regions and can also regulate the nitrogen fixation in low-nutrient regions [39,87]. The mean Fe content of the USS and LSS samples in the study area is 3.651% and 2.407%, respectively (Table 2). As BaSO4 often precipitates with the deposition of OM, barium (Ba) is an important paleoproductivity estimation index [88,89]. The Ba/Al in USS and LSS samples is 0.0091 and 0.0078, respectively (Table 2). The parameters of P, Fe, and Ba indicate that the USS period had higher primary productivity, without exception.
The C29Hop/C30Hop and C35Hop 22S/C34Hop 22S indicate the anoxic lacustrine environment in the study area. In Figure 13, the LSS data are basically located in the upper right of the USS data, demonstrating that the oxygen-bearing level in the LSS water is lower. The detection of aryl isoprenoids from Chlorobiaceae may indicate the anoxic photic zone phenomenon during the deposition period of the Lucaogou formation.
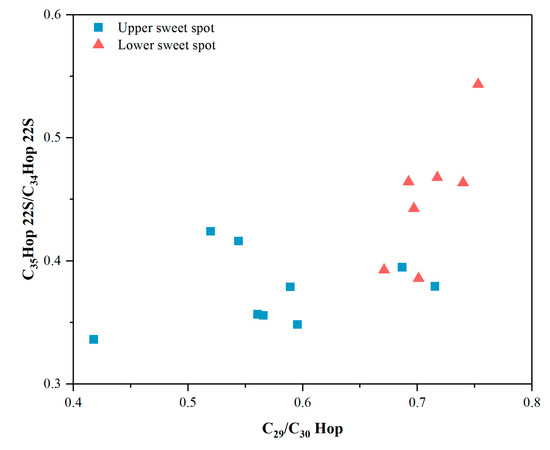
Figure 13.
Plot of C3522S hopane/C3422S hopane vs. C29 norhopane/C30 hopane, showing the suboxic to anoxic water column of the Lucaogou formation.
By studying the relationship between V/(V + Ni) and the degree of pyritization (DOP), Hatch and Leventhal [90] considered that when V/(V + Ni) > 0.84 reflects a dissolved H2S euxinic water column, V/(V + Ni) in 0.54–0.72 reflects an anoxic water column, and V/(V + Ni) in 0.46–0.60 reflects a dysoxic water column. The V/(V + Ni) of the USS sample is between 0.48 and 0.83, with a mean of 0.74, and the LSS sample V/(V + Ni) is between 0.76 and 0.88, with a mean of 0.82 (Table 2). V/Cr is also used to assess the redox conditions. It is generally believed that a ratio of less than 2 reflects an oxic environment; a ratio greater than 4.25 reflects an anoxic condition; and when the ratio is between 2 and 4.25, it represents a suboxic or dysoxic condition [91]. The average V/Cr value of the upper and lower sweet spots samples is 2.38 and 3.13, respectively (Table 2). U/Th < 0.75 reflects an oxidic environment, a U/Th ratio between 0.75 and 1.25 reflects a suboxic environment, and U/Th > 1.25 reflects an anoxic water environment [92]. The average U/Th of the USS samples is 0.75, which is 0.13 lower than that of the LSS samples (Table 2). These three ratios reflect the dysoxic to anoxic water column during the Lucaogou formation and the oxygen content in the LSS was lower.
Compared with the above parameters, the Mo-U enrichment factor ratio (MoEF/UEF) is a relatively new parameter. Their logarithmic cross plot can reflect the oxygen-bearing characteristics of the water body in the sedimentary environment [93,94]. Enrichment factors (EF) were calculated as
where X and Al represent the weight percent concentrations of elements X and Al, respectively. Samples were normalized using the PAAS. Figure 14 shows that the Lucaogou formation was deposited in a dysoxic to anoxic water environment.
XEF = [(X/Al)sample/(X/Al)PAAS],
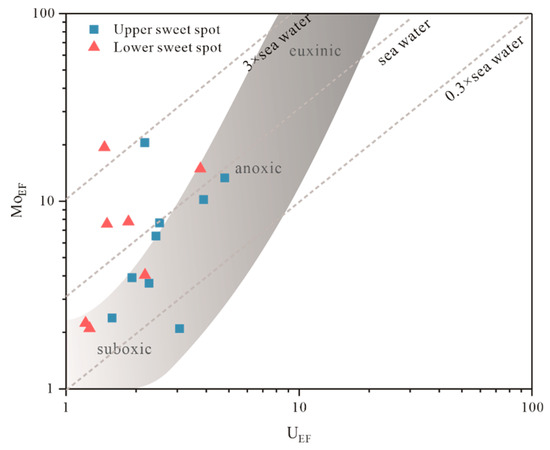
Figure 14.
UEF vs. MoEF for late Pliensbachian–early Toarcian samples. The diagonal lines represent multiples (0.3, 1, and 3) of the Mo:U ratio of present-day seawater [93,94].
The cerium element mainly exists in the form of Ce3+ in seawater and sediments. In general, Ce3+ can be oxidized to Ce4+ under an oxic condition, resulting in the depletion of Ce. However, under a dysoxic and anoxic environment, Ce4+ will be reduced to Ce3+, leading to the enrichment of Ce [95,96]. Therefore, Ce/Ce* can reflect the redox conditions. Generally, Ce/Ce* > 0.79 indicates an anoxic environment [60]. The minor negative Ce anomaly values of USS (0.89–1.02) and LSS (0.90–1.04) samples suggest an anoxic setting, which is comparable to the analysis deduced above.
There is no obvious correlation between TOC and redox indicators (Figure 15), signifying that the difference of redox conditions between upper and lower sweet spots cannot have a decisive role in OM accumulation. Comparatively, based on the correlation diagrams for P/Ti, Ba/Al, Fe, and TOC, a positive relationship was found, indicating that paleoproductivity is the vital factor controlling the enrichment of OM (Figure 15). Higher paleoproductivity ensures abundant organic carbon sources.

Figure 15.
(a–c) Correlation between paleoproductivity indicators viz. P / Ti, Ba/Al, and Fe content and TOC. (d–i) Correlation between water column redox condition indicators viz. V / (V + Ni), V/Cr, U/Th, Pr/Ph, C3522S hopane/C3422S hopane, and C29 norhopane/C30 hopane and TOC.
P, Fe, and other important macronutrients are obviously enriched in the USS samples, which is likely due to the rapid release of numerous elements carried by volcanic ash. The appropriate number of nutrient elements meant that a large number of algae were reproduced in the lacustrine basin, which greatly promoted the transformation from inorganic carbon to organic carbon. The cores with a banded structure, characterized by the interbed between dark OM layers and light terrigenous clastic or carbonate mineral layers, indicate the occurrence of the algae bloom. As mentioned in 5.1, during the USS stage, the lake was deeper and had a lower salinity, and the strong stratification of the water further intensified the desalination of the USS water. Therefore, the lacustrine environment in the top layer of the photic zone was more suitable for the survival of phytoplankton. In the process of deposition after the death of algae, one part of the organic carbon was decomposed and the other part was preserved. The Lucaogou formation was deposited in an oxygen-depleted setting, and the anoxic photic zone occurred in both USS and LSS. Although the oxygen content in the USS was slightly higher than that in the LSS, OM did not undergo more severe decomposition. Organic matter was well-preserved in both USS and LSS periods.
Li et al. [97], Ding et al. [98], and Liu et al. [99] found volcanic tuff and exhalative rocks with porphyritic structures in the core samples, which indicates that the Lucaogou formation in the study area has been affected by volcanic activity. Moderate paleoclimate and ample nutrients released by volcanic ash promoted algae bloom and ensured adequate OM. At the same time, the anoxic environment was capable of preserving OM and the weak weathering meant that the OM was only slightly diluted. As a result, thick organic-rich mudstone and dolomite with a good hydrocarbon generation potential have been deposited in the Lucaogou formation, especially USS, in Jimusar sag. The silty-fine sandstone interbedded with mudstone and dolomite was deposited in the lacustrine basin during the regressive stage, which became the reservoir of crude oil generated by adjacent source rocks.
6. Conclusions
The source rocks of the Lucaogou formation in Jimsar have considerable hydrocarbon-generating potential. The proportion of excellent source rocks can reach 50%. The main types of OM are type I and type II1 kerogen, with some type II2 kerogen and very little type III kerogen. The content and type of OM of the USS samples are both slightly better than the LSS samples.
The Lucaogou formation was deposited in a warm and semi-arid environment. During the sedimentary period, the LSS was drier and hotter than the USS. The different paleoclimate made the water evaporation more serious throughout the LSS period, which caused the shallower and higher salinity water column. Due to the shallower lacustrine basin, salinity stratification during the LSS period was not as obvious as in the USS period. Simultaneously, both organic and inorganic geochemical indicators demonstrate that the water body was under an anoxic background, in which the oxygen was depleted more in LSS than USS.
The shale oil in the Lucaogou formation is principally derived from aquatic organisms such as algae, while the contribution of higher plants is minor. The high abundance of C29 regular sterane in the samples does not come from terrestrial higher plants, but from some special algae living in saline lacustrine. A cautious attitude must be taken when using the regular sterane distribution pattern as the means of determining the OM origin in comparable sedimentary environments.
Despite the OM having been modified by microorganisms in the process of sedimentation, owing to the occurrence of the anoxic photic zone and the exhaustion of oxygen, the oxidative decomposition was not serious. Meanwhile, the discrepancy of redox conditions among LSS and USS was not sufficient to result in differences in the preservation and enrichment of OM between them.
With more suitable climate and water conditions, as well as the rich nutrients brought by the deposition of volcanic ash, aquatic organisms such as algae in the lacustrine basin were more prosperous throughout the deposition period of USS. The blooming of algae means that the study area has a high paleoproductivity, and primary productivity is the most important key controlling factor of OM accumulation and hydrocarbon generation in the study area.
Supplementary Materials
The following are available online at https://www.mdpi.com/1996-1073/13/6/1488/s1: Table S1: The parameters of molecular markers of crude oil samples; and Table S2: Elemental geochemistry experiment data of source rocks.
Author Contributions
Conceptualization, Y.J.; methodology, Y.J. and Z.Z.; validation, H.L. and Z.Z..; formal analysis, Y.J..; investigation, Y.J. and H.L.; data curation, R.G.; writing—original draft preparation, Y.J.; writing—review and editing, Y.J. and D.H.; visualization, Y.J. and R.G.; supervision, D.H. All authors have read and agreed to the published version of the manuscript.
Funding
This research was funded by the National Science and Technology Major Project, grant number 2016ZX05027-001-003.
Acknowledgments
We would like to thank the Xinjiang Oilfield Company of PetroChina, Ltd., for kindly providing part of the data for this study.
Conflicts of Interest
The authors declare no conflicts of interest.
References
- Bradley, W. Oil shale formed in desert environment: Green River Formation, Wyoming. Geol. Soc. Am. Bull. 1973, 84, 1121–1124. [Google Scholar] [CrossRef]
- Carroll, A.R.; Brassell, S.C.; Graham, S.A. Upper Permian Lacustrine Oil Shales, Southern Junggar Basin, Northwest China (1). AAPG Bull. 1992, 76, 1874–1902. [Google Scholar]
- Bohacs, K.M.; Carroll, A.R.; Neal, J.E.; Mankiewicz, P.J. Lake-basin type, source potential, and hydrocarbon character: An integrated sequence-stratigraphic-geochemical framework. Lake Basins Through Space Time Aapg Stud. Geol. 2000, 46, 3–34. [Google Scholar]
- Summons, R.E.; Hope, J.M.; Swart, R.; Walter, M.R. Origin of Nama Basin bitumen seeps: Petroleum derived from a Permian lacustrine source rock traversing southwestern Gondwana. Org. Geochem. 2008, 39, 589–607. [Google Scholar] [CrossRef]
- Petersen, H.; Holme, A.; Thomsen, E.; Whitaker, M.; Brekke, T.; Bojesen-Koefoed, J.; Hansen, K.; Larsen, B. Hydrocarbon potential of Middle Jurassic coaly and lacustrine and Upper Jurassic–lowermost Cretaceous marine source rocks in the Søgne Basin, North Sea. J. Pet. Geol. 2011, 34, 277–304. [Google Scholar] [CrossRef]
- Ma, Y.; Fan, M.; Lu, Y.; Liu, H.; Hao, Y.; Xie, Z.; Liu, Z.; Peng, L.; Du, X.; Hu, H. Climate-driven paleolimnological change controls lacustrine mudstone depositional process and organic matter accumulation: Constraints from lithofacies and geochemical studies in the Zhanhua Depression, eastern China. Int. J. Coal Geol. 2016, 167, 103–118. [Google Scholar] [CrossRef]
- Demaison, G.J.; Moore, G.T. Anoxic environments and oil source bed genesis. Org. Geochem. 1980, 2, 9–31. [Google Scholar] [CrossRef]
- Calvert, S. Oceanographic controls on the accumulation of organic matter in marine sediments. Geol. Soc. Lond. Spec. Publ. 1987, 26, 137–151. [Google Scholar] [CrossRef]
- Pedersen, T.; Calvert, S. Anoxia vs. productivity: What controls the formation of organic-carbon-rich sediments and sedimentary Rocks? AAPG Bull. 1990, 74, 454–466. [Google Scholar]
- Meyers, P.A.; Ishiwatari, R. Lacustrine organic geochemistry—An overview of indicators of organic matter sources and diagenesis in lake sediments. Org. Geochem. 1993, 20, 867–900. [Google Scholar] [CrossRef]
- Murphy, A.E.; Sageman, B.B.; Hollander, D.J.; Lyons, T.W.; Brett, C.E. Black shale deposition and faunal overturn in the Devonian Appalachian Basin: Clastic starvation, seasonal water-column mixing, and efficient biolimiting nutrient recycling. Paleoceanography 2000, 15, 280–291. [Google Scholar] [CrossRef]
- Gonçalves, F.T. Organic and isotope geochemistry of the Early Cretaceous rift sequence in the Camamu Basin, Brazil: Paleolimnological inferences and source rock models. Org. Geochem. 2002, 33, 67–80. [Google Scholar] [CrossRef]
- Bechtel, A.; Jia, J.; Strobl, S.A.; Sachsenhofer, R.F.; Liu, Z.; Gratzer, R.; Püttmann, W. Palaeoenvironmental conditions during deposition of the Upper Cretaceous oil shale sequences in the Songliao Basin (NE China): Implications from geochemical analysis. Org. Geochem. 2012, 46, 76–95. [Google Scholar] [CrossRef]
- Zeng, S.; Wang, J.; Fu, X.; Chen, W.; Feng, X.; Wang, D.; Song, C.; Wang, Z. Geochemical characteristics, redox conditions, and organic matter accumulation of marine oil shale from the Changliang Mountain area, northern Tibet, China. Mar. Pet. Geol. 2015, 64, 203–221. [Google Scholar] [CrossRef]
- Cecil, C.B. Paleoclimate controls on stratigraphic repetition of chemical and siliciclastic rocks. Geology 1990, 18, 533–536. [Google Scholar] [CrossRef]
- Meyers, P.A. Organic geochemical proxies of paleoceanographic, paleolimnologic, and paleoclimatic processes. Org. Geochem. 1997, 27, 213–250. [Google Scholar] [CrossRef]
- Xie, S.; Nott, C.J.; Avsejs, L.A.; Maddy, D.; Chambers, F.M.; Evershed, R.P. Molecular and isotopic stratigraphy in an ombrotrophic mire for paleoclimate reconstruction. Geochim. Cosmochim. Acta 2004, 68, 2849–2862. [Google Scholar] [CrossRef]
- Kohn, M.J. Carbon isotope compositions of terrestrial C3 plants as indicators of (paleo) ecology and (paleo) climate. Proc. Natl. Acad. Sci. USA 2010, 107, 19691–19695. [Google Scholar] [CrossRef]
- Wu, P.; Hou, D.; Gan, J.; Li, X.; Ding, W.; Liang, G.; Wu, B. Paleoenvironment and Controlling Factors of Oligocene Source Rock in the Eastern Deep-Water Area of the Qiongdongnan Basin: Evidences from Organic Geochemistry and Palynology. Energy Fuels 2018, 32, 7423–7437. [Google Scholar] [CrossRef]
- Stüeken, E.E.; Kipp, M.A.; Koehler, M.C.; Buick, R. The evolution of Earth’s biogeochemical nitrogen cycle. Earth-Sci. Rev. 2016, 160, 220–239. [Google Scholar]
- Stüeken, E.E.; Martinez, A.; Love, G.; Olsen, P.E.; Bates, S.; Lyons, T.W. Effects of pH on redox proxies in a Jurassic rift lake: Implications for interpreting environmental records in deep time. Geochim. Cosmochim. Acta 2019, 252, 240–267. [Google Scholar] [CrossRef]
- Grant, W.; Gerday, C.; Glansdorff, N. Alkaline Environments and Biodiversity; Eolss Publishers: Oxford, UK, 2006. [Google Scholar]
- Katz, B. The Green River Shale: An Eocene carbonate lacustrine source rock. In Petroleum Source Rocks; Springer: Berlin/Heidelberg, Germany, 1995; pp. 309–324. [Google Scholar]
- Cumming, V.M.; Selby, D.; Lillis, P.G. Re–Os geochronology of the lacustrine Green River Formation: Insights into direct depositional dating of lacustrine successions, Re–Os systematics and paleocontinental weathering. Earth Planet. Sci. Lett. 2012, 359, 194–205. [Google Scholar] [CrossRef]
- Johnson, R.; Mercier, T.; Brownfield, M.; Self, J. Assessment of In-Place Oil Shale Resources of the Green River Formation, Uinta Basin, Utah and Colorado; US Geological Survey: Denver, CO, USA, 2010.
- Berg, M.D.V. Basin-wide Evaluation of the Uppermost Green River Formation’s Oil-shale Resource, Uinta Basin, Utah and Colorado; Utah Geological Survey: Salt Lake City, UT, USA, 2008; Volume 128. [Google Scholar]
- Collister, J.W.; Hayes, J. A Preliminary Study of the Carbon and Nitrogen Isotopic Biogeochemistry of Lacustrine Sedimentary Rocks from the Green River Formation, Wyoming, Utah, and Colorado; U.S. Geological Survey: Denver, CO, USA, 1991; pp. 265–276.
- Kuang, L.; Yong, T.; Dewen, L.; Chang, Q.; Ouyang, M.; Lianhua, H.; Deguang, L. Formation conditions and exploration potential of tight oil in the Permian saline lacustrine dolomitic rock, Junggar Basin, NW China. Pet. Explor. Dev. 2012, 39, 700–711. [Google Scholar] [CrossRef]
- Zou, C.; Zhu, R.; Wu, S.; Yang, Z.; Tao, S.; Yuan, X.; Hou, L.; Yang, H.; Xu, C.; Li, D. Types, characteristics, genesis and prospects of conventional and unconventional hydrocarbon accumulations: Taking tight oil and tight gas in China as an instance. Acta Pet. Sin. 2012, 33, 173–187. [Google Scholar]
- Liang, H.; Xinning, L.; Qiang, M.; LIANG, H.; Quansheng, L.; Xuan, C.; Guojuan, B.; ZHANG, Q.; Yuanlin, M. Geological features and exploration potential of Permian Tiaohu Formation tight oil, Santanghu Basin, NW China. Pet. Explor. Dev. 2014, 41, 616–627. [Google Scholar] [CrossRef]
- Hu, T.; Pang, X.; Yu, S.; Wang, X.; Pang, H.; Guo, J.; Jiang, F.; Shen, W.; Wang, Q.; Xu, J. Hydrocarbon generation and expulsion characteristics of Lower Permian P1f source rocks in the Fengcheng area, northwest margin, Junggar Basin, NW China: Implications for tight oil accumulation potential assessment. Geol. J. 2016, 51, 880–900. [Google Scholar] [CrossRef]
- Frogner, P.; Gíslason, S.R.; Óskarsson, N. Fertilizing potential of volcanic ash in ocean surface water. Geology 2001, 29, 487–490. [Google Scholar] [CrossRef]
- Witham, C.S.; Oppenheimer, C.; Horwell, C.J. Volcanic ash-leachates: A review and recommendations for sampling methods. J. Volcanol. Geotherm. Res. 2005, 141, 299–326. [Google Scholar] [CrossRef]
- Kockum, P.C.F.; Herbert, R.B.; Gislason, S.R. A diverse ecosystem response to volcanic aerosols. Chem. Geol. 2006, 231, 57–66. [Google Scholar] [CrossRef]
- Hoffmann, L.J.; Breitbarth, E.; Ardelan, M.; Duggen, S.; Olgun, N.; Hassellöv, M.; Wängberg, S.-Å. Influence of trace metal release from volcanic ash on growth of Thalassiosira pseudonana and Emiliania huxleyi. Mar. Chem. 2012, 132, 28–33. [Google Scholar] [CrossRef]
- Brand, L.E.; Sunda, W.G.; Guillard, R.R. Reduction of marine phytoplankton reproduction rates by copper and cadmium. J. Exp. Mar. Biol. Ecol. 1986, 96, 225–250. [Google Scholar] [CrossRef]
- Paytan, A.; Mackey, K.R.; Chen, Y.; Lima, I.D.; Doney, S.C.; Mahowald, N.; Labiosa, R.; Post, A.F. Toxicity of atmospheric aerosols on marine phytoplankton. Proc. Natl. Acad. Sci. USA 2009, 106, 4601–4605. [Google Scholar] [CrossRef] [PubMed]
- Duggen, S.; Croot, P.; Schacht, U.; Hoffmann, L. Subduction zone volcanic ash can fertilize the surface ocean and stimulate phytoplankton growth: Evidence from biogeochemical experiments and satellite data. Geophys. Res. Lett. 2007, 34. [Google Scholar] [CrossRef]
- Langmann, B.; Zakšek, K.; Hort, M.; Duggen, S. Volcanic ash as fertiliser for the surface ocean. Atmos. Chem. Phys. 2010, 10, 3891–3899. [Google Scholar] [CrossRef]
- Hamme, R.C.; Webley, P.W.; Crawford, W.R.; Whitney, F.A.; DeGrandpre, M.D.; Emerson, S.R.; Eriksen, C.C.; Giesbrecht, K.E.; Gower, J.F.; Kavanaugh, M.T. Volcanic ash fuels anomalous plankton bloom in subarctic northeast Pacific. Geophys. Res. Lett. 2010, 37, L19604. [Google Scholar] [CrossRef]
- Clayton, J.L.; Yang, J.; King, J.D.; Lillis, P.G.; Warden, A. Geochemistry of oils from the Junggar basin, northwest China. AAPG Bull. -Am. Assoc. Pet. Geol. 1997, 81, 1926–1944. [Google Scholar]
- Wang, X.; Sun, L.; Zhu, R.; Jin, X.; Li, J.; Wu, S.; Bi, L.; Liu, X. Application of charging effects in evaluating storage space of tight reservoirs: A case study from Permian Lucaogou Formation in Jimusar sag, Junggar Basin, NW China. Pet. Explor. Dev. 2015, 42, 516–524. [Google Scholar] [CrossRef]
- Cao, Z.; Liu, G.; Zhan, H.; Gao, J.; Zhang, J.; Li, C.; Xiang, B. Geological roles of the siltstones in tight oil play. Mar. Pet. Geol. 2017, 83, 333–344. [Google Scholar] [CrossRef]
- Su, Y.; Zha, M.; Ding, X.; Qu, J.; Wang, X.; Yang, C.; Iglauer, S. Pore type and pore size distribution of tight reservoirs in the Permian Lucaogou Formation of the Jimsar Sag, Junggar Basin, NW China. Mar. Pet. Geol. 2018, 89, 761–774. [Google Scholar] [CrossRef]
- Zhang, S.; Cao, Y.; Liu, K.; Jahren, J.; Xi, K.; Zhu, R.; Yang, T.; Cao, X.; Wang, W. Characterization of lacustrine mixed fine-grained sedimentary rocks using coupled chemostratigraphic-petrographic analysis: A case study from a tight oil reservoir in the Jimusar Sag, Junggar Basin. Mar. Pet. Geol. 2019, 99, 453–472. [Google Scholar] [CrossRef]
- Fang, S.; Xu, H.; Song, Y.; Li, J. Characteristics and Evolution of the Composite Petroleum System in Jimsar Depression, Eastern Junggar Basin. Acta Geosci. Sin. 2005, 26, 259–264. [Google Scholar]
- Zhang, Y.; Zeng, L.; Luo, Q.; Zhang, C.; Wu, H.; Lv, W. Research on the types and genetic mechanisms of tight reservoir in the Lucaogou Formation in Jimusar Sag, Junggar Basin. Nat. Gas. Geosci. 2018, 29, 211–225. [Google Scholar]
- Kunag, L.; Wang, x.; Guo, X.; CHang, Q.; Jia, X. Geological characteristics and exploration practice of tight oil of Lucaogou Formation in Jimsar Sag. Xinjiang Pet. Geol. 2015, 36, 629–634. [Google Scholar]
- Xi, K.; Cao, Y.; Zhu, R.; Shao, Y.; Xue, X.; Wang, X. Rock types and characteristics of tight oil reservoir in Permian Lucaogou Formation, Jimsar sag. Acta Pet. Sin. 2015, 36, 1495–1507. [Google Scholar]
- Qiu, Z.; Shi, Z.; Dong, D.; Lu, B.; Zhang, C.; Zhou, J.; Wang, H.; Xiong, B.; Pang, Z.; Guo, H. Geological characteristics of source rock and reservoir of tight oil and its accumulation mechanism: A case study of Permian Lucaogou Formation in Jimusar sag, Junggar Basin. Pet. Explor. Dev. 2016, 43, 1013–1024. [Google Scholar] [CrossRef]
- Qiu, Z.; Tao, H.; Zou, C.; Wang, H.; Ji, H.; Zhou, S. Lithofacies and organic geochemistry of the Middle Permian Lucaogou Formation in the Jimusar Sag of the Junggar Basin, NW China. J. Pet. Sci. Eng. 2016, 140, 97–107. [Google Scholar] [CrossRef]
- Yang, Y.; Qiu, L.; Cao, Y.; Chen, C.; Lei, D.; Wan, M. Reservoir quality and diagenesis of the Permian Lucaogou Formation tight carbonates in Jimsar Sag, Junggar Basin, West China. J. Earth Sci. 2017, 28, 1032–1046. [Google Scholar] [CrossRef]
- Standardization Administration of the People’s Republic of China. GB/T 14506.28−2010, Method for Chemical Analysis of Silicate Rocks—Part 28: Determination of 16 Major and Minor Elements Content; Standardization Administration of the P.R.C.: Beijing, China, 2010.
- Standardization Administration of the People’s Republic of China. GB/T 14506.30−2010, Method for Chemical Analysis of Silicate Rocks—Part 30: Determination of 44 Elements; Standardization Administration of the P.R.C.: Beijing, China, 2010.
- Standardization Administration of the People’s Republic of China. GB/T 19145−2003, Determination of Total Organic Carbon in Sedimentary Rock; Standardization Administration of the P.R.C.: Beijing, China, 2003.
- Standardization Administration of the People’s Republic of China. GB/T 18602−2012, Rock Pyrolysis Analysis; Standardization Administration of the P.R.C.: Beijing, China, 2012.
- Jarvie, D.M. Shale resource systems for oil and gas: Part 2—Shale-oil resource systems. AAPG Bull. 2012, 97, 89–119. [Google Scholar]
- Rudnick, R.L.; Gao, S. Composition of the continental crust. Treatise Geochem. 2003, 3, 659. [Google Scholar]
- Taylor, S.R.; McLennan, S.M. The Continental Crust: Its Composition and Evolution; Blackwell Scientific Publications: Hoboken, NJ, USA, 1985. [Google Scholar]
- Wright, J.; Schrader, H.; Holser, W.T. Paleoredox variations in ancient oceans recorded by rare earth elements in fossil apatite. Geochim. Cosmochim. Acta 1987, 51, 631–644. [Google Scholar] [CrossRef]
- Zhao, Z.; Zhao, J.; Wang, H.; Liao, J.; Liu, C. Distribution characteristics and applications of trace elements in Junggar Basin. Nat. Gas Explor. Dev. 2007, 30, 30–33. [Google Scholar]
- Cao, J.; Wu, M.; Chen, Y.; Hu, K.; Bian, L.; Wang, L.; Zhang, Y. Trace and rare earth element geochemistry of Jurassic mudstones in the northern Qaidam Basin, northwest China. Chem. Der Erde-Geochem. 2012, 72, 245–252. [Google Scholar] [CrossRef]
- Moradi, A.V.; Sarı, A.; Akkaya, P. Geochemistry of the Miocene oil shale (Hançili Formation) in the Çankırı-Çorum Basin, Central Turkey: Implications for Paleoclimate conditions, source–area weathering, provenance and tectonic setting. Sediment. Geol. 2016, 341, 289–303. [Google Scholar] [CrossRef]
- Jiang, Z.; Fowler, M. Carotenoid-derived alkanes in oils from northwestern China. Org. Geochem. 1986, 10, 831–839. [Google Scholar] [CrossRef]
- Peters, K.E. The Biomarker Guide, 2, Biomarkers and Isotopes in Petroleum Systems and Earth History; Cambridge University Press: Cambridge, UK, 2005. [Google Scholar]
- De Grande, S.; Neto, F.A.; Mello, M. Extended tricyclic terpanes in sediments and petroleums. Org. Geochem. 1993, 20, 1039–1047. [Google Scholar] [CrossRef]
- Moldowan, J.M.; Sundararaman, P.; Schoell, M. Sensitivity of biomarker properties to depositional environment and/or source input in the Lower Toarcian of SW-Germany. Org. Geochem. 1986, 10, 915–926. [Google Scholar] [CrossRef]
- Li, Z. Geochemical features and source analysis of crude oils from the western slope of Bayanhushu Sag, Hailaer Basin. Acta Pet. Sin. 2012, 33, 595–600. [Google Scholar]
- Zhang, Y.; Jiang, A.; Sun, Y.; Xie, L.; Chai, P. Stable carbon isotope compositions of isoprenoid chromans in Cenozoic saline lacustrine source rocks from the Western Qaidam Basin, NW China: Source implications. Chin. Sci. Bull. 2012, 57, 1013–1023. [Google Scholar] [CrossRef][Green Version]
- Schwark, L.; Vliex, M.; Schaeffer, P. Geochemical characterization of Malm Zeta laminated carbonates from the Franconian Alb, SW-Germany (II). Org. Geochem. 1998, 29, 1921–1952. [Google Scholar] [CrossRef]
- Yangming, Z.; Huanxin, W.; Aiguo, S.; Digang, L.; Dehua, P. Geochemical characteristics of Tertiary saline lacustrine oils in the Western Qaidam Basin, northwest China. Appl. Geochem. 2005, 20, 1875–1889. [Google Scholar] [CrossRef]
- Wang, L.; Song, Z.; Yin, Q.; George, S.C. Paleosalinity significance of occurrence and distribution of methyltrimethyltridecyl chromans in the Upper Cretaceous Nenjiang Formation, Songliao Basin, China. Org. Geochem. 2011, 42, 1411–1419. [Google Scholar] [CrossRef]
- Damsté, J.S.S.; Keely, B.J.; Betts, S.E.; Baas, M.; Maxwell, J.R.; de Leeuw, J.W. Variations in abundances and distributions of isoprenoid chromans and long-chain alkylbenzenes in sediments of the Mulhouse Basin: A molecular sedimentary record of palaeosalinity. Org. Geochem. 1993, 20, 1201–1215. [Google Scholar] [CrossRef]
- Li, M.; Larter, S.R.; Taylor, P.; Jones, D.M.; Bowler, B.; Bjorøy, M. Biomarkers or not biomarkers? A new hypothesis for the origin of pristane involving derivation from methyltrimethyltridecylchromans (MTTCs) formed during diagenesis from chlorophyll and alkylphenols. Org. Geochem. 1995, 23, 159–167. [Google Scholar] [CrossRef]
- Grice, K.; Schouten, S.; Peters, K.E.; Damsté, J.S.S. Molecular isotopic characterisation of hydrocarbon biomarkers in Palaeocene–Eocene evaporitic, lacustrine source rocks from the Jianghan Basin, China. Org. Geochem. 1998, 29, 1745–1764. [Google Scholar] [CrossRef]
- Kenig, F.; Damsté, J.S.S.; Frewin, N.L.; Hayes, J.; De Leeuw, J.W. Molecular indicators for palaeoenvironmental change in a Messinian evaporitic sequence (Vena del Gesso, Italy). II: High-resolution variations in abundances and 13C contents of free and sulphur-bound carbon skeletons in a single marl bed. Org. Geochem. 1995, 23, 485–526. [Google Scholar] [CrossRef]
- Van de Water, P.K.; Leavitt, S.W.; Betancourt, J. Trends in stomatal density and 13C/12C ratios of Pinus flexilis needles during last glacial-interglacial cycle. Science 1994, 264, 239–243. [Google Scholar] [CrossRef]
- Ficken, K.J.; Li, B.; Swain, D.; Eglinton, G. An n-alkane proxy for the sedimentary input of submerged/floating freshwater aquatic macrophytes. Org. Geochem. 2000, 31, 745–749. [Google Scholar] [CrossRef]
- Moldowan, J.M.; Dahl, J.; Huizinga, B.J.; Fago, F.J.; Hickey, L.J.; Peakman, T.M.; Taylor, D.W. The molecular fossil record of oleanane and its relation to angiosperms. Science 1994, 265, 768–771. [Google Scholar] [CrossRef]
- Cao, Z.; Liu, G.; Xiang, B.; Wang, P.; Niu, G.; Niu, Z.; Li, C.; Wang, C. Geochemical characteristics of crude oil from a tight oil reservoir in the Lucaogou Formation, Jimusar sag, Junggar Basin. AAPG Bull. 2017, 101, 39–72. [Google Scholar] [CrossRef]
- Ding, X.; Gao, C.; Zha, M.; Chen, H.; Su, Y. Depositional environment and factors controlling beta-carotane accumulation: A case study from the Jimsar Sag, Junggar Basin, northwestern China. Palaeogeogr. Palaeoclim. Palaeoecol. 2017, 485, 833–842. [Google Scholar] [CrossRef]
- Volkman, J.K. A Review of Sterol Markers for Marine and Terrigenous Organic-Matter. Org. Geochem. 1986, 9, 83–99. [Google Scholar] [CrossRef]
- Volkman, J.K.; Barrett, S.M.; Dunstan, G.A.; Jeffrey, S.W. Sterol Biomarkers for Microalgae from the Green Algal Class Prasinophyceae. Org. Geochem. 1994, 21, 1211–1218. [Google Scholar] [CrossRef]
- Moldowan, J.M.; Seifert, W.K.; Gallegos, E.J. Relationship between petroleum composition and depositional environment of petroleum source rocks. AAPG Bull. 1985, 69, 1255–1268. [Google Scholar]
- Moldowan, J.M.; Fago, F.J. Structure and Significance of a Novel Rearranged Monoaromatic Steroid Hydrocarbon in Petroleum. Geochim. Cosmochim. Acta 1986, 50, 343–351. [Google Scholar] [CrossRef]
- Föllmi, K. The phosphorus cycle, phosphogenesis and marine phosphate-rich deposits. Earth-Sci. Rev. 1996, 40, 55–124. [Google Scholar]
- Boyd, P.W.; Jickells, T.; Law, C.; Blain, S.; Boyle, E.; Buesseler, K.; Coale, K.; Cullen, J.; De Baar, H.J.; Follows, M. Mesoscale iron enrichment experiments 1993-2005: Synthesis and future directions. Science 2007, 315, 612–617. [Google Scholar] [CrossRef]
- Dehairs, F.; Chesselet, R.; Jedwab, J. Discrete suspended particles of barite and the barium cycle in the open ocean. Earth Planet. Sci. Lett. 1980, 49, 528–550. [Google Scholar] [CrossRef]
- Bishop, J.K. The barite-opal-organic carbon association in oceanic particulate matter. Nature 1988, 332, 341. [Google Scholar] [CrossRef]
- Hatch, J.; Leventhal, J. Relationship between inferred redox potential of the depositional environment and geochemistry of the Upper Pennsylvanian (Missourian) Stark Shale Member of the Dennis Limestone, Wabaunsee County, Kansas, USA. Chem. Geol. 1992, 99, 65–82. [Google Scholar] [CrossRef]
- Jones, B.; Manning, D.A. Comparison of geochemical indices used for the interpretation of palaeoredox conditions in ancient mudstones. Chem. Geol. 1994, 111, 111–129. [Google Scholar] [CrossRef]
- Adams, J.A.; Weaver, C.E. Thorium-to-uranium ratios as indicators of sedimentary processes: Example of concept of geochemical facies. AAPG Bull. 1958, 42, 387–430. [Google Scholar]
- Algeo, T.J.; Tribovillard, N. Environmental analysis of paleoceanographic systems based on molybdenum–uranium covariation. Chem. Geol. 2009, 268, 211–225. [Google Scholar] [CrossRef]
- Tribovillard, N.; Algeo, T.; Baudin, F.; Riboulleau, A. Analysis of marine environmental conditions based onmolybdenum–uranium covariation—Applications to Mesozoic paleoceanography. Chem. Geol. 2012, 324, 46–58. [Google Scholar] [CrossRef]
- Elderfield, H.; Greaves, M.J. The rare earth elements in seawater. Nature 1982, 296, 214–219. [Google Scholar] [CrossRef]
- De Baar, H.J.; Bacon, M.P.; Brewer, P.G.; Bruland, K.W. Rare earth elements in the Pacific and Atlantic Oceans. Geochim. Cosmochim. Acta 1985, 49, 1943–1959. [Google Scholar] [CrossRef]
- Li, H.; Liu, Y.; Zhang, L. Origin and Geological Significance of Sedimentary Exhalative Rocks with" Porphyritic" Structures in the Middle Permian Pingdiquan Formation, Eastern Junggar Basin. J. Paleogeography 2017, 19, 211–226. [Google Scholar]
- Ding, X.; Qu, J.; Imin, A.; Zha, M.; Su, Y.; Jiang, Z.; Jiang, H. Organic matter origin and accumulation in tuffaceous shale of the lower Permian Lucaogou Formation, Jimsar Sag. J. Pet. Sci. Eng. 2019, 179, 696–706. [Google Scholar] [CrossRef]
- Liu, Y.; Zhou, D.; Jiao, X.; Feng, Q.; Zhou, X. A preliminary study on the relationship between deep-sourced materials and hydrocarbon generation in lacustrine source rocks: An example from the Permian black rock series in Jimusar sag, Junggar Basin. J. Paleogeography 2019, 21, 9. [Google Scholar]
© 2020 by the authors. Licensee MDPI, Basel, Switzerland. This article is an open access article distributed under the terms and conditions of the Creative Commons Attribution (CC BY) license (http://creativecommons.org/licenses/by/4.0/).