Article

Analyzing the Validity of Brazilian Testing Using Digital Image Correlation and Numerical Simulation Techniques

Department of Petroleum Engineering, University of Louisiana, Lafayette, LA 70504, USA
*
Author to whom correspondence should be addressed.
Energies 2020, 13(6), 1441; https://doi.org/10.3390/en13061441
Submission received: 30 January 2020 / Revised: 2 March 2020 / Accepted: 16 March 2020 / Published: 19 March 2020
(This article belongs to the Special Issue Petroleum Geomechanics)

Abstract

:
Characterizing the mechanical behavior of rocks plays a crucial role to optimize the fracturing process in unconventional reservoirs. However, due to the intrinsic anisotropy and heterogeneity in unconventional resources, fracture process prediction remains the most significant challenge for sustainable and economic hydrocarbon production. During the deformation tracking under compression, deploying conventional methods (strain gauge, extensometer, etc.) is insufficient to measure the deformation since the physical attachment of the device is restricted to the size of the sample, monitoring limited point-wise deformation, producing difficulties in data retrieval, and a tendency to lose track in failure points, etc. Where conventional methods are limited, the application of digital image correlation (DIC) provides detailed and additional information of strain evolution and fracture patterns under loading. DIC is an image-based optical method that records an object with a camera and monitors the random contrast speckle pattern painted on the facing surface of the specimen. To overcome the existing limitations, this paper presents numerical modeling of Brazilian disc tests under quasi-static conditions to understand the full-field deformation behaviors and finally, it is validated by DIC. As the direct tensile test has limitations in sample preparation and test execution, the Brazilian testing principle is commonly used to evaluate indirectly the tensile strength of rocks. The two-dimensional numerical model was built to predict the stress distribution and full-field deformation on Brazilian disc under compression based on the assumptions of a homogenous, isotropic and linear elastic material. The uniaxial compression test was conducted using the DIC technique to determine the elastic properties of Spider Berea sandstone, which were used as inputs for the simulation model. The model was verified by the analytical solution and compared with the digital image correlation. The numerical simulation results showed that the solutions matched reasonably with the analytical solutions where the maximum deviation of stress distribution was obtained as 14.59%. The strain evolution (normal and shear strains) and displacements along the central horizontal and vertical planes were investigated in three distinguishable percentages of peak loads (20%, 40%, and 90%) to understand the deformation behaviors in rock. The simulation results demonstrated that the strain evolution contours consistently matched with DIC generated contours with a reasonable agreement. The changes in displacement along the central horizontal and vertical planes showed that numerical simulation and DIC generated experimental results were repeatable and matched closely. In terms of validation, Brazilian testing to measure the indirect tensile strength of rocks is still an issue of debate. The numerical model of fracture propagation supported by digital image correlation from this study can be used to explain the fracturing process in the homogeneous material and can be extended to non-homogeneous cases by incorporating heterogeneity, which is essential for rock mechanics field applications.

1. Introduction

Characterizing the mechanical behavior of rocks plays a key role in optimizing the fracturing process and enhancing production from unconventional reservoirs. However, due to complex mechanical stratigraphy and heterogeneity, sustainable economic oil and gas production is still the most challenging issue as a consistent prediction of the fracture process is critical [1,2,3]. Mitigating these problems requires the accurate determination of mechanical properties such as stress magnitudes, load-deformation nature, full-field deformation, and reasonable rock strength [4]. Therefore, an in-depth understanding of the deformation characteristics of rock is essential for sound recovery from unconventional resources.
The mechanism surrounding how a rock failure occurs is a complex process of several distinct intervals including stress accumulation, interaction, initiation of fracture, propagation, and final failure [5]. Although researchers had been trying to solve the problem of the complex rock failure process using local measurement systems (strain gauges, extensometer, LVDT, etc.), these were not accurate and sufficient enough for modeling the deformation behavior of rocks. Due to the sample preparation and installation between a rock specimen and loading platens, the measurement of rock deformation and tensile strength by direct tensile testing is a challenging task [6].
Brazilian testing is one of the most widely used indirect tensile testing methods mainly due to its simplicity of operation. In this test, a circular and thin disc specimen (concrete, rock, and rock-like material) is diametrically loaded [7] to obtain tensile strength [8,9].
Numerous experimental and numerical studies had been conducted to analyze stress distribution and strength determination during Brazilian testing [10,11,12,13,14]. However, the Brazilian testing under-estimated the strength of the rock; besides, in terms of failure mode and fracture initiation point, the validity of this test is still an issue of debate. According to the findings of some researchers [15,16], the center of the Brazilian disc is the fracture initiation point, which was substantiated by experimental and numerical investigations. However, the investigations of some other researchers [17,18,19,20] supported that the crack initiation point was near to the loading point, away from the center. This inconsistency between both theoretical and laboratory analysis is likely to be due to the assumptions, criteria, and heterogeneity of the tested rocks. However, for characterizing the deformation behaviors, it is essential to accurately determine the mechanical properties of rocks. It is particularly crucial to gain a thorough understanding of fracture propagation in both laminated and anisotropic rocks.
When researchers had been trying to solve these complex failure processes using traditional methods, optical techniques provided several additional advantages [21,22,23], such as identifying fracture generation and propagation, strain measurement, and monitoring of rock deformation under loading condition.
Digital Image Correlation (DIC) is a very powerful non-contact measurement technique that is used for capturing full-field and real-time deformation behaviors for any surface [24,25,26]. This technique introduced by Chu et al. [27] established a widely spread application in material testing [28]. Mokhtari et al. [22] applied this method to characterize the fracture initiation and propagation on naturally fractured rock. Similarly, application of DIC was extended to characterize the deformation behaviors in sandstone and carbonates rocks [29,30], laminated shale [23,31], Buda limestone [32], and Mancos shale [33].
There was significant attention by the researchers on rock failure instead of predicting the pre-failure stress distribution over time. Some researchers claimed that the initiation point of failure was decided by the ultimate loading arc angle in their numerical [34,35]. Based on the homogeneous, isotropic, and linearly elastic numerical model, more numerical studies have considered the effects of anisotropy and heterogeneity on tensile strength [34,36,37,38]. However, fracture initiation point Brazilian testing is still an issue of debate. Although anisotropy and heterogeneity has caused the change of stress distribution pattern, the verification of the accuracy of the homogeneous and isotropic numerical model as a benchmark has played a more critical role in locating the initiation point of failure. Some single-point comparison of measurements has been made in the literature, but limited studies have explained the detailed comparison of full-field deformation at various stages of loading. Moreover, to measure the deformation and tensile strength of anisotropic rocks, the formulas were less developed due to the difficulty of experimental validation [39,40]. This required more experimental and numerical studies to accurately evaluate the geomechanical properties of rocks and evaluate factors impacting rock deformation.
In this paper, we built a numerical model using COMSOL Multiphysics to predict the stress and strain distribution and displacement evolution before the failure occurred for a homogeneous rock as a benchmark. To get the elastic properties of rock for simulation input, a uniaxial compression test was conducted in Spider Berea sandstone. Brazilian testing was conducted using DIC to monitor the deformation on the entire surface of the specimens function of time. Experimentally obtained strain evolution (tension, compression, and shear) and displacement changed along the central horizontal and vertical planes, which were investigated at three distinguishable percentages of peak loads (20%, 40%, and 90%) to understand the deformation behaviors in rock. The simulation model results at these three distinct loads were compared with 3D DIC results to investigate the validity and limitations of the linear elastic homogeneous simulation model. It was found that the model could be used to predict stress distribution, full-field deformation, and fracture behaviors for different types of rocks by changing the relevant elastic parameters.

2. Laboratory Tests on Rocks

2.1. Sample Preparation

To evaluate the deformation behavior of the rocks in this study, we performed indirect tensile and uniaxial compression testing. The homogeneous and isotropic Spider Berea sandstone was collected from Kocurek Industries [41]. Then, the core samples were cut into Brazilian discs using a diamond blade to meet ISRM [42] and ASTM [7] standards dimensions (2″ Diameter × 0.6″ Thickness) from long cores (2″ Diameter × 10″ Thickness).
To determine the rock elastic properties (Young’s modulus and Poisson’s ratio) for simulation inputs, the uniaxial compression test was conducted in the sandstone sample (about 2″ Diameter × 2.2″ Thickness) following the ASTM D 2938 [7]. We cut the sandstone cores and polished it using a wheel (7″ Diameter) made with nickel-coated diamond grit and synthetic resin bond to get the finest flat ends (Figure 1) and meet ISRM [42], ASTM D 3967 [43], and ASTM D 2938 [7]. The sample properties are listed in Table 1 [41]. To remove all pore fluid, the sample was kept in a vacuum oven at 115 F for 24 h.
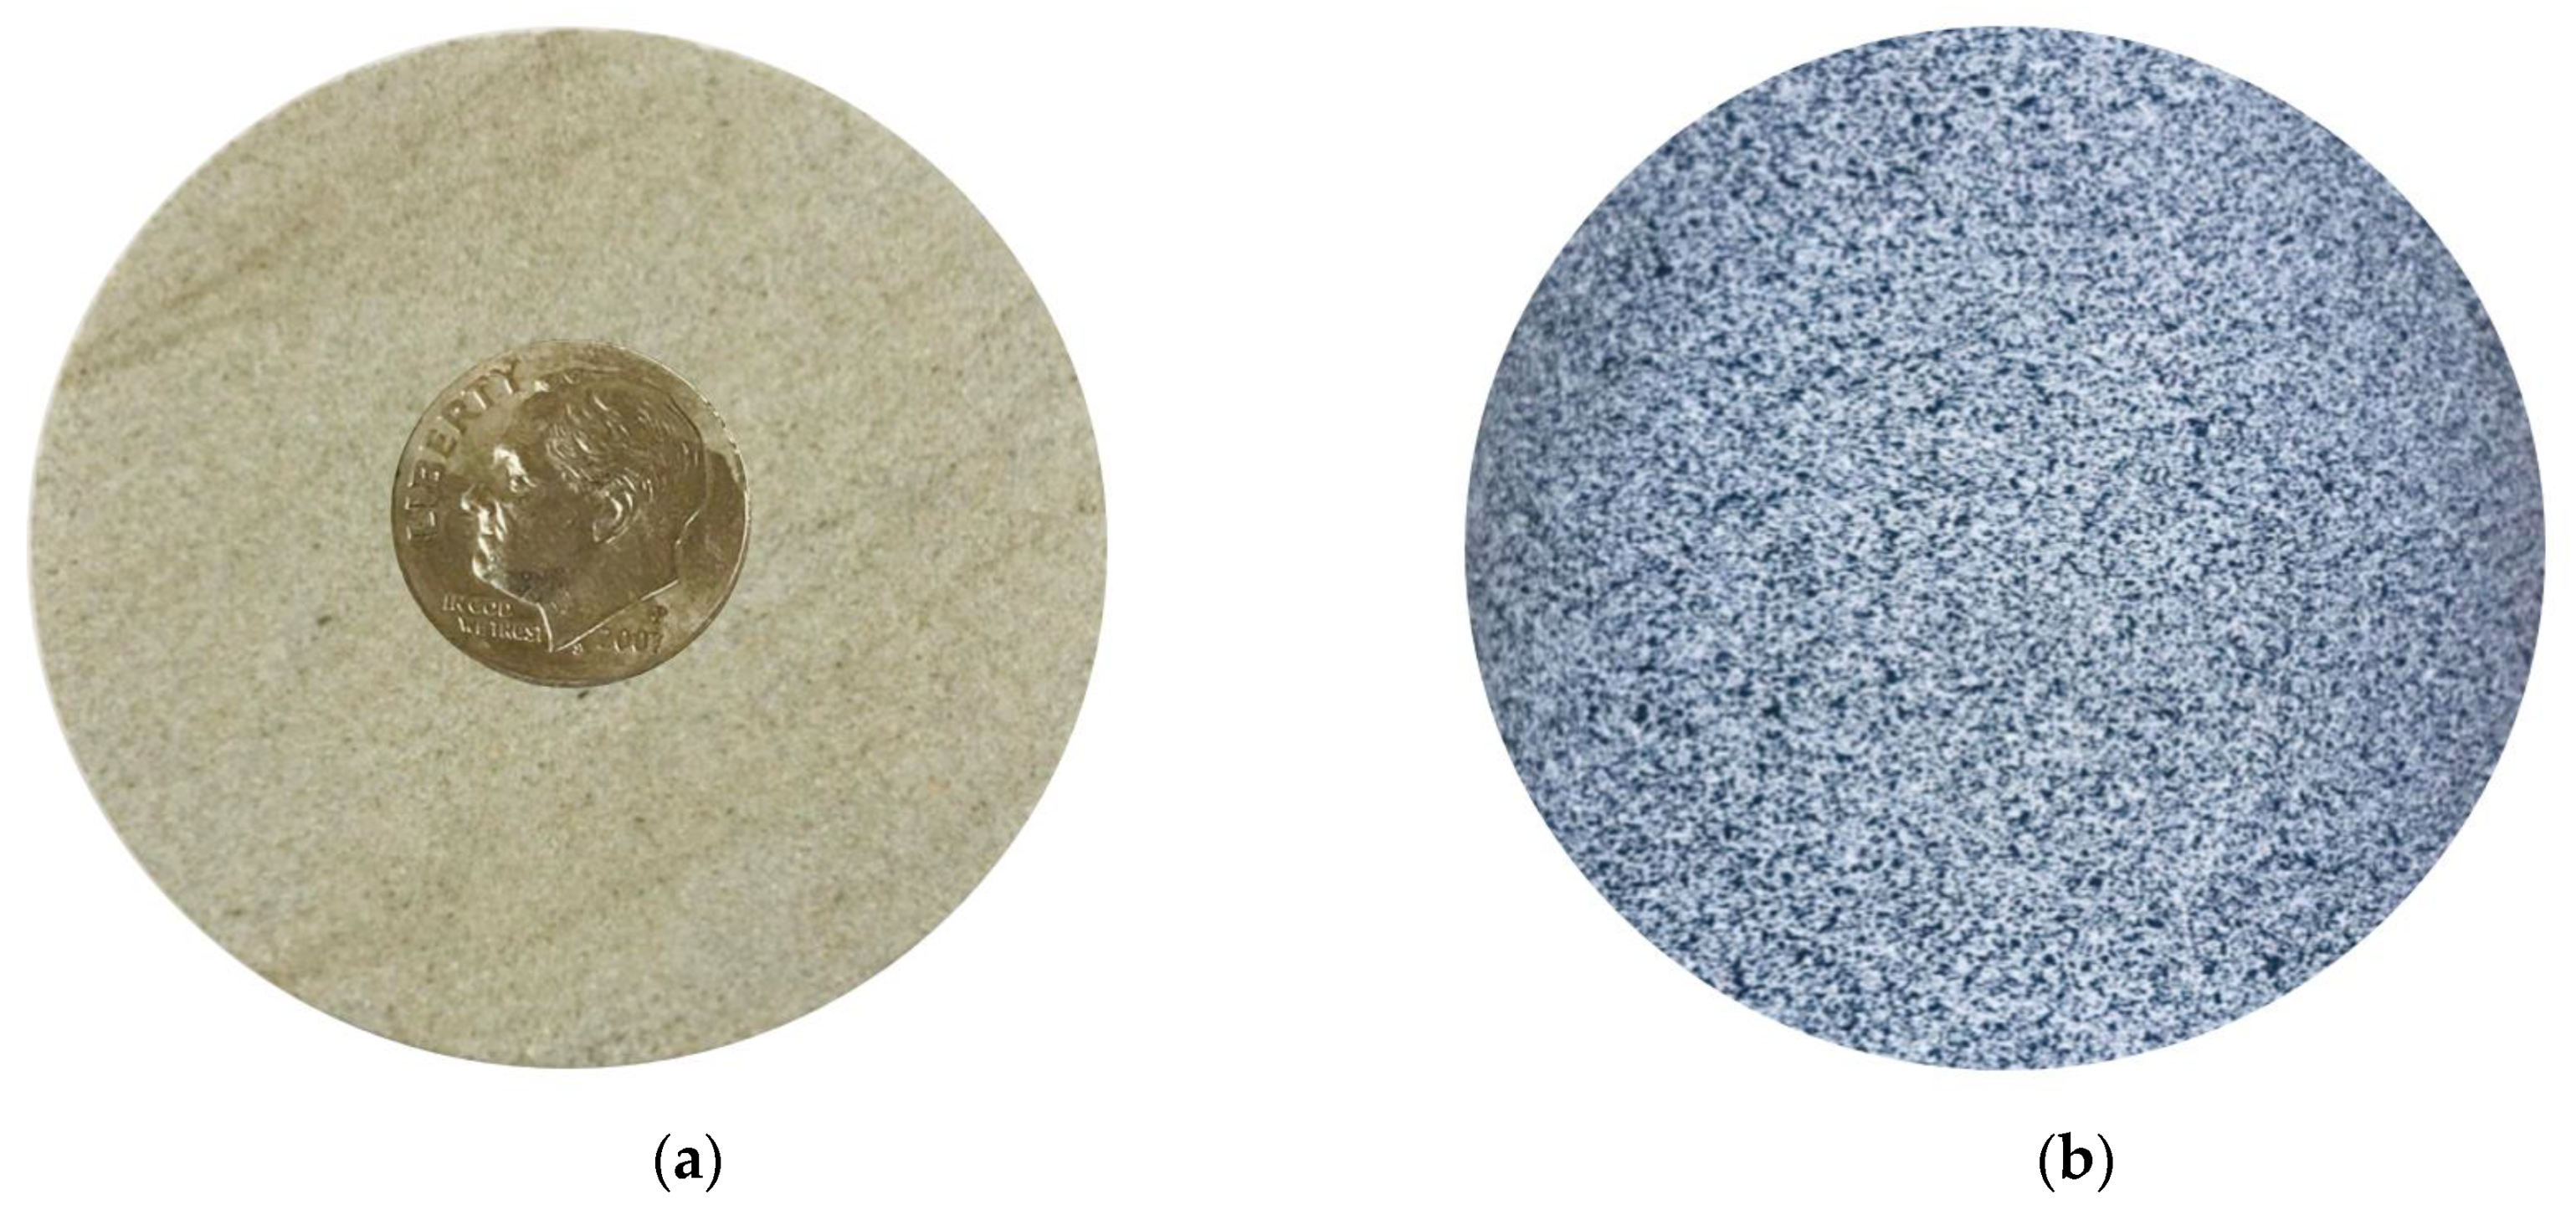
Spraying the paint on the front face of the sample was the final step in specimen preparation, which resulted in the black spot on the white base speckled pattern, which was prepared using Rust-Oleum flat paint (Figure 2). The image correlation software monitored the displacement change of the applied speckled pattern and the software used the measured displacement of the speckles to calculate the full-field strain map of the sample. Generally, the local stress-strain distribution might be impacted by coating [44] while spraying on the surface of the sample disc but the paint-coated layers were maintained as thin as possible (<100 μm) to minimize the effect [45]. The thin layer ensures the paint moves with the base rock material and won’t affect the displacement behavior. Therefore, the effect of the paint was considered negligible on the displacement properties of the sample. Nath and Mokhtari [23] described the procedure for creating the speckle pattern in the rock sample face.

2.2. Deformation Measurement Using a Digital Image Correlation Method (DIC)

The DIC is an optical method used to determine the displacement of an object [25] by examining the pixel intensity of speckled images before and after deformation. The DIC system consists of an image acquisition system and correlation software.
At the beginning of the analysis, a reference image was taken where a region of interest was defined in the specimen surface by dividing it into the numbers of subsets. The displacements were calculated at each and every point of the created subsets from which the full-field deformation was obtained. The deformation tracking process was reached using the search algorithm corresponding to the pre-defined similarity criterion for reference and deformed images. When the deformation of both reference and target subset centers was obtained, the maximum similarity was attained in the deformed image. For details of the DIC technique and working principle, interested readers can explore the relevant literature of different researchers [21,23,25].

2.3. Experimental Procedure

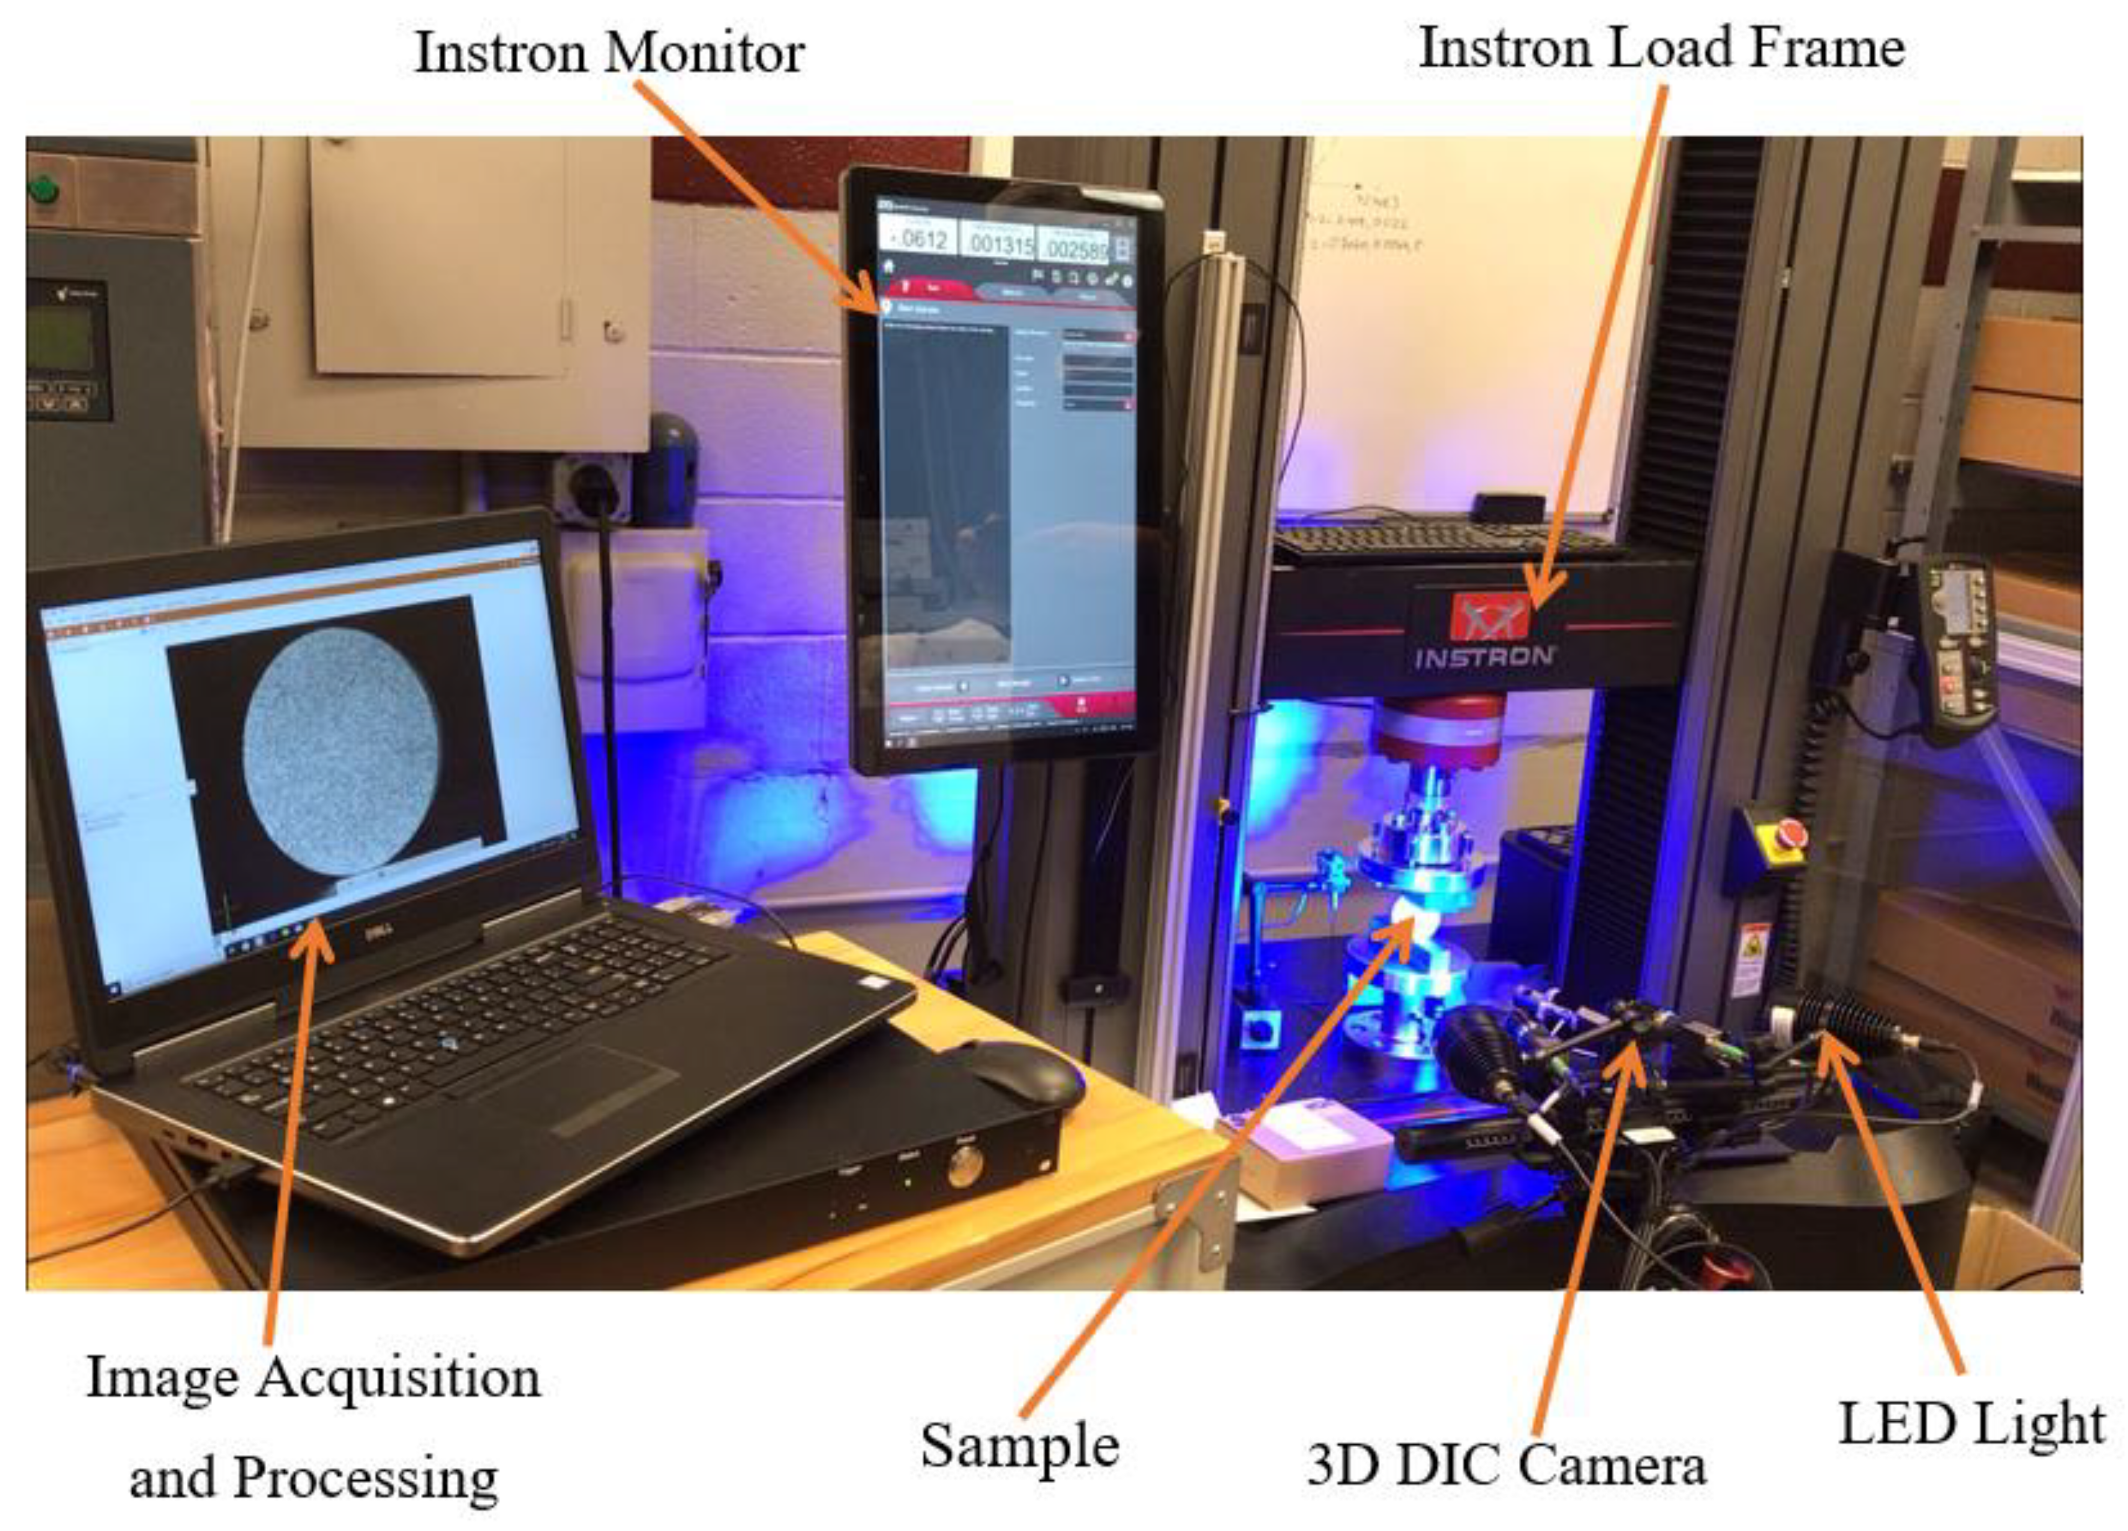
The experimental procedure for Brazilian testing with DIC is shown in Figure 3. The Spider Berea sandstone was placed in a Brazilian test frame [42] showing the front side of the painted sample. The Instron load frame was used to apply the diametrically opposed compressive loads subsequently while in a synchronized way, the camera was tracking the image of the speckled face of the sample. The procedure for the camera was sets and calibration as described in the ARAMIS Professional software manual [46]. Two cameras were connected to an ARAMIS computer for storing the images and operating the DIC software. The stored images were used to analyze the deformation behavior using ARAMIS 3D DIC software.
Firstly, at no-load condition, the reference images were taken for calibration purposes. After checking the calibration parameters, the cameras were fixed to capture two images per second during the entire test keeping at a constant displacement rate of 0.05 mm/min. Two blue LED lights were positioned in front of the Instron load frame. The lights were kept at an equal height with the sample to make sure the specimen speckled pattern was clearly recognized by the DIC camera. According to the ASTM D 3967 [43], the specimen fails in about 5 min, which fell within the suggested time frame of 1–10 min.
During the Brazilian experiment, two digital cameras (12 MP) captured an image size of 4096 × 3000 pixels that were used to monitor the field of view, which was 76 mm × 56 mm. The typical noise level in DIC strain measurement is 0.01% and the displacement error is 0.01 pixels [46]. The DIC analysis was conducted using a subset size of 30 pixels and a point distance of 15 pixels. We got a displacement accuracy of 0.2 μm in our experiment.

3. Numerical Modeling Methodology

3.1. Brazilian Testing

The Brazilian tensile strength for a cylindrical sample is measured by the relationship [7],
B T S = 2 P m a x π D l
where BTS is the tensile strength of the Brazilian disc, the load Pmax is the diametrically opposed maximum load, D is the disc diameter, and l is thickness. Equation (1) is generally used for homogenous media and the formula is generally used for strength comparison of various rocks.
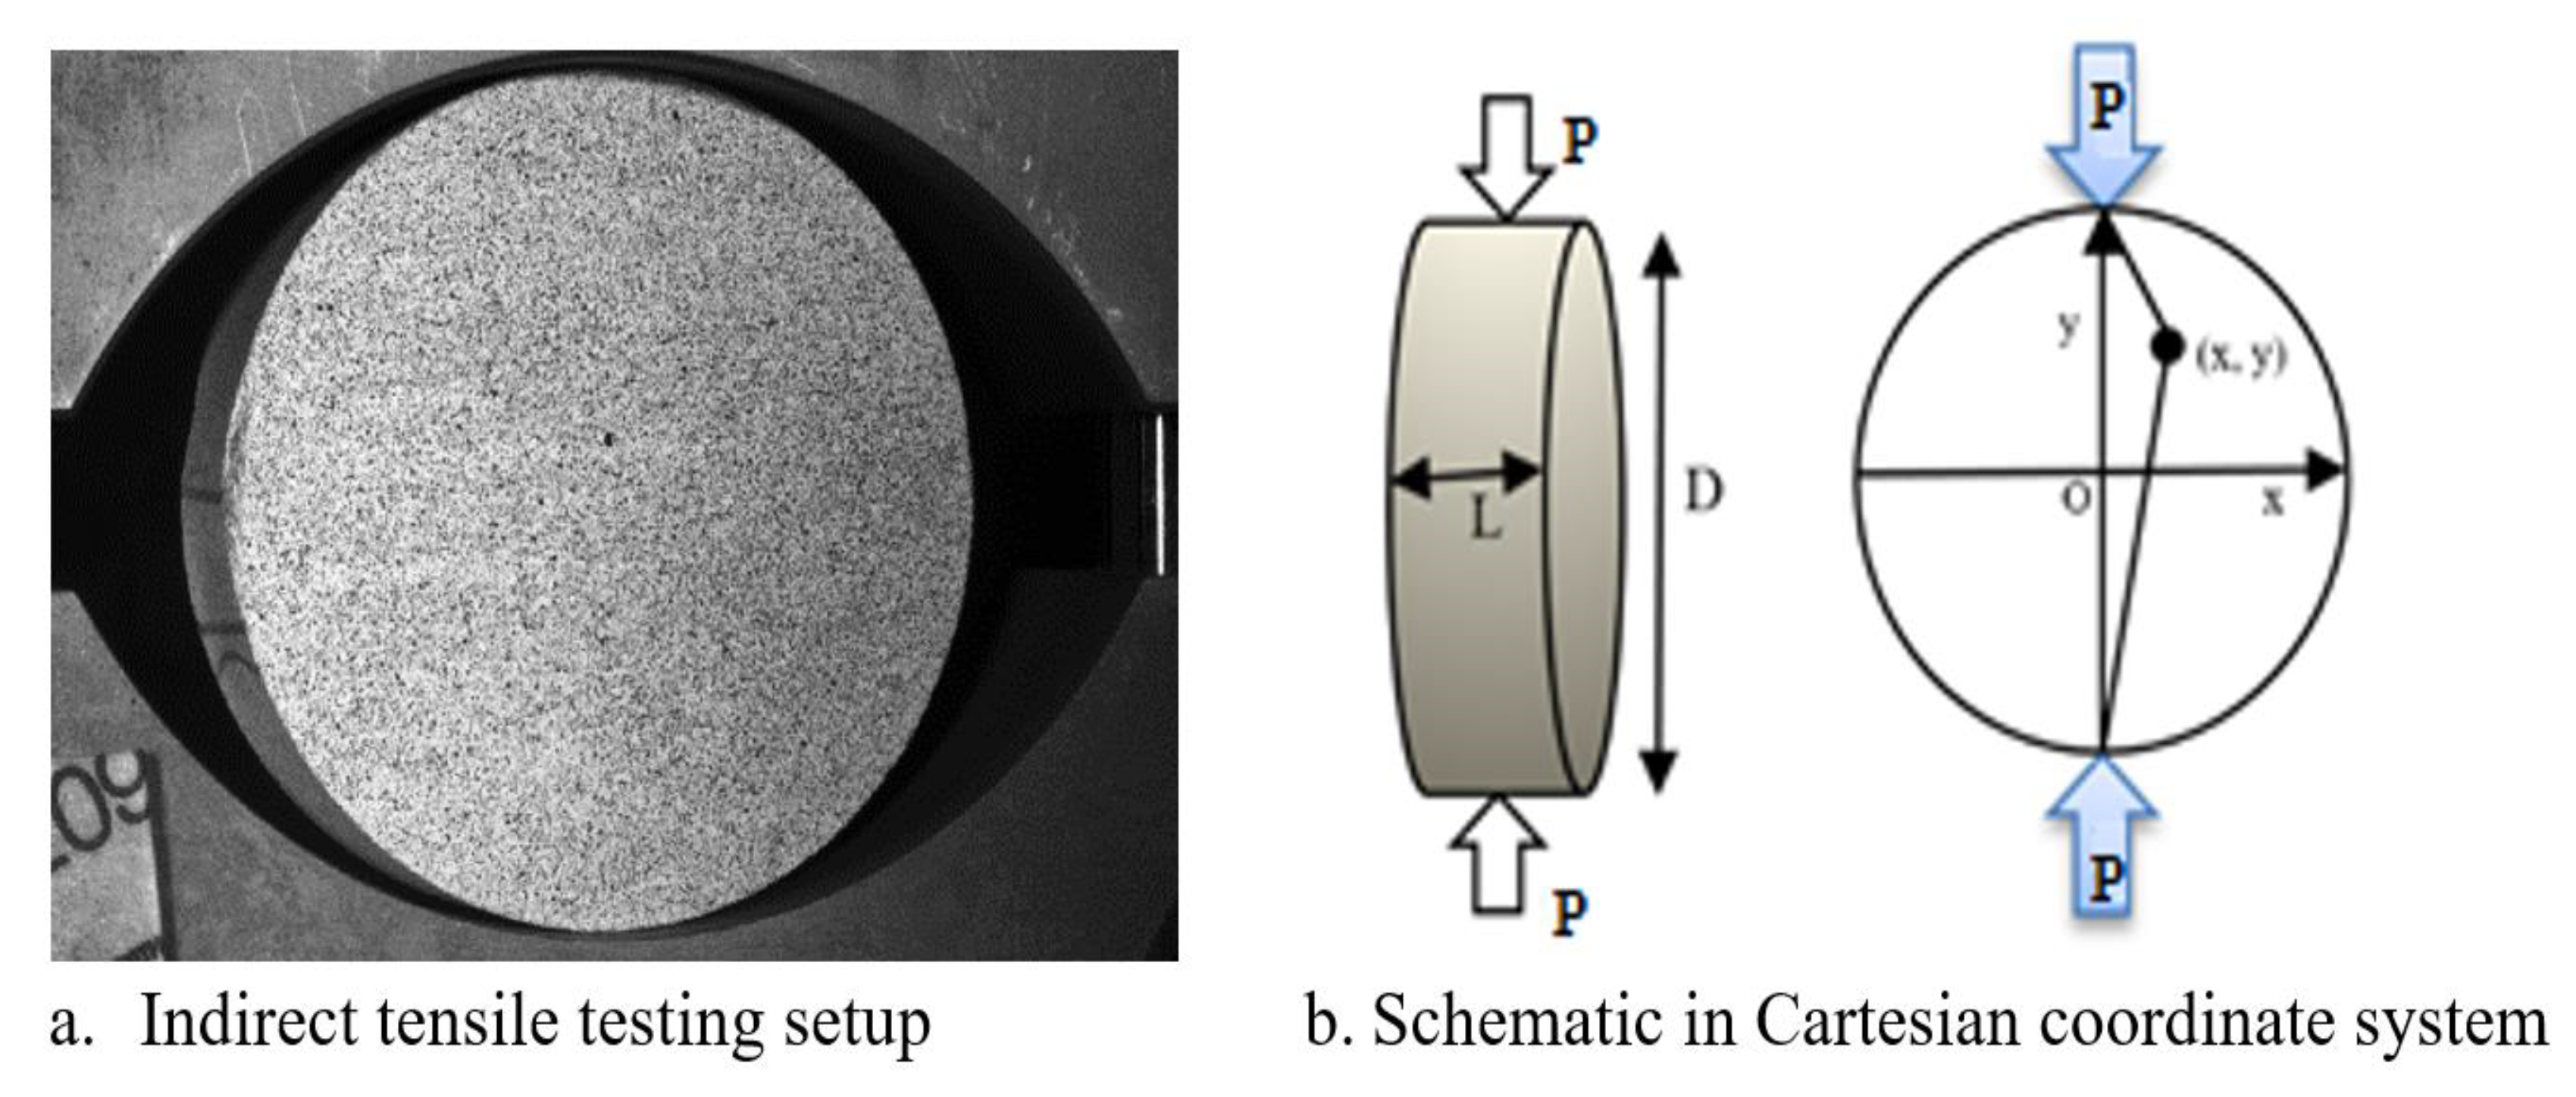
For any point (x, y) in the sample in a Cartesian plane (Figure 4b), the analytical stresses solutions in the x-direction (σx) and y-direction (σy), and shear stress, (τxy) can be expressed by the following equations, respectively [47],
σ x = 2 P π l { ( R y ) x 2 ( ( R y ) 2 + x 2 ) 2 + ( R + y ) x 2 ( ( R + y ) 2 + x 2 ) 2 1 D }
σ y = 2 P π l { ( R y ) 3 ( ( R y ) 2 + x 2 ) 2 + ( R + y ) 3 ( ( R + y ) 2 + x 2 ) 2 1 D }
τ x y = 2 P π l { ( R y ) 2 x ( ( R y ) 2 + x 2 ) 2 + ( R + y ) 2 x ( ( R + y ) 2 + x 2 ) 2 }
In order to show normalized horizontal and vertical stresses, Equations (2) and (3) were simplified as follows:
σ x P / ( π R l ) = D ( D 2 y ) x 2 ( ( D 2 y ) 2 + x 2 ) 2 D ( D 2 + y ) x 2 ( ( D 2 + y ) 2 + x 2 ) 2 + 1
σ y P / ( π R l ) = ( D ( D 2 y ) 3 ( ( D 2 y ) 2 + x 2 ) 2 + D ( D 2 + y ) 3 ( ( D 2 + y ) 2 + x 2 ) 2 1 )
On the loading diameter, which is x = 0, Equation (5) is presented in this form:
σ x P / ( π R l ) = 1
Similarly, on the horizontal diameter, which is y = 0, Equation (6) is presented in this form:
σ y P / ( π R l ) = ( D 4 2 2 ( ( D 2 ) 2 + x 2 ) 2 1 )

3.2. Model Assumptions

In Brazilian testing, a cylindrical specimen disc is compressed diametrically (Figure 4a,b). The assumptions [6] are given below:
  • The Brazilian disc is loaded by diametrically opposed uniform pressure at both ends of its diameter over a small strip of the perimeter;
  • The stress magnitude caused by the internal frictional force between the specimen and loading platens is neglected;
  • The material is assumed as isotropic, homogeneous, and remains in a linearly elastic zone before causing the brittle failure.

3.3. Model Set-up and Inputs

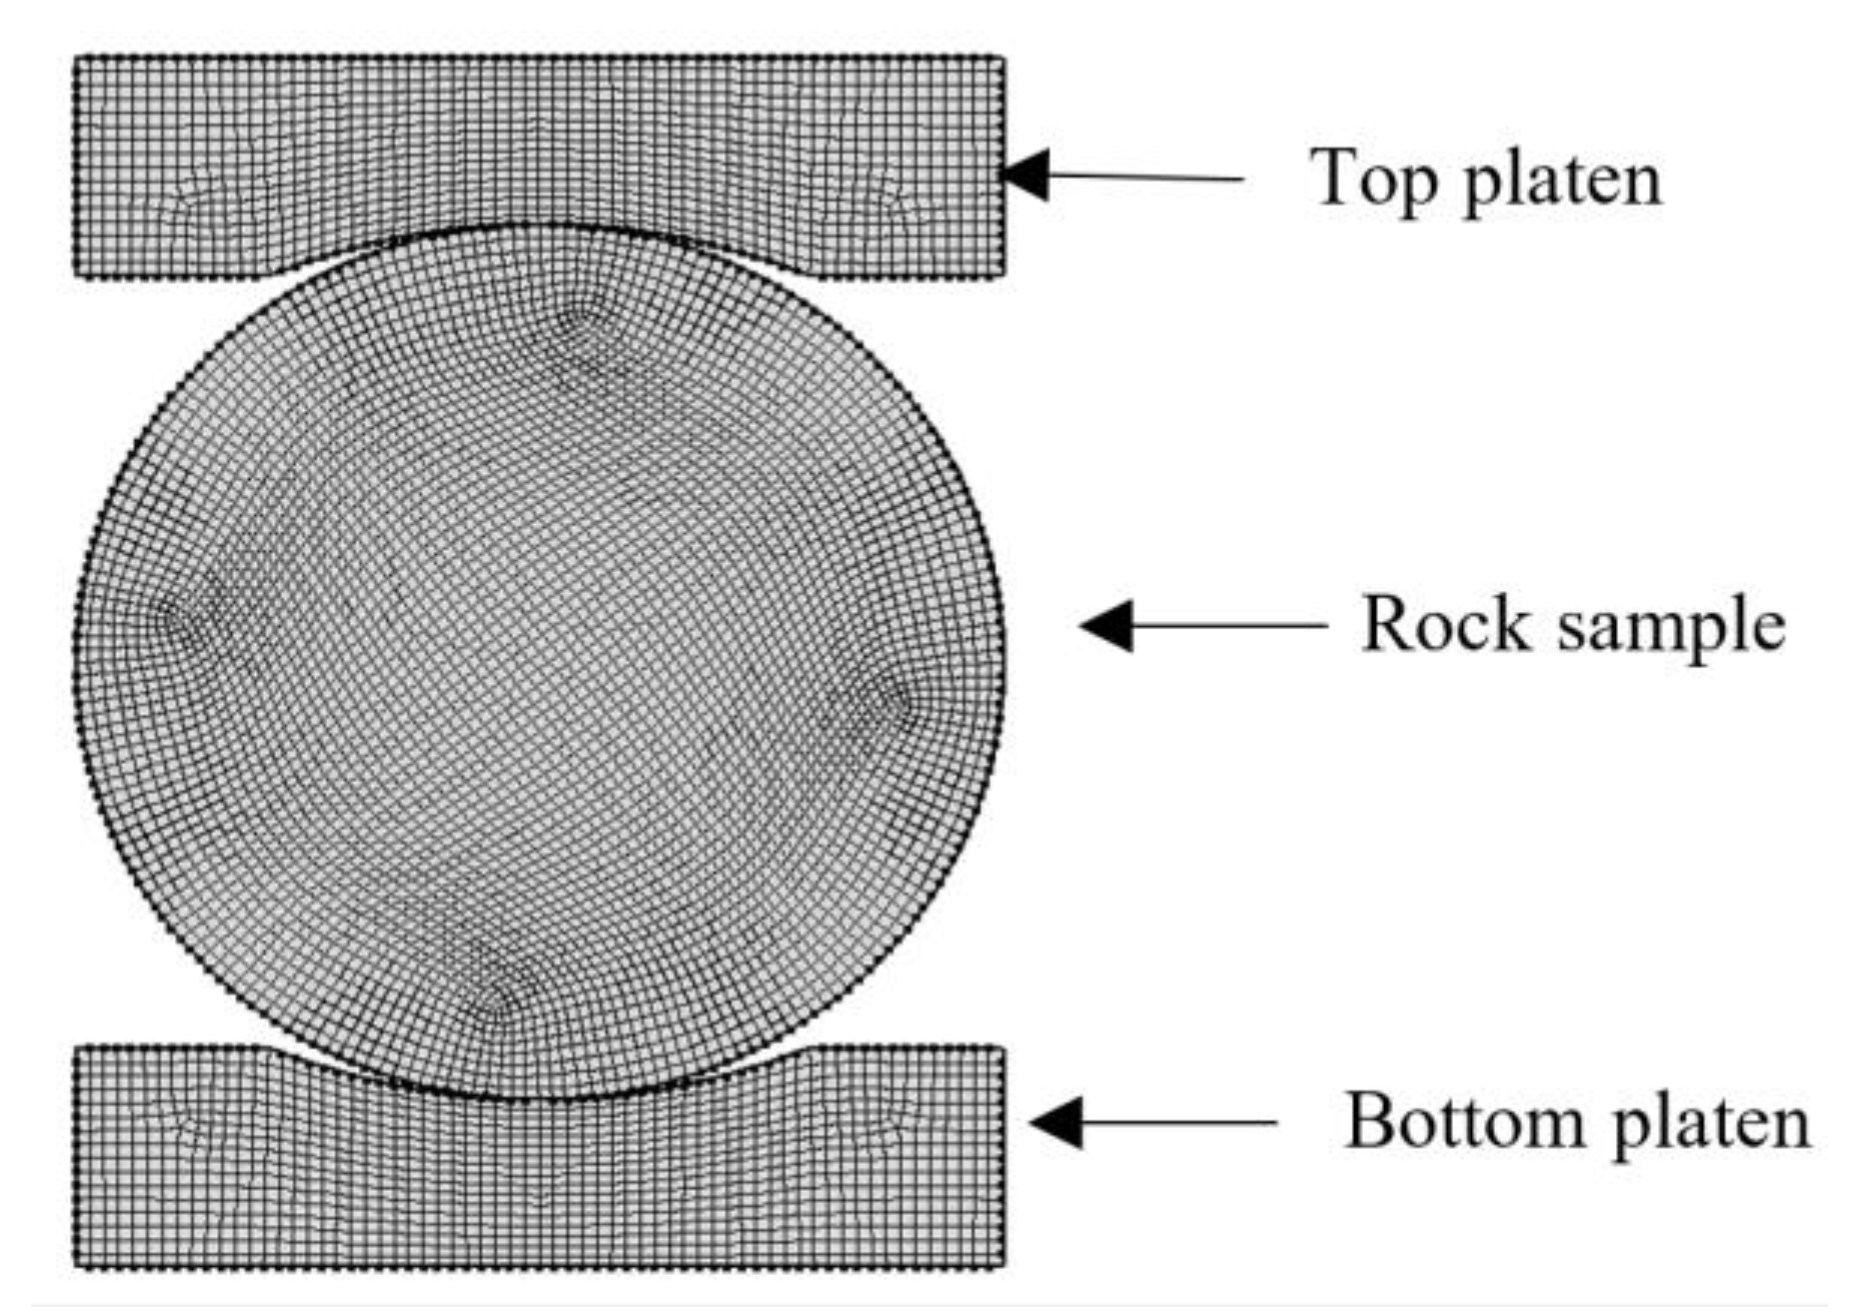
This numerical model (Figure 5) was built by COMSOL Multiphysics, a multi-field finite element modeling (FEM) software. As it was shown in the Brazilian disc test (BDT), the tensile strength was determined by diametrically compressing the cylindrical rock samples between the loading platens. The basic parameters of the numerical model are given in Table 2.
The maximum and minimum mesh sizes were set as 0.8 mm and 0.526 mm, respectively. In COMSOL Multiphysics, we selected the Solid Mechanics Module and Stationary Solver to create the simulation. To obtain the quasi-static stress and strain distribution, three different percentages of peak load (20%, 40%, and 90%) obtained experimentally from Brazilian testing was applied to the top platen.
Figure 5 shows the element and nodal distribution for the Brazilian disc and loading platens. The free quadrilateral mesh was used to define the shapes and boundaries of finite elements and continuous deformation. For this BDT simulation, a load was applied to the rock sample through the upper platen with a constant or variable loading rate over time. Stresses (σx and σy) at any moment can be expressed by Equations (2) and (3), under a known loading P or loading displacement. There are two types of loading platens, which are used very commonly, flat platens and curved platens. In this paper, we applied curved platens in the simulation model, based on our real experimental conditions.

4. Results and Discussions

4.1. Numerical vs. Analytical Solutions for Stress Distribution

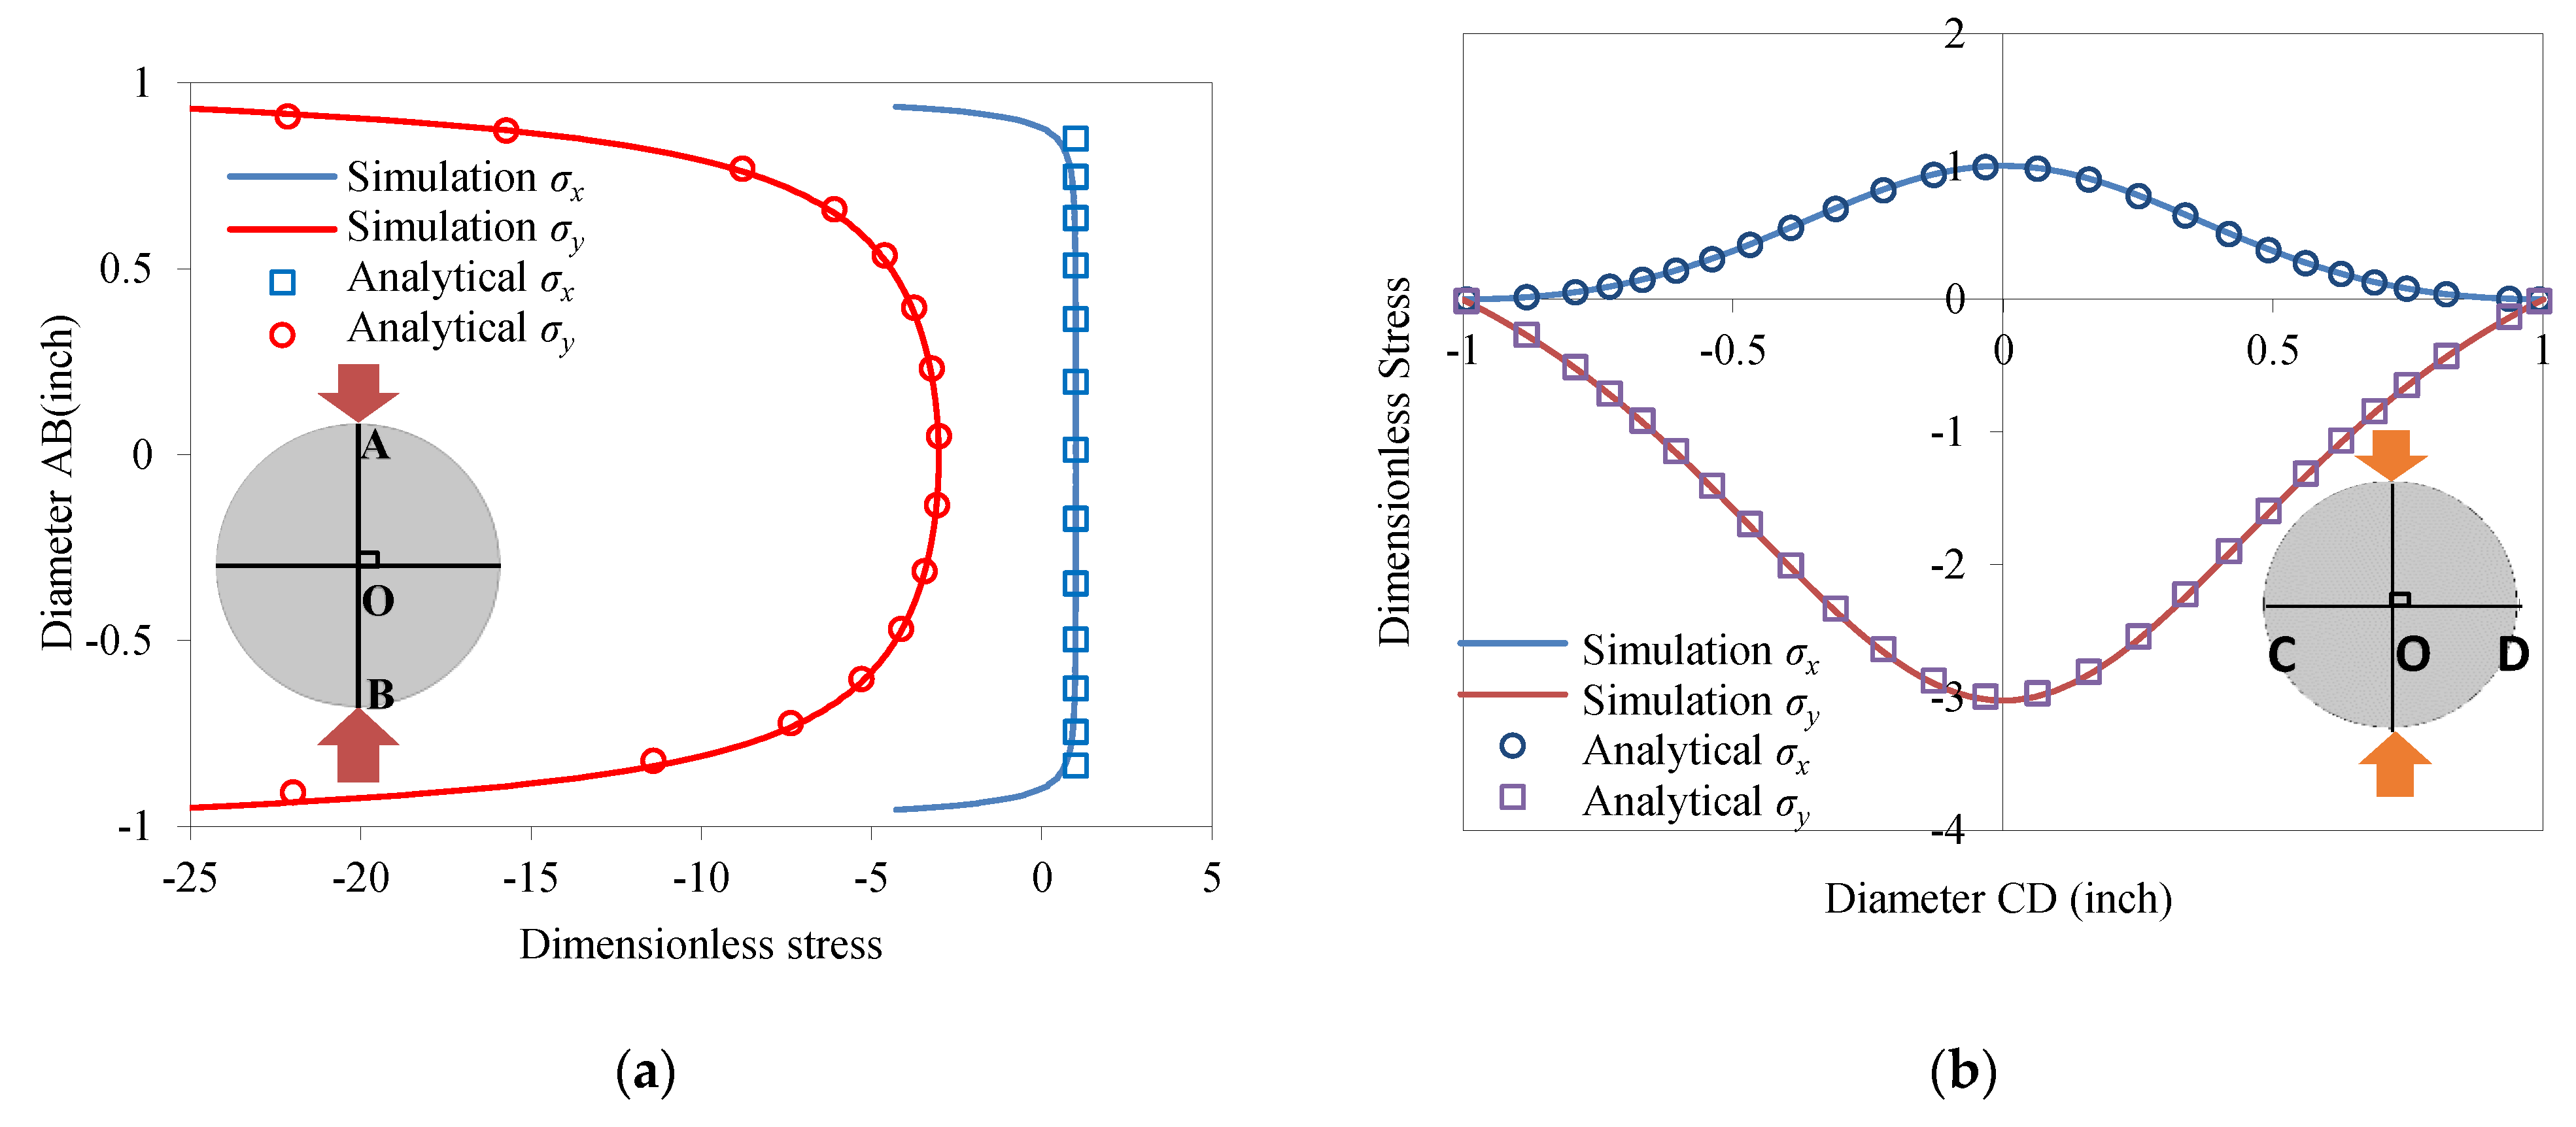
Figure 6a shows the dimensionless numerical and analytical stress σx and σy on vertical diameter AB during loading. In the center of the rock sample, the normalized stress σx and σy were 1 and −3, respectively. Here, tensile stress was defined as positive and compressive stress was negative. In Figure 6a, the maximum value of the numerically horizontal tensile stress, σx was found at the center of the disc and gradually decreased from the center to the two loading platens, and even became horizontal compressive stress when it came too close to the loading platens.
On the other hand, the maximum value of the horizontal compressive stress, σy found at the center of the Brazilian disc gradually decreased from the center to the two loading platens. From the analytical solutions (Equations (2) and (3)) of BDT, the stress σx and σy will approach negative infinity at the loading area, which did not match the real BDT. To avoid the unrealistic negative infinity in Equations (5) and (6), the value of the minimum dimensionless compressive stress in Figure 6a was not from the loading point which had a distance of a radius from the center of the rock sample, but 95% of the radius instead. In general, the numerical solutions matched the analytical solutions well.
M A P E = 100 n t = 1 n | A t F t A t |
where At is the analytical value, Ft is the numerical simulated value, and n is the number of fitted points.
Figure 6b presents the dimensionless numerical and analytical stresses σx and σy on the horizontal diameter CD during loading. The magnitude of the absolute value of the compressive stress, σy was three times the tensile stress σx at the center of the Brazilian disc in the simulation, which matched the analytical solution given by Equations (7) and (8). The magnitude of the absolute value of the stresses σx and σy were 0 at the ends of the horizontal diameter, gradually increasing and getting their maximum values in the center, respectively. Equation (9) is the mean absolute percentage errors (MAPE) formula. The MAPE of σx and σy on the vertical diameter were 10.95% and 14.59%, respectively. At the center point, the MAPE of σx and σy were 4.02% and 1.12%, respectively.
In other words, theoretically, the potential tensile failure area should occur in a region where normalized σx is close to 1. Therefore, the failure stress in the center can be used to compute the tensile strength of the sample. The distribution patterns of σx and σy were symmetric with respect to the y-axis, respectively. The dimensionless stress distribution on the horizontal diameter can be calculated by Equations (5) and (6). The numerical solutions matched the analytical solutions very well in Figure 6b. The MAPEs of σx and σy on the horizontal diameter were 2.95% and 1.58%, respectively.
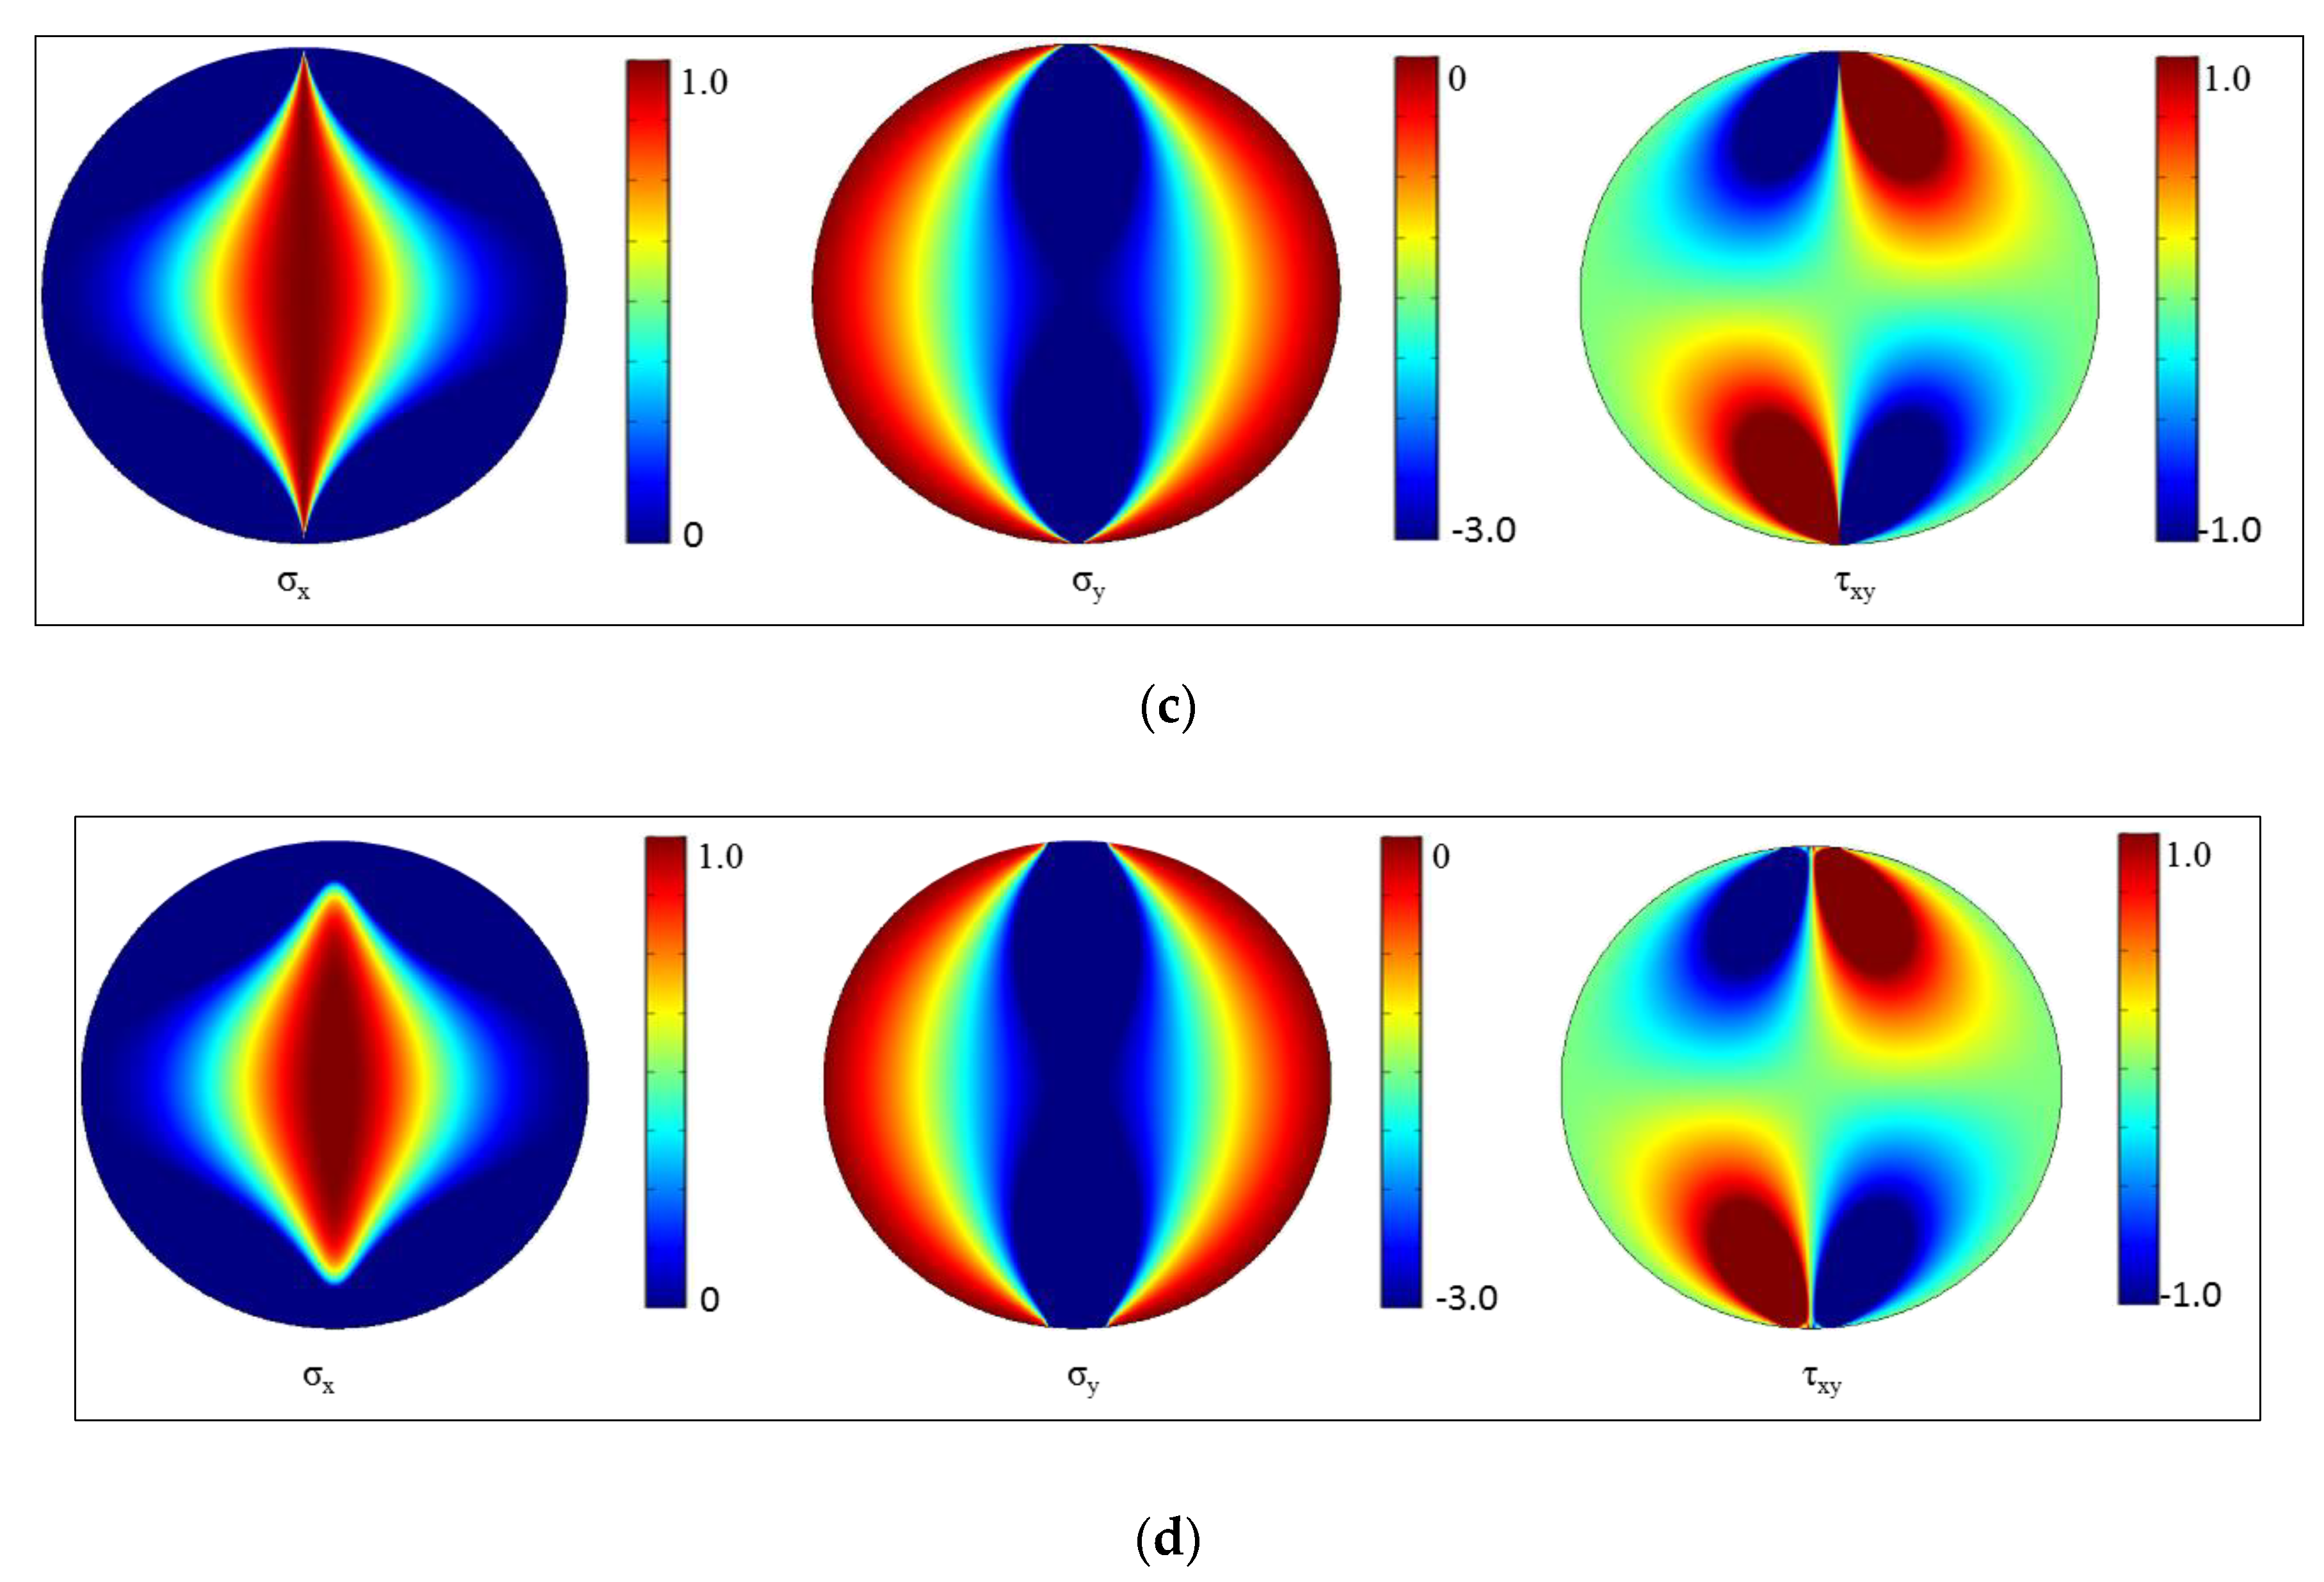
Figure 6c shows the dimensionless stress distribution of σx, σy, and τxy from analytical solutions in the Brazilian disc and Figure 6d shows the respective stresses (stresses both horizontally and vertically, and shear stress) from the numerical solutions. The model input used in the model was based on laboratory testing on Spider Berea sandstone.
From Figure 6c,d, it was evident that the analytical and numerical solution closely matched, while there was a small difference observed near the boundary of the sample. The difference likely occurred because of the stress field; since stresses are theoretical solutions, stress singularity of σx, σy, and τxy (Equations (2)–(4)) was present at loading points that differ from the real experiment. On the other hand, the analytical solutions were always calculated based on exactly applied point load and stress concentration occurred near the loading points whereas the solutions from numerical were always approximate.

4.2. Strain Distribution in Homogeneous Rocks from FEM vs. DIC Results

To establish a benchmark, we initiated the experiments with homogeneous Spider Berea sandstone [41] without any lamination, natural fractures, or visible discontinuities. The deposition process of sedimentary rocks is naturally inhomogeneous in nature, but the Spider Berea sandstone analyzed experimentally visibly had no laminations and as such it was assumed as a homogeneous rock.
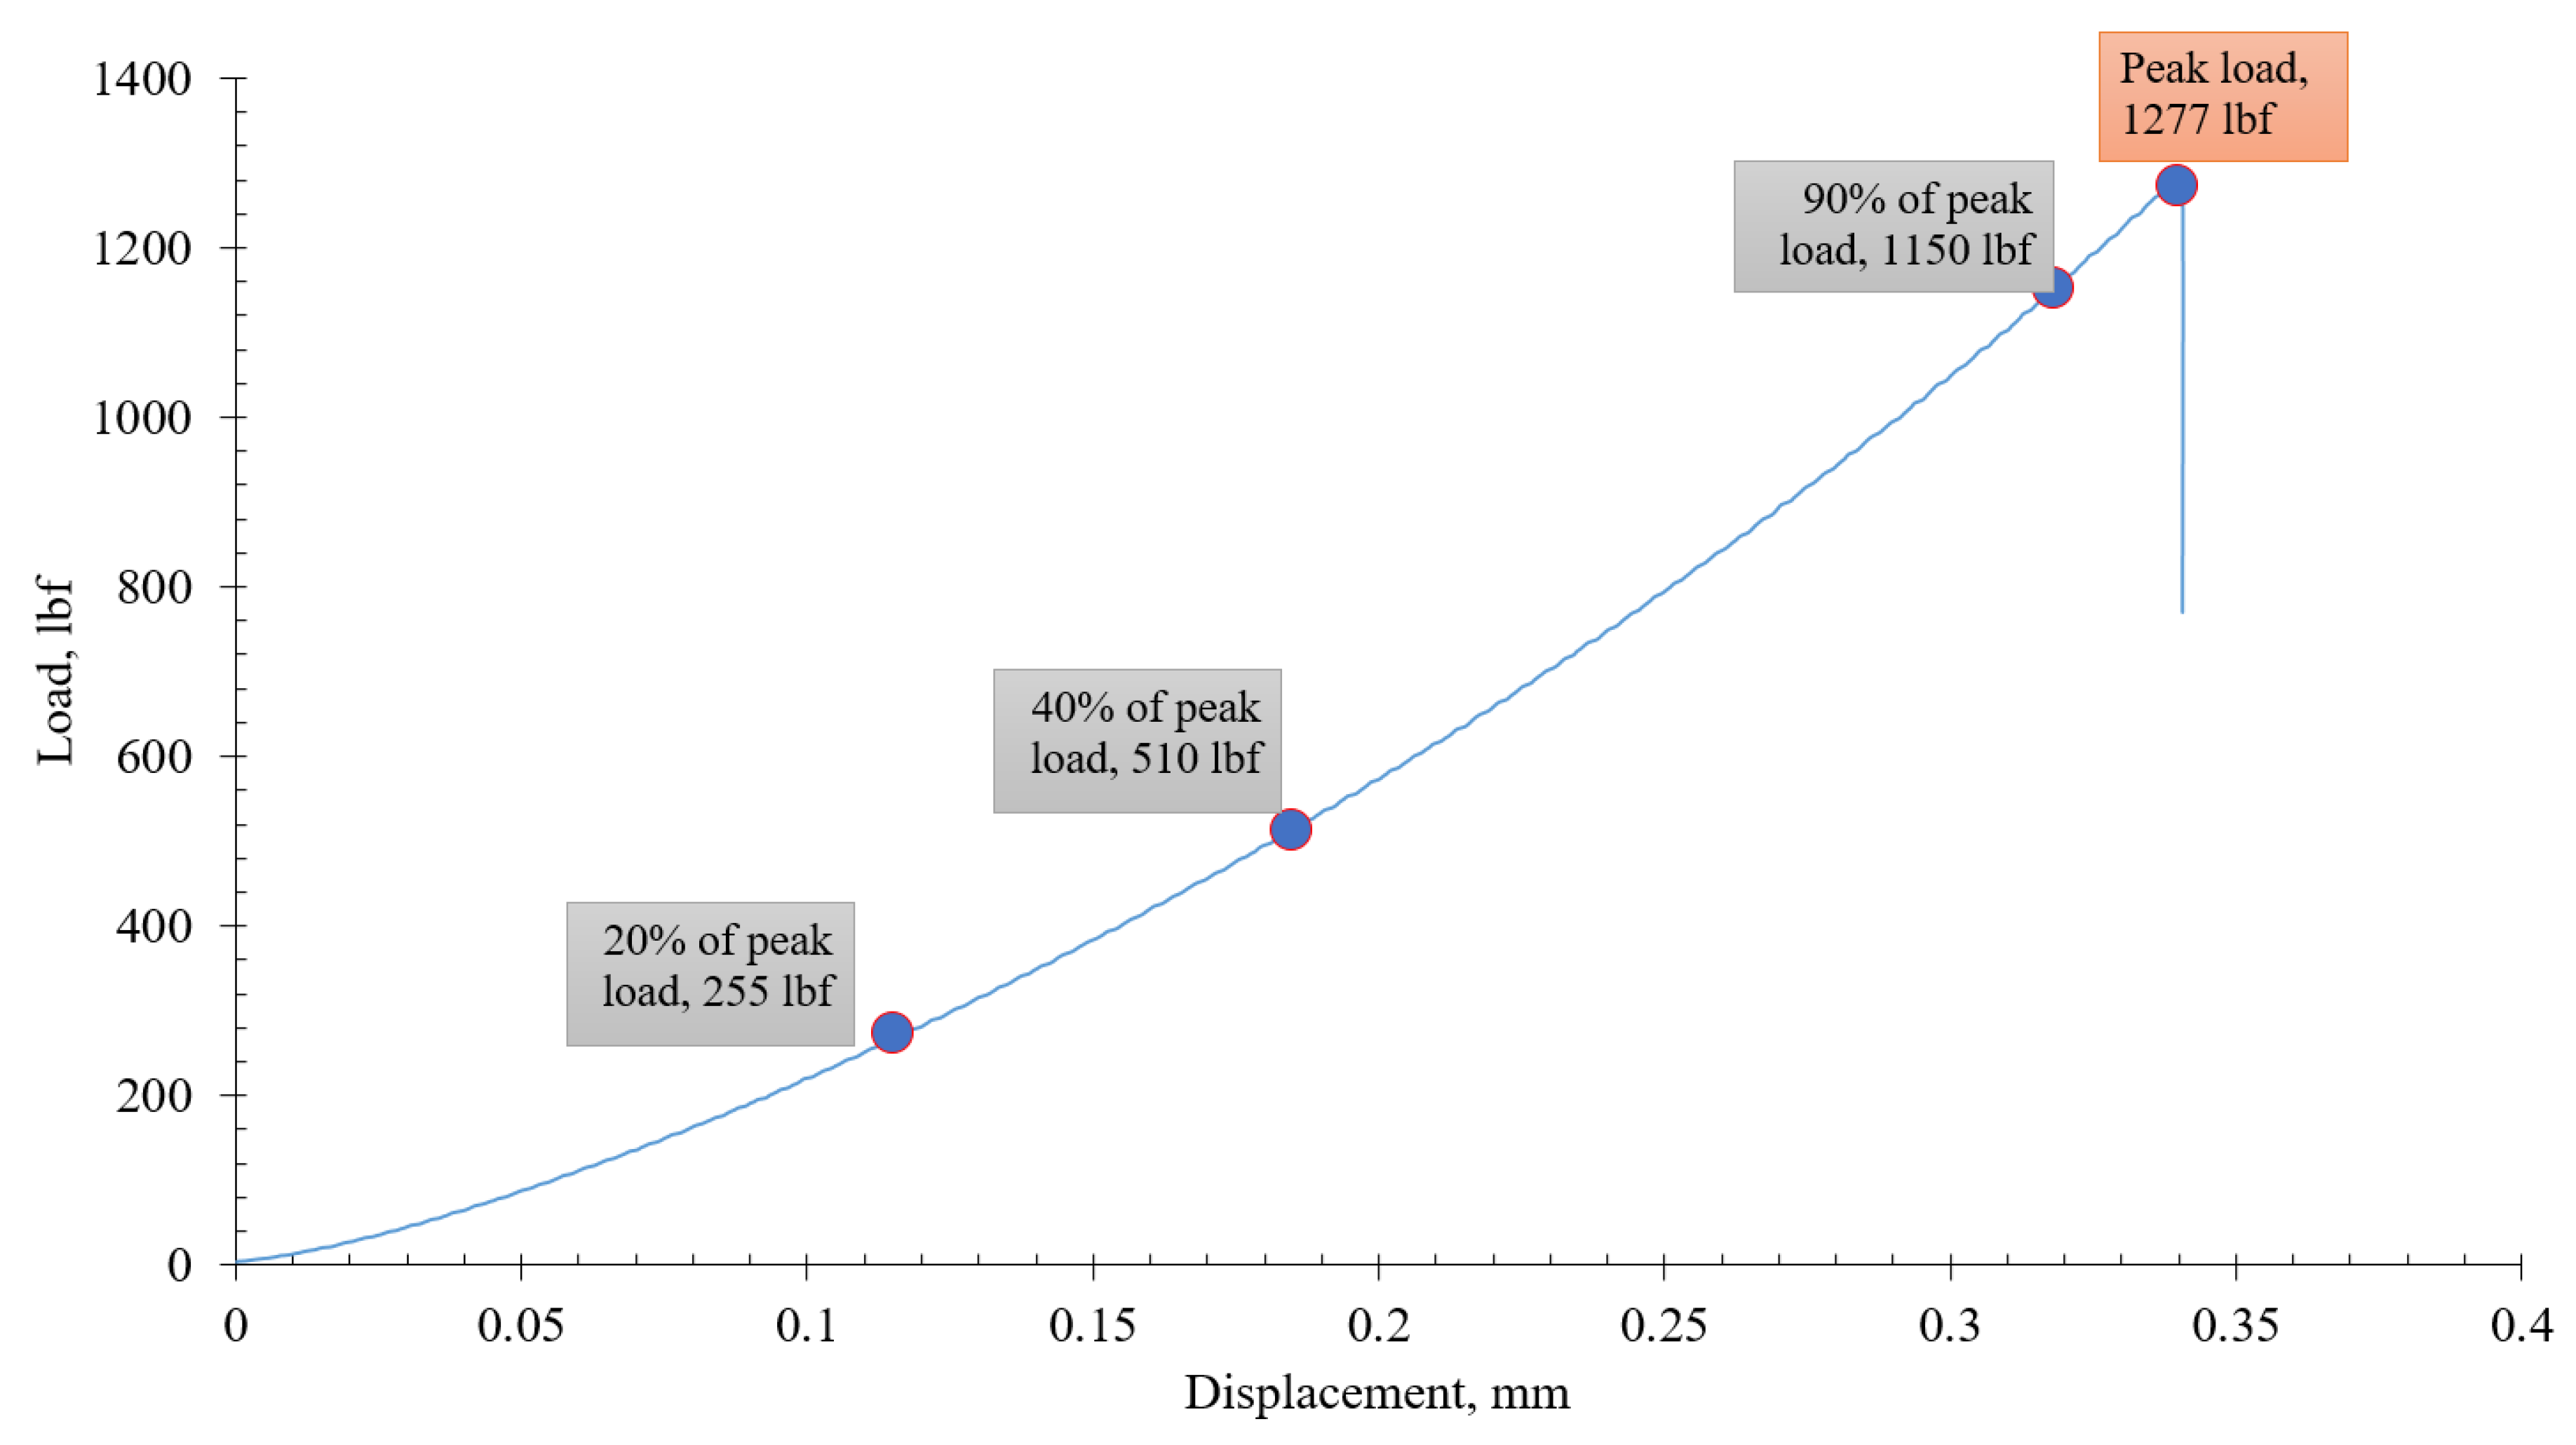
Images were captured throughout the test until the final failure of the specimen (Figure 7). The strain map created by the image correlation technique aids us to understand the deformation behaviors. The experiment investigated the highest tensile strain in the Spider Berea sandstone sample was along the vertical centerline; with load, the tension on the centerline increased until it was causing a vertical, and central fracture in the peak load of 1277 lbf.
A few snapshots at different percentage peak loads (20%, 40%, and 90%) during testing are illustrated here. The peak load for Berea sandstone was obtained from the experimental investigation conducted using the Instron load frame (Figure 3). The horizontal (εxx), vertical (εyy) and shear strain (εxy) is presented at these three defined peak loads (Figure 7), which is capable of explaining the mechanism involved in deformation and failure including tension, compression or shear.
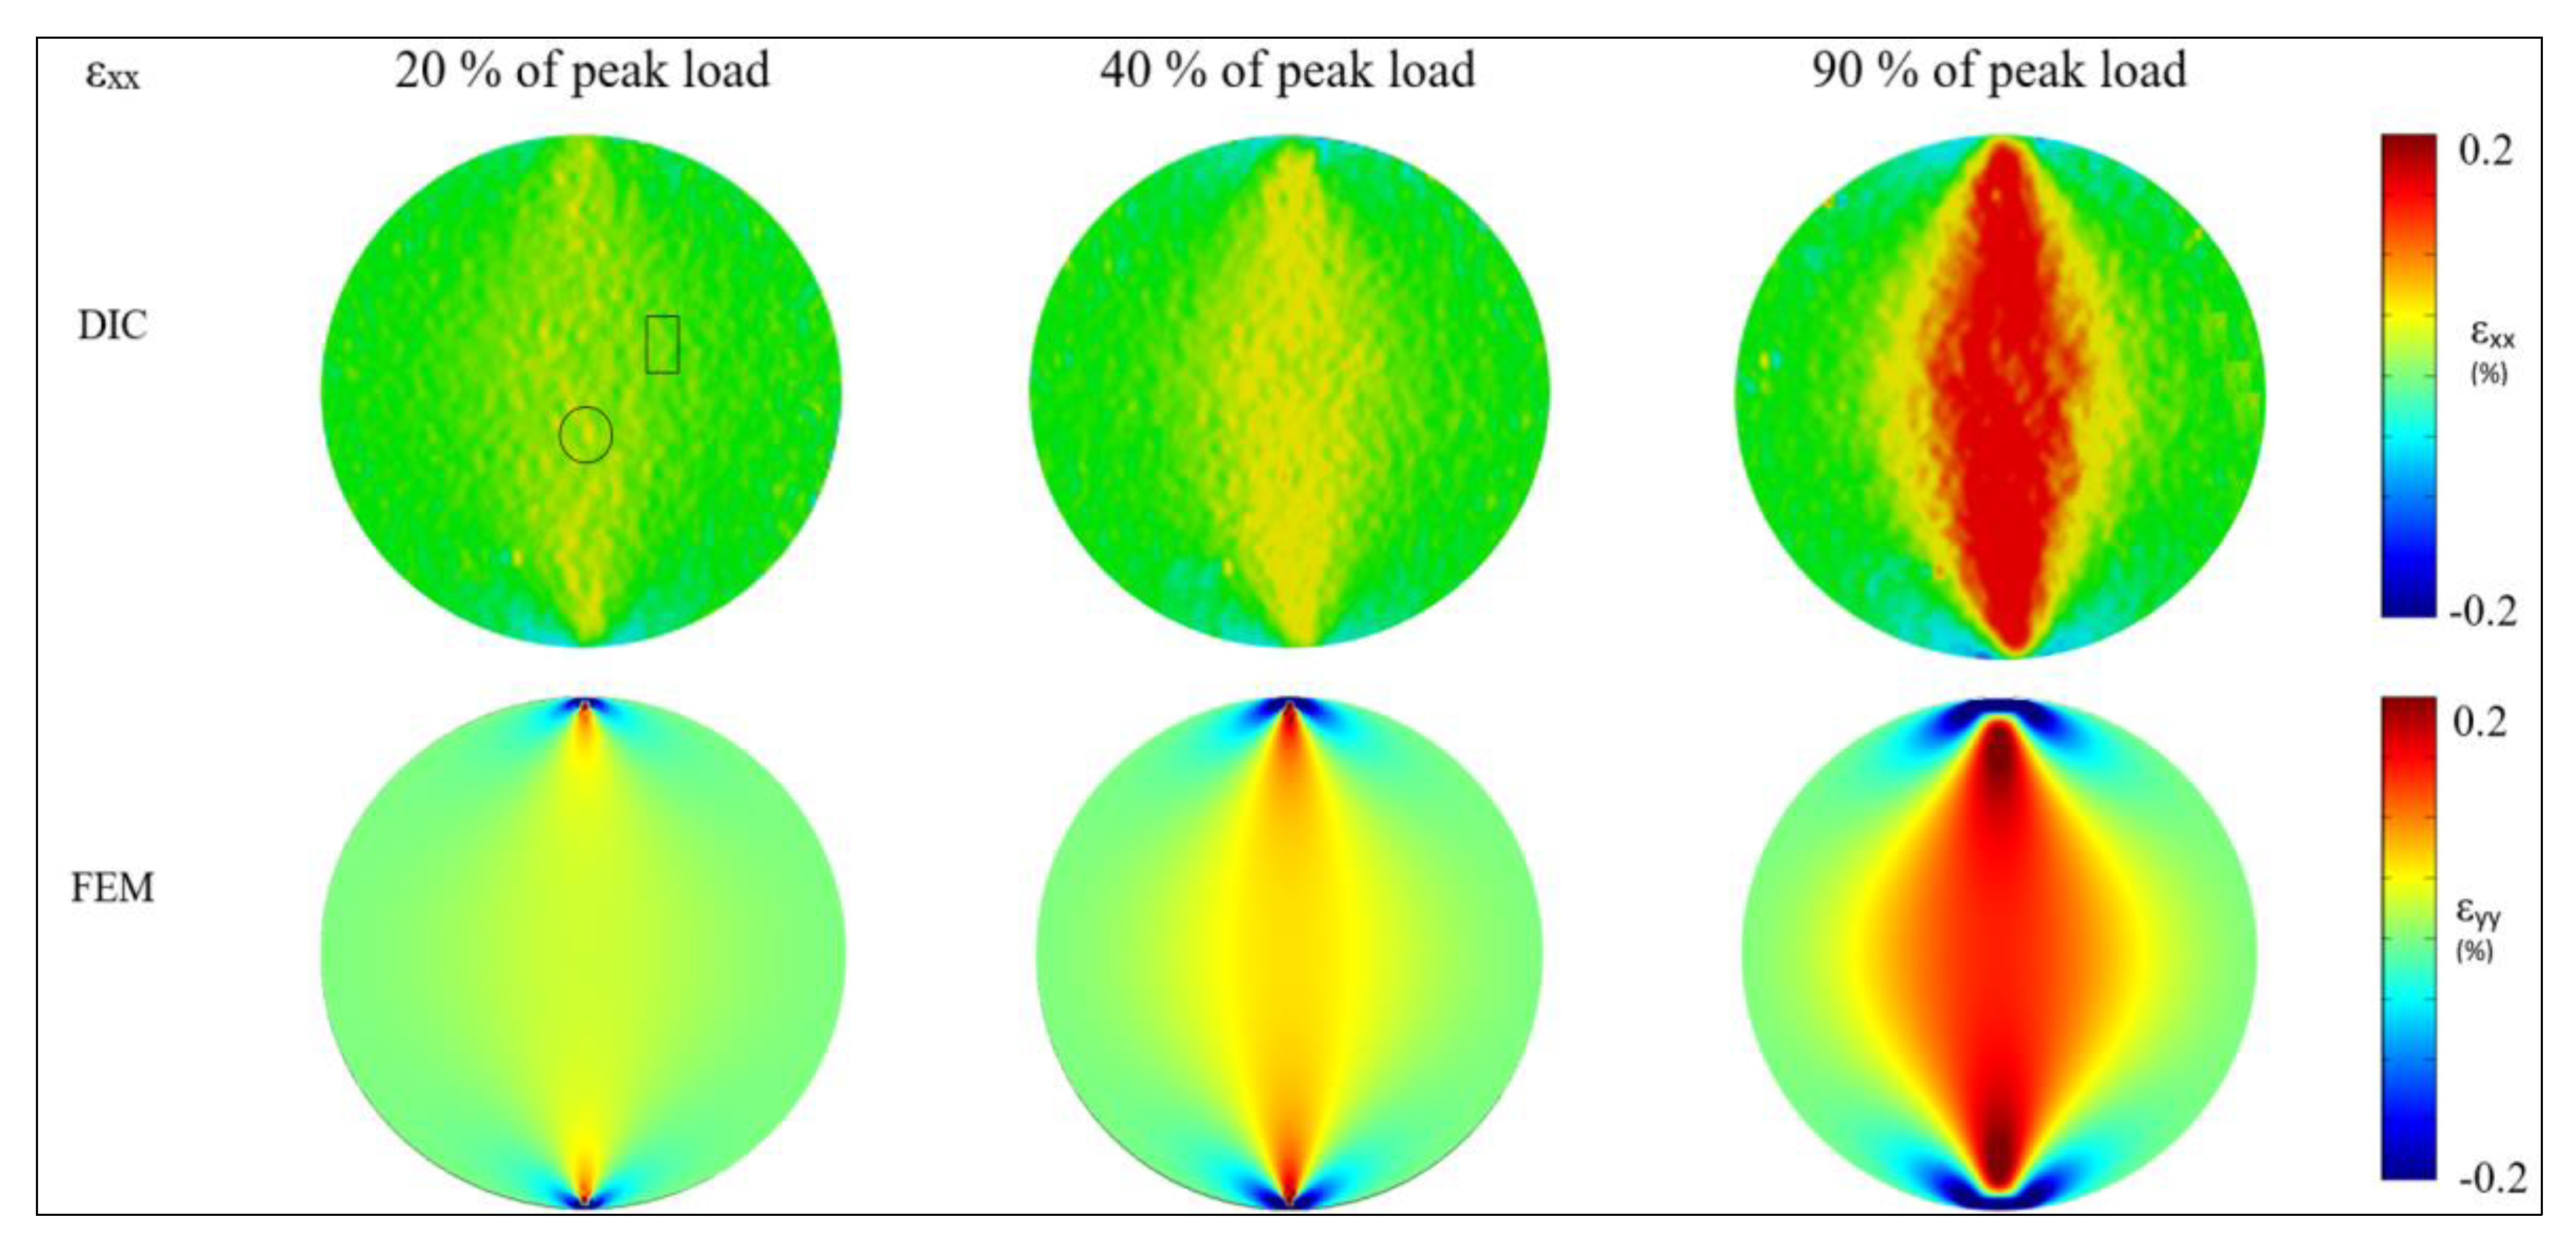
The peak obtained from the experiment was 1277 lbf and three different peak loads (255, 510 and 1150 lbf respectively) were selected based on the elastic limit. Horizontal strain (εxx) distribution for three different peak loads obtained from DIC were compared with simulation results generated by COMSOL Multiphysics, which is presented in Figure 8.
From Figure 8, good agreement was demonstrated between horizontal strain distributions from both DIC and the model. The simulation results showed that compressive strain was generated near the loading point or boundary, which was relatively less visible in DIC as it could not compute deformation up to half subset size near the boundary of the speckled region. The results also substantiated there was a reasonably good match obtained within the elastic response (20% and 40% of peak load). As the load increased and the sample reached closer to failure, the deviation in deformation along with the centerline increased as shown for 90% of the peak load.
The DIC color maps displayed some sprinkle nature in Figure 8. At 20% of the peak load, it was evident that there were some dark-yellow (black circle) and light-yellow (black rectangle) features that looked like noise in the measurements during loading. According to the standard, DIC noises were within 0.01% strain. Dark-yellow dots were above these noise thresholds and represent a real physical deformation that was measured using DIC. The light-yellow features have low strain values and are very difficult to measure using DIC as well as conventional techniques. The light-yellow features may be the noise or deformations that cannot be captured using DIC with high fidelity.
At 40% of the peak load, most yellow dots in the DIC map had a sprinkled look and were not as smooth as in the simulation. This could probably relate to the porosity variation and non-homogeneity of the Spider Berea rock.
Moreover, at 90% of the peak load, the DIC map was similar to the simulation magnitude. It substantiated that the homogeneous simulation could capture strain deformation events of rock under diametrical compression.
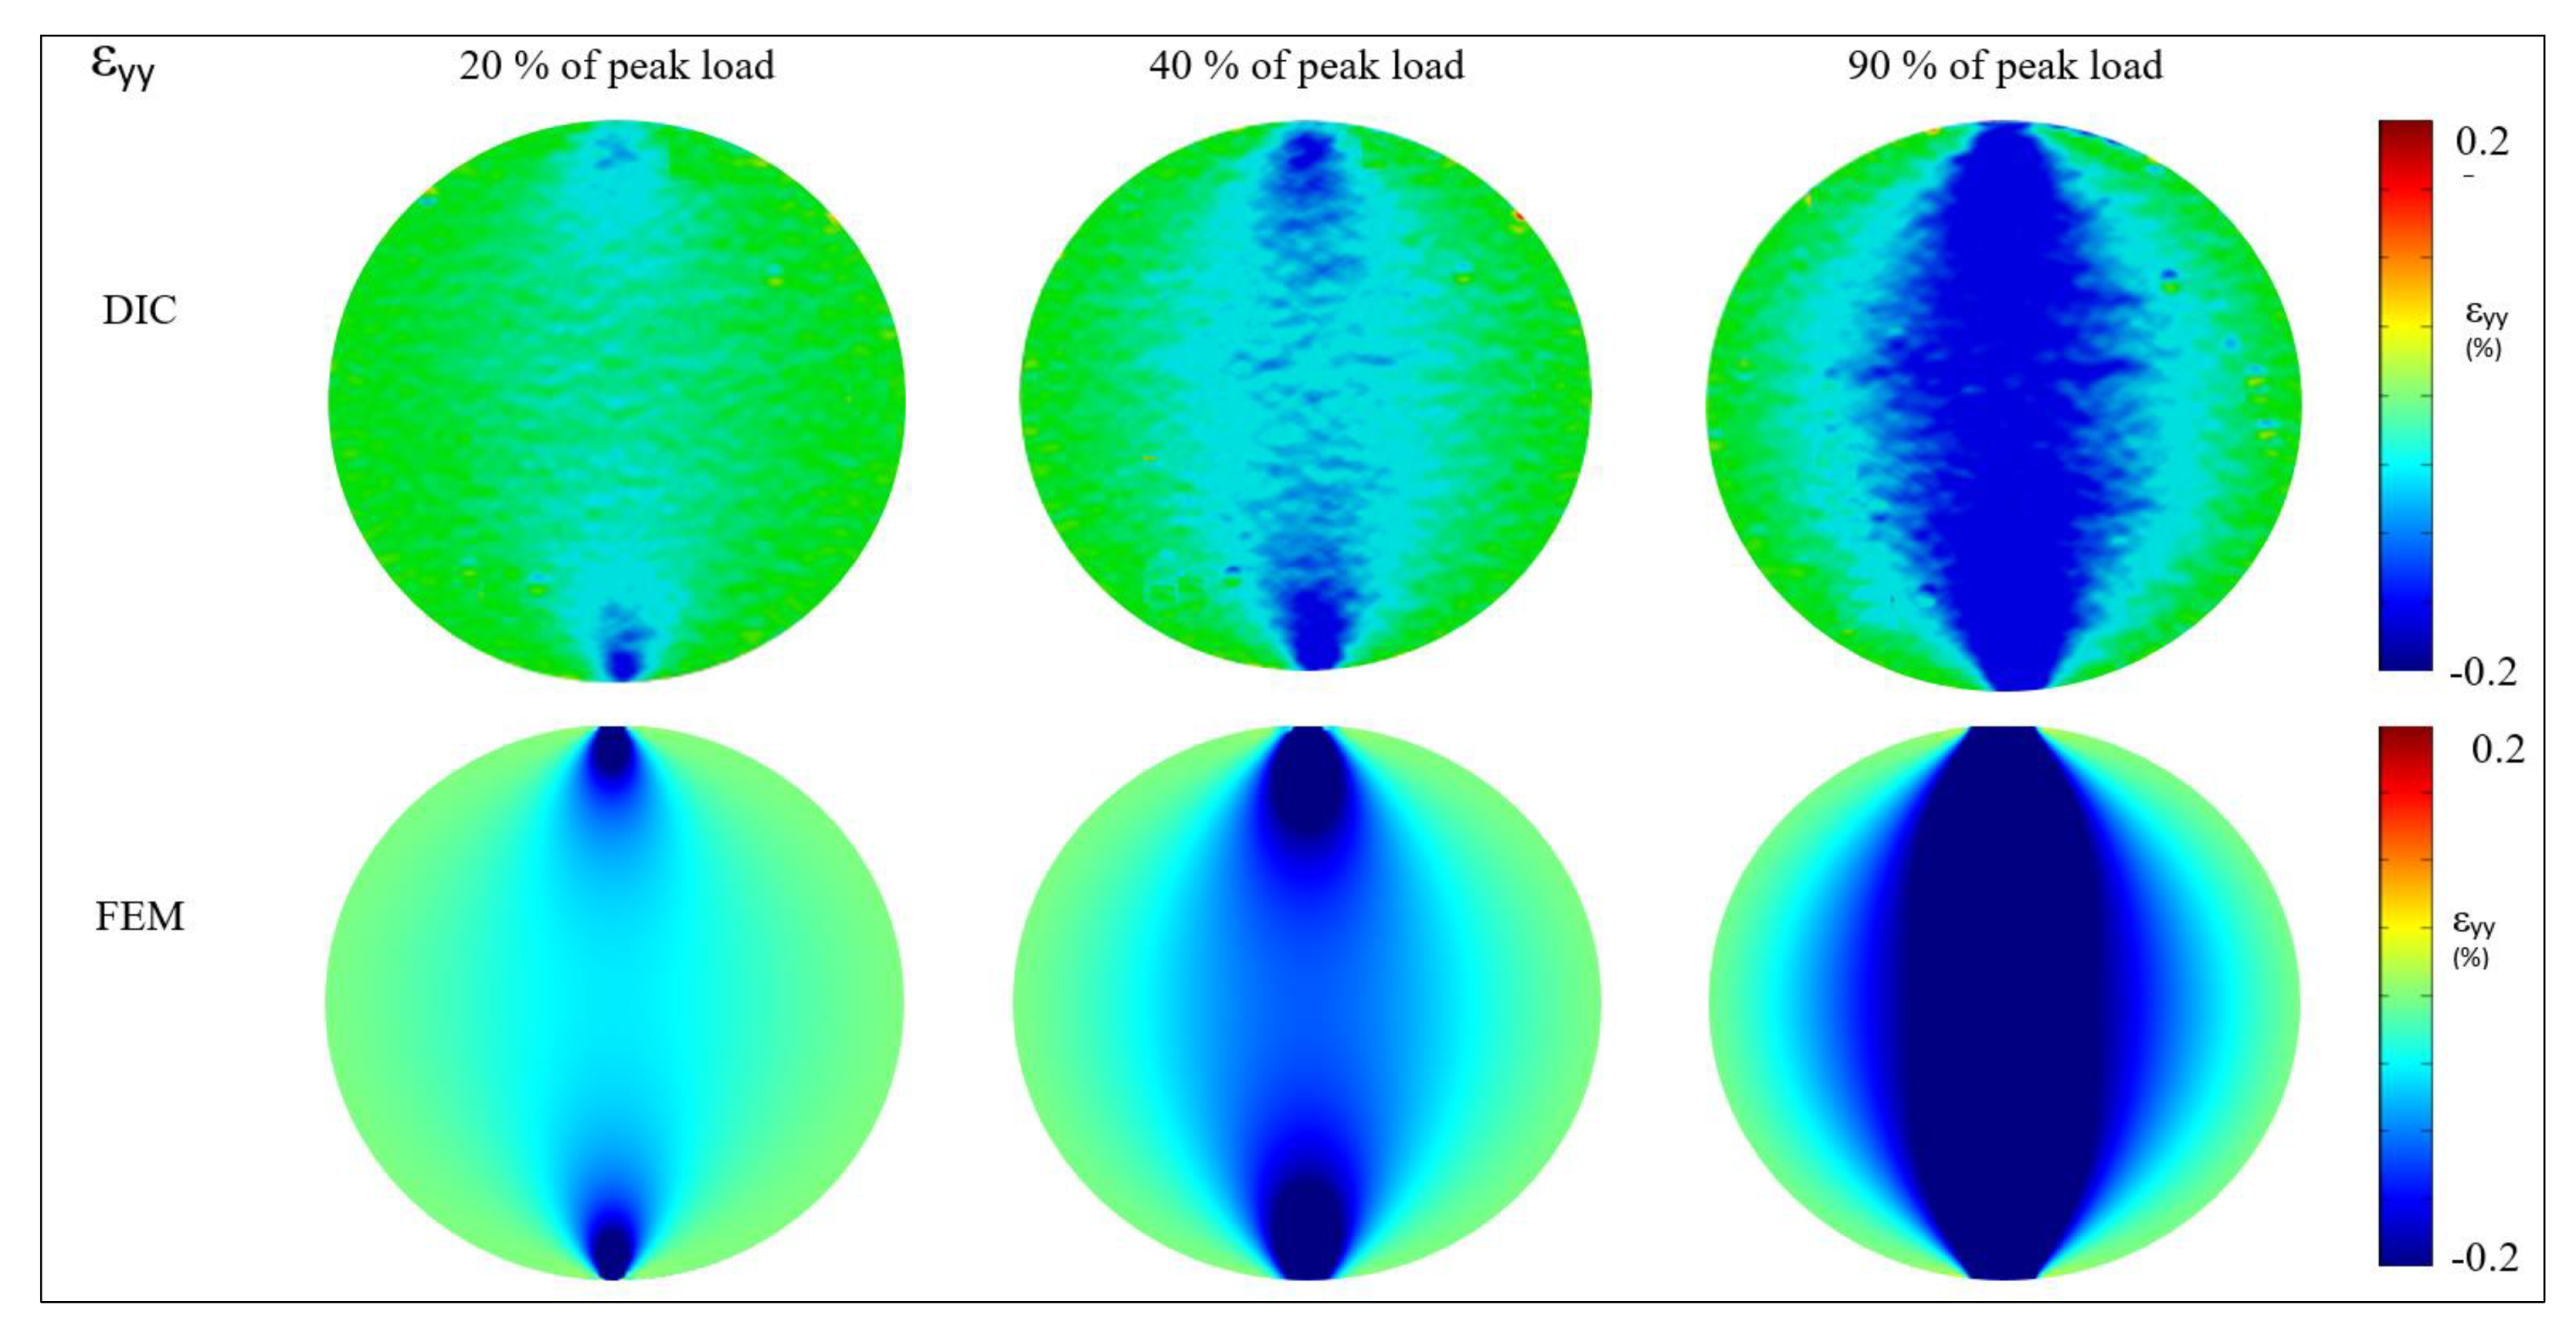
Similarly, vertical strain (εyy) distribution for three different peak loads also obtained from DIC was compared with the simulation results, which were presented in Figure 9. The strain range was selected to get the maximum visibility of the deformation behaviors. The vertical strain (εyy) distribution also matched close to the DIC generated value.
Both the DIC and FEM deformation patterns were very similar for 20% of the peak load in the vertical strain map shown in Figure 9. At 40% and 90% of the peak load, the strain maps showed some blue horizontal irregular lines, which probably occurred due to the compression of the soft lamination inherently present in the rock. The deformation of 90% of the peak load reasonably matched with the homogeneous simulation.
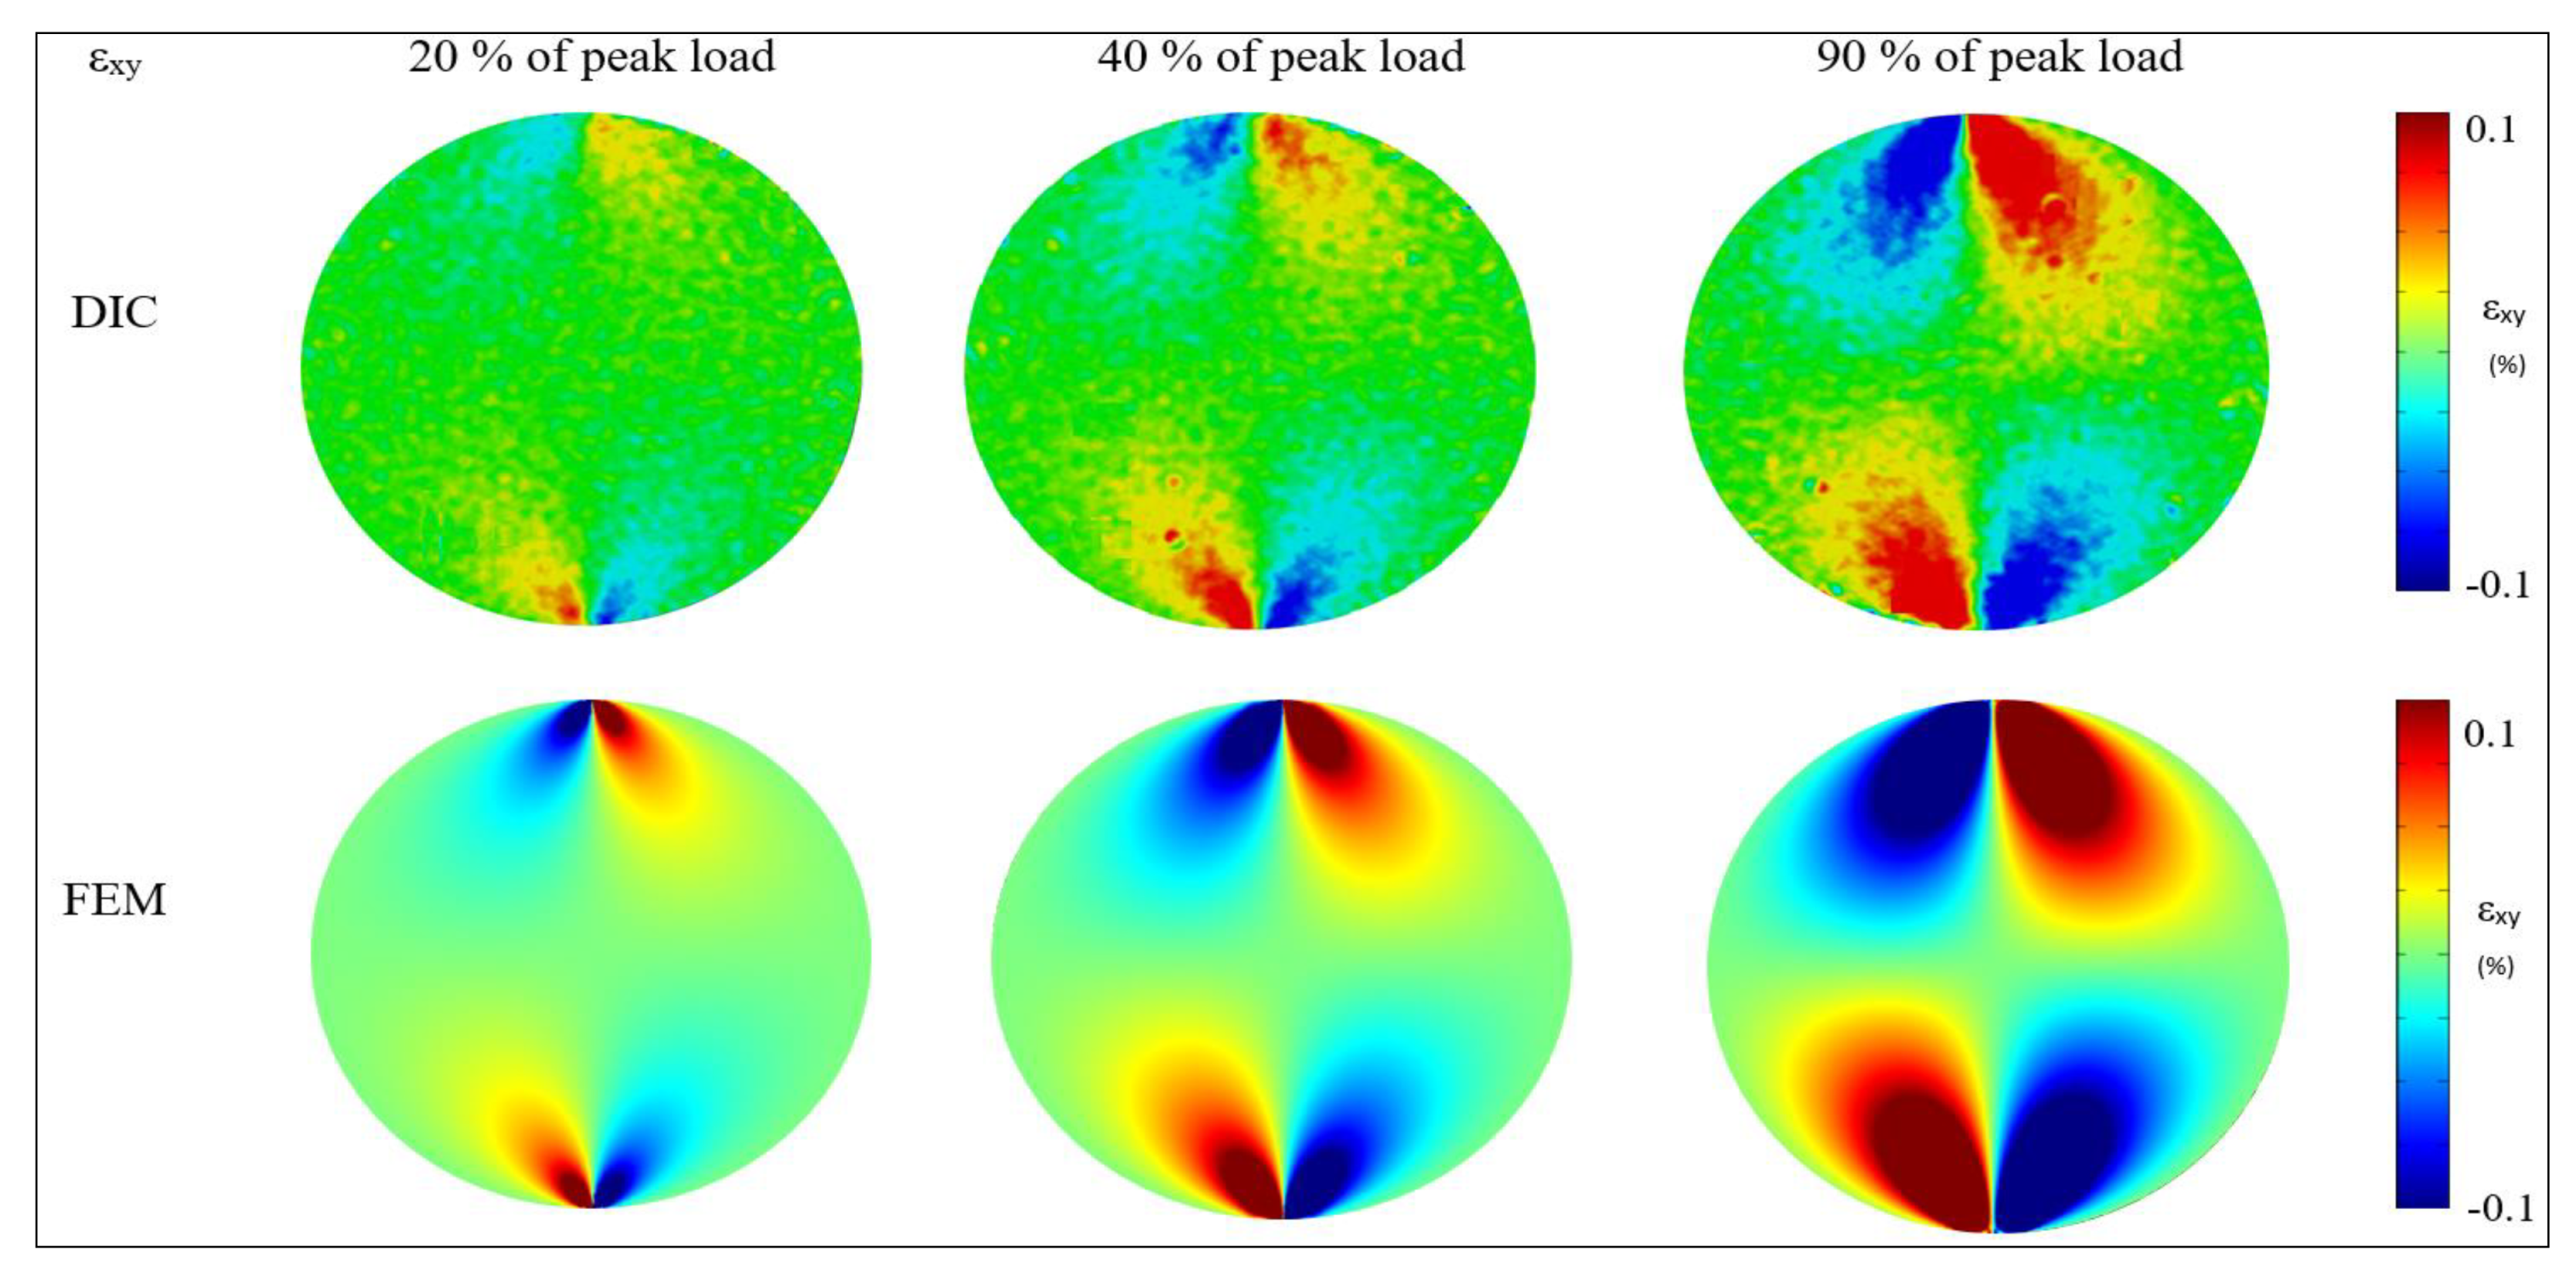
Likewise, the shear strain (εxy) distribution for the aforementioned three different peak loads obtained from DIC was also compared with the COMSOL model and is illustrated in Figure 10. The results have shown that the shear strain was less than the axial strain, which substantiates that the shear strain was not responsible for the failure of isotropic and homogeneous rock. The shear strain (εxy) distribution also matched within 2% of the DIC generated value.
Figure 10 also depicted the sprinkle nature on the color map, which most probably occurred owing to the porosity, soft lamination, and non-homogeneity nature of the sample, but the overall deformation matched closely. There were some other reasons such as the vibration of the load frame, temperature from the heating of the camera, camera distortion, etc. which may have caused noise that resulted in the deviation in the results during the experiment [48] but these can be minimized by calibration. The above DIC and simulation results revealed that the homogeneous assumption in the simulation can be acceptable.

4.3. Vertical Displacement from Numerical Model vs. DIC Results

At three different portions of applied peak loads, the changes in displacement along the central vertical axis during loading were also investigated to understand the deformation behaviors and compared with results from the numerical model which were presented in terms of displacement contour in Figure 11.
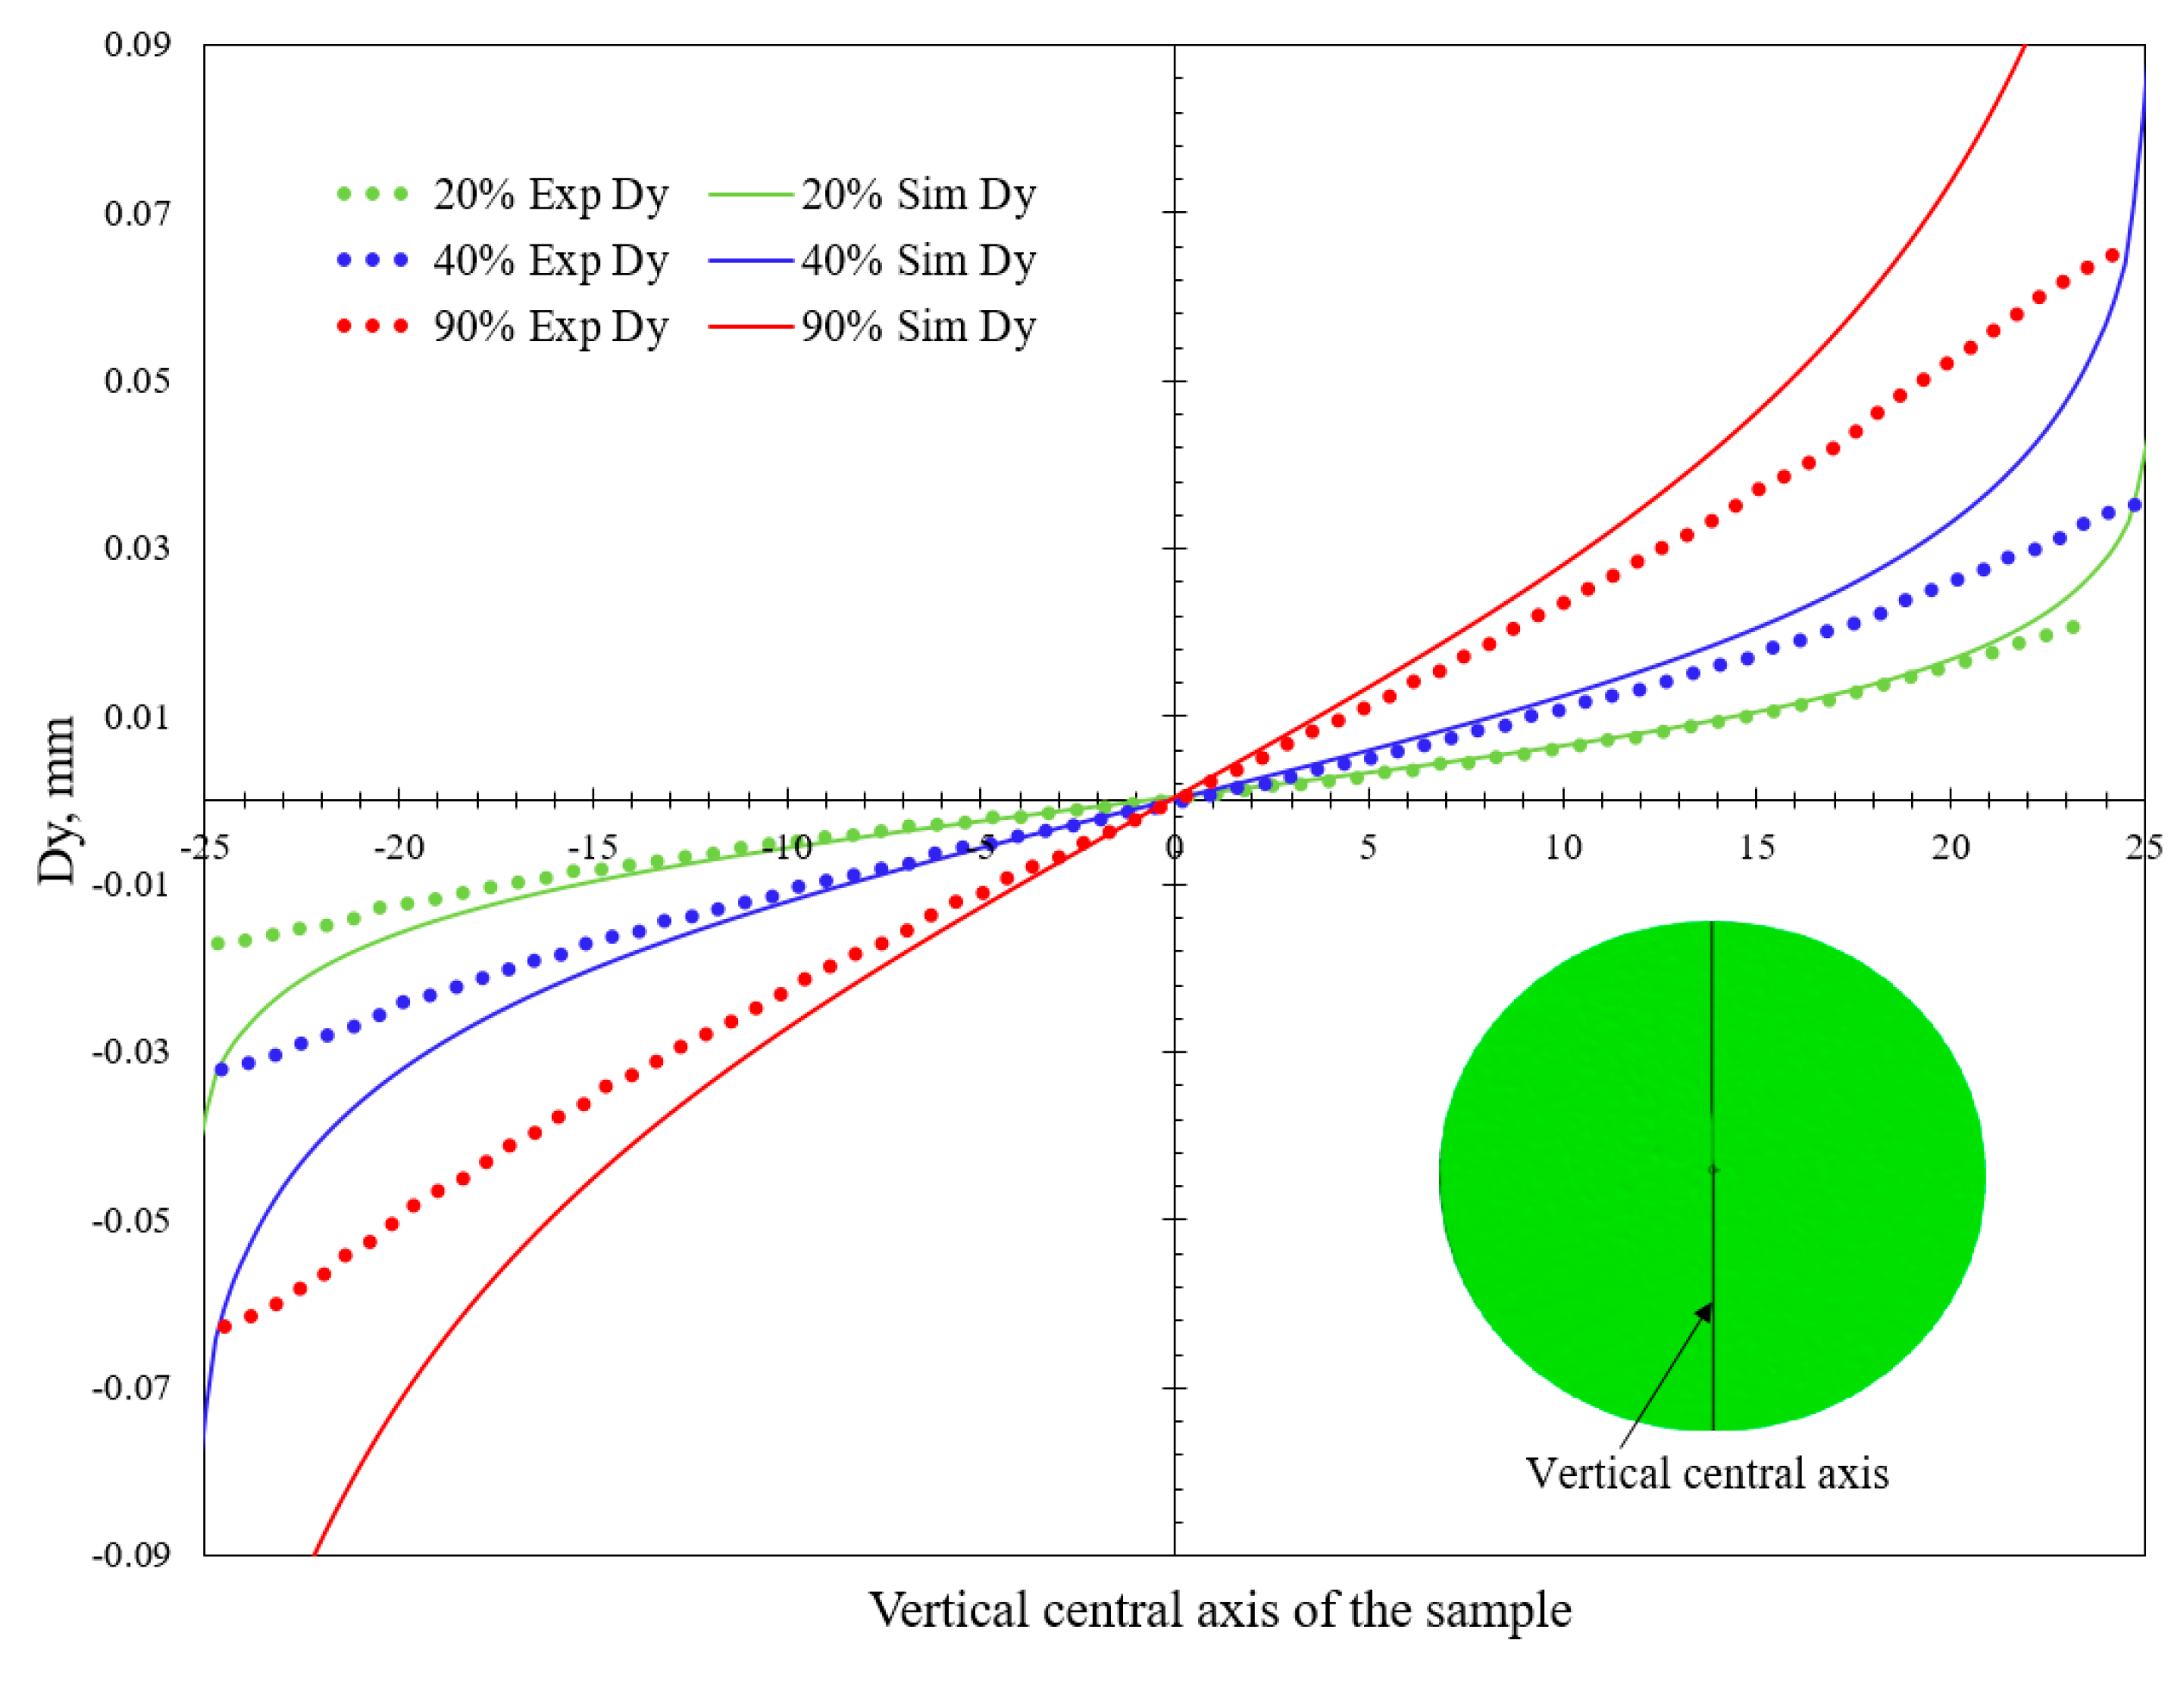
Figure 12 demonstrated that 20% and 40% of the peak values showed very good agreement both in numerical and DIC generated displacement magnitude. For 90% of the peak load, the MAPE was investigated within 1.21% from the experimental value for vertical displacement using Equation (9). Overall, vertical displacement was investigated as repetitive and close to the experimental value.

4.4. Horizontal Displacements from the Numerical Model vs. DIC Results

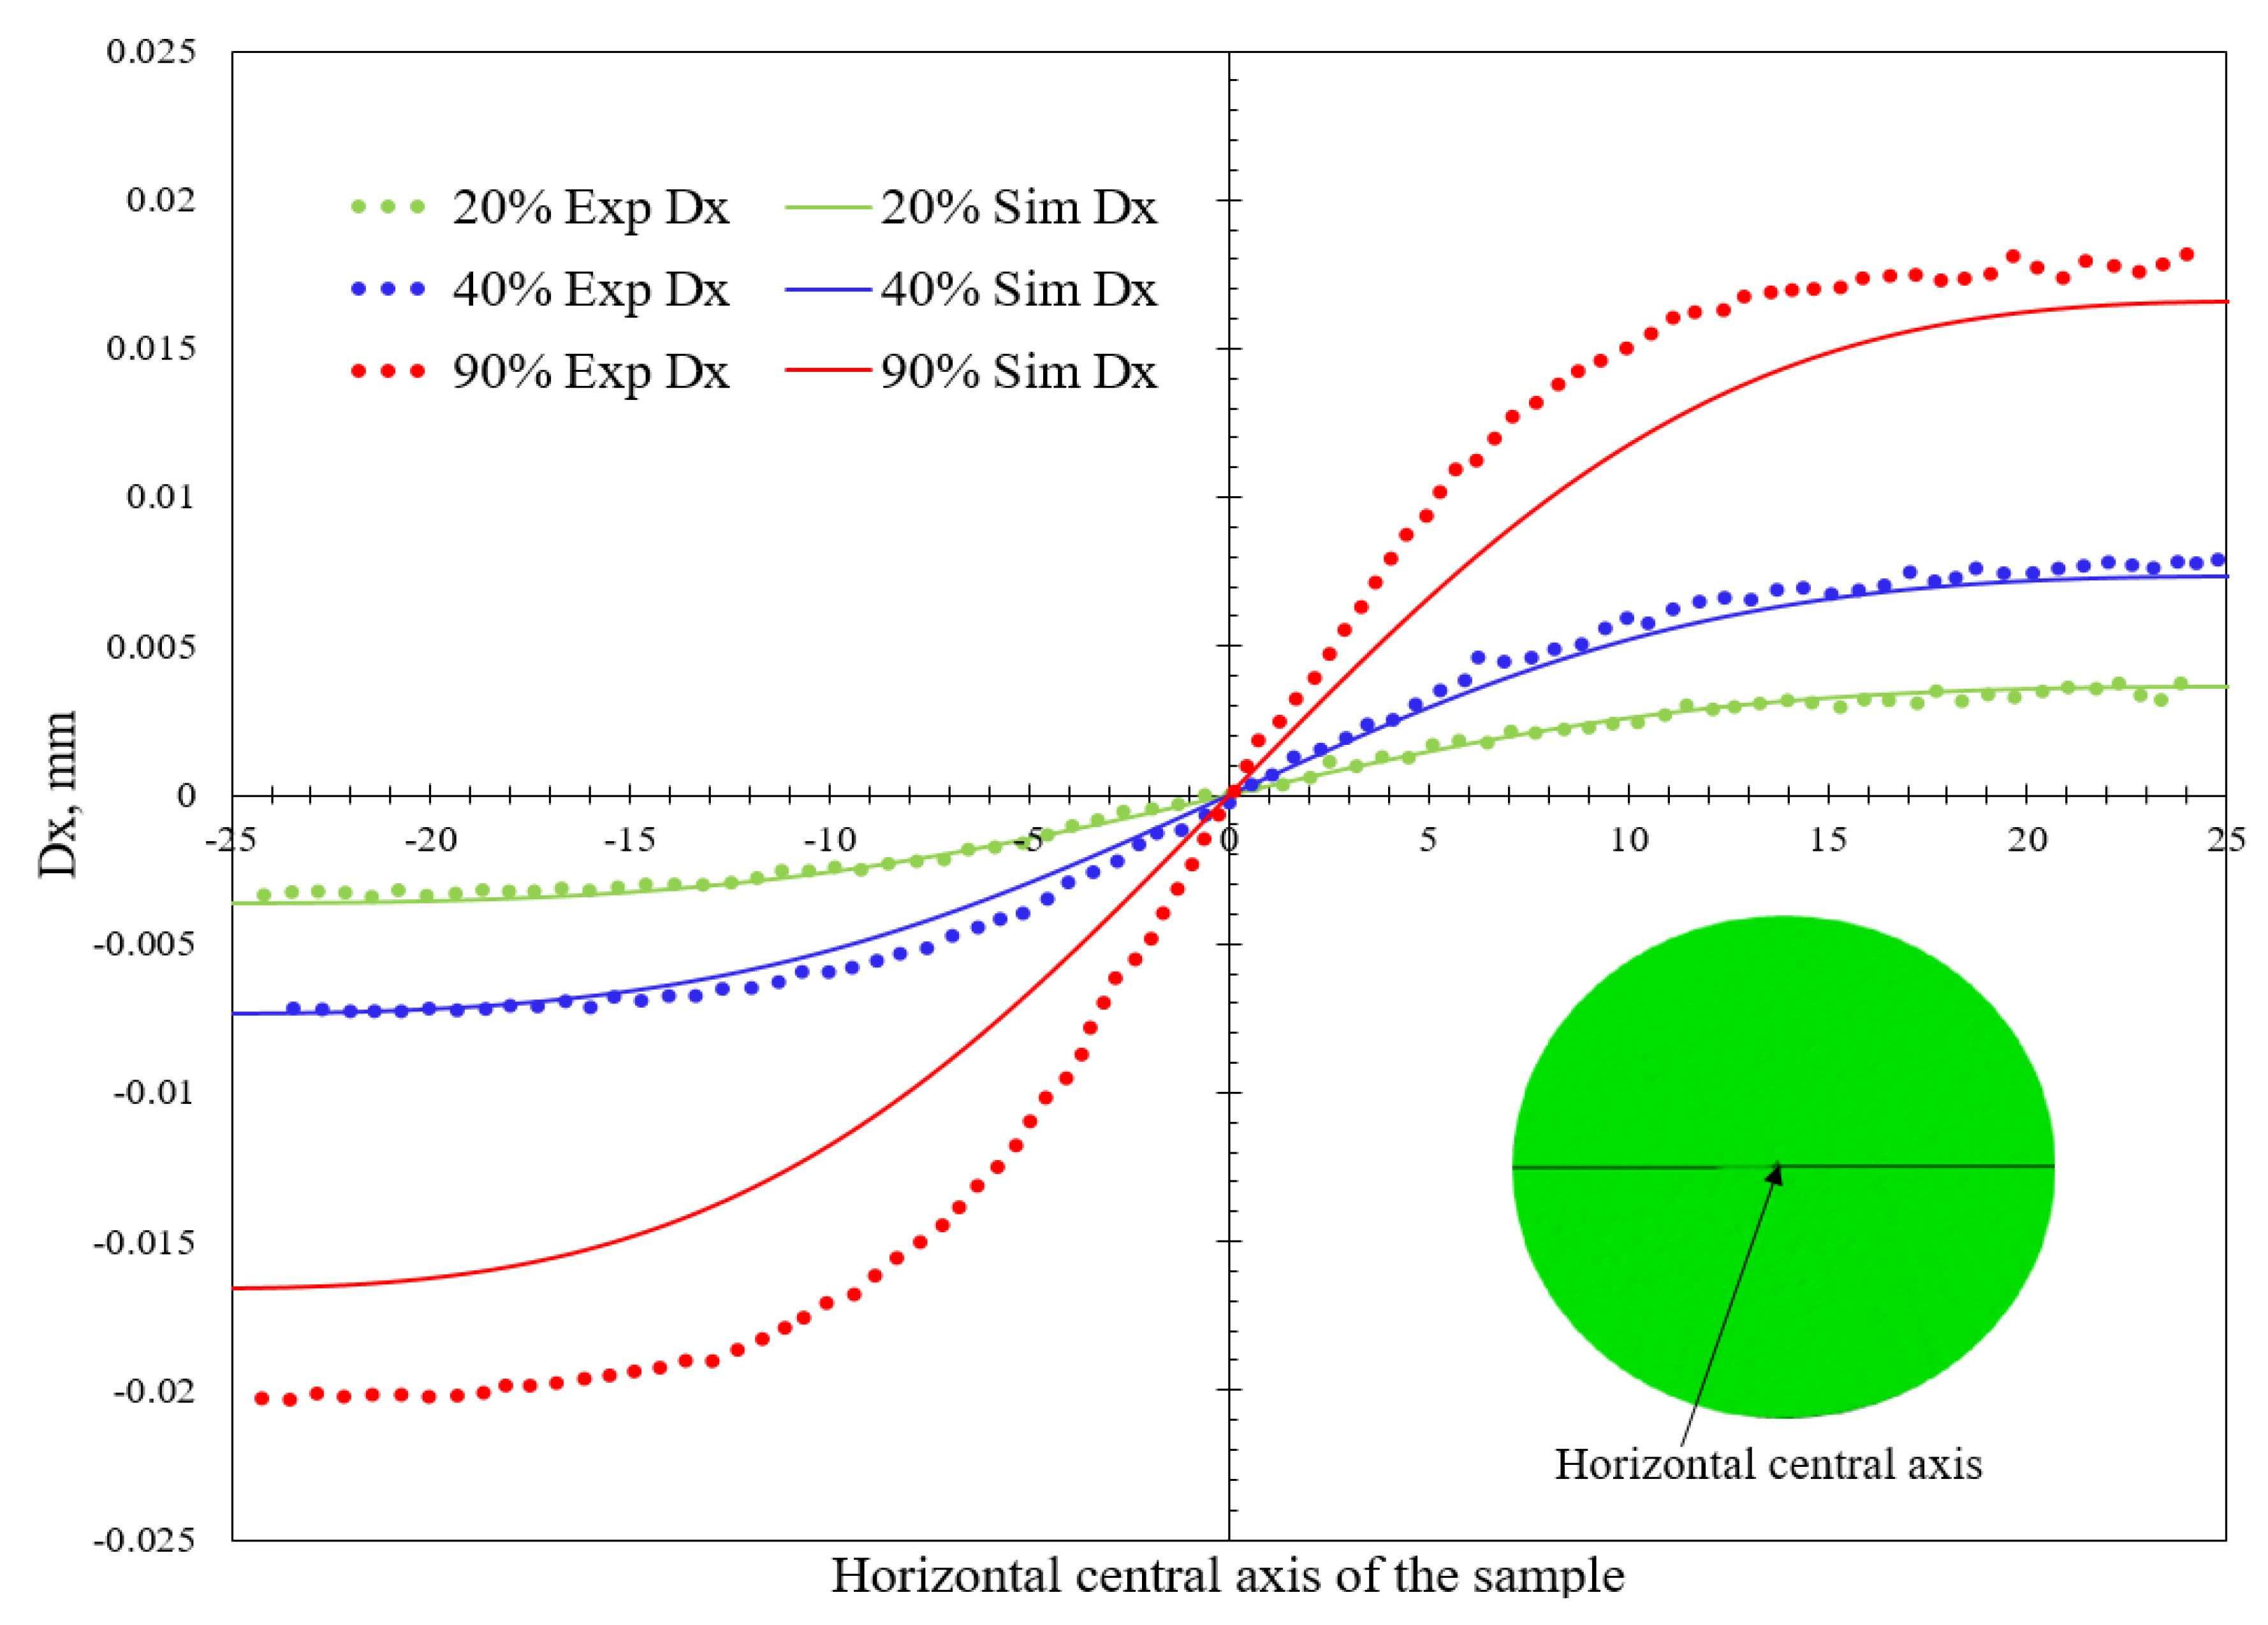
A similar investigation was conducted on the changes in horizontal displacement and a very reasonable agreement in both approaches was found (Figure 13).
Figure 14 demonstrated that 20% and 40% of the final peak values showed an excellent agreement both in numerical simulation and DIC results. The deviation increased as the load increased (Table 3); 90% of the final peak values showed a comparatively higher difference. Overall, horizontal displacement was investigated as repetitive and closer to the experimental value.
From the R2 value, it was evident that the deviation along the vertical centerline (Dy) was bigger than that of the horizontal (Dx). This is probably because of the existence of non-linearity in the specimen, in particular, because of soft lamination and the bedding nature. This linear elastic numerical model did not take into account such a non-linear effect.
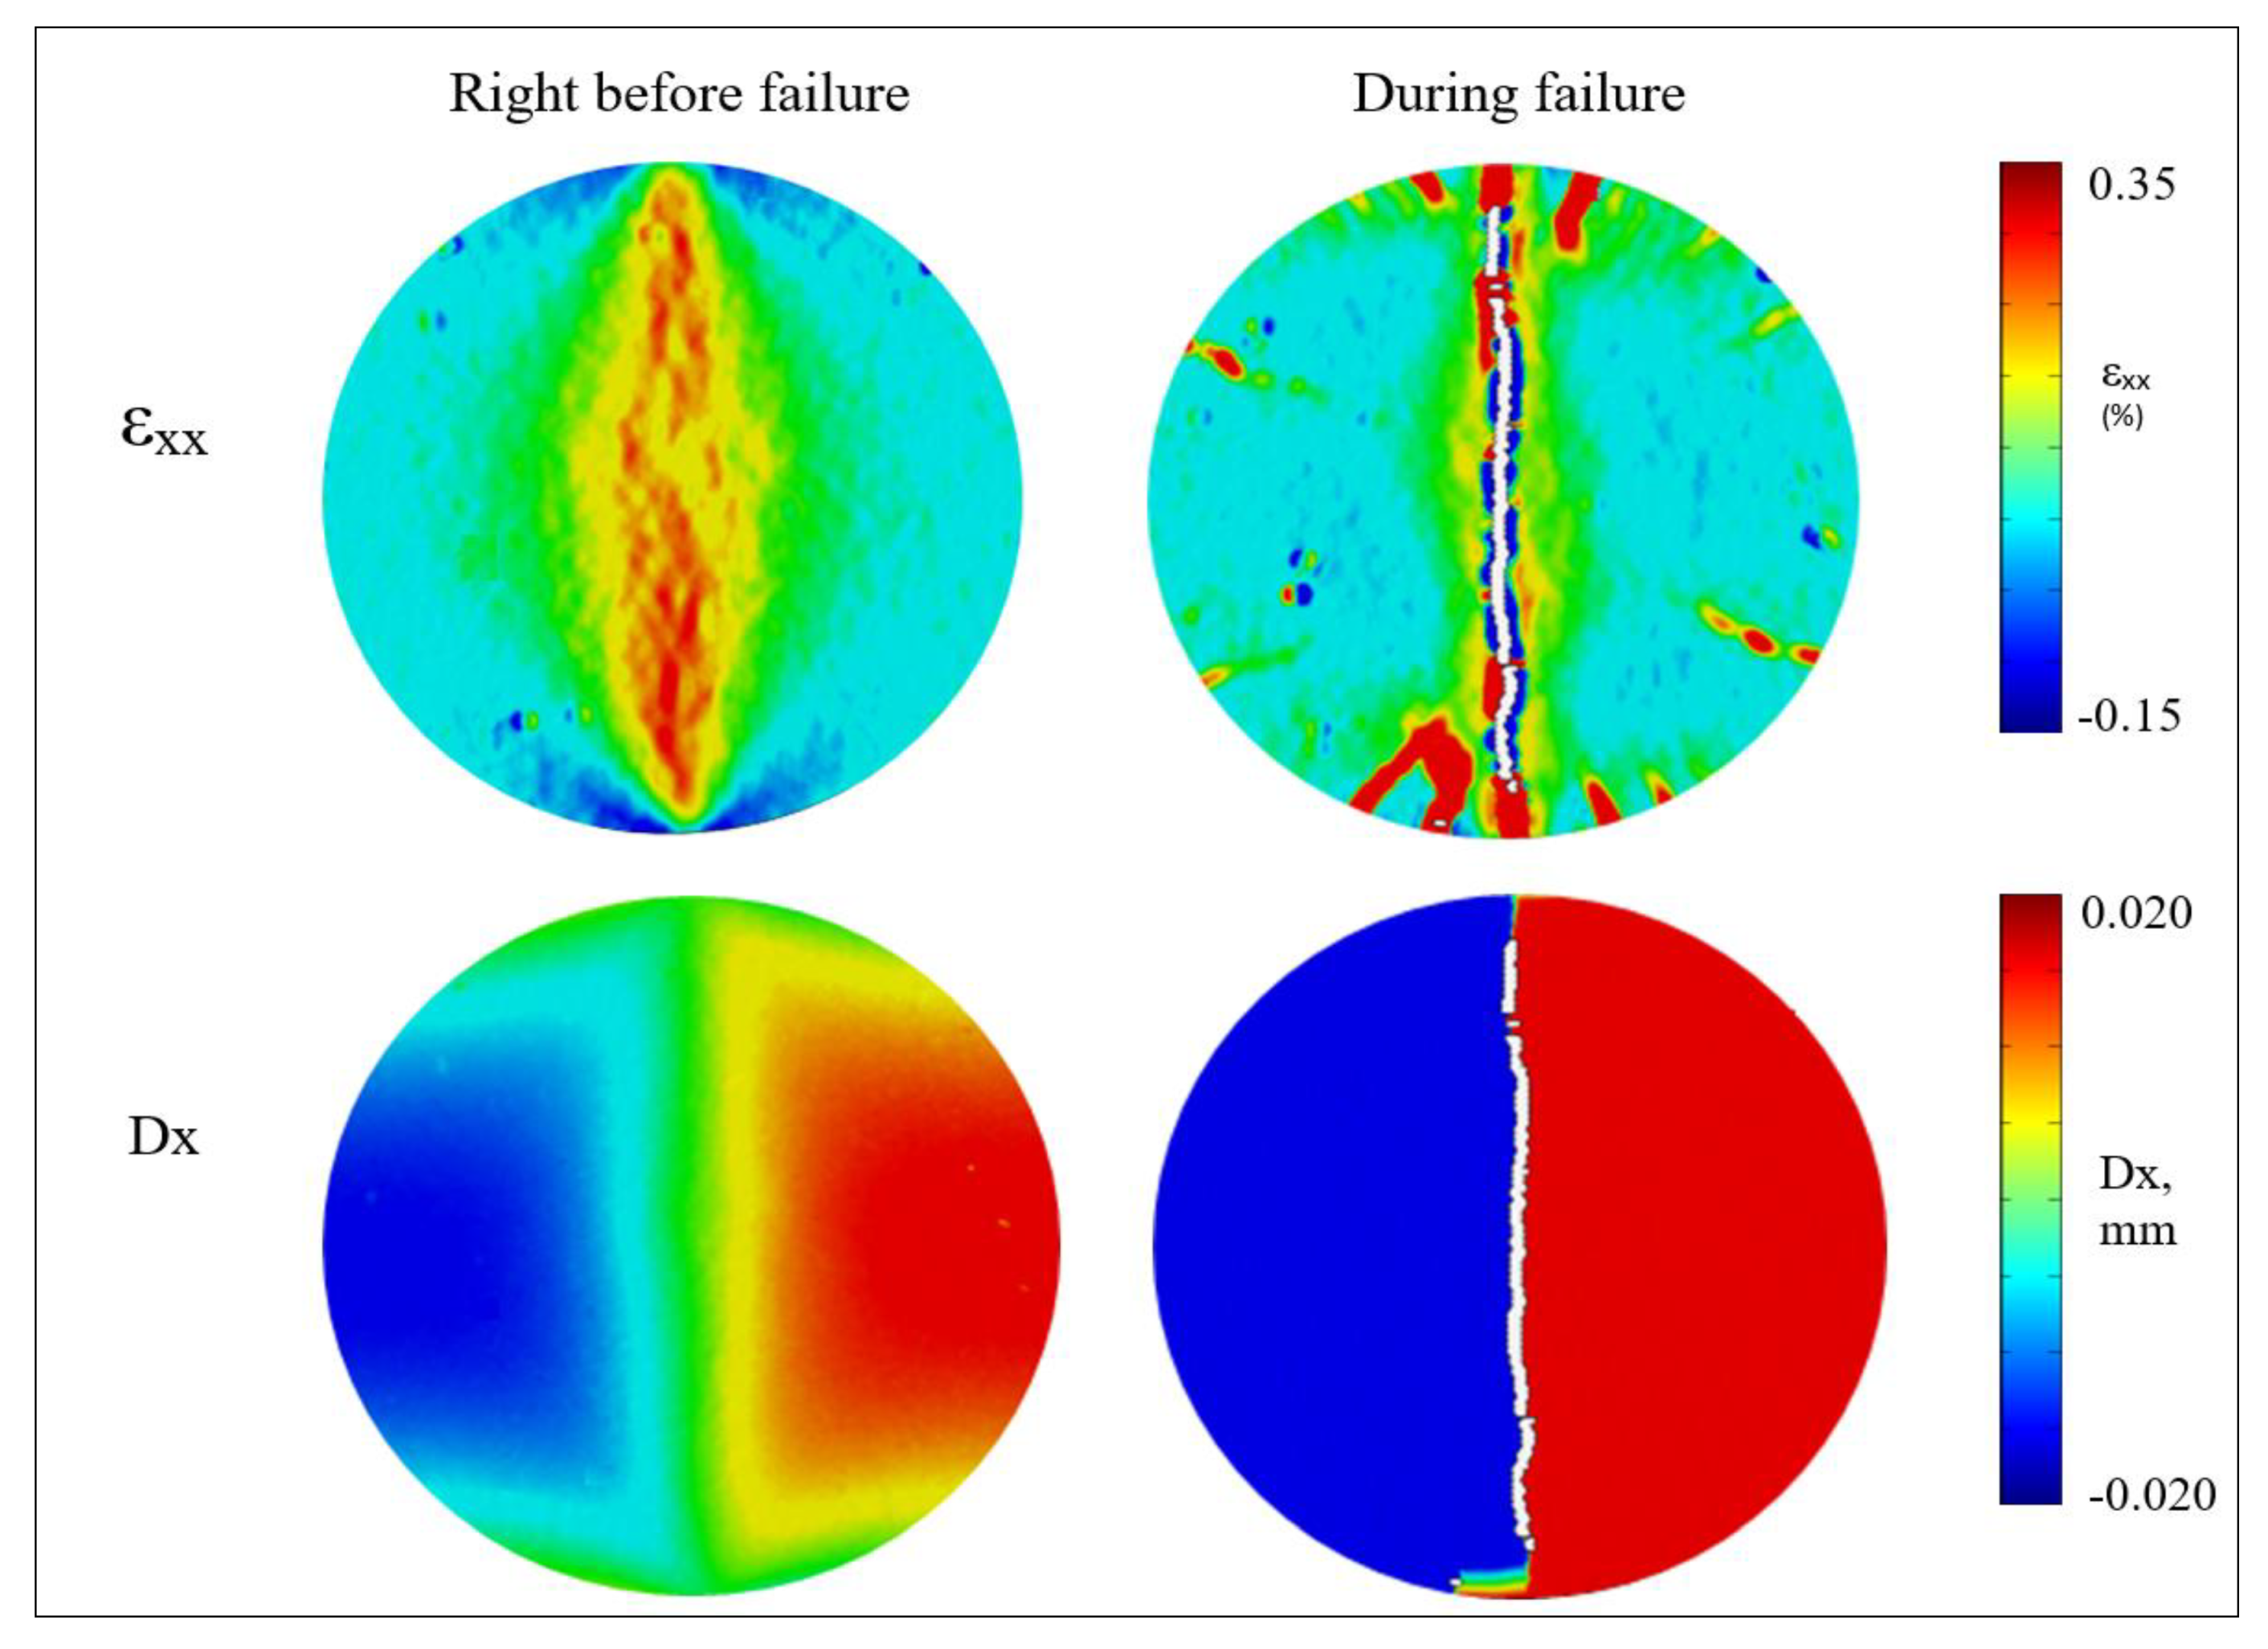
Considering the comparison between two distinct stages of the failure process, such as, right before failure and during failure of the sample, can be utilized to investigate the possible crack initiation locations as shown in Figure 15. In the images right before the failure stage, it was evident that the intensity of horizontal strain accumulation (εxx) was greater in the central region compared to the boundary of the sample. During failure, central crack propagation was observed up to the region where strain accumulated greater, and not near the loading points. Similarly, the horizontal displacement (Dx) plot right before failure showed that the central region was being pulled apart (by tension) in two opposite directions, while the horizontal displacement was less in the contact regions. Therefore, the generated cracks that were initiated from the center or central region of the sample substantiated the validity of the indirect tensile testing based on the fracture mechanics theory. Comparison of analytical, numerical and experimental results using DIC was in considerable agreement, so the simulation model based on the experimental investigation is effective at predicting the deformation behavior of rocks. The wider difference between the two approaches was found near to the loading points, as it was this zone that was more prone to stress concentrations, which could be addressed by future research.
The limitation of Brazilian experiments is that it cannot imitate the real subsurface condition which is fluid-driven, but it aids to get an improved understanding of induced fracture geometry when the formation is geologically complex with different discontinuities. Where the complex rock failure process is critical to understand by experimental investigation, the numerical model validated by experimental properties better characterizes the deformation properties of the rock. Overall, this study presented a benchmark for characterizing the deformation attributes for homogeneous rocks and the variation due to the non-homogeneity of rock, will be captured by our future research.

5. Conclusions

In this study, numerical simulations of Brazilian testing based on the finite element method using COMSOL Multiphysics was conducted on the Berea sandstone and fracture behaviors were compared with experimental investigation using the DIC. For analyzing the deformation behaviors, the following conclusions were made:
  • The highest tensile strain investigated along the vertical centerline in the Spider Berea sandstone sample; with load, the tension on the centerline increases until it is causing a vertical, and central fracture;
  • Linear elastic quasi-static numerical results of Brazilian testing reasonably match the analytical solutions. The MAPEs of σx and σy on the vertical diameter are 10.95% and 14.59%, respectively;
  • The horizontal (εxx), vertical (εyy) and shear strain (εxy) were investigated for 20%, 40% and 90% of the peak load obtained from the experimental investigation. The simulation results obtained from the numerical model matched reasonably with DIC generated strain maps except for the proximity of the boundary as DIC maps are in limitations encountering the boundary effect. Therefore, a validated simulation model can be used to predict the boundary effect in Brazilian testing with a different condition for which experimental validation is critical;
  • Changes in vertical (Dy) and horizontal (Dx) displacement in the along centerline was investigated. The numerical results obtained were repetitive and closely match the experimental DIC value. Dx comparison was better matching than Dy due to non-linearity arising from the bedding plane compression, which could not be captured by the linear elastic model;
  • Simulation results of 20% and 40% of the peak loads for vertical (Dy) and horizontal (Dx) displacement are in very good agreement till the load increased near to the failure (90% of the peak load) the DIC value deviates more from simulation value. These observations revealed that changes in both vertical and horizontal displacement are very little in the elastic limit.
  • DIC technique is capable of producing a strain map across the rock surface and can capture the effects of porosity variation, soft lamination, and other non-homogeneity.

Author Contributions

H.Z.: Conceptualization; Methodology; Software; Investigation; Formal analysis; Writing-original draft and Writing—review & editing. F.N.: Investigation; Data curation; Visualization; Writing-original draft and Writing—review & editing. P.N.P.: Conceptualization; Investigation; Supervision; Validation; Writing—review & editing. M.M.: Conceptualization; Methodology; Writing—review & editing; Funding acquisition; Project administration; Resources; Supervision. All authors have read and agreed to the published version of the manuscript.

Funding

This research work was funded by the “Industrial Ties Research Subprogram (ITRS)” grant funded by Louisiana Board of Regent, LEQSF (2017-20)-RD-B-05 and Department of Energy National Energy Technology Laboratory under Award Number DE-FE0031575 (TUSCALOOSA MARINE SHALE LABORATORY).

Conflicts of Interest

There is no conflict of interest in our research paper.

Abbreviations

DICDigital Image Correlation
UCSUniaxial Compressive Strength
BTSBrazilian Tensile Strength
BDTBrazilian Disc Test
MAPEMean Absolute Percentage of Error
FEMFinite Element Model
FPSFrame Per Second
ROIRegion of Interest
σxStress in the x-direction
σyStress in the y-direction
τxyShear stress
εxxStrain in the x-direction
εyyStrain in the y-direction
εxyShear strain
DxHorizontal strain along the centerline
DyVertical strain along the centerline

References

  1. Mokhtari, M.; Tutuncu, A.N. Impact of Laminations and Natural Fractures on Rock Failure in Brazilian Experiments: A Case Study on Green River and Niobrara Formations. J. Nat. Gas Sci. Eng. 2016, 36, 79–86. [Google Scholar] [CrossRef]
  2. Hagström, E.L.; Adams, J.M. Hydraulic fracturing: Identifying and managing the risks. Environ. Claims J. 2012, 24, 93–115. [Google Scholar] [CrossRef]
  3. Gu, H.; Siebrits, E.; Sabourov, A. Hydraulic fracture modeling with bedding plane interfacial slip. In SPE Eastern Regional/AAPG Eastern Section Joint Meeting; Society of Petroleum Engineers: London, UK, 2008. [Google Scholar]
  4. Aadnoy, B.S.; Ong, S. Introduction to Special Issue on Borehole Stability. J. Pet. Sci. Eng. 2003, 38, 79–82. [Google Scholar] [CrossRef]
  5. Amitrano, D. Rupture by Damage Accumulation in Rocks. Int. J. Fract. 2006, 139, 369–381. [Google Scholar] [CrossRef] [Green Version]
  6. Li, D.; Wong, L.N.Y. The Brazilian Disc Test for Rock Mechanics Applications: Review and New Insights. Rock Mech. Rock Eng. 2013, 46, 269–287. [Google Scholar] [CrossRef]
  7. Standard Test Method for Uniaxial Compressive Strength of Intact Rock Core Specimens; ASTM D 2938; ASTM International: West Conshohocken, PA, USA, 2008.
  8. Carneiro, F.L.L.B. A new method to determine the tensile strength of concrete. In Proceedings of the 5th Meeting of the Brazilian Association for Technical Rules, Sao Paulo, Brazil, 16 September 1943; Volume 16, pp. 126–129. [Google Scholar]
  9. Akazawa, T. New test method for evaluating internal stress due to compression of concrete: The splitting tension test. J. Jpn. Soc. Civ. Eng. 1943, 29, 777–787. [Google Scholar]
  10. Tavallali, A.; Vervoort, A. Effect of layer orientation on the failure of layered sandstone under Brazilian test conditions. Int. J. Rock Mech. Min. Sci. 2010, 47, 313–322. [Google Scholar] [CrossRef]
  11. Frash, L.P.; Gutierrez, M.; Tutuncu, A.; Hood, J.; Mokhtari, M. True-triaxial hydraulic fracturing of Niobrara carbonate rock as an analogue for complex oil and gas reservoir stimulation. In Proceedings of the 49th US Rock Mechanics/Geomechanics Symposium, San Francisco, CA, USA, 28 June–1 July 2015. [Google Scholar]
  12. Li, H.; Lai, B.; Liu, H.-H.; Zhang, J.; Georgi, D. Experimental Investigation on Brazilian Tensile Strength of Organic-Rich Gas Shale. SPE J. 2017, 22, 148–161. [Google Scholar] [CrossRef]
  13. Mokhtari, M.; Bui, B.T.; Tutuncu, A.N. Tensile Failure of Shales: Impacts of Layering and Natural Fractures. In Proceedings of the SPE Western North American and Rocky Mountain Joint Meeting, Denver, CO, USA, 16–18 April 2014. [Google Scholar]
  14. Wang, Q.Z.; Jia, X.M.; Kou, S.Q.; Zhang, Z.X.; Lindqvist, P.A. The flattened Brazilian disc specimen used for testing elastic modulus, tensile strength and fracture toughness of brittle rocks: Analytical and numerical results. Int. J. Rock Mech. Min. Sci. 2004, 41, 245–253. [Google Scholar] [CrossRef]
  15. Chen, S.; Yue, Z.Q.; Tham, L.G.; Lee, P.K.K. Modeling of the indirect tensile test for inhomogeneous granite using a digital image-based numerical method. Int. J. Rock Mech. Min. Sci. 2004, 41 (Suppl. 1), 466–471. [Google Scholar] [CrossRef]
  16. Yanagidani, T.; Sano, O.; Terada, M.; Ito, I. The observation of cracks propagating in diametrically compressed rock discs. Int. J. Rock Mech. Min. Sci. Geomech. Abstr. 1978, 15, 225–235. [Google Scholar] [CrossRef]
  17. Hudson, J.A.; Brown, E.T.; Rummel, F. The controlled failure of rock discs and rings loaded in diametral compression. Int. J. Rock Mech. Min. Sci. Geomech. Abstr. 1972, 9, 241–248. [Google Scholar] [CrossRef]
  18. Hooper, J.A. The failure of glass cylinders in diametral compression. J. Mech. Phys. Solids 1971, 19, 179–200. [Google Scholar] [CrossRef]
  19. Fairhurst, C. On the validity of the ‘Brazilian test for brittle materials. Int. J. Rock Mech. Min. Sci. Geomech. Abstr. 1964, 4, 535–546. [Google Scholar] [CrossRef]
  20. Swab, J.J.; Yu, J.; Gamble, R.; Kilczewski, S. Analysis of the diametral compression method for determining the tensile strength of transparent magnesium aluminate spinel. Int. J. Fract. 2011, 172, 187–192. [Google Scholar] [CrossRef]
  21. Stirling, R.A.; Simpson, D.J.; Davie, C.T. The application of digital image correlation to Brazilian testing of sandstone. Int. J. Rock Mech. Min. Sci. 2013, 60, 1–11. [Google Scholar] [CrossRef] [Green Version]
  22. Mokhtari, M.; Hayatdavoudi, A.; Nizamutdinov, R.; Rizvi, H.; Nath, F. Characterization of complex fracture propagation in naturally fractured formations using Digital Image Correlation technique. In SPE Hydraulic Fracturing Technology Conference and Exhibition; Society of Petroleum Engineers: London, UK, 2017. [Google Scholar] [CrossRef]
  23. Nath, F.; Mokhtari, M. Optical visualization of strain development and fracture propagation in laminated rocks. J. Pet. Sci. Eng. 2018, 167, 354–365. [Google Scholar] [CrossRef]
  24. Pan, B.; Asundi, A.; Xie, H.; Gao, J. Digital image correlation using iterative least squares and pointwise least squares for displacement field and strain field measurements. Opt. Lasers Eng. 2009, 47, 865–874. [Google Scholar] [CrossRef]
  25. Sutton, M.A.; Orteu, J.J.; Schreier, H.W. Image Correlation for Shape, Motion and Deformation Measurements; Springer: Berlin, Germany, 2009. [Google Scholar]
  26. Baqersad, J.; Poozesh, P.; Niezrecki, C.; Avitabile, P. Photogrammetry and optical methods in structural dynamics—A review. Mech. Syst. Signal Process. 2017, 86, 17–34. [Google Scholar] [CrossRef]
  27. Chu, T.; Ranson, W.; Sutton, M. Applications of digital-image-correlation techniques to experimental mechanics. Exp. Mech. 1985, 25, 232–244. [Google Scholar] [CrossRef]
  28. Reu, P. DIC: A Revolution in experimental mechanics. Exp. Tech. 2015, 39, 1–2. [Google Scholar] [CrossRef]
  29. Parshall, J.; Whitfield, S.; Jacobs, T. Digital Image Correlation: A New Way to Look at Hydraulic Fracturing. J. Pet Technol. 2017, 69, 2226. [Google Scholar] [CrossRef]
  30. Nath, F.; Salvati, P.E.; Mokhtari, M.; Seibi, A.; Hayatdavoudi, A. Laboratory Investigation of Dynamic Strain Development in Sandstone and Carbonate Rocks Under Diametrical Compression Using Digital-Image Correlation. Soc. Pet. Eng. 2019, 24, 254–273. [Google Scholar] [CrossRef]
  31. Chandler, M.R.; Fauchille, A.L.; Kim, H.K.; Ma, L.; Mecklenburgh, J.; Rizzo, R.; Mostafavi, M.; Marussi, S.; Atwood, R.; May, S.; et al. Correlative optical and X-ray imaging of strain evolution during double-torsion fracture toughness measurements in shale. J. Geophys. Res. Solid Earth 2018, 123, 10517–10533. [Google Scholar] [CrossRef]
  32. Mokhtari, M.; Nath, F.; Hayatdavoudi, A.; Nizamutdinov, R.; Jiang, S.; Rizvi, H. Complex deformation of naturally fractured rocks. J. Pet. Sci. Eng. 2019, 183, 106410. [Google Scholar] [CrossRef]
  33. Na, S.; Sun, W.; Ingraham, M.D.; Yoon, H. Effects of Spatial Heterogeneity and Material Anisotropy on the Fracture Pattern and Macroscopic Effective Toughness of Mancos Shale in Brazilian Tests. J. Geophys. Res. Solid Earth 2017, 122, 6202–6230. [Google Scholar] [CrossRef] [Green Version]
  34. Erarslan, N.; Williams, D.J. Experimental, numerical and analytical studies on tensile strength of rocks. Int. J. Rock Mech. Min. Sci. 2011, 49, 21–30. [Google Scholar] [CrossRef]
  35. Wang, Q.Z.; Xing, L. Determination of fracture toughness KIC by using the flattened Brazilian disk specimen for rocks. Eng. Fract. Mech. 1999, 64, 193–201. [Google Scholar] [CrossRef]
  36. Tavallali, A.; Vervoort, A. Behavior of layered sandstone under Brazilian test conditions: Layer orientation and shape effects. J. Rock Mech. Geotech. Eng. 2013, 5, 366–377. [Google Scholar] [CrossRef] [Green Version]
  37. Zhu, W.C.; Tang, C.A. Numerical simulation of Brazilian disk rock failure under static and dynamic loading. Int. J. Rock Mech. Min. Sci. 2006, 43, 236–252. [Google Scholar] [CrossRef]
  38. Lanaro, F.; Sato, T.; Stephansson, O. Microcrack modeling of Brazilian tensile tests with the boundary element method. Int. J. Rock Mech. Min. Sci. 2009, 46, 450–461. [Google Scholar] [CrossRef]
  39. Ma, T.; Zhang, Q.B.; Chen, P.; Yang, C.; Zhao, J. Fracture pressure model for inclined wells in layered formations with anisotropic rock strengths. J. Pet. Sci. Eng. 2017, 149, 393–408. [Google Scholar] [CrossRef]
  40. Liao, J.J.; Yang, M.T.; Hsieh, H.Y. Direct tensile behavior of a transversely isotropic rock. Int. J. Rock Mech. Min. Sci. 1997, 34, 837–849. [Google Scholar] [CrossRef]
  41. Kocurek Inc. Details for Spider Berea Sandstone. 2019. Available online: https://kocurekindustries.com/index.php?page_name=Berea%20Spider&page_id=240&id=192 (accessed on 17 February 2020).
  42. ISRM. Suggested method for determining indirect tensile strength by Brazilian test. Int. J. Rock Mech. Min. Sci. Geomech. Abstr. 1978, 15, 102–103. [Google Scholar]
  43. Standard Test Method for Splitting Tensile Strength of Intact Rock Core Specimens; ASTM D3967-08; ASTM International: West Conshohocken, PA, USA, 2008. [CrossRef]
  44. Knudsen, O.Ø.; Bjørgum, A.; Polanco-Loria, M.; Øyen, A.; Johnsen, R. Internal Stress and Mechanical Properties of Paint Films. In Proceedings of the CORROSION 2007, Nashville, TN, USA, 11–15 March 2007. [Google Scholar]
  45. Reu, P. Points on Paint. Exp. Tech. 2015, 39, 1–2. [Google Scholar] [CrossRef]
  46. ARAMIS. Standard Operating Manual of ARAMIS Professional. 2019. Available online: https://www.gom.com/3d-software/gom-system-software/aramis-professional.html (accessed on 18 March 2020).
  47. Jianhong, Y.; Wu, F.Q.; Sun, J.Z. Estimation of the Tensile Elastic Modulus Using Brazilian Disc by Applying Diametrically Opposed Concentrated Loads. Int. J. Rock Mech. Min. 2009, 46, 568–576. [Google Scholar] [CrossRef]
  48. Titkcov, V.V.; Panin, S.V. Measurement Affecting Errors in Digital Image Correlation. IOP Conf. Ser. Mater. Sci. Eng. 2019, 511, 012018. [Google Scholar] [CrossRef]
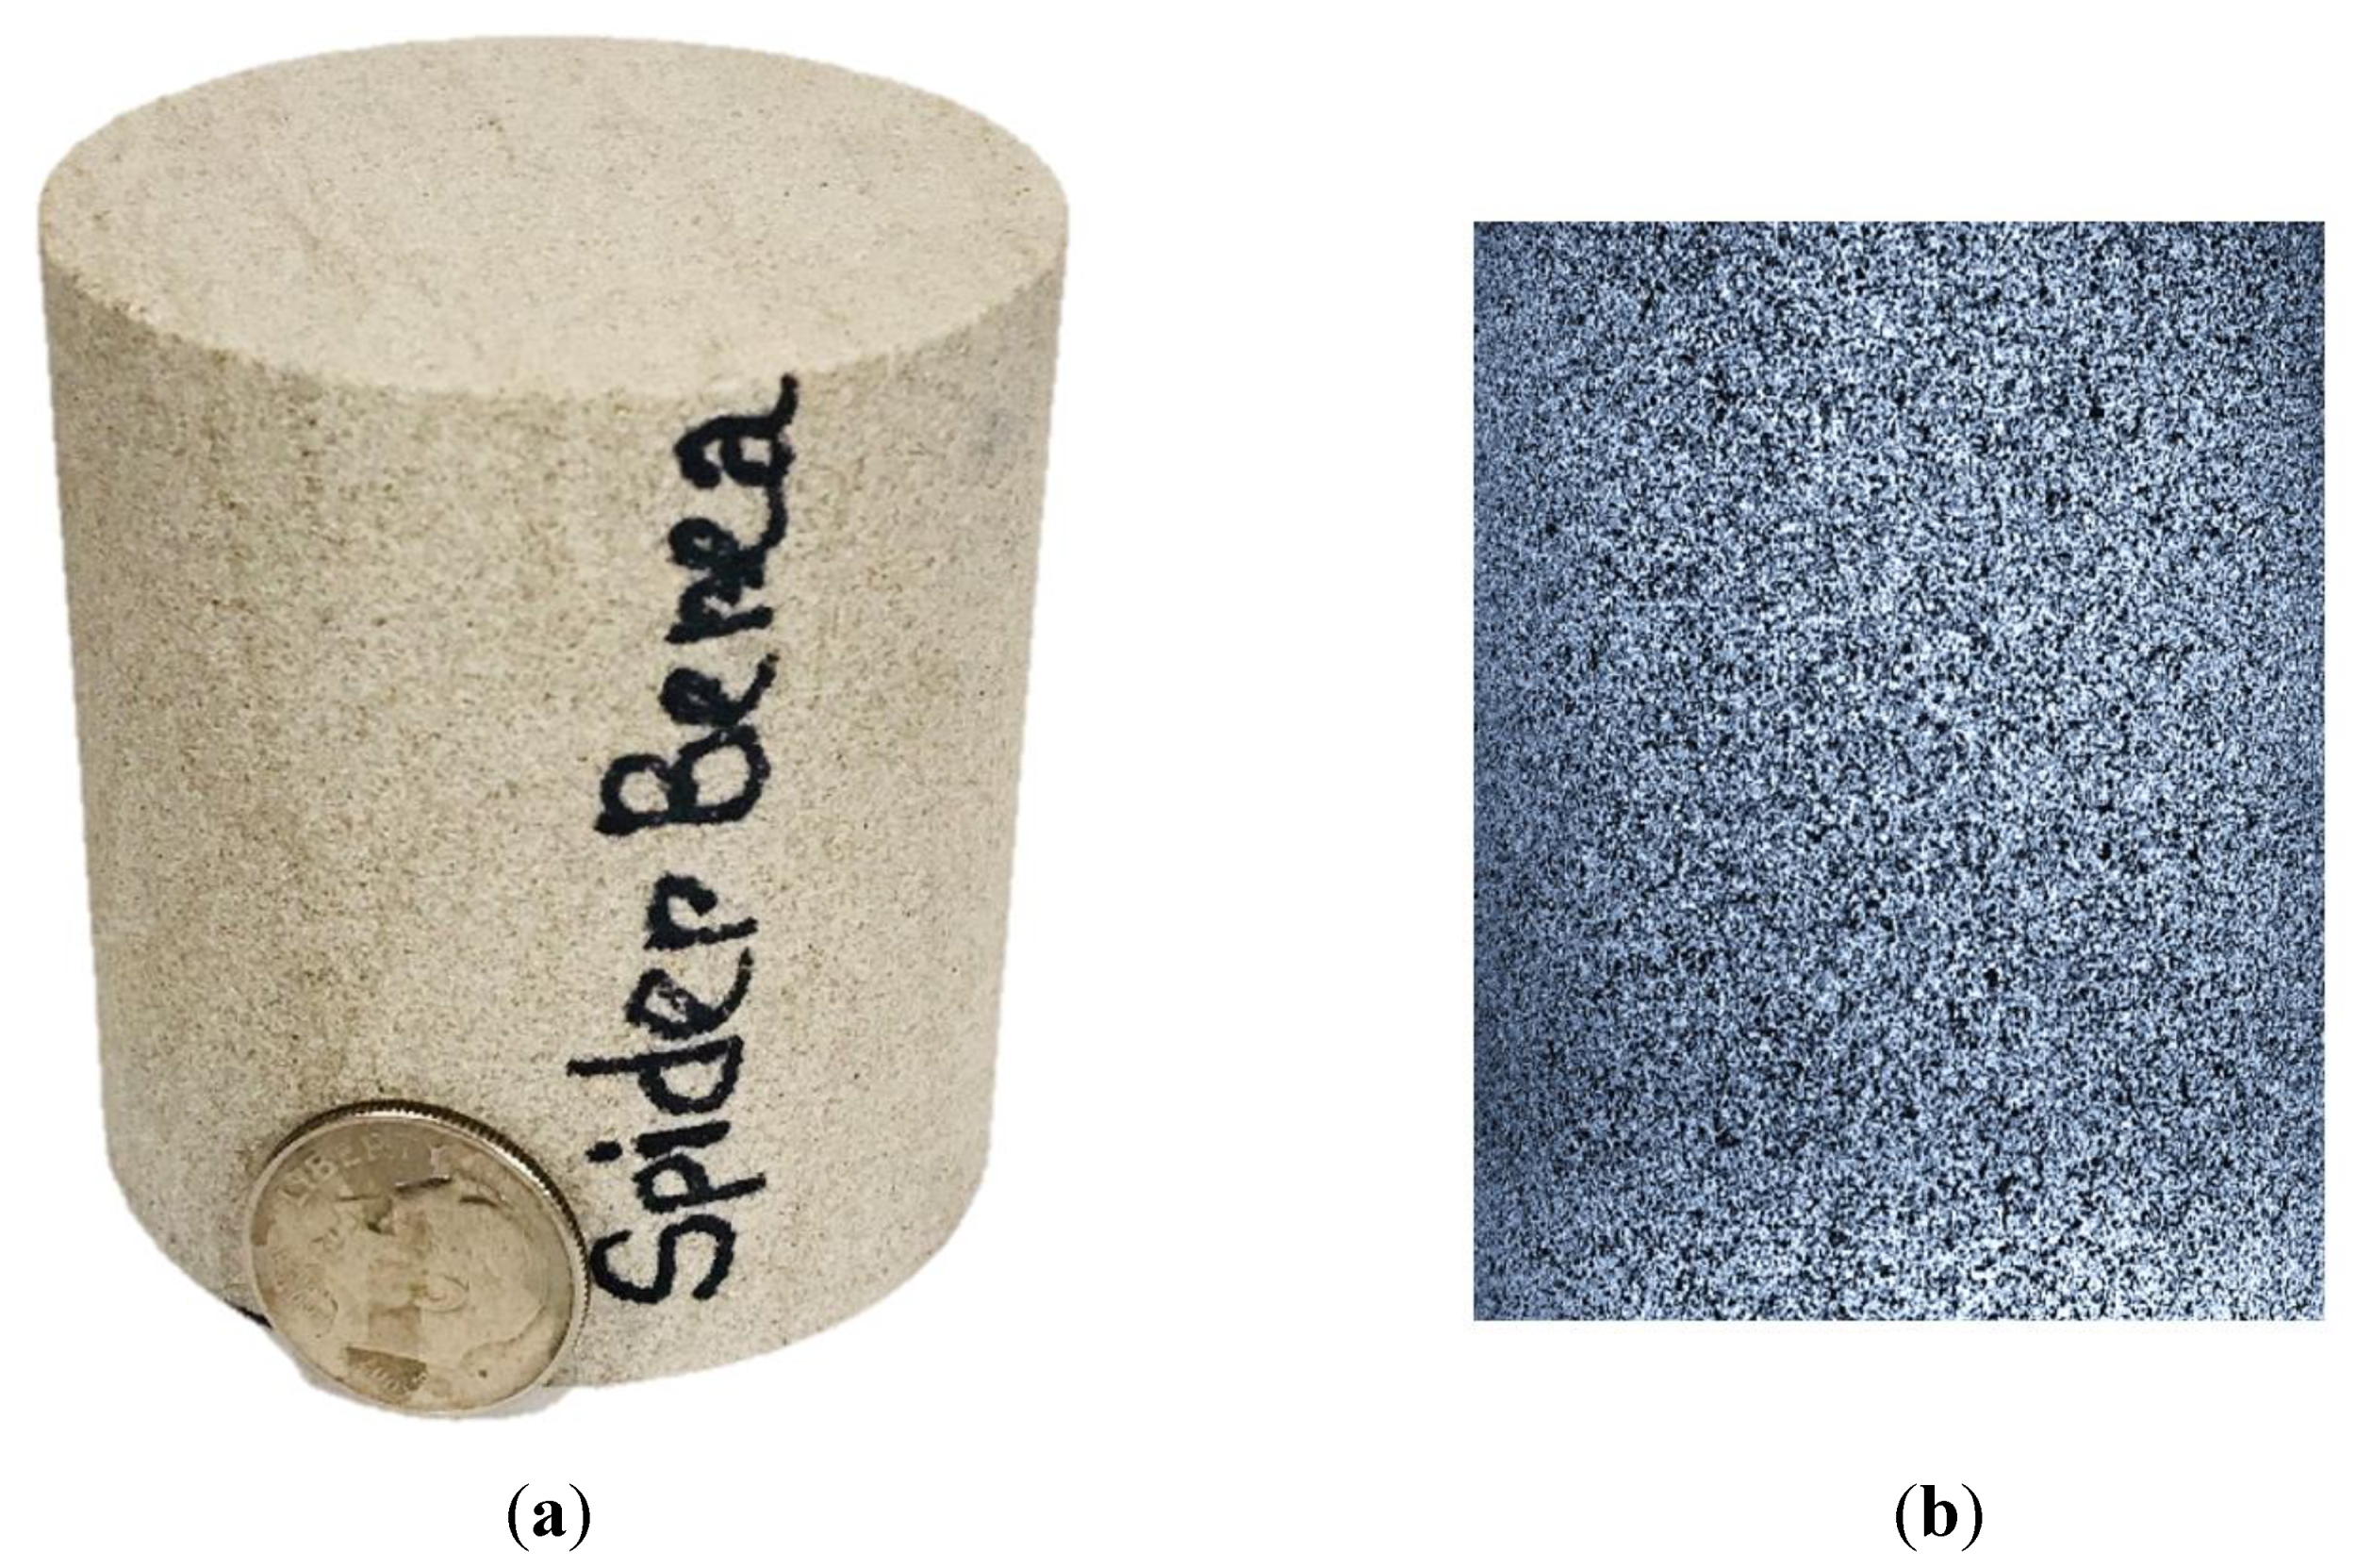
Figure 1. Sample preparation for uniaxial compression testing. (a) Sample for uniaxial compression testing; (b) painted side of the sample.
Energies 13 01441 g001
Figure 2. Specimen for Brazilian testing. (a) Brazilian disc sample; (b) painted Brazilian disc.
Energies 13 01441 g002
Figure 3. Diametrical compression testing with 3D DIC.
Energies 13 01441 g003
Figure 4. Indirect tensile testing.
Energies 13 01441 g004
Figure 5. Model mesh.
Energies 13 01441 g005
Figure 6. Verification of analytical results with numerical solutions. (a) Dimensionless stress on the vertical diameter; (b) Dimensionless stress on the horizontal; (c) Dimensionless stress distribution from analytical solutions; (d) Dimensionless stress distribution from numerical solutions.
Energies 13 01441 g006aEnergies 13 01441 g006b
Figure 7. Load–displacement nature for the Spider Berea sandstone.
Energies 13 01441 g007
Figure 8. Horizontal strain (εxx) distribution: DIC vs. simulation results.
Energies 13 01441 g008
Figure 9. Vertical strain (εyy) distribution: DIC vs. simulation results.
Energies 13 01441 g009
Figure 10. Shear strain (εxy) distribution: DIC vs. simulation results.
Energies 13 01441 g010
Figure 11. Changes in vertical displacement contour (Dy) along the centerline: DIC vs. simulation results.
Energies 13 01441 g011
Figure 12. Changes in vertical displacement (Dy) along the centerline: DIC vs. simulation results.
Energies 13 01441 g012
Figure 13. Changes in horizontal displacement (Dx) along the centerline: DIC vs. simulation results.
Energies 13 01441 g013
Figure 14. Changes in horizontal displacement (Dx) along the centerline: DIC vs. simulation results.
Energies 13 01441 g014
Figure 15. Initiation of cracks in the central region of the sample.
Energies 13 01441 g015
Table 1. Test Specimen Properties [41].
Rock SpecimenFormationPermeability (md)Porosity (%)
Spider Berea sandstoneUpper Devonian120–13019–21
Table 2. Simulation Input Parameters.
ItemsDimensionsYoung’s ModulusPoisson’s Ratio
Rock SpecimenD = 2″, t = 0.6″3.93 GPa0.20
Platen MaterialL = 4″, l = 0.5″, t = 1″200 GPa0.33
Table 3. Coefficient of determination of Dx and Dy between DIC and the simulation value.
LoadCoefficient of Determination, R2 (%)
DxDy
20% of the peak load99.7596.91
40% of the peak load98.9894.92
90% of the peak load97.7794.85