Article

A Mathematical Tightening of Instantaneous Indoor and Outdoor Dry-Bulb and Wet-Bulb Temperature Tolerances

1
Engineering Laboratory of Energy System Conversion and Emission Reduction of Jiangsu Province, School of Energy and Mechanical Engineering, Nanjing Normal University, Nanjing 210042, Jiangsu, China
2
Zhenjiang Institute for Innovation and Development, Nanjing Normal University, Nanjing 210042, Jiangsu, China
*
Author to whom correspondence should be addressed.
Energies 2020, 13(6), 1436; https://doi.org/10.3390/en13061436
Submission received: 10 November 2019 / Revised: 25 February 2020 / Accepted: 16 March 2020 / Published: 19 March 2020

Abstract

:
To reduce the inaccuracy in energy efficiency evaluation, indoor and outdoor dry-bulb and wet-bulb temperature (D&WBT) tolerances in the currently enacted Chinese room air conditioner (RAC) national standard were tightened into narrower intervals in this investigation. Characteristics of cooling capacity (CC) and energy efficiency ratio (EER) changing with D&WBTs were analyzed based on performance tests. AICc (corrected Akaike Information Criterion) was applied to determine the best fitted 3D curve equations of CC and EER to find the intervals of gradient extrema of CC and EER. The corresponding intervals of indoor and outdoor D&WBTs were concluded as the tightened D&WBT tolerances. For illustration, based on the performance tests of 154 working conditions, the instantaneous indoor and outdoor D&WBT tolerances in nominal refrigerating working conditions were respectively tightened from the original ±0.5/±0.3 °C into ±0.3/±0.2 °C (indoor tolerances) and ±0.4/±0.3 °C (outdoor tolerances). EER variation rate thus decreased from 2.11% to 1.03% (indoor) and 2.11% to 1.25% (outdoor).

1. Introduction

In light of the climate objective in the Paris Agreement of limiting global mean temperature increase to well below 2 °C and pursuing efforts to limit it further to 1.5 °C [1], governments worldwide have spared no effort in reducing carbon emissions. Over the past years, electricity consumption across Europe has increased significantly and accounts for around 21% of final energy demand, and the domestic sector alone accounts for almost 25% of final energy consumption and almost 30% of electrical energy demand. One key drive for increasing electrical demand in Europe is the rapid increasing number of household appliances with RAC (room air conditioner) as a major component [2]. In Japan, from 1990 to 2005, the total emissions of CO2 derived from RAC increased by 1.47 Mt-CO2, which corresponds to an increase of 16.5% relative to the 1990 level of emissions [3]. As the third largest market of RAC in the world, the demand in Japan reached 8.35 million units with a 3.1% increase [4], and its residential electricity consumption in 2014 was up to 986 PJ [5]. In the U.S., 1410 billion kW/h of electricity was used by the residential sector in 2016, of which 18% of annual household electricity use was for air conditioning. Residential electricity consumption seasonally rises and falls substantially more than commercial or industrial consumption, largely due to air conditioning use in the summer [6].
As the world’s largest manufacturer and consumer of RACs, the total household electricity consumption in China in 2015 was up to 756.5 billion kW·h; meanwhile, the production output of RACs (room air conditioners) has maintained a high growth rate since 1992, and up to 2015, it reached 142 million units [7]. In 2025, the total baseline electricity consumption of RACs will reach 753 billion kW·h [8]. Furthermore, the electricity consumption of RACs is estimated to account for 30% of the peak summer load in some large and medium-sized cities [9]. It can be expected that the potential of energy saving and greenhouse gas emissions reduction in RACs was much greater than in any other household electrical appliances in China [10]. Among the methods in effect, the standards and regulations issued by governmental or regional administration bureaus play a significant role in guiding and regulating the carbon emissions reduction expectation for RACs.
Besides the fundamental index of EER, more comprehensive and extensive methods for energy conservation have been introduced in RAC energy efficiency evaluation. The effect of the main external factors including room air temperature, defrosting behavior, and user interactions are analyzed on the energy consumption of existing refrigerating appliances in the home for more in depth analysis and a better understanding of the energy consumption of household refrigerators in different regions [11]. Thermodynamic perfectibility has been proposed as a consistent evaluation for the performance of RACs [12,13,14,15]. Life cycle cost analysis is widely applied to assess the impact of standard implementation to energy saving and emissions reduction in Europe [16]. By analyzing the relationship between life cycle reduction and energy efficiency improvement, the significance of energy efficiency evaluation is illustrated [17,18]. The rebound effect was added to find a rise in energy consumption after the implementation of the energy efficiency standard in China [19]. Recently, more scientists have recognized that the occupants’ behavior has a significant effect on the energy consumption of their air-conditioner, and that thermal conditions also affect an occupant’s behavior by influencing their expectation of thermal comfort [20,21,22]. Fundamental studies on the RAC performance national standard have mainly focused on the effectiveness of measurements in the test procedure [23,24] and methods of lowering the uncertainty in theory [25,26,27].
To help the standards and regulations work more efficiently, researchers have carried out great work by applying these methods in standard revision. Additionally, many investigations have found that the stipulation and revision of RAC standards have been proven effective in reducing energy consumption and emissions. A scenario analysis focusing on residential RACs in Japan during 1972–2013 showed that for a reduction of an average lifetime of one year, if the air conditioner energy efficiency limit could be improved by 1.4% from the estimated current efficiency level, CO2 emissions could be reduced by approximately the same amount as for an extension of the average product lifetime of one year [28]. In Europe, the implementation of a minimum energy performance standard based on least life cycle costs could save up to 49 TWh and 20 MtCO2-eq in 2020. In the U.S., standards for RAC at efficiency level 3 revised by using common improvements found were more efficient and would save close to one quad of energy over 30 years and have a consumer NPV (net present value) between 0.14 billion and 1.82 billion dollars [29]. From 2005 to 2025, the energy efficiency standards for RACs in China could help save 1430–2540 billion kW·h of electricity and reduce 908.3–1610.1 Mt CO2 emissions in different scenarios.
Among the electric appliances, China first issued the national standard on energy efficiency grades for RAC in 1989 [30]. With this initial edition, the Chinese national standard on RAC energy efficiency grades experienced three revisions in 2000 [31], 2004 [32], and 2010 [33] after learning from similar regulations made in the USA, European Union, and Japan [34,35,36,37]. Revisions in 2000 and 2004 both focused on upgrading energy efficiency threshold values, while the latest revision (2010) was upgraded by adjusting the previous five-class energy efficiency grading into a three-class energy efficiency grading for both constant and variable speed RACs. This new standard, which is currently in effect, obsoletes RACs with high energy consumption, therefore, it expects to meet the requirements for a global low-carbon city and the energy saving and emissions reduction policy in China [38,39].
However, in the case of the Chinese national standards, RAC energy efficiency evaluation has its roots in the Chinese national RAC performance standard [40]. In the RAC performance test, when D&WBTs (dry-bulb and wet-bulb temperatures) change within their tolerances, respectively or simultaneously, the measured values of both CC (cooling capacity) and EER (energy efficiency ratio) of the unit are affected directly. For a particular unit, when values of CC measured in the performance test with different D&WBTs happened to fall in two ranges of CC classified in the national standard, the values of the EER measured will label this unit with different energy efficiency classes (Table 1 as a reference). Concerning the fact that with the higher precision and accuracy of measurement instruments, D&WBTs in the operation of the RAC performance test can now be kept much more stable than what they were 13 years ago, when the Chinese national RAC performance standard was put into effect and never revised thereafter. The lag in revising the D&WBT tolerances set in the national RAC performance standard forms a sharp contrast to the continual revisions of the national RAC energy efficiency standard and calls for an effective method to reduce the uncertainty in obtaining true values of CC and EER of the test unit.
In the Chinese national standard of RAC performance, D&WBT tolerances refer to the maximum permissible deviations of specified D&WBTs readings in RAC performance tests. For all other tests with the exception of the CC/heat pump test (e.g., defrosting test), the stipulated tolerances for both indoor and outdoor D&WBTs are ±1/±0.5 °C; for instantaneous readings in the CC/heat pump test, they are ±0.5/±0.3 °C; for average readings in the CC/heat pump test, they are ±0.3/±0.2 °C. Since the test results of CC and EER are the basis of energy efficiency evaluation, and changes of both indoor and outdoor D&WBTs directly affect the test results of CC and EER, the method of tightening D&WBT tolerances has been studied from various aspects. A formula for computing the wet-bulb temperature inversely from the relative humidity (or dewpoint temperature) and the air temperature has been proposed [41]. A method of non-linear classification of D&WBT tolerances [42] and an algorithm for correcting D&WBT tolerances using regression equations and analytic hierarchy process (AHP) [43] have also been proposed. In the successive study of weight analysis by using the core area and span ratio analysis [44] for tolerance correction, it was found that both indoor and outdoor D&WBT tolerances should be studied respectively with due consideration.

2. Principles of Tightening Instantaneous Indoor and Outdoor Dry-Bulb and Wet-Bulb Temperature Tolerances

In GB/T 7725-2004 (Chinese national standard for room air conditioners) and GB/T 17758-2010 (Chinese national standard for unitary air conditioners), indoor and outdoor D&WBT tolerances are specified specifically for each nominal working condition of constant and variable speed RAC. In particular, for variable speed RAC, nominal working conditions are more specifically defined with different running hours and operation load. For a precise energy efficiency evaluation, either indoor or outdoor D&WBT tolerances are expected to be listed corresponding to each working condition.
The mathematical method proposed in this investigation can be applied to tighten indoor and outdoor D&WBT tolerances for each working condition of both constant and variable speed RAC in regular performance tests. This process consists of RAC unit performance tests, data collection, mathematical calculation, and uncertainty evaluation. First, CC and PI (power input) are measured with indoor and outdoor D&WBTs changing within the stipulated tolerances of ±1/±0.5 °C, since even when D&WBTs change within the tolerances, different working conditions of a RAC unit in testing results in different EER, and consequently leads to a discrepancy in energy efficiency evaluation. By using the air enthalpy method in RAC performance testing, finite discrete experimental data of CC and EER under specific working conditions can be obtained when indoor/outdoor D&WBTs remain constant and outdoor/indoor D&WBTs change within ±1/±0.5 °C.
Second, based on the performance data, a series of mathematical calculation methods can be employed to tighten the instantaneous D&WBT tolerances. Characteristics of the changes of CC and EER as the D&WBTs change within the tolerances have been found. When analyzing and processing the discrete experimental data collected in a limited sample number, the AIC (Akaike information criterion) has frequently been applied in curve fitting and data prediction [45]. As a comprehensive index, the AIC evaluates the equations fitted by processing the sample size (n), the number of parameters (K), and the RSS (residual sum of squares), as is worked in Equation (1). The minimum AIC score is considered as the best evaluation criteria. When the finite sample size is comparatively small (n/K << 40), the AICc score (the corrected AIC score) can be employed, as in Equation (2) [46]. AICc has been widely applied in fitting curves of petrol price vs. macro-economy, energy consumption vs. year to their experimental data and CO2 emissions vs. energy consumption [47,48,49] and proves effective, but is not yet popular in processing experimental data in RAC unit tests. In this investigation, AICc was employed to achieve the best curve fitting and data prediction for CC and EER, respectively.
AIC = n × ln ( RSS n ) + 2 ( K + 1 )
AICc = AIC + 2 ( K + 1 ) ( K + 2 ) n K 2
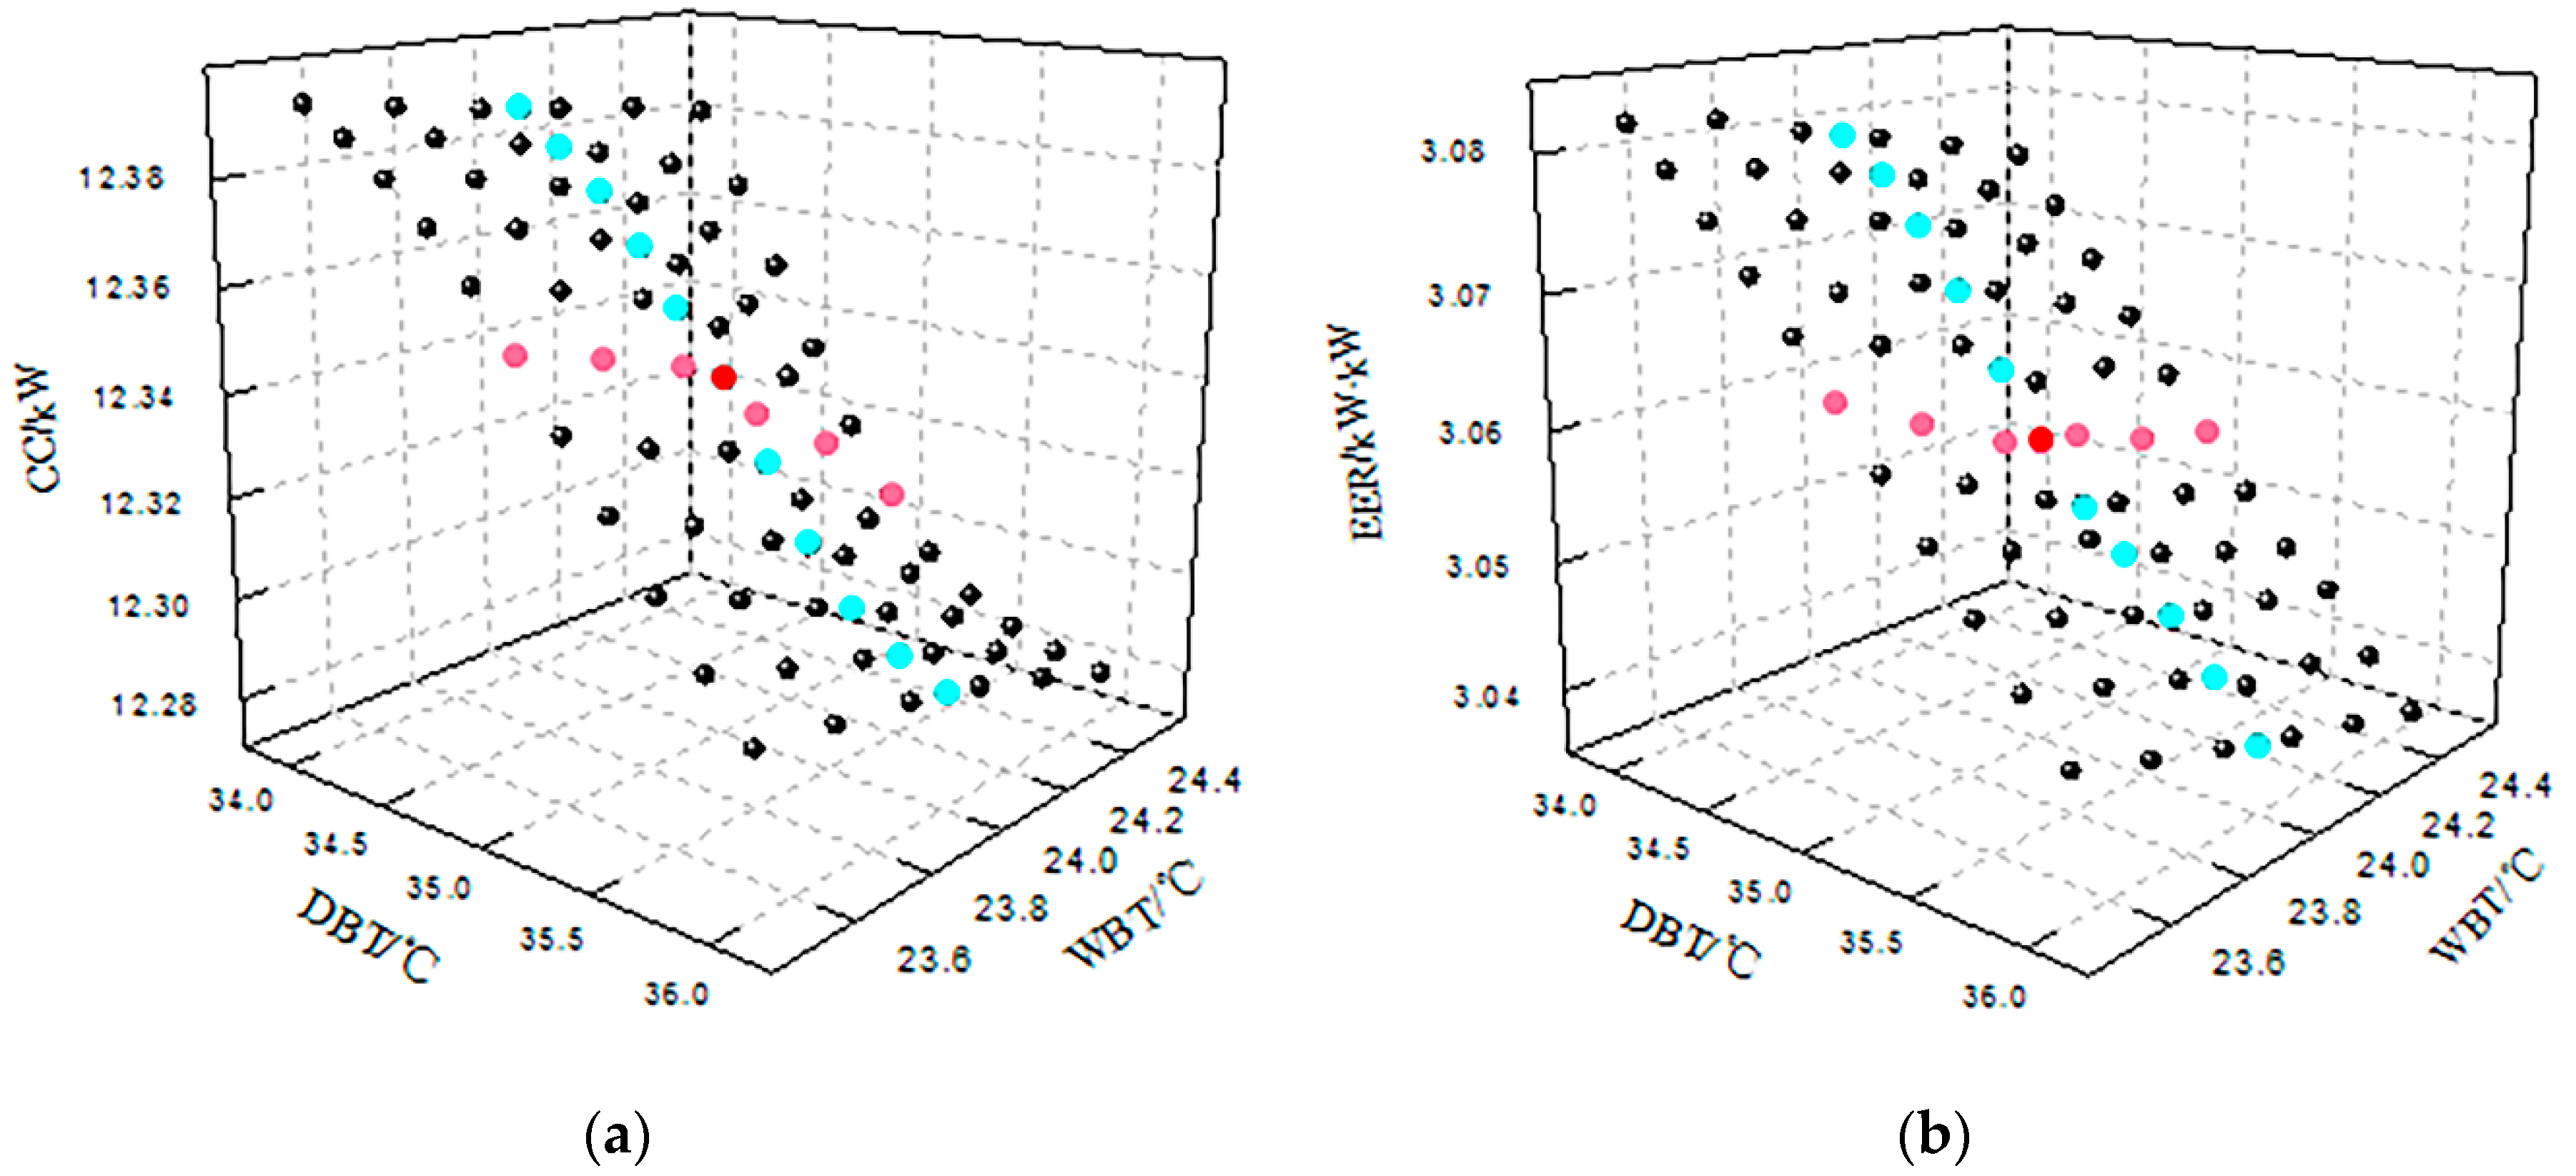
Subsequently, considering the fact that the two independent variables of dry-bulb temperature and wet-bulb temperatures affect CC and EER simultaneously, 3D surfaces, instead of curves, that indicate the changes of CC and EER can be fitted respectively. Proper equation models can be chosen on the basis of the changing characteristics of CC and EER and applied in surface fitting. Typical models and their properties are listed in 
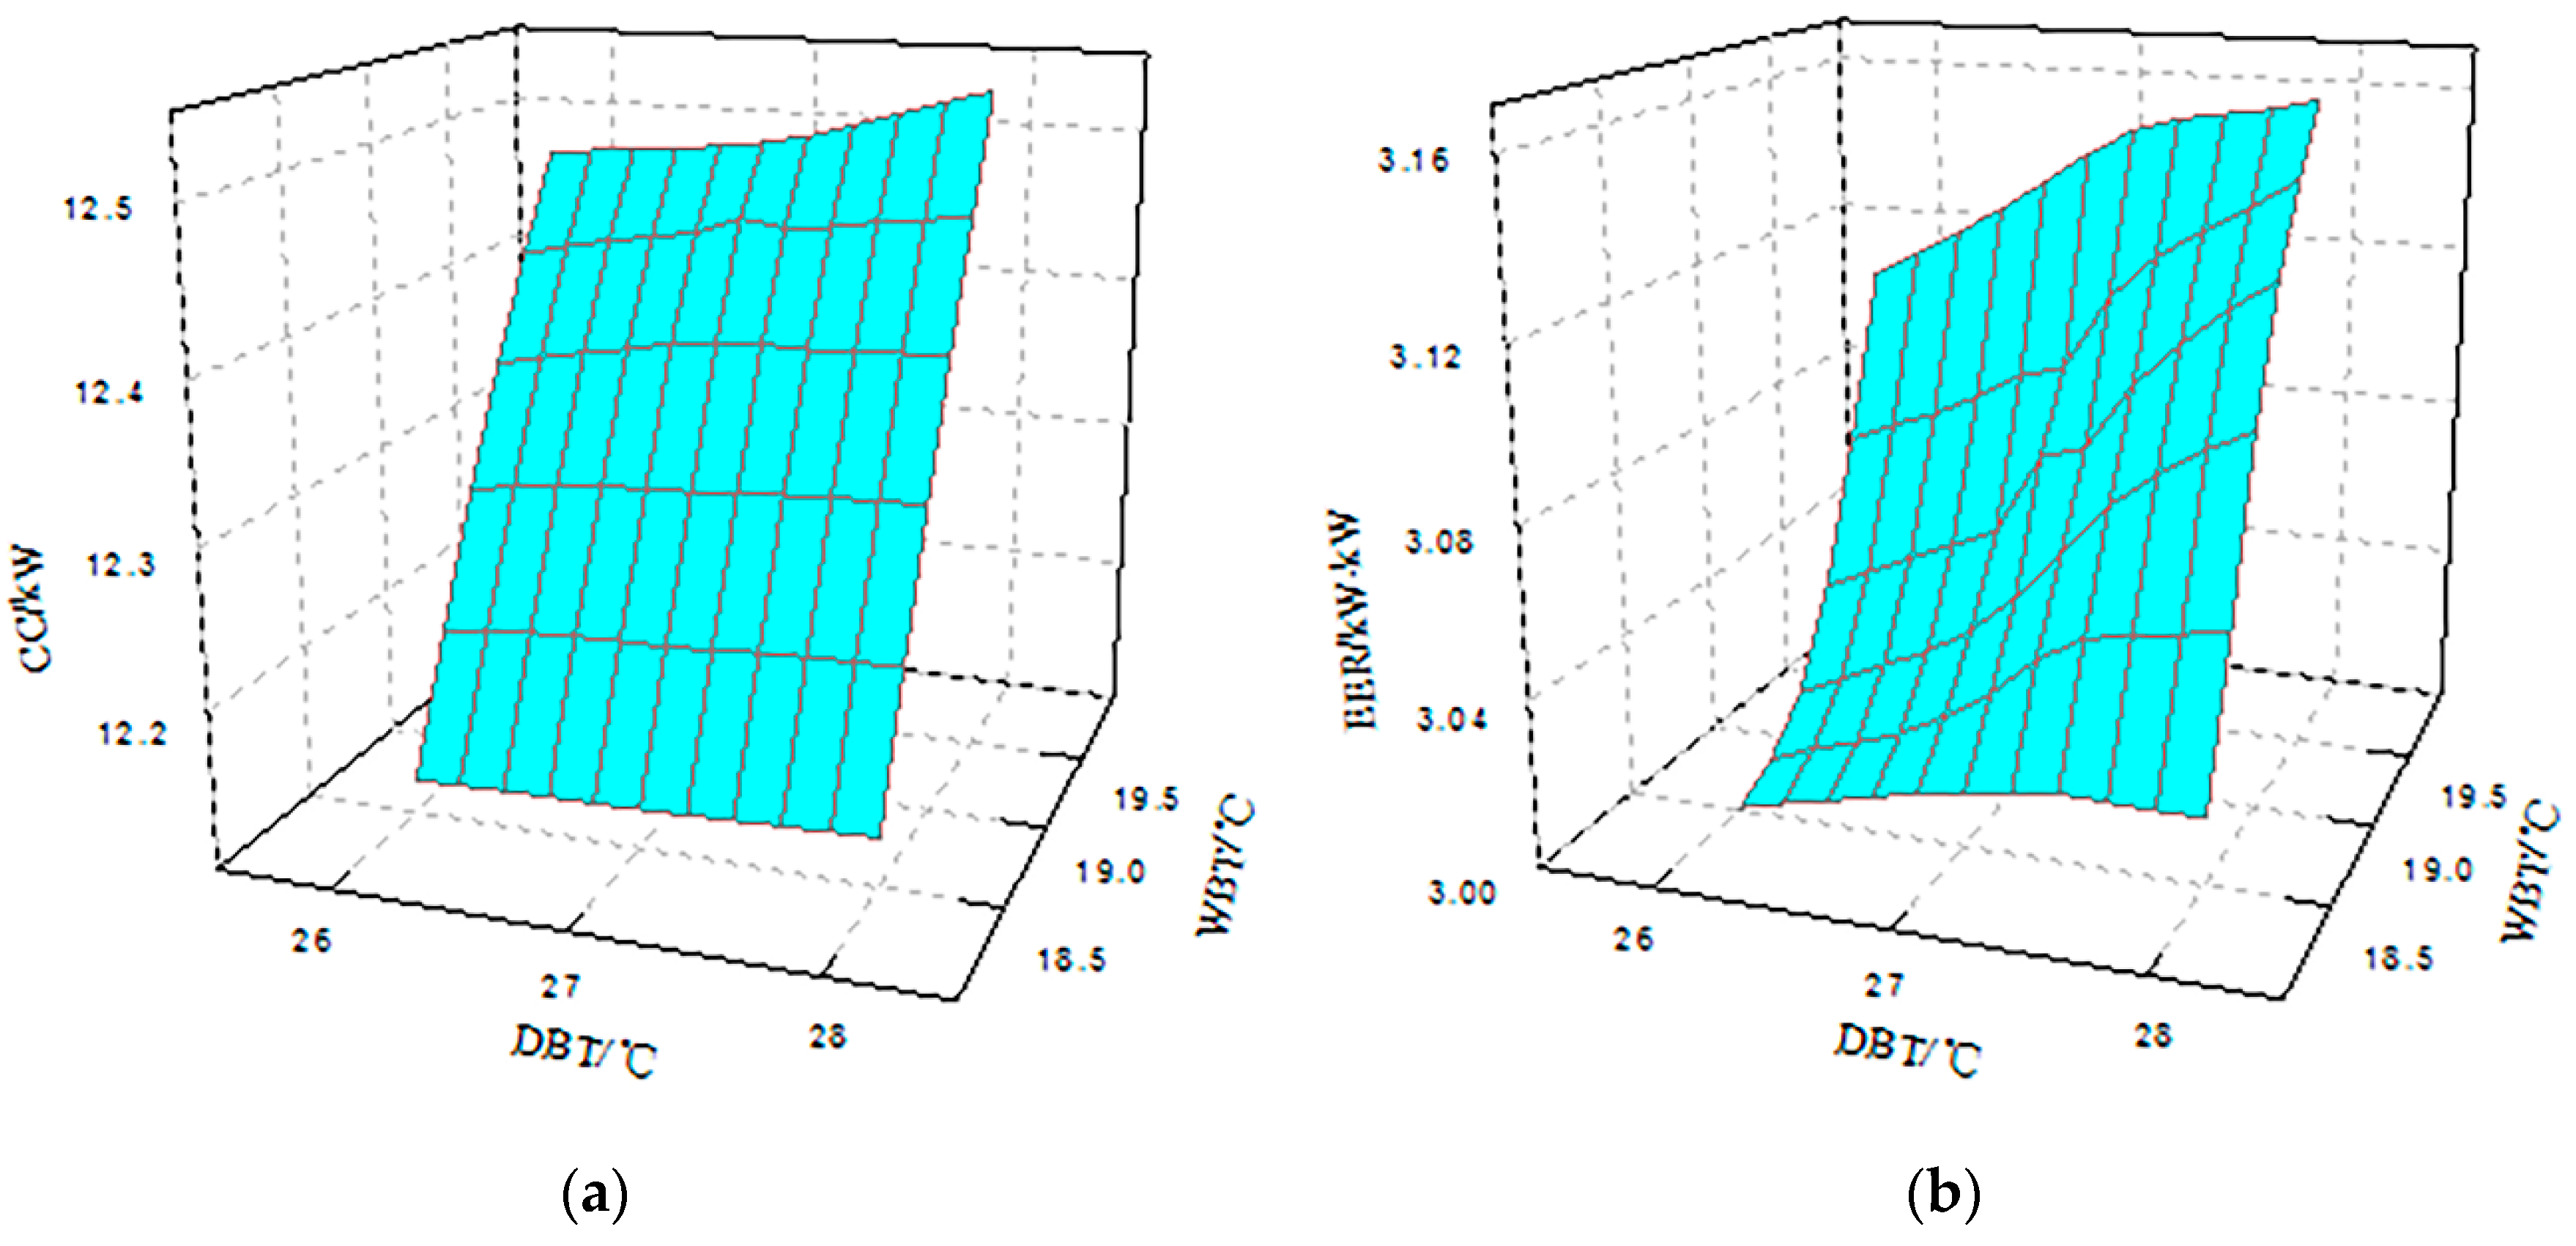
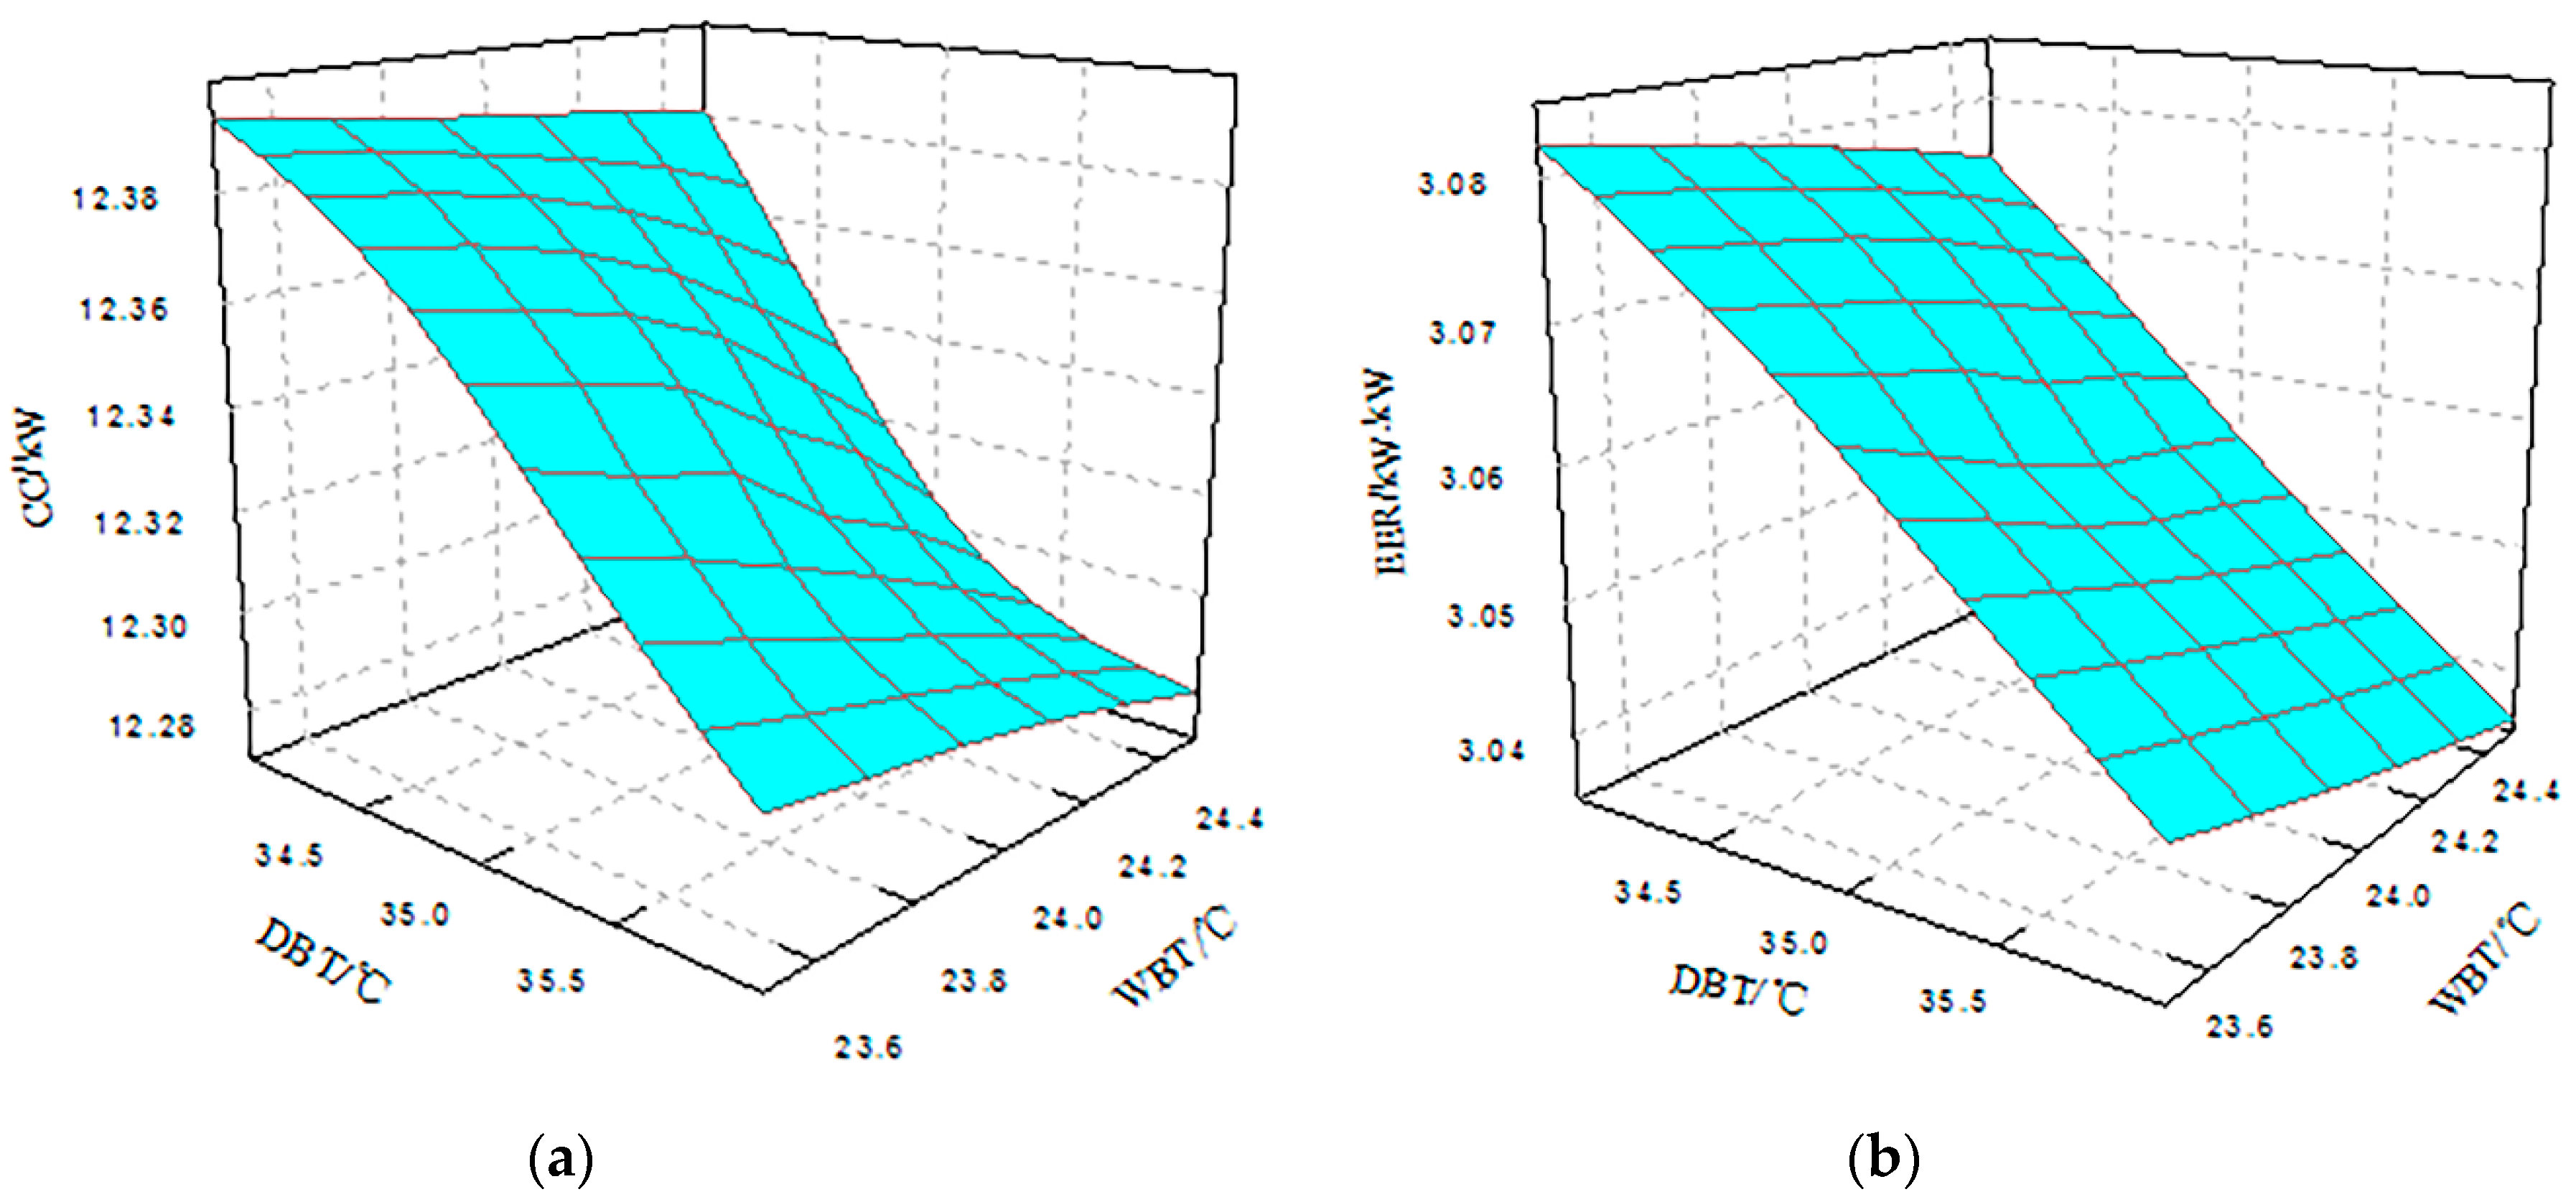
Appendix A. Using AICc, the best suitable equations are thus determined. Since non-uniform variation occurs in both CC and EER changing with indoor/outdoor D&WBTs [50], the magnitudes of variation gradients of both CC and EER can be worked out in these most suitable equations. Furthermore, the narrowest intervals of CC and EER covering all extremal magnitudes of CC and EER gradients can be worked out, respectively, and are named as extremal intervals. In these two extremal intervals, the variation rates of CC and EER reach the maximum, respectively. Considering the compound effect of CC and EER on tightening the D&WBT tolerances, the union of D&WBTs where both CC and EER have the maximum variation rates can be considered the tightened tolerances. When the D&WBTs change within the tightened tolerances, CC and EER both fall in the intervals of gradient extrema. These tightened tolerances can make the measured CC and EER reflect their true values more convincingly, and eventually, a more accurate evaluation of energy efficiency can be realized.
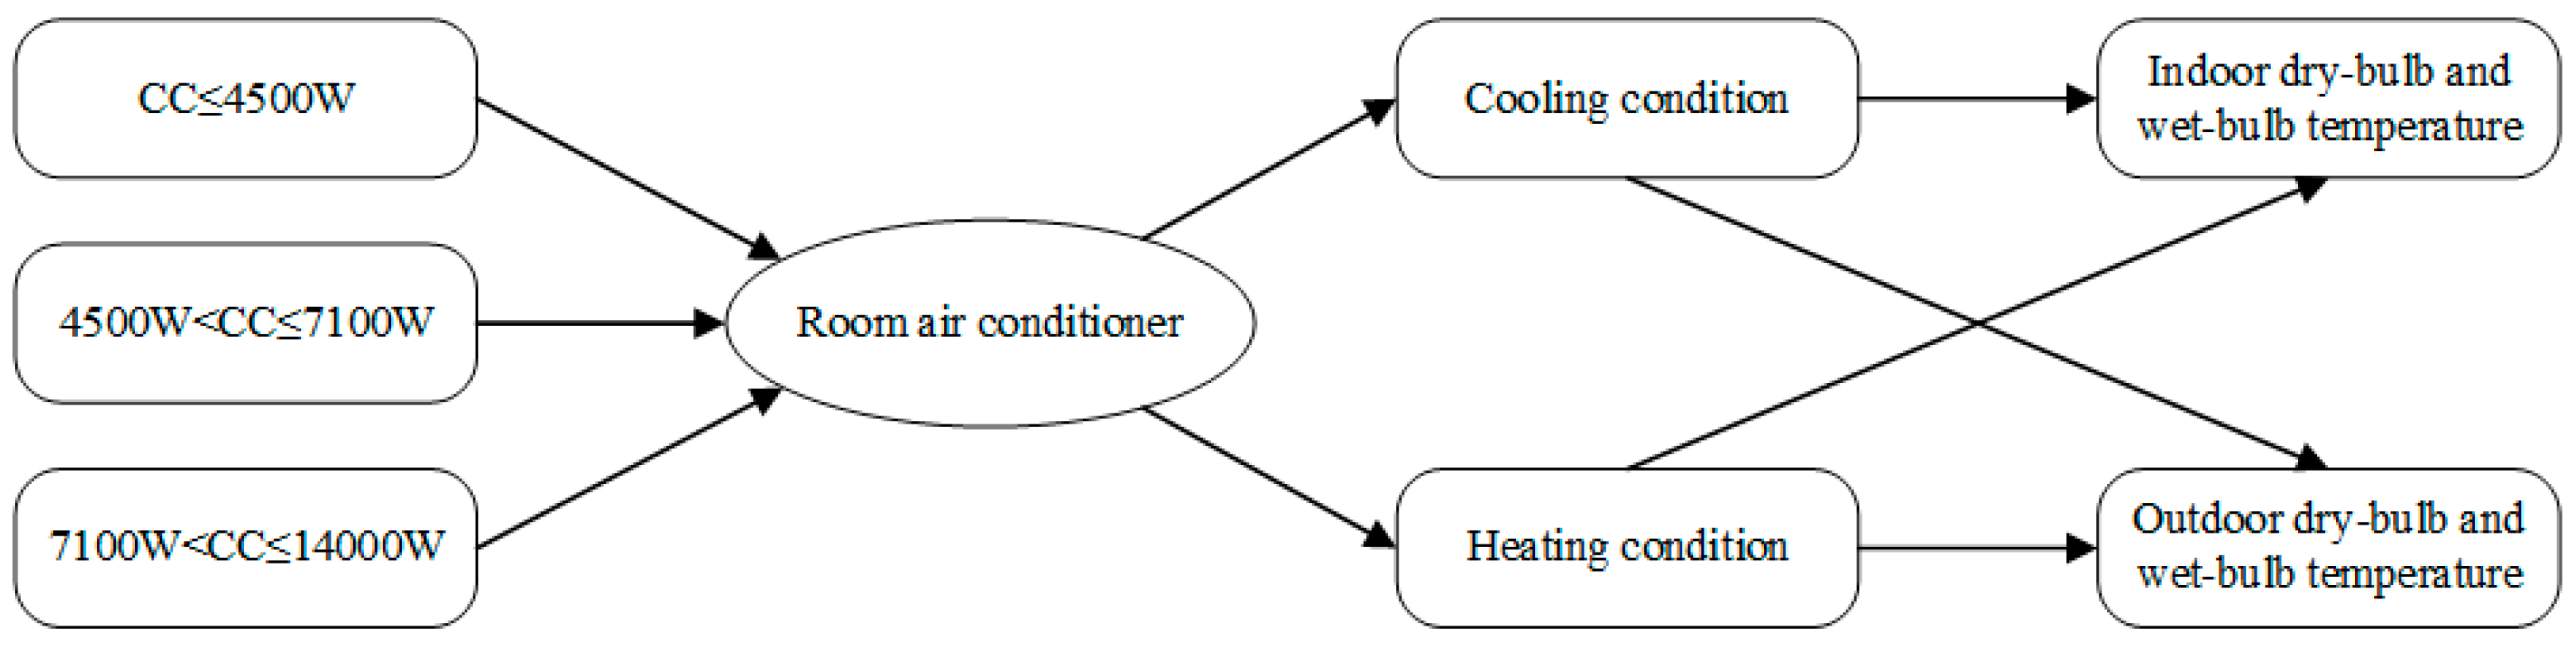
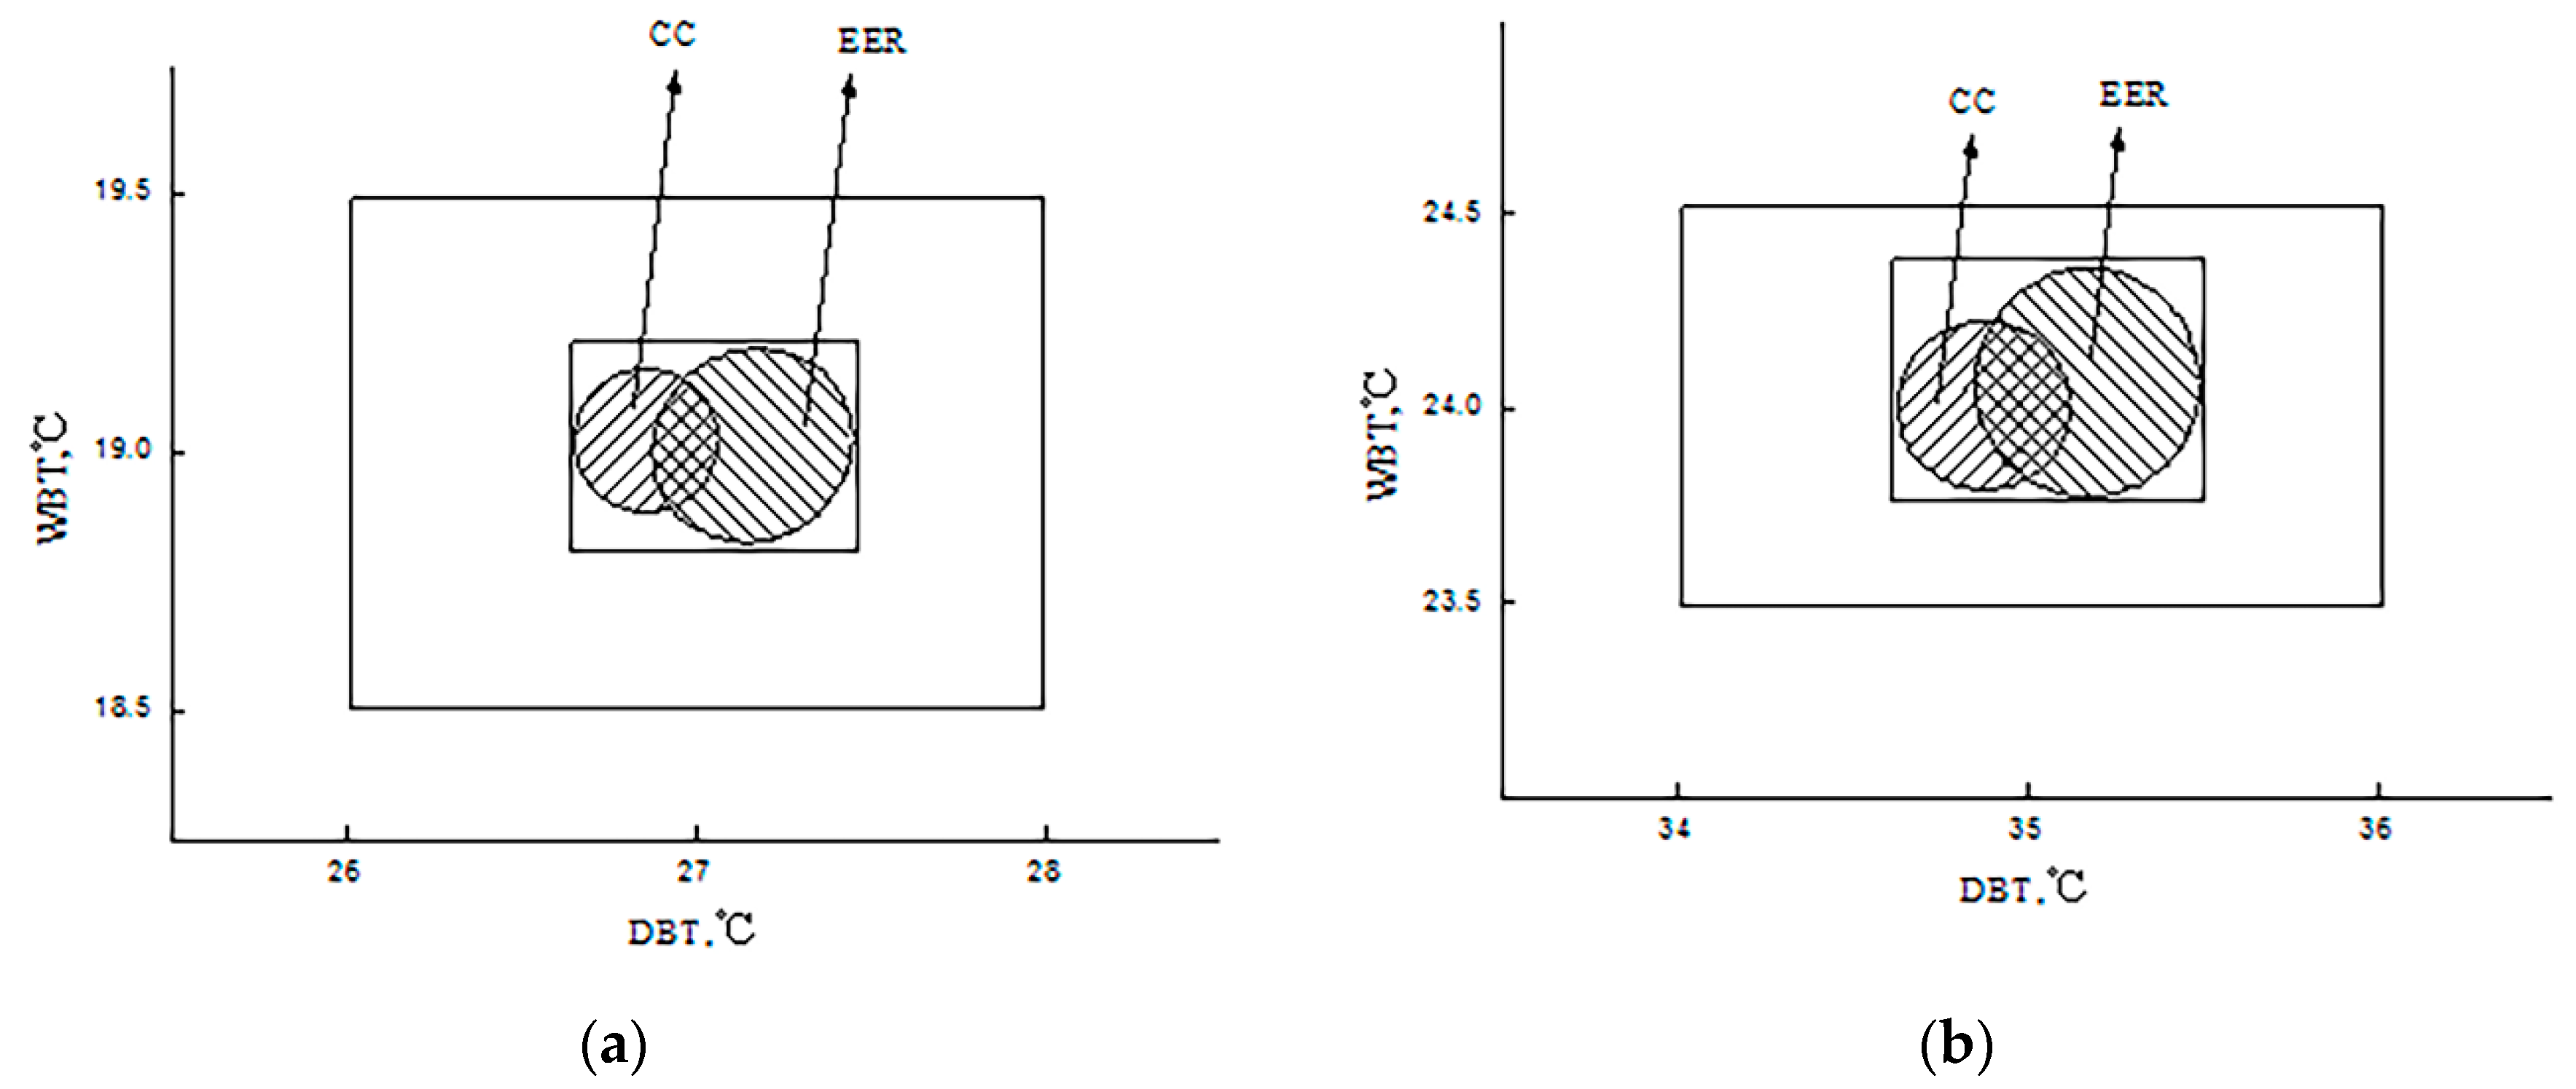
According to the theory proposed above, constant speed RACs, for example, indoor and outdoor D&WBT tolerances under refrigerating and heating working conditions, can be classified in 12 conditions, as shown in Figure 1, which presents in detail the tightening instantaneous indoor and outdoor D&WBT tolerances of the sample unit (7100 W < CC ≤ 14,000 W) under the refrigerating working condition.

3. Case Study of Tightening D&WBT Tolerances

To make the procedure of tolerance-tightening clearer, instantaneous indoor and outdoor D&WBT tolerances under the refrigerating working condition are described in detail below.

3.1. Performance Experiment Setup and Testing

A split type of a 12,500 W floor-standing room air conditioner of a well-known Chinese domestic brand (rated power at 12 kW and EER at 3.32 kW·kW−1) was chosen as the sample unit. R22, as the refrigerant fluid, was charged as per the requirement on the nameplate. Using the air enthalpy method, the performance tests were operated on this unit in an environmental lab accredited by the Chinese State Quality Supervision and Inspection Center on Compressors and Refrigerating Equipment (SQSICCRE). The test facility includes indoor and outdoor environment test rooms, the RAC unit, and the measuring instruments needed in the test. All the instruments and meters are calibrated in Chinese SQSICCRE and the accuracy meets the requirements of the national standard in China. Capacity of the test facility can meet the requirements of the sample unit performance test, and the precision of the testing facility is less than 2% [51]. A YOKOGAWA PT100 Platinum resistance temperature sensor (type RS17-3NNNN-TB-L0120) with a measurement range of 0~70 °C, precision at ±0.1 °C, and uncertainty of error of indication at 0.041 °C was used.
In order to obtain comprehensive and complete (as far as possible) performance data for calculating both indoor and outdoor D&WBT tolerances, the sample RAC unit performance tests consisted of two sections. Section A: when studying indoor D&WBT tolerances, outdoor D&WBTs were kept consistent at 35/24 °C, respectively with the widest variation of ±0.02 °C, and the widest variation of indoor D&WBTs was kept within ±1.0/±0.5 °C, respectively. Section B: when studying outdoor D&WBT tolerances, indoor D&WBTs were kept consistent at 27/19 °C, respectively, with the widest variation of ±0.02 °C, and the widest variation of outdoor D&WBTs was kept within ±1.0/±0.5 °C, respectively. Meanwhile, in both sections, working conditions were set with both D&WBTs changing with an equal step of 0.2 °C within ±1.0/±0.5 °C. Nominal working conditions are included in the list of working conditions. The working conditions of the indoor and outdoor D&WBTs in section A are listed in Table 2, and those in section B are listed in Table 3.
According to GB/T 7725-2004, when the performance test is proceeded with an expected stable working environment, the performance data are collected every seven seconds for 30 minutes. Automatically, the performance data collected fall into seven groups in chronological order and each group contributes its mean value as the data for record. Thus, the average of these seven records is considered as the final measured results of the performance data.

3.2. Analysis of the Performance Test Results

The measured results of CC and EER when outdoor or indoor D&WBTs are kept consistent at 35/24 °C (Section A) or 27/19 °C (Section B) are shown in Figure 2 and Figure 3. In both Sections A and B, when the D&WBT tolerances were tightened, the variation ranges of both CC and EER also narrowed down. ∆CC and ∆EER are calculated to clarify the changes of CC and EER before and after D&WBT tolerance tightening, as in Equations (3) and (4).
Δ C C max = C C max C C min 1 n i = 1 n C C T
Δ E E R max = E E R max E E R min 1 n i = 1 n E E R T
When the D&WBTs changed simultaneously within the original tolerances of ±0.5/±0.3 °C, ∆CCmax1 and ∆EERmax1 were calculated as 2.95% and 2.11%, respectively. When they changed simultaneously within the tightened D&WBT tolerances, ∆CCmax and ∆EERmax were expected to be lower than those before tightening.

4. Results and Discussion of the Case Study

4.1. Curve-Fitting and Equation-Determination for Cooling Capacity and Energy Efficiency Ratio

Based on the experimental discretization results, the curves for CC and EER in Sections A and B were respectively fitted, as in Figure 4 and Figure 5.
Figure 4 shows that CC and EER both increased gradually as the indoor D&WBTs increased within the tolerances, and the gradients of both the CC and EER variation narrowed down after they widened in the first place. Figure 5 shows that CC and EER both decrease gradually as the outdoor D&WBTs increase within the tolerances, and the gradients of both CC and EER variation showed the same tendency. According to the characteristics of CC and EER surfaces in two sections, eight equation models (ExtremeCum, GaussCum, Parabola2D, Rational2D, LogisticCum, Poly2D, Gauss2D, Lorentz2D) were chosen and applied in surface fitting.
Learning from Table 4, which lists the values of n, K, RSS, AICc, and residual in these eight equation models, equations with the minimum AICc values were found and helped determine the most appropriate equations for surface-fitting. Among those eight equation models, ExtremeCum and GaussCum were found to be the best and were applied in fitting CC and EER surfaces in Section A, as in Equations (5) and (6); ExtremeCum and Lorentz2D were applied in fitting the surfaces in Section B, as in Equations (7) and (8). The scores of the AICc and MAD (mean average differences) in these equations all reached the minimum. The mean fitted residuals of both CC and EER in the model were far less than 1%, which meets the requirement of error controlling. The mathematical models can thus be considered as appropriate.
W = z 1 + A 1 exp { exp [ D B T B 1 C 1 ] } + D 1 exp { exp [ W B T E 1 F 1 ] } + G 1 exp { exp [ D B T B 1 C 1 ] exp [ W B T E 1 F 1 ] }  
E = E 01 + 0.25 a [ 1 + erf ( x b 2 c ) ] [ 1 + erf ( y d 2 e ) ]  
W = z 2 + A 2 exp { exp [ D B T B 2 C 2 ] } + D 2 exp { exp [ W B T E 2 F 2 ] } + G 1 exp { exp [ D B T B 2 C 2 ] exp [ W B T E 2 F 2 ] }  
E = E 02 + H 2 [ 1 + ( x x c w 1 ) 2 ] [ 1 + ( x y c w 2 ) 2 ]
The partial derivatives of Equations (5)–(8) with respect to the dry-bulb temperature and wet-bulb temperature were worked out respectively. Thus, the gradients of CC and EER changing with D&WBTs were learnt: in Section A, the gradients of CC can be worked out with Equations (9) and (10) and the gradients of EER with Equations (11) and (12); in Section B, the gradients of CC can be worked out with Equations (13) and (14), and the gradients of EER with Equations (15) and (16). Parameters in all these equations and their standard errors are listed in Table 5.
grad D B T w , i n = 1 C 1 exp ( D B T B 1 C 1 ) { A 1 exp [ exp ( D B T B 1 C 1 ) ] + G 1 exp [ exp ( D B T B 1 C 1 ) exp ( W B T E 1 F 1 ) ] }
grad W B T w , i n = 1 F 1 exp ( W B T E 1 F 1 ) { D 1 exp [ exp ( W B T E 1 F 1 ) ] + G 1 exp [ exp ( D B T B 1 C 1 ) exp ( W B T E 1 F 1 ) ] }
grad D B T E , i n = a ( D B T d ) 2 c 2 × exp ( D B T b c ) 2 × [ 1 + W B T exp ( y b e ) 2 d y ]
grad W B T E , i n = a ( W B T d ) 2 e 2 × exp ( W B T b e ) 2 × [ 1 + D B T exp ( x b c ) 2 d x ]
grad D B T W , o u t = 1 C 2 exp ( D B T B 2 C 2 ) × { A 2 exp [ exp ( D B T B 2 C 2 ) ] + G 2 exp [ exp ( D B T B 2 C 2 ) exp ( W B T E 2 F 2 ) ] }
grad W B T W , out = 1 F 2 exp ( W B T E 2 F 2 ) { D 2 exp [ exp ( W B T E 2 F 2 ) ] + G 2 exp [ exp ( D B T B 2 C 2 ) exp ( W B T E 2 F 2 ) ] }
grad D B T E , o u t = 2 H 2 x ( x x c ) w 1 2 [ 1 + ( y y c w 2 ) 2 ] 2 [ 1 + ( x x c w 1 ) 2 ] 2
grad W B T E , o u t = 2 H 2 y ( y y c ) w 2 2 [ 1 + ( y y c w 2 ) 2 ] 2 [ 1 + ( x x c w 1 ) 2 ] 2

4.2. Calculation of Extrema Intervals of CC and EER

In the working conditions listed in Table 2 and Table 3, the controlling varieties method was employed to work out the extremal magnitudes of gradients in both curves of CC and EER. Furthermore, the extrema intervals of the CC/EER gradient were calculated. In Section A, the extrema interval of the CC gradient fell in the circle with the diameter of the dry-bulb temperature changing from 27.05 to 27.35 °C and wet-bulb temperature from 19.18 to 18.86 °C, respectively; and the extrema interval of the EER gradient fell in the circle with the diameter of dry-bulb temperature changing from 27.03 to 26.78 °C and wet-bulb temperature from 18.94 to 19.14 °C. In Section B, the extrema interval of CC gradient fell in the circle with the diameter of the dry-bulb temperature changing from 35.03 to 35.45 °C and the wet-bulb temperature from 23.89 to 24.28 °C, respectively. The extrema interval of the EER gradient fell in the circle with the diameter of the dry-bulb temperature changing from 35.09 to 34.65 °C and the wet-bulb temperature from 24.91 to 24.08 °C. As is shown in Figure 6 (a for Section A and b for Section B), the intervals of the dry-bulb temperature and wet-bulb temperature in both cases only partly overlapped, which also numerically illustrates that the gradients of CC and EER were not exactly in accord with each other.
It was found that increasing rates of CC and EER gradients were positive when the D&WBTs were below the minimal extremum, (that is, the variation rates of CC and EER both increased). The increasing rates of CC and EER were zero when the D&WBTs changed within the extrema intervals, (that is, the variation rates of CC and EER both remained consistent). The increasing rates of CC and EER were negative when the D&WBTs were beyond the maximal extremum, (that is, variation rates of CC and EER both decreased). It can be concluded that the variation rates of CC and EER both reached the peak when the D&WBTs changed within their extrema intervals. Therefore, in the RAC unit performance test, tests with D&WBTs changing within the extrema intervals should be more intense.

4.3. The Tightened Results of Indoor and Outdoor D&WBT Tolerances

Considering the feasibility, the tightened tolerances of D&WBTs were defined as the rectangular worked out with the minimal and maximal values of D&WBTs in the union of gradient extrema intervals of CC and EER. The tightened indoor dry-bulb temperature tolerance was calculated as 26.7~27.3 °C and the wet-bulb temperature was 18.8~19.2 °C, respectively. In the tightened tolerances, ∆CCmax and ∆EERmax were yielded as 1.40% and 1.03%. The tightened outdoor dry-bulb temperature tolerances were calculated as 26.6~27.4 °C and the wet-bulb temperature was 18.7~19.3 °C, respectively, when ∆CCmax and ∆EERmax were 1.62% and 1.25%, respectively. In the Chinese national standard currently in effect, both indoor and outdoor D&WBT tolerances specified for cooling capacity test and heat pump test were 26.5~27.5 °C and 18.7~19.3 °C, respectively, when ∆CCmax and ∆EERmax were 2.95% and 2.11%. Comparisons of indoor and outdoor D&WBT tolerances before and after tightening and the corresponding ∆CCmax and ∆EERmax are shown in Table 6.
With the nominal working condition at the center, the indoor and outdoor D&WBT tolerances were narrowed into ±0.3/±0.2 °C and ±0.4/±0.3 °C. The lowering of ∆CCmax and ∆EERmax indicates the possibility of the measured CC in the nominal working condition being convincingly considered as has been improved by 18%, and that of the measured EER by 48%.
Meanwhile, the investigation results showed that the indoor and outdoor D&WBTs did not necessarily have to change within the same tolerances, as they are required to in the current Chinese national standard. Considering the fact that the indoor D&WBTs affect the inlet air enthalpy values of the RAC directly, they affect the CC and EER test results more than that of the outdoor D&WBTs. It is safe to conclude that the pattern of narrower indoor D&WBT tolerances accompanying comparatively wider outdoor D&WBT tolerances can be more appropriate in determining CC and EER test results for energy efficiency evaluation.

4.4. Analysis of Uncertainty in CC/EER Measurement

By applying the calculation method for uncertainty [52], the measurement accuracy and the standard uncertainty for pressure, temperature, and power input are listed in Table 7. The enthalpy uncertainty is determined by D&WBTs and atmospheric pressure, thus the enthalpy uncertainties of the inlet air and outlet air at the indoor side can be calculated using Equations (17) and (18):
u 2 ( h a 1 ) = ( φ t d 1 u ( t d 1 ) ) 2 + ( φ t w 1 u ( t w 1 ) ) 2 + ( φ p 0 u ( p 0 ) ) 2
u 2 ( h a 2 ) = ( φ t d 2 u ( t d 2 ) ) 2 + ( φ t w 2 u ( t w 2 ) ) 2 + ( φ p 0 u ( p 0 ) ) 2
Thus, the enthalpy uncertainties of the inlet air and outlet air were 32.4 and 31.2, respectively.
The Type A evaluation, Type B evaluation, and combined standard uncertainty were calculated and are listed in Table 8.

5. Conclusions

Theoretically speaking, when the D&WBT tolerances are narrowed, the variation rates of CC and EER in the performance tests can be effectively decreased, and the reliability of the energy efficiency class determination can be more convincing. To accommodate the development of a global low-carbon economy, the continuous upgrading of the threshold values of RAC energy efficiency grades raise the requirements in RAC performance. Correspondingly, RAC performance test reliability is in need of improvement to avoid possible mis-evaluation of energy efficiency caused by measurements as much as possible.
Technically speaking, the instantaneous indoor and outdoor D&WBT tolerances proposed herein aim at avoiding “bad money drives out goo” in the RAC market in China. Current tolerances leave a generous range for CC and EER measurement. With the measuring instruments of greatly improved accuracy and precision than a decade ago, when the currently enacted national RAC performance standard was put into effect, the D&WBTs in performance test operation can be manipulated to fall into the energy efficiency class expected. For instance, by controlling the D&WBTs or experimental coincident, a RAC unit that actually fails to reach Class 3 can be labeled as Class 3, and a unit actually qualified for Class 3 can be determined as unqualified. Out of financial concern, products of the quality “in the margin” may gradually drive out those truly qualified units, and units of higher energy-consuming may gradually drive out those comparatively energy-saving units. RAC of energy efficiency Class 3 is of more significance in energy-saving in China because RAC units of low energy efficiency, currently being more popular in the household RAC market, have turned out to be massive energy-consuming object. When “bad money drives out good” in the household RAC market, this will end up with a massive energy waste. A responsible revision of the current Chinese national RAC performance standard will noticeably contribute to preventing unhealthy and unfair evaluations from happening.
Additionally, it has to be mentioned that the tightened D&WBT tolerances worked out in this investigation were only the calculation results for one particular RAC unit with a certain rated cooling capacity. Determination of D&WBT tolerances for this type of RAC can be achieved on the basis of greater performance test data and further data analysis. Furthermore, the determination of indoor and outdoor D&WBT tolerances for average readings in cooling capacity and heat pump tests under different working conditions of both constant and variable speed RAC units with different rated cooling capacity requires further theoretical research and much greater experimental analysis.
Furthermore, consumers can expect more reliable energy efficiency and electricity savings of energy appliance products with a revised energy efficiency evaluation using precise D&WBT tolerances. With the expected sales of RAC in China between 2009 and 2020 being about 500 million units [53], the energy saving and reduction in carbon emissions can be noticeably large, especially in summer when the energy demand amounts normally peak during the year.

Author Contributions

Formal analysis, D.C. and X.H.; Funding acquisition, Z.Z.; Investigation, X.H.; Methodology, Z.Z.; Resources, Z.Z.; Software, D.C.; Writing—original draft, X.H.; Writing—review & editing, X.H. All authors have read and agreed to the published version of the manuscript.

Funding

This research was supported by the Postgraduate Research & Practice Innovation Program of Jiangsu Province, China (SJKY19_1182), the Excellent Graduate Workshop in Nanfeng Cold-Chain Co. Ltd., and the Excellent Graduate Workshop in Jiangsu Beiyang Cold-Chain Equipment Technology Co. Ltd. in Jiangsu Province, China, and the Key Research and Development Project in Zhenjiang, China (GY2019025).

Conflicts of Interest

The authors declare no conflicts of interest. The founding sponsors had no role in the design of the study; in the collection, analyses, or interpretation of data; in the writing of the manuscript, and in the decision to publish the results.

Abbreviations

CCCooling Capacity
EEREnergy Efficiency Ratio
DBTDry Bulb Temperature
WBTWet Bulb Temperature
D&WBTsDry and Wet Bulb Temperatures
RACRoom air conditioner
PIPower input
AICAkaike information criterion
AICcCorrected Akaike information criterion
RSSResidual sum of squares
MADMean average differences
SQSICCREState Quality Supervision and Inspection Center on Compressors and Refrigerating Equipment
Nomenclature
i = 1Working condition of variable DBT
i = 2Working condition of variable WBT
i = 3working condition of coupling variation between D&WBT
nsample size
Knumber of parameters
CCmaxmaximum of cooling capacity (W)
EERmaxmaximum of EER
∆CCmaxgradient of cooling capacity maximum (W)
∆EERmaxgradient of EER maximum
CCTtightened of cooling capacity (W)
EERTtightened of EER
ha1enthalpy of inlet air at indoor side (J/kg)
ha2enthalpy of outlet air at indoor side (J/kg)
td1dry-bulb temperature of inlet air (°C)
td2dry-bulb temperature of outlet air (°C)
tw1wet-bulb temperature of inlet air (°C)
tw2wet-bulb temperature of outlet air (°C)
P0atmospheric pressure (Pa)

Appendix A

Table A1. Typical models and their properties.
Surface TypeEquation
ExtremeCum z = z c + B exp [ exp ( C x D ) ] + E exp [ exp ( F y G ) ] + H exp [ exp ( C x D ) exp ( F y G ) ]
Poly2D z = z c + A x + B y + C x 2 + D y 2 + F x y
LogisticCum z = z c + B [ 1 + exp ( C x D ) ] [ 1 + exp ( E x F ) ]
Parabola2D z = z c + A x + B y + C x 2 + D y 2
Gauss2D z = z c + A exp [ 1 2 ( x x c w 1 ) 2 1 2 ( y y c w 2 ) 2 ]
Lorentz2D z = z c + A [ 1 + ( x x c w 1 ) 2 ] [ 1 + ( y y c w 2 ) 2 ]
GaussCum z = z c + 0.25 B [ 1 + erf ( x C 2 D ) ] [ 1 + erf ( y E 2 F ) ]
Rational2D z = z c + A 01 x + B 01 y + B 02 y 2 + B 03 y 2 1 + A 1 x + A 2 x 2 + A 3 x 3 + B 1 y + B 2 y 2
Remarks: zc, xc, yc, w1, w2, A, B, C, D, E, and F are constants/coefficients; x and y are independent variable; and z is a dependent variable.

References

  1. Rogelj, J.; Fricko, O.; Meinshausen, M.; Krey, V.; Zilliacus, J.J.J.; Riahi, K. Understanding the origin of Paris Agreement emission uncertainties. Nature Commun. 2017. [Google Scholar] [CrossRef] [PubMed] [Green Version]
  2. Borg, S.P.; Kelly, N.J. The effect of appliance energy efficiency improvements on domestic electric loads in European households. Energy Build. 2011, 43, 2240–2250. [Google Scholar] [CrossRef]
  3. Nishijima, D. The role of technology, product lifetime, and energy efficiency in climate mitigation: A case study of air conditioners in Japan. Energy Policy 2017, 104, 340–347. [Google Scholar] [CrossRef]
  4. The Japan Refrigeration and Air Conditioning Industry Association. World Air Conditioner Demand by Region; JRAIA: Tokyo, Japan, 2017. [Google Scholar]
  5. Statistics Bureau of Japan. Japan Statistical Yearbook 2017; SBJ: Tokyo, Japan, 2017. [Google Scholar]
  6. US Energy Information Administration. Annual Energy Outlook; EIA: Washington, DC, USA, 2017.
  7. National Bureau of Statistics of China. China Statistical Yearbook 2016; NBSC: Beijing, China, 2016.
  8. Yu, H.; Tang, B.J.; Yuan, X.C.; Wang, S.; Wei, Y.M. How do the appliance energy standards work in China? Evidence from room air conditioners. Energy Build. 2015, 86, 833–840. [Google Scholar] [CrossRef]
  9. Yu, S.; Wei, Y.M.; Wang, K. China’s primary energy demands in 2020: Predictions from an MPSO–RBF estimation model. Energy Convers. Manag. 2012, 61, 59–66. [Google Scholar] [CrossRef]
  10. Zhou, N.; Fridley, D.; McNeil, M.; Zheng, N.; Letschert, V.; Ke, J.; Saheb, Y. Analysis of potential energy saving and CO2, emission reduction of home appliances and commercial equipments in China. Energy Policy 2011, 39, 4541–4550. [Google Scholar] [CrossRef] [Green Version]
  11. Harrington, L.; Aye, L.; Fuller, R.J. Opening the door on refrigerator energy consumption: Quantifying the key drivers in the home. Energy Effic. 2018, 11, 1519–1539. [Google Scholar] [CrossRef]
  12. Tian, H.; Ma, Y.T.; Li, M.X.; Liu, C.T.; Zhao, L. The status and development trend of the water chiller energy efficiency standard in China. Energy Policy 2010, 38, 7497–7503. [Google Scholar]
  13. Yuan, Q.X.; Ma, Y.T.; Liu, C.T.; Dai, B.M.; Yan, Q.H. Thermodynamic perfectibility based analysis of energy-efficiency standards for air conditioning products in China. Energy Build. 2011, 43, 3627–3634. [Google Scholar] [CrossRef]
  14. Ma, Y.T.; Tian, H.; Liu, C.T.; Yuan, Q.X. Analysis on Energy Efficiency Standards and Thermodynamic Perfectibility for Products of Refrigeration and Heat Pump. J. Refrig. 2012, 33, 1–6. [Google Scholar]
  15. Li, X.F.; Ma, Y.T.; Yan, Q.H. Analysis on thermodynamic perfectibility of room air conditioners. J. Refrig. 2013, 34, 18–23. [Google Scholar]
  16. Grignon-Masse, L.; Rivière, P.; Adnot, J. Strategies for reducing the environmental impacts of room air conditioners in Europe. Energy Policy 2011, 39, 2152–2164. [Google Scholar] [CrossRef]
  17. Vendrusculo, E.A.; de Castilho Queiroz, G.; Jannuzzi, G.D.M.; da Silva Júnior, H.X.; Pomilio, J.A. Life cycle cost analysis of energy efficiency design options for refrigerators in Brazil. Energy Effic. 2009, 2, 271–286. [Google Scholar] [CrossRef] [Green Version]
  18. Shi, X. Setting effective mandatory energy efficiency standards and labelling regulations: A review of best practices in the Asia Pacific region. Appl. Energy 2014, 133, 135–143. [Google Scholar] [CrossRef]
  19. Liu, J.; Sun, X.; Lu, B.; Zhang, Y.; Sun, R. The life cycle rebound effect of air-conditioner consumption in China. Appl. Energy 2016, 184, 1026–1032. [Google Scholar] [CrossRef]
  20. Schweiker, M. Study on the effect of preference of Air-Conditioning usage on the exergy consumption pattern within a built environment. Int. J. Exergy 2012, 11, 409–422. [Google Scholar] [CrossRef]
  21. Ren, X.; Yan, D.; Wang, C. Air-conditioning usage conditional probability model for residential buildings. Build. Environ. 2014, 81, 172–182. [Google Scholar] [CrossRef]
  22. Wu, J.; Liu, C.; Li, H.; Ouyang, D.; Cheng, J.; Wang, Y.; You, S. Residential air-conditioner usage in China and efficiency standardization. Energy 2016, 119, 1036–1046. [Google Scholar] [CrossRef]
  23. Wang, Z.Y.; Xu, Z.L. Air Conditioner Performance Testing; Science Press: Beijing, China, 2009. [Google Scholar]
  24. Mahlia, T.M.I.; Saidur, R. A review on test procedure, energy efficiency standards and energy labels for room air conditioners and refrigerator-freezers. Renew. Sust. Energ. Rev. 2010, 14, 1888–1900. [Google Scholar] [CrossRef]
  25. Zhang, K.; Zhang, X.S.; Chen, X.Y. Analysis on Uncertainty in Testing of Air Conditioner by Means of Air Enthalpy Method. Fluid Mach. 2006, 34, 72–75. [Google Scholar]
  26. Diaz, N.F. Methodology for uncertainty calculation of net total cooling effect estimation for rating room air conditioners and packaged terminal air conditioners. Int. J. Refrig. 2009, 32, 1472–1477. [Google Scholar] [CrossRef]
  27. Jiang, M.L.; Mao, X.C.; Yu, G.R. Research on evaluating the uncertainty of cooling capacity for air conditioners using air- enthalpy method. Cryog. Supercond. 2011, 39, 36–40. [Google Scholar]
  28. Nishijima, D. Product lifetime, energy efficiency and climate change: A case study of air conditioners in Japan. J. Environ. Manag. 2016, 181, 582–589. [Google Scholar] [CrossRef] [PubMed]
  29. Lekov, A.B.; Franco, V.H.; Meyers, S. Evaluation of energy-efficiency standards for room air conditioners in the US. Open J. Energy Effic. 2012, 12, 9–20. [Google Scholar] [CrossRef] [Green Version]
  30. General Administration of Quality Supervision, Inspection and Quarantine of the PRC & Standardization Administration of the PRC. The Minimum Allowable Values of the Energy Efficiency and Energy Efficiency Grades for Room Air Conditioners; GB/T 12021.3–1989; International Energy Agency: Paris, France, 1989.
  31. General Administration of Quality Supervision, Inspection and Quarantine of the PRC & Standardization Administration of the PRC. The Minimum Allowable Values of the Energy Efficiency and Energy Efficiency Grades for Room Air Conditioners; GB/T 12021.3–2000; International Energy Agency: Paris, France, 2000.
  32. General Administration of Quality Supervision, Inspection and Quarantine of the PRC & Standardization Administration of the PRC. The Minimum Allowable Values of the Energy Efficiency and Energy Efficiency Grades for Room Air Conditioners; GB 12021.3-2004; International Energy Agency: Paris, France, 2004.
  33. General Administration of Quality Supervision, Inspection and Quarantine of the PRC & Standardization Administration of the PRC. The Minimum Allowable Values of the Energy Efficiency and Energy Efficiency Grades for Room Air Conditioners; GB/T 12021.3-2010; International Energy Agency: Paris, France, 2010.
  34. US Department of Energy. Energy Conservation Program: Energy Conservation Standards for Residential Clothes Dryers and Room Air Conditioners: Final Rule; Federal Registar: Washington, DC, USA, 2011.
  35. The Japan Refrigeration and Air Conditioning Industry Association. Calculating Method of Annual Power Consumption for Room Air Conditioners JRA 4046; JRAIA: Tokyo, Japan, 2005. [Google Scholar]
  36. European Commission. G/TBT/N/EEC/362 of the European Parliament and of the Council with Regard to Eco-Design Requirements for Air Conditioners and Comfort Fans; European Commission: Brussels, Belgium, 2011. [Google Scholar]
  37. European Commission. G/TBT/N/EEC/363 of the European Parliament and of the Council with Regard to Energy Labeling of Air Conditioners; European Commission: Brussels, Belgium, 2011. [Google Scholar]
  38. Lu, W. Potential energy savings and environmental impacts of energy efficiency standards for vapor compression central air conditioning units in China. Energy Policy 2007, 35, 1709–1717. [Google Scholar] [CrossRef]
  39. Khanna, N.Z.; Zhou, N.; Fridley, D.; Fino-Chen, C. Evaluation of China’s local enforcement of energy efficiency standards and labeling programs for appliances and equipment. Energy Policy 2013, 63, 646–655. [Google Scholar] [CrossRef]
  40. General Administration of Quality Supervision, Inspection and Quarantine of the PRC; Standardization Administration of the PRC. Room Air Conditioners GB/T 7725-2004; General Administration of Quality Supervision, Inspection and Quarantine of the PRC: Beijing, China, 2004. [Google Scholar]
  41. Lee, C.; Wang, Y.J. A Novel Method to Derive Formulas for Computing the Wet-Bulb Temperature from Relative Humidity and Air Temperature. Measurement 2018, 128, 271–275. [Google Scholar] [CrossRef]
  42. Zhang, Z.B.; Du, K.; Huang, H.; Zhang, R.N. Grading of dry-bulb and wet-bulb temperature allowances based on characteristics of performance curves. Chin. J. Mech. Eng. 2014, 50, 157–162. [Google Scholar] [CrossRef]
  43. Zhang, Z.B.; Du, K.; Huang, H.; Zhang, R.N. Dry-bulb and wet-bulb temperature allowances grading based on the characteristics of performance curves. J. Chem. Ind. Eng. 2014, 65, 3676–3679. [Google Scholar]
  44. Zhang, Z.B.; Huang, H.; Li, Y.L.; Huang, Y.A. Mathematical correction based on weight analysis on instantaneous dry-bulb and wet-bulb temperatures tolerances specified for cooling capacity test and heat pump test. Sci. Technol. Built Environ. 2016, 22, 261–265. [Google Scholar] [CrossRef]
  45. Hu, S.H. Akaike Information Criterion; Center for Research in Scientific Computation: North Carolina, VA, USA, 2007. [Google Scholar]
  46. Bozdogan, H. Model selection and Akaike’s information criterion (AIC): The general theory and its analytical extensions. Psychometrika 1987, 52, 345–370. [Google Scholar] [CrossRef]
  47. Chang, Y.H.; Wong, J.F. Oil price fluctuations and Singapore economy. Energy Policy 2003, 31, 1151–1165. [Google Scholar] [CrossRef]
  48. Erdal, G.; Erdal, H.; Esengün, K. The causality between energy consumption and economic growth in Turkey. Energy Policy 2008, 36, 3838–3842. [Google Scholar] [CrossRef]
  49. Halicioglu, F. An econometric study of CO2 emissions, energy consumption, income and foreign trade in Turkey. Energy Policy 2009, 37, 1156–1164. [Google Scholar] [CrossRef] [Green Version]
  50. Liu, Y.; Wang, F.; Du, S.C. Influence of environment on air conditioner performance. Heat. Vent. Air Cond. Res. 2006, 36, 110–112. [Google Scholar]
  51. Zhang, Z.B.; Pan, Y.M.; Huang, H.; Jiang, Q. Performance experiment of all fresh air-handing unit with high sub-cooling degree and year-round exergy analysis. HVAC R Res. 2014, 20, 810–818. [Google Scholar] [CrossRef]
  52. He, S.; Chen, W.; Chen, R.; Liu, H. Uncertainty of air conditions cooling capacity measured by enthalpy method. Cryog. Supercond. 2010, 38, 52–55. [Google Scholar]
  53. Lin, J.; Rosenquist, G. Stay cool with less work: China’s new energy-efficiency standards for air conditioners. Energy Policy 2008, 36, 1090–1095. [Google Scholar] [CrossRef]
Figure 1. Diagram of the dry-bulb and wet-bulb temperature allowance classification.
Energies 13 01436 g001
Figure 2. Measured results of cooling capacity (CC, a) and energy efficiency ratio (EER, b) in Section A.
Energies 13 01436 g002
Figure 3. Measured results of CC (a) and EER (b) in Section B.
Energies 13 01436 g003
Figure 4. Relationship between CC and D&WBT (a) and relationship between EER and D&WBT (b) in Section A.
Energies 13 01436 g004
Figure 5. Relationship between CC and D&WBT (a) and relationship between EER and D&WBT (b) in Section B.
Energies 13 01436 g005
Figure 6. Extrema intervals of CC and EER and the tightening of D&WBT tolerances. (a) Section A; (b) Section B.
Energies 13 01436 g006
Table 1. Energy efficiency classification of constant frequency split RAC.
The Rated Cooling Capacity (CC)EER (W W−1)
Class 1Class 2Class 3
CC 4500 W3.603.403.20
4500 W < CC 7100 W3.503.303.10
7100 W < CC 14,000 W3.403.203.00
Table 2. Working conditions of the indoor and outdoor D&WBTs changing within the tolerances: Section A.
DBT °C2626.226.426.626.82727.227.427.627.828
WBT °C
18.51#2#3#4#5#6#7#8#9#10#11#
18.712#13#14#15#16#17#18#19#20#21#22#
18.923#24#25#26#27#28#29#30#31#32#33#
1934#35#36#37#38#39#40#41#42#43#44#
19.145#46#47#48#49#50#51#52#53#54#55#
19.356#57#58#59#60#61#62#63#64#65#66#
19.567#68#69#70#71#72#73#74#75#76#77#
Note: Refrigerating working condition with outdoor D&WBTs kept at 35/24 °C, and indoor D&WBTs change within ±1/±0.5 °C. Nominal working condition is in bold.
Table 3. Working conditions of the indoor and outdoor D&WBTs changing within the allowance: Section B.
DBT °C3434.234.434.634.83535.235.435.635.836
WBT °C
23.578#79#80#81#82#83#84#85#86#87#88#
23.789#90#91#92#93#94#95#96#97#98#99#
23.9100#101#102#103#104#105#106#107#108#109#110#
24111#112#113#114#115#116#117#118#119#120#121#
24.1122#123#124#125#126#127#128#129#130#131#132#
24.3133#134#135#136#137#138#139#140#141#142#143#
24.5144#145#146#147#148#149#150#151#152#153#154#
Note: Refrigerating working condition with indoor D&WBTs kept at 27/19 °C, and outdoor D&WBTs change within ±1/±0.5 °C. Nominal working condition is in bold.
Table 4. Values of n (sample size), K (number of parameters), RSS (residual sum of squares), AICc (corrected Akaike information criterion) and residuals of CC (cooling capacity) and EER (energy Efficiency Ratio) curved surfaces in fitting equations.
Surface EquationnKRSSAICc
Section ACCExtremeCum7786.29 × 10−4−881.3827
GaussCum7760.00744−696.1695
Parabola2D7750.00233−788.0383
Rational2D77106.85 × 10−4−869.4405
EERGaussCum7760.0046−733.2407
ExtremeCum7780.00432−733.0129
LogisticCum7760.00473−731.0947
Parabola2D7750.00527−725.1938
Section BCCExtremeCum7780.0008−862.8657
Poly2D7760.00104−847.727
LogisticCum7760.00107−845.5372
Parabola2D7750.00107−847.9605
EERLorentz2D7760.00001−1205.3451
LogisticCum7760.00041−919.4
Gauss2D7760.00002−974.6737
Poly2D7760.00002−1151.9728
* The bold equations are equations eventually employed in surface fitting.
Table 5. Parameters in the equations and corresponding standard errors.
Section ASection B
CoefficientsValuesStd. Err.CoefficientsValuesStd. Err.
z112.88380.28057z212.406181.55815
A1−1.124850.01812A2−0.113160.07592
B13.283720.00206B234.796580.05693
C111.503670.37617C20.693380.00105
D1−3.418980.09565D2−0.060990.00105
E118.64760.04439E224.323447.45 × 10−4
F10.674460.05232F20.737290.00785
G14.801250.64923G2−0.032840.01071
E012.864220.05369E023.1617425.11368
a7.4838630.7158H2−0.161170.98283
b28.093029.04607xc37.649740.91209
c8.4976026.05339w14.4558220.04499
d23.7504610.61517yc27.052634.50417
e4.390052.9189w27.420341.25643
Table 6. D&WBT tolerances and the corresponding ∆CCmax and ∆EERmax before and after tightening.
TolerancesRange
DBT °CWBT °C∆CCmax∆EERmax
Indoor tolerances before tightening26.5~27.518.7~19.32.95%2.11%
Outdoor tolerances before tightening26.5~27.518.7~19.32.95%2.11%
Indoor tolerances after tightening26.7~27.318.8~19.21.40%1.03%
Outdoor tolerances after tightening26.6~27.418.7~19.31.62%1.25%
Table 7. Measured accuracy and uncertainty.
MeasurementUnitAccuracyUncertainty
Platinum resistance temperature sensor °C±0.1 °C0.058 °C
Pressure sensorMPa±0.25%0.14 MPa
Pressure differential sensor MPa0.50%0.00072 MPa
Power input W0.1%1.96 W
Table 8. Evaluation of uncertainty for CC and EER measurements.
Evaluation of UncertaintyOutdoor SideIndoor Side
CCEERCCEER
Type A evaluation of uncertainty0.0039875450.0014745660.013866770.004627448
Type B evaluation of uncertainty0.0083738450.0088473940.045464820.029868073
Combined standard uncertainty0.927%0.897%4.753%3.022%

