Article

Instantaneous Rotational Speed Algorithm for Locating Malfunctions in Marine Diesel Engines

Faculty of Marine Engineering, Maritime University of Szczecin, Szczecin 71-650, Poland
*
Authors to whom correspondence should be addressed.
Energies 2020, 13(6), 1396; https://doi.org/10.3390/en13061396
Submission received: 18 February 2020 / Revised: 4 March 2020 / Accepted: 15 March 2020 / Published: 17 March 2020
(This article belongs to the Special Issue Recent Advances in Diesel Engine Diagnostic Techniques)

Abstract

:
This article suggested broadening the standard methods for diagnosing the technical condition of diesel engines to include an analysis of the instantaneous rotational speed of compression combustion engines with the use of a novel algorithm. The authors revised the subject concerning the use of the analysis of instantaneous changes in the rotational speed of an engine when assessing its technical condition and the location of the malfunction. An algorithm and its practical implementation in a prototype diagnostic system called SpeedMA were presented. This article reported the test results of the prototype in the context of indicating the engine cylinder in which ignition failed to occur. Tests were carried out for two marine engines: a low-speed trunk engine directly driving the fixed-pitch propeller and a medium-speed trunk engine driving the alternator. For each case, an analysis was carried out for different engine loads and at individual cylinders in which combustion failed to occur. The experimental results showed an unambiguous relation between the combustion process of the examined engines and changes in the instantaneous rotational speed. The results also confirmed the usefulness of the proposed method and showed the correct operation of the presented diagnostic algorithm. The proposed diagnostic system could be used during the operation of engines running in real ship engine rooms.

Graphical Abstract

1. Introduction

The combustion process occurring in the combustion chambers of a marine reciprocating engine and its analysis are the main sources of information involved in the operation and condition of the components of a running engine. This provides a range of information on the condition of the injection device, the piston-crank system, the valvetrain, and the quality of the burning fuel [1,2,3,4]. One of the most common malfunctions found in marine engines is damage to the fuel system, which directly affects the instantaneous rotational speed [5,6,7]. High-powered compression-ignition marine diesel engines are used as propulsion systems and energy sources for ship power plants and are equipped with engine supervision systems that utilize sensors and advanced mathematical methods [8,9,10,11,12]. Remote and local exhaust gas temperature sensors are the basic diagnostic and monitoring tools. The fuel combustion process involves temperature fluctuations of the exhaust gases, depending on the load and the quality of combustion itself [13,14,15,16]. Depending on its source, most malfunctions during the operation of injection devices either increase or decrease the exhaust gas temperature at the cylinder exit.
More advanced monitoring methods involve systems based on sensors that measure the combustion pressures in combustion chambers [17,18,19,20]. For example, this concept has been used by ABB (ASEA Brown Boveri corporation) in their Cylmate product [18] using a system that consists of pressure sensors equipped with piezoelectric crystals that deform under pressure mounted on each cylinder and a shaft position transmitter mounted on the engine flywheel. Each component is connected to the Cylmate transducer busbar, which collects real-time data from each motorcycle via the CAN (Controller Area Network) bus. A built-in mathematical model of the engine calculates the position of the crankshaft in order to obtain the correct angle of the piston position at each cylinder. The most important combustion parameters, such as the maximum combustion pressure, angle of maximum combustion pressure, scavenging pressure, compression pressure, and average pressure, are recorded and monitored for each cycle and can be displayed in the form of charts [21,22,23,24]. All deviations from normal values are indicated as an alarm. Evaluated data, alarms, and events are transmitted via Ethernet LAN to the Cylmate control unit and also to higher-level systems that monitor the entire engine room. This device is excellent for monitoring the combustion process in low-speed engines. Periodic clogging of the sensor inlet channels and the service life of the sensors themselves are considered to be operating defects.
Strain gauge sensors mounted on shafts or encoders monitoring the degree of torsion of the drive shaft are treated as a separate group of monitoring equipment [25,26,27]. KYMA KPM [26] is an example of the first type of system—a shaft power meter that measures torque, resistance generated by the drive, revolutions, and power output of the motor by continuously measuring the current flowing through a strain gauge attached to the drive shaft. Devices based on the measurement of shaft torsion using a mounted at a precise distance on the shaft are an alternative to strain gauges. The measurement of pulses from encoders and their mutual shifting in time inform the algorithm about the degree of shaft torsion. These devices, such as the LEMAG Shaftpower, improve operating efficiency, protect against overloads, and help optimize fuel consumption and save energy [28,29].
The angular velocity of an engine is not constant and changes momentarily, depending on the forces/moments acting on the crank-piston system [30,31,32,33].
An engine running under constant load produces an effective power equal to [1]:
N e = M o α n 1000 ·   τ = M o ω 1000 = M o 2 π r 60 · 1000 = M o n 9 , 549296 · 10 3
where: ω (rad/s)—the angular speed of the crankshaft, αn (rad)—crank angle, τ (s)—time.
Transforming the above formulae produces a proportional dependence of the rotational speed of the engine n (rpm) on the effective power Ne (kW), and an inversely proportional dependence of the torque Mo (Nm) acting on the engine is observed:
n   9.55 · 10 3 N e M 0
Analyzing the dynamic torque equation of the internal combustion engine crankshaft [30,34], shown in Formula 3, confirms the correlation between the change in angular velocity and, after transformation, the correlation of the instantaneous rotational velocity for a given moment, and the torques acting on a given engine cylinder system. Because the torque during engine operation constantly changes, the instantaneous speed also changes:
J d ω d t = J ( φ ) d 2 φ d t 2 = M T M B α M o b M t  
where: J (kg m2)—reduced inertia mass moment of crank-piston system components, φ (rad)—angular position, MT (Nm)—tangential force moment T, MBa (Nm)—moment of inertia forces, Mob (Nm)—load moment, Mt (Nm)—friction and pumping moment.

2. State-of-the-Art

The change in the instantaneous rotational speeds recorded over the course of the research by the authors was, to a large extent, consistent with the course of the combustion process occurring in the engine and was in-line with other studies [35,36,37]. Modern science is engaged in advanced research on measuring the speed of piston engine crankshafts and its use in diagnostics and operation [38,39,40].
According to the best knowledge of the authors, the papers tackling the issue of the engine speed uniformity analysis mostly discuss detecting the angular speed deviation changes. The most important works are presented in Table 1. Among others, Biocanin, Dereszewski, Xiang, and others have published a number of papers, demonstrating the link between the instantaneous angular velocity and the proper course of combustion or malfunction detection. Dereszewski reported the calculation of moments acting on the piston-crank system by simultaneously testing the angular velocities using two encoders [41]. In turn, in his dissertation, Johnson presented a speed deviation calculation model that considered implemented neural networks [42]. Charchalis demonstrated and presented equations describing how the relationship between speed and torque affected a rotating crankshaft [30]. Wang et al. proposed using image correlation and periodicity algorithms [43]. Desbazeille and Zhang extended the analysis to V engines [44,45]. In his article, Dauglas attempted to combine the analysis of instantaneous rotational speed with vibroacoustic methods [46]. Also, research of other than diesel engines machines based on instantaneous rotational speed has been conducted [47,48].
Apart from the mentioned literature on speed deviation analyses, there is very little information on the algorithms suitable for use in online equipment monitoring the engine condition. The paper discussed the W coefficient calculation method, which covered deviation in angular speed for real engine. W coefficient was calculated for several engines with a different purpose (propulsion engine and electric power plant) and a different response from the engine governor (Woodward UG-8 type governor). All measurements showed that our method/algorithm was correct and could be used as a logic source for future use in the detector. The first prototype has already been created, and it detects the missing fire in units.
There are a number of engines without indicating cocks, and these engines are equipped only with basic diagnostic systems, e.g., cooling water temperature measurement and exhaust gas manifold temperatures. Moreover, these engines have a very compact construction, which makes them difficult to diagnose with on-line systems and with workshop parts measurements and verification. Furthermore, the second approach is time-consuming. Most of the marine engines installed on offshore support vessels, manufactured by, e.g., Detroit Diesel, John Deere, Caterpillar, Daimler Chrysler, Scania, MAN, Volvo, etc., might be classified to this group. The system proposed by the authors might be a good alternative for such engines as support for marine engineers. It might reduce the costs of operation and downtime periods.
A literature analysis showed that there are currently no widely applied diagnostic systems using rotational speed measurements to evaluate the combustion process in marine systems. Occasional use of instantaneous velocity in prototype diagnostic systems is not supported by validated data processing algorithms to diagnose an engine condition or locating malfunctions during its operation. The authors proposed an innovative algorithm for calculating deviations and identifying a faulty cylindrical system in which the combustion process had ceased. Such an instrument might be mounted directly to the head of a crankshaft, as was done during the present work. Alternatively, the measurement could be carried out on the shaft line or with a device parallel to the crankshaft axis using drive belts or optical measurements by means of a belt pulley and optical encoder.
The rotational speed is one of the basic engine operating parameters and is monitored by tachometers and power measurement systems that are installed as a standard in combustion engines [1,2,22]. Using signals in the method proposed in this paper would enable a more complete assessment of the technical condition and, therefore, contribute to improving the safety and efficiency of the operation process.
Lower-power marine engines are mostly devoid of measuring equipment, which makes diagnostics and engine monitoring very difficult and sometimes impossible. Combustion pressure sensors are also subject to frequent failures due to high temperatures and pressures, so their suitability may be largely limited to double-stroke main drive engines. The accessibility to the drive shaft is another limitation, which is limited in the case of 4-stroke power generators. The solution proposed by the authors was to supervise the combustion process by measuring instantaneous angular velocities using an incremental encoder mounted to the engine crankshaft.
Additionally, in the near future, in consequence of emission limitations, the market would be supported with a huge quantity of dual-fuel gas engines, which are more exposed to knocking combustion in chambers. Gas fuel supplied with air by an inlet air collector and the reaction during combustion are still not fully controlled. Our system could be very helpful in detecting faulty combustion. At present, marine four-stroke dual-fuel gas engines are not equipped with any system for combustion monitoring, and our system could make the engine room safer.
Let n and m are variables equal to a number of subsequent crankshaft rotations used for the diagnostic algorithms for steady-state and transient state analysis appropriately. The authors constructed an experimental measurement system and conducted tests to verify the following research hypotheses:
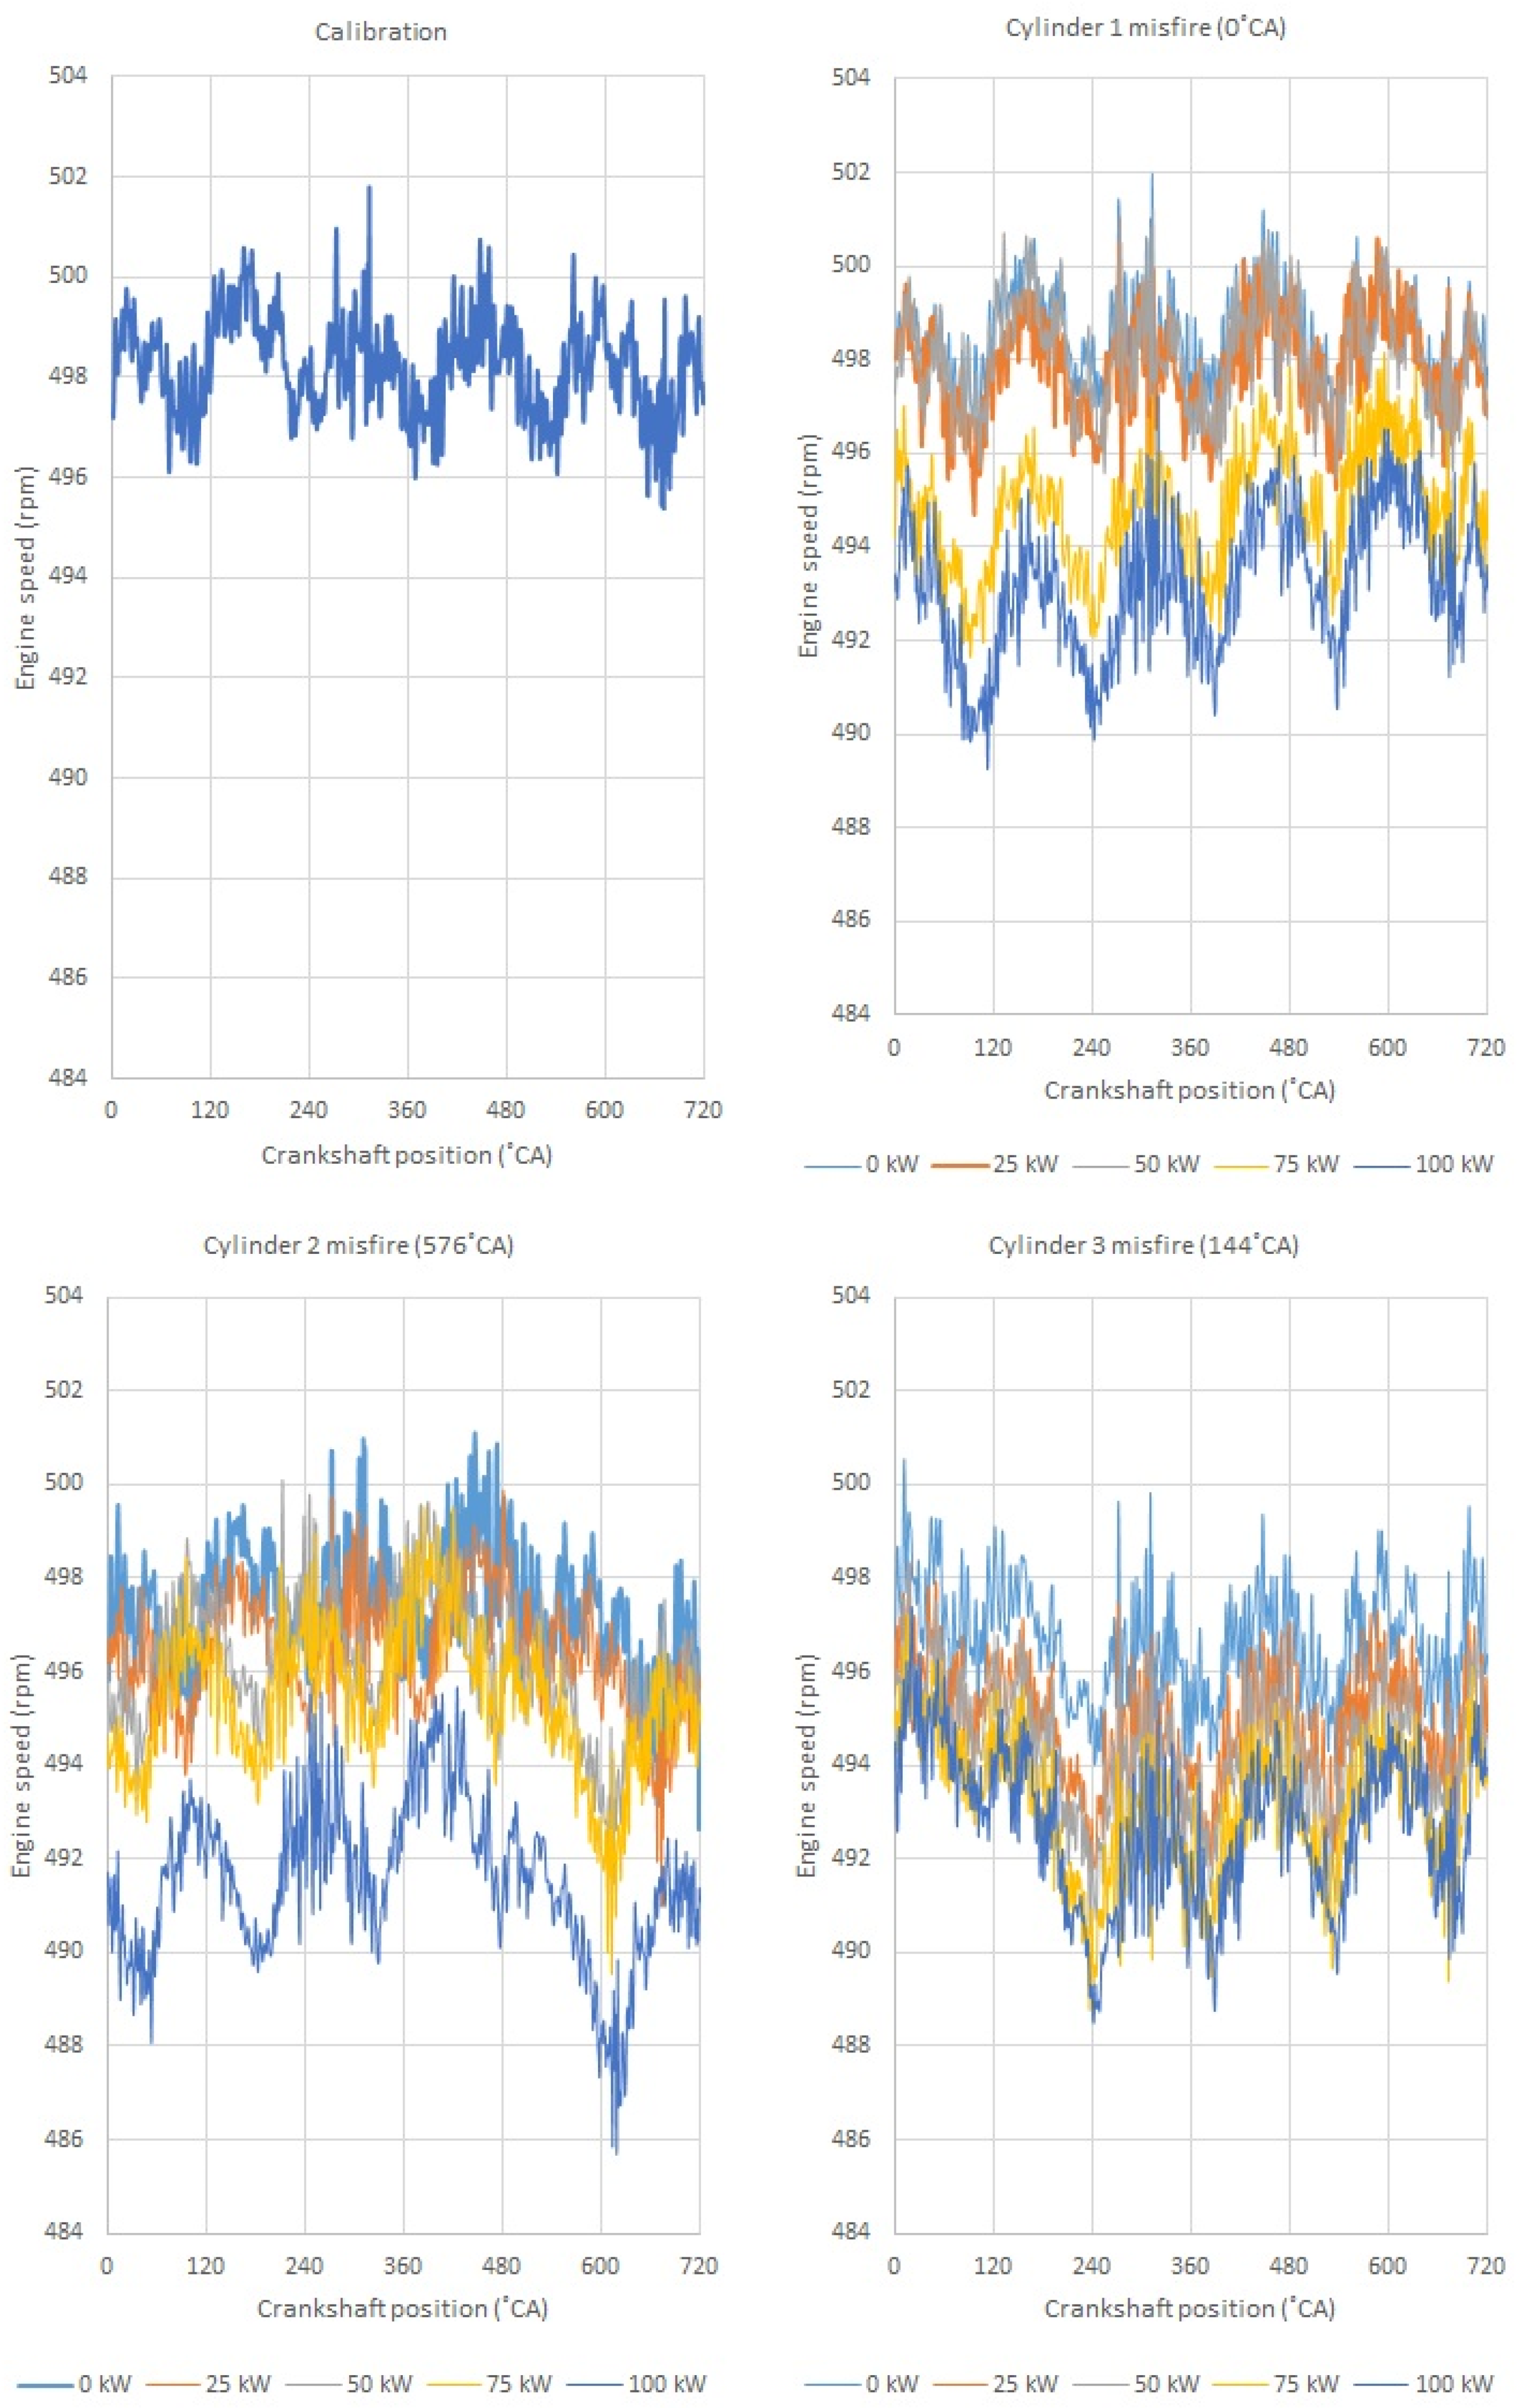
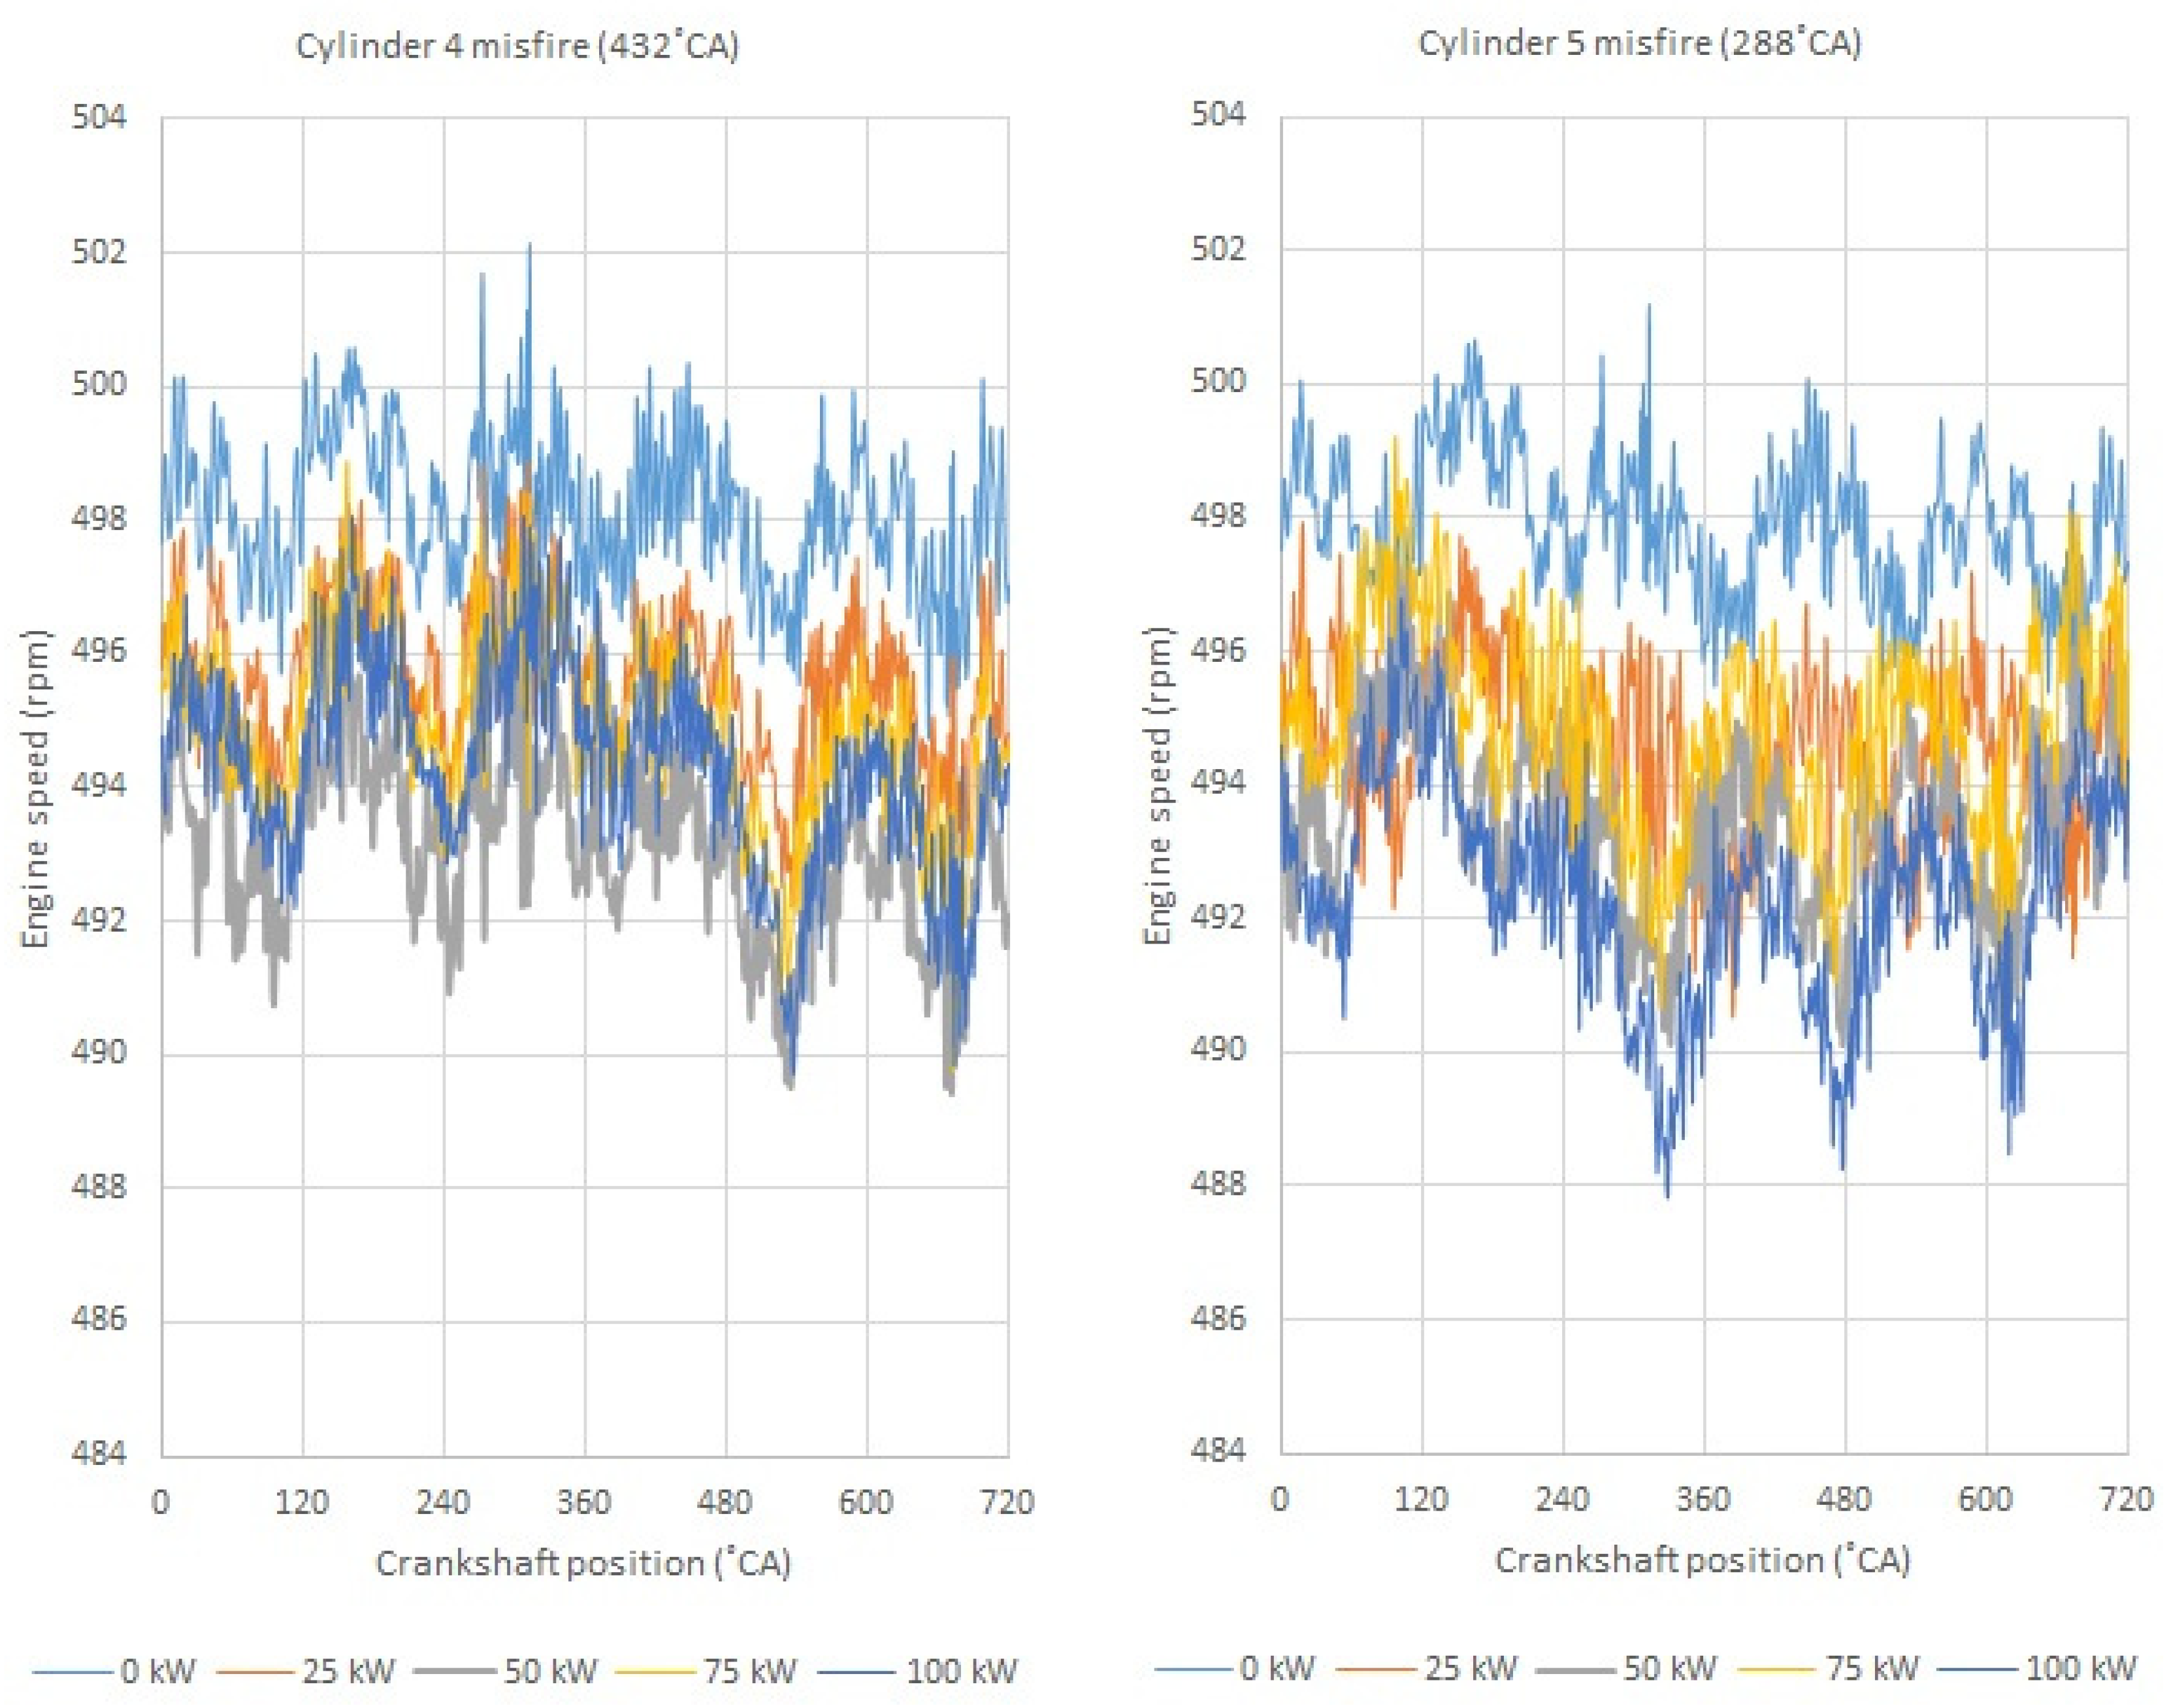
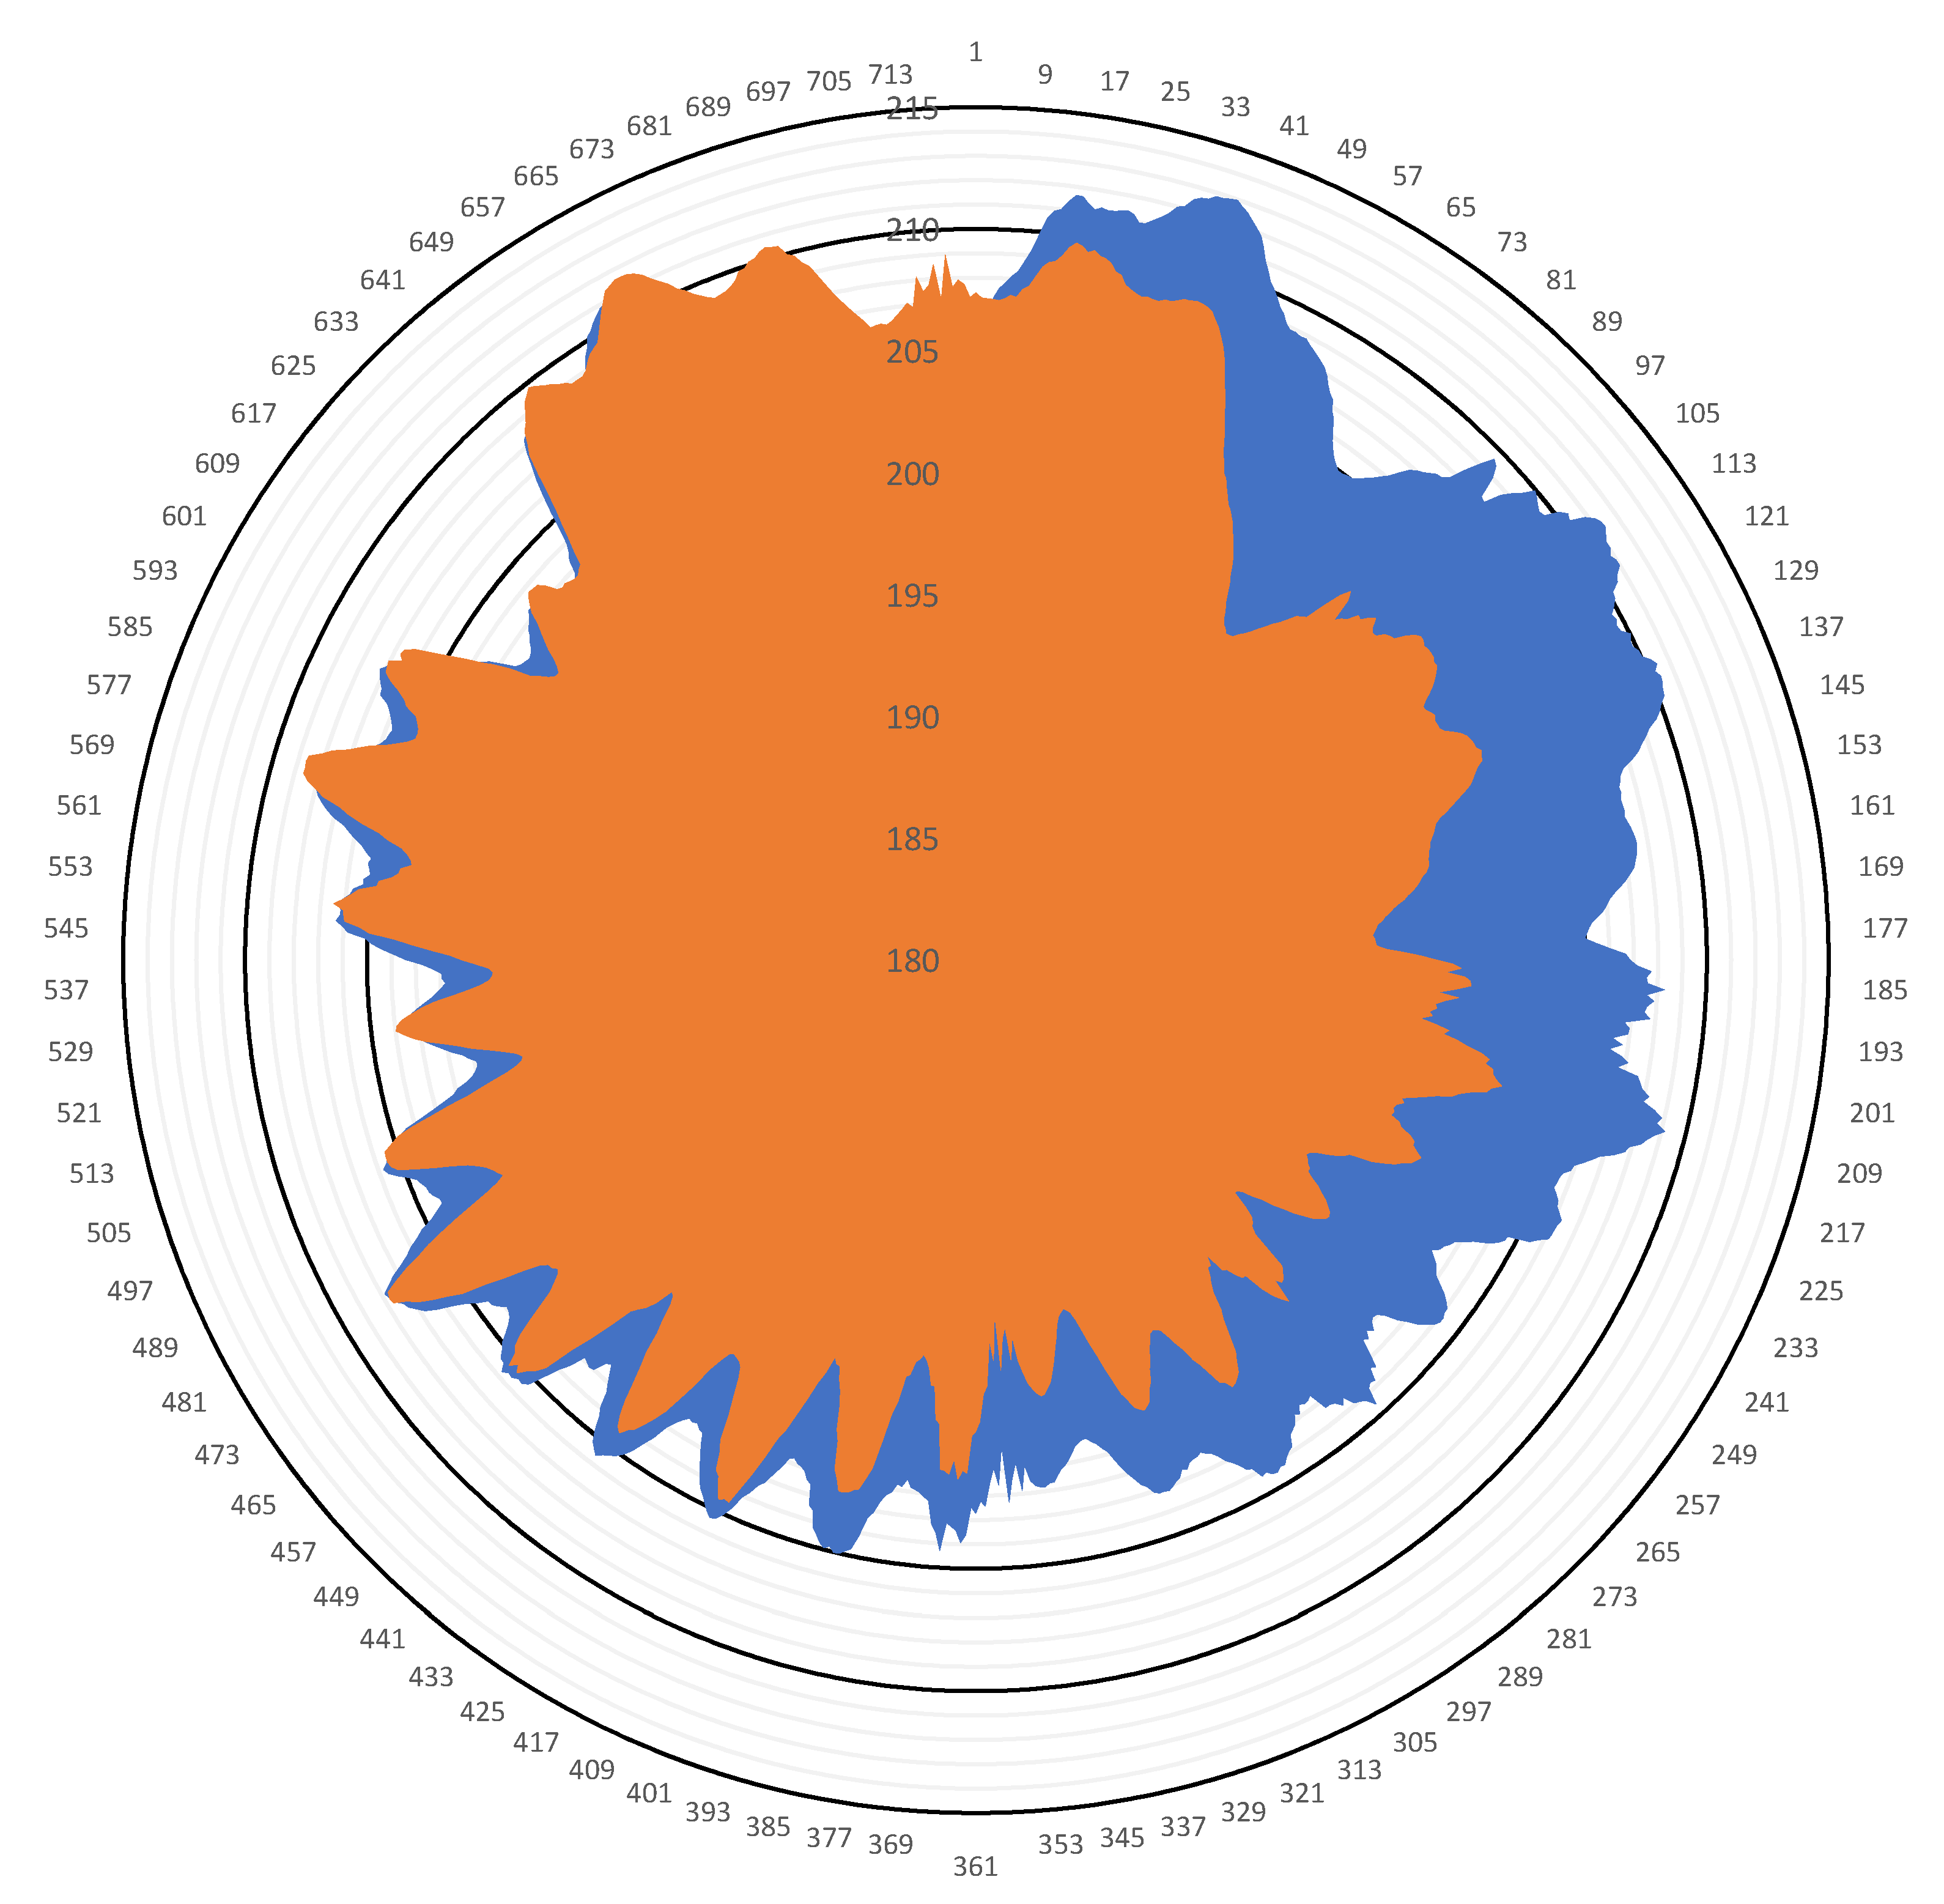
  • For a steady-state (quasi-static) engine, the difference in instantaneous rotational speed compared to the average rotational speed of a specific crankshaft position and calculated for n subsequent revolutions will reflect the change in the steady-state engine condition.
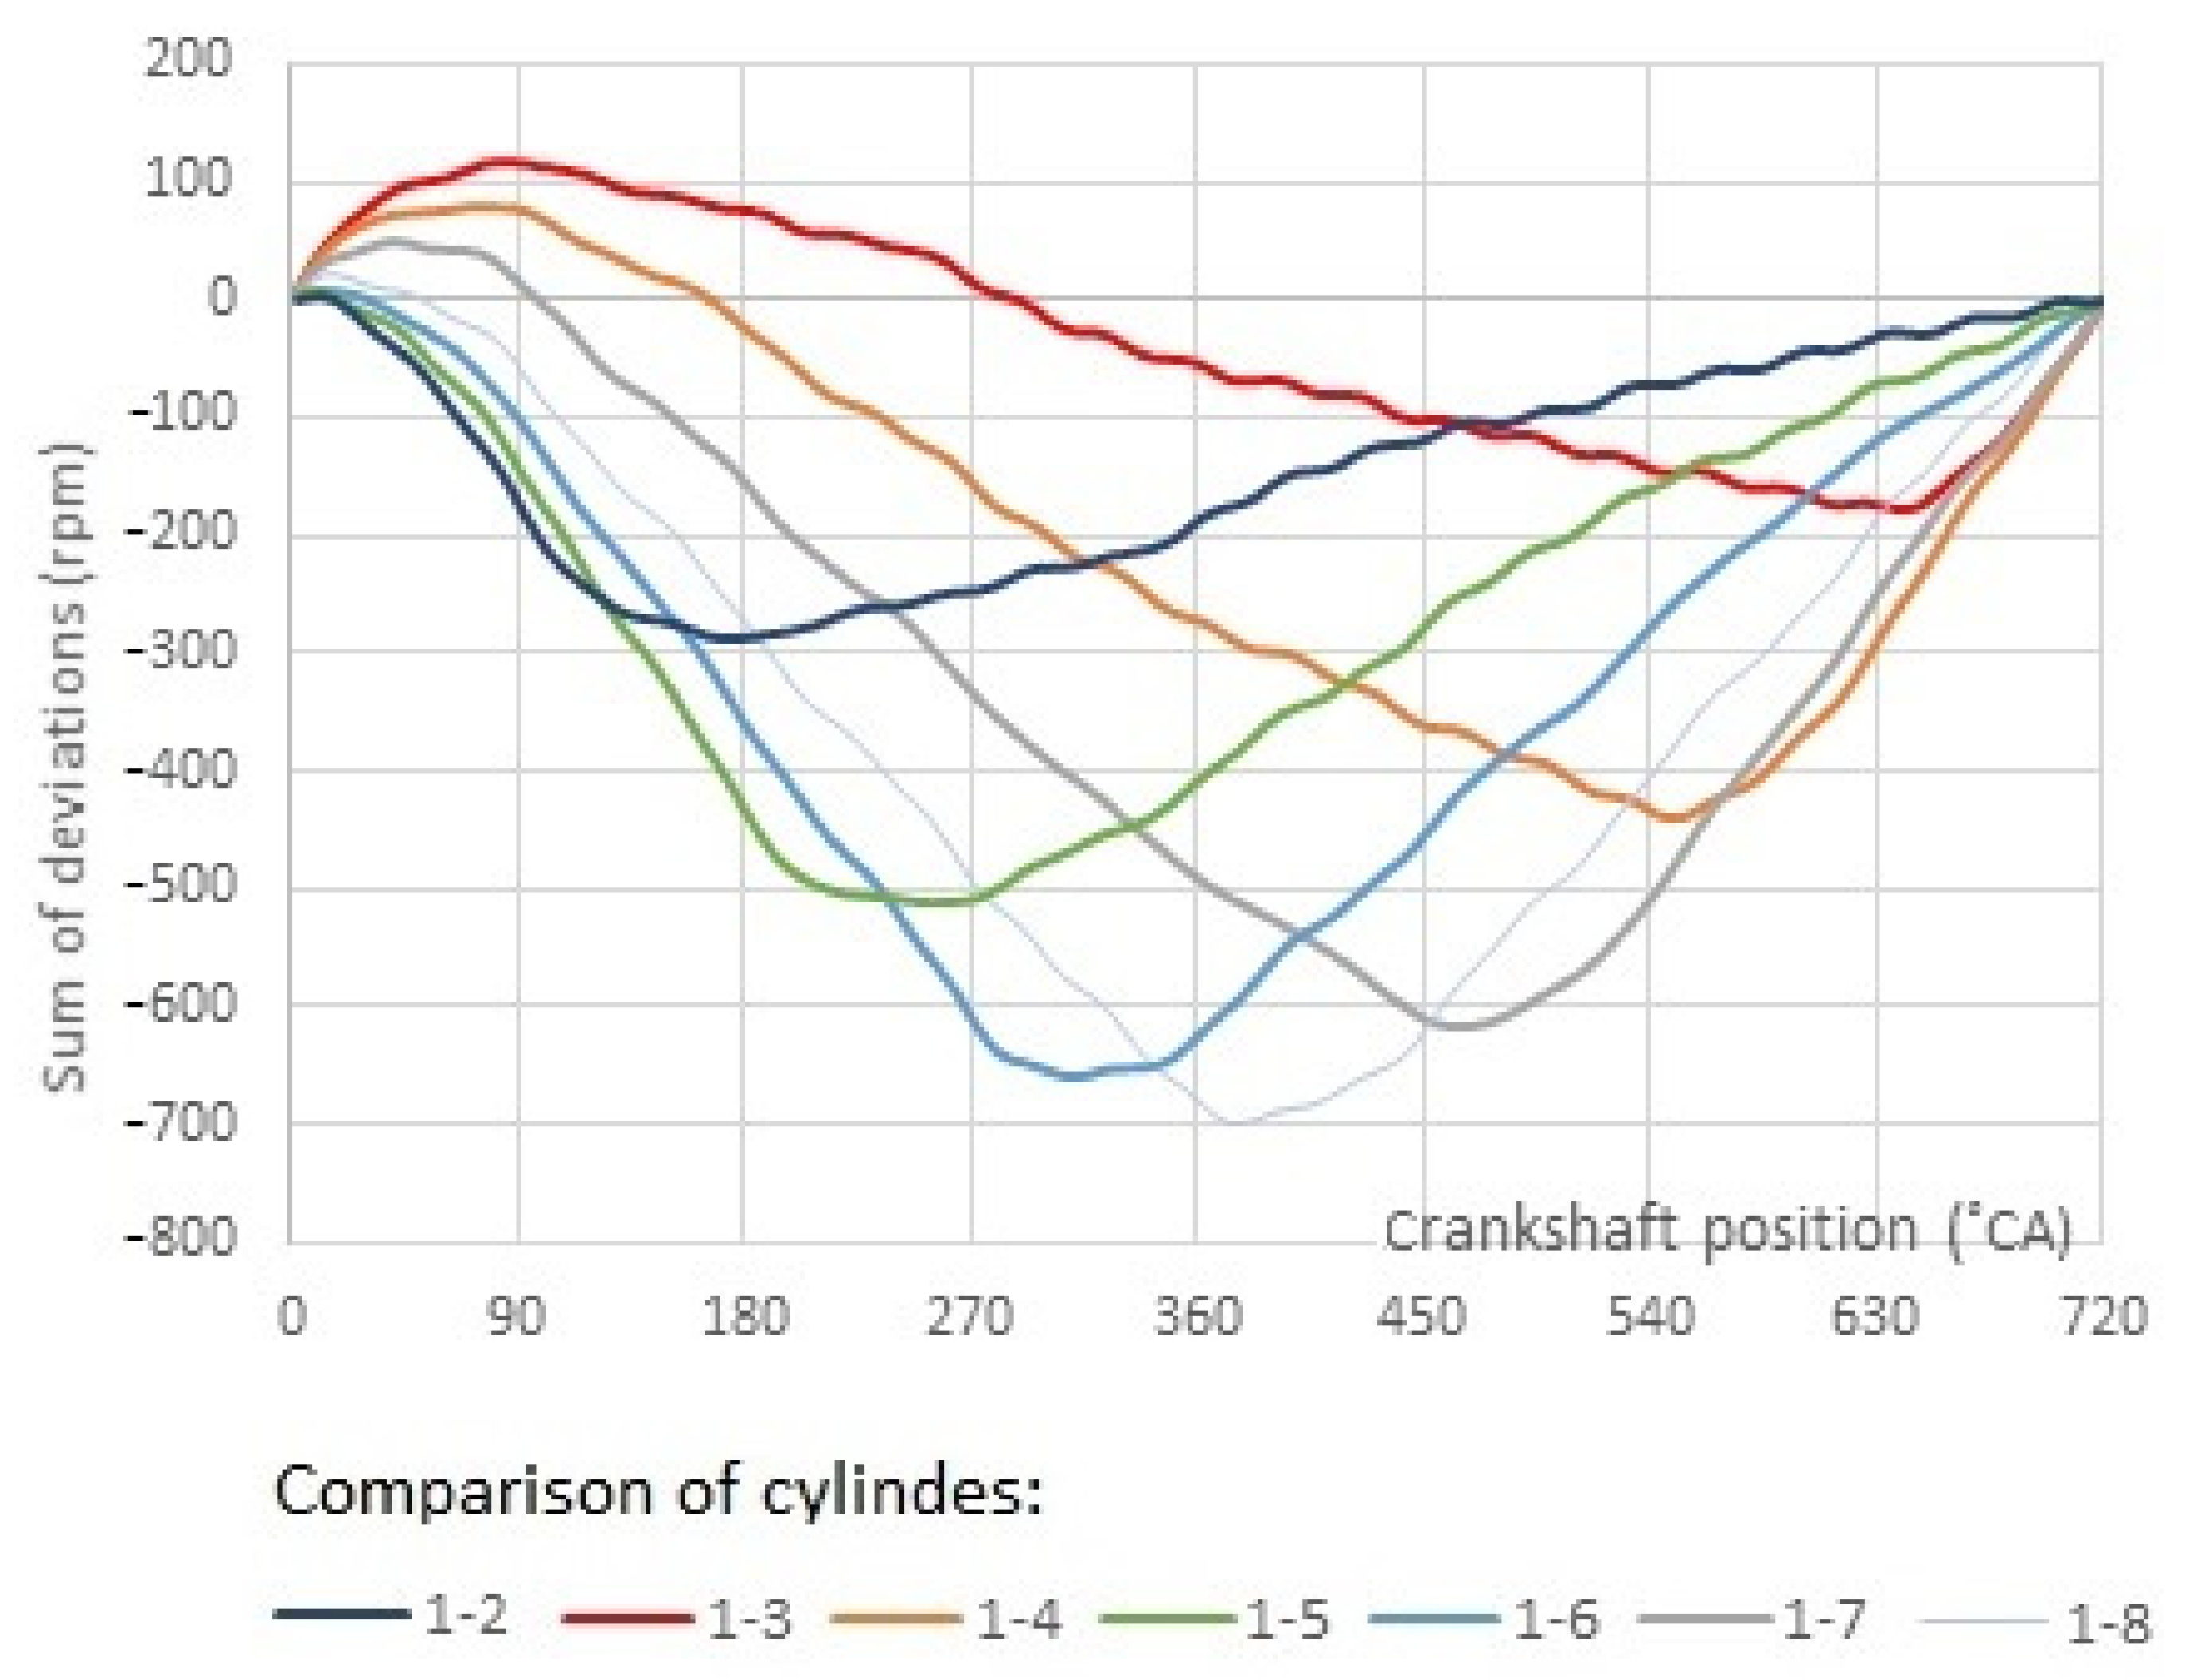
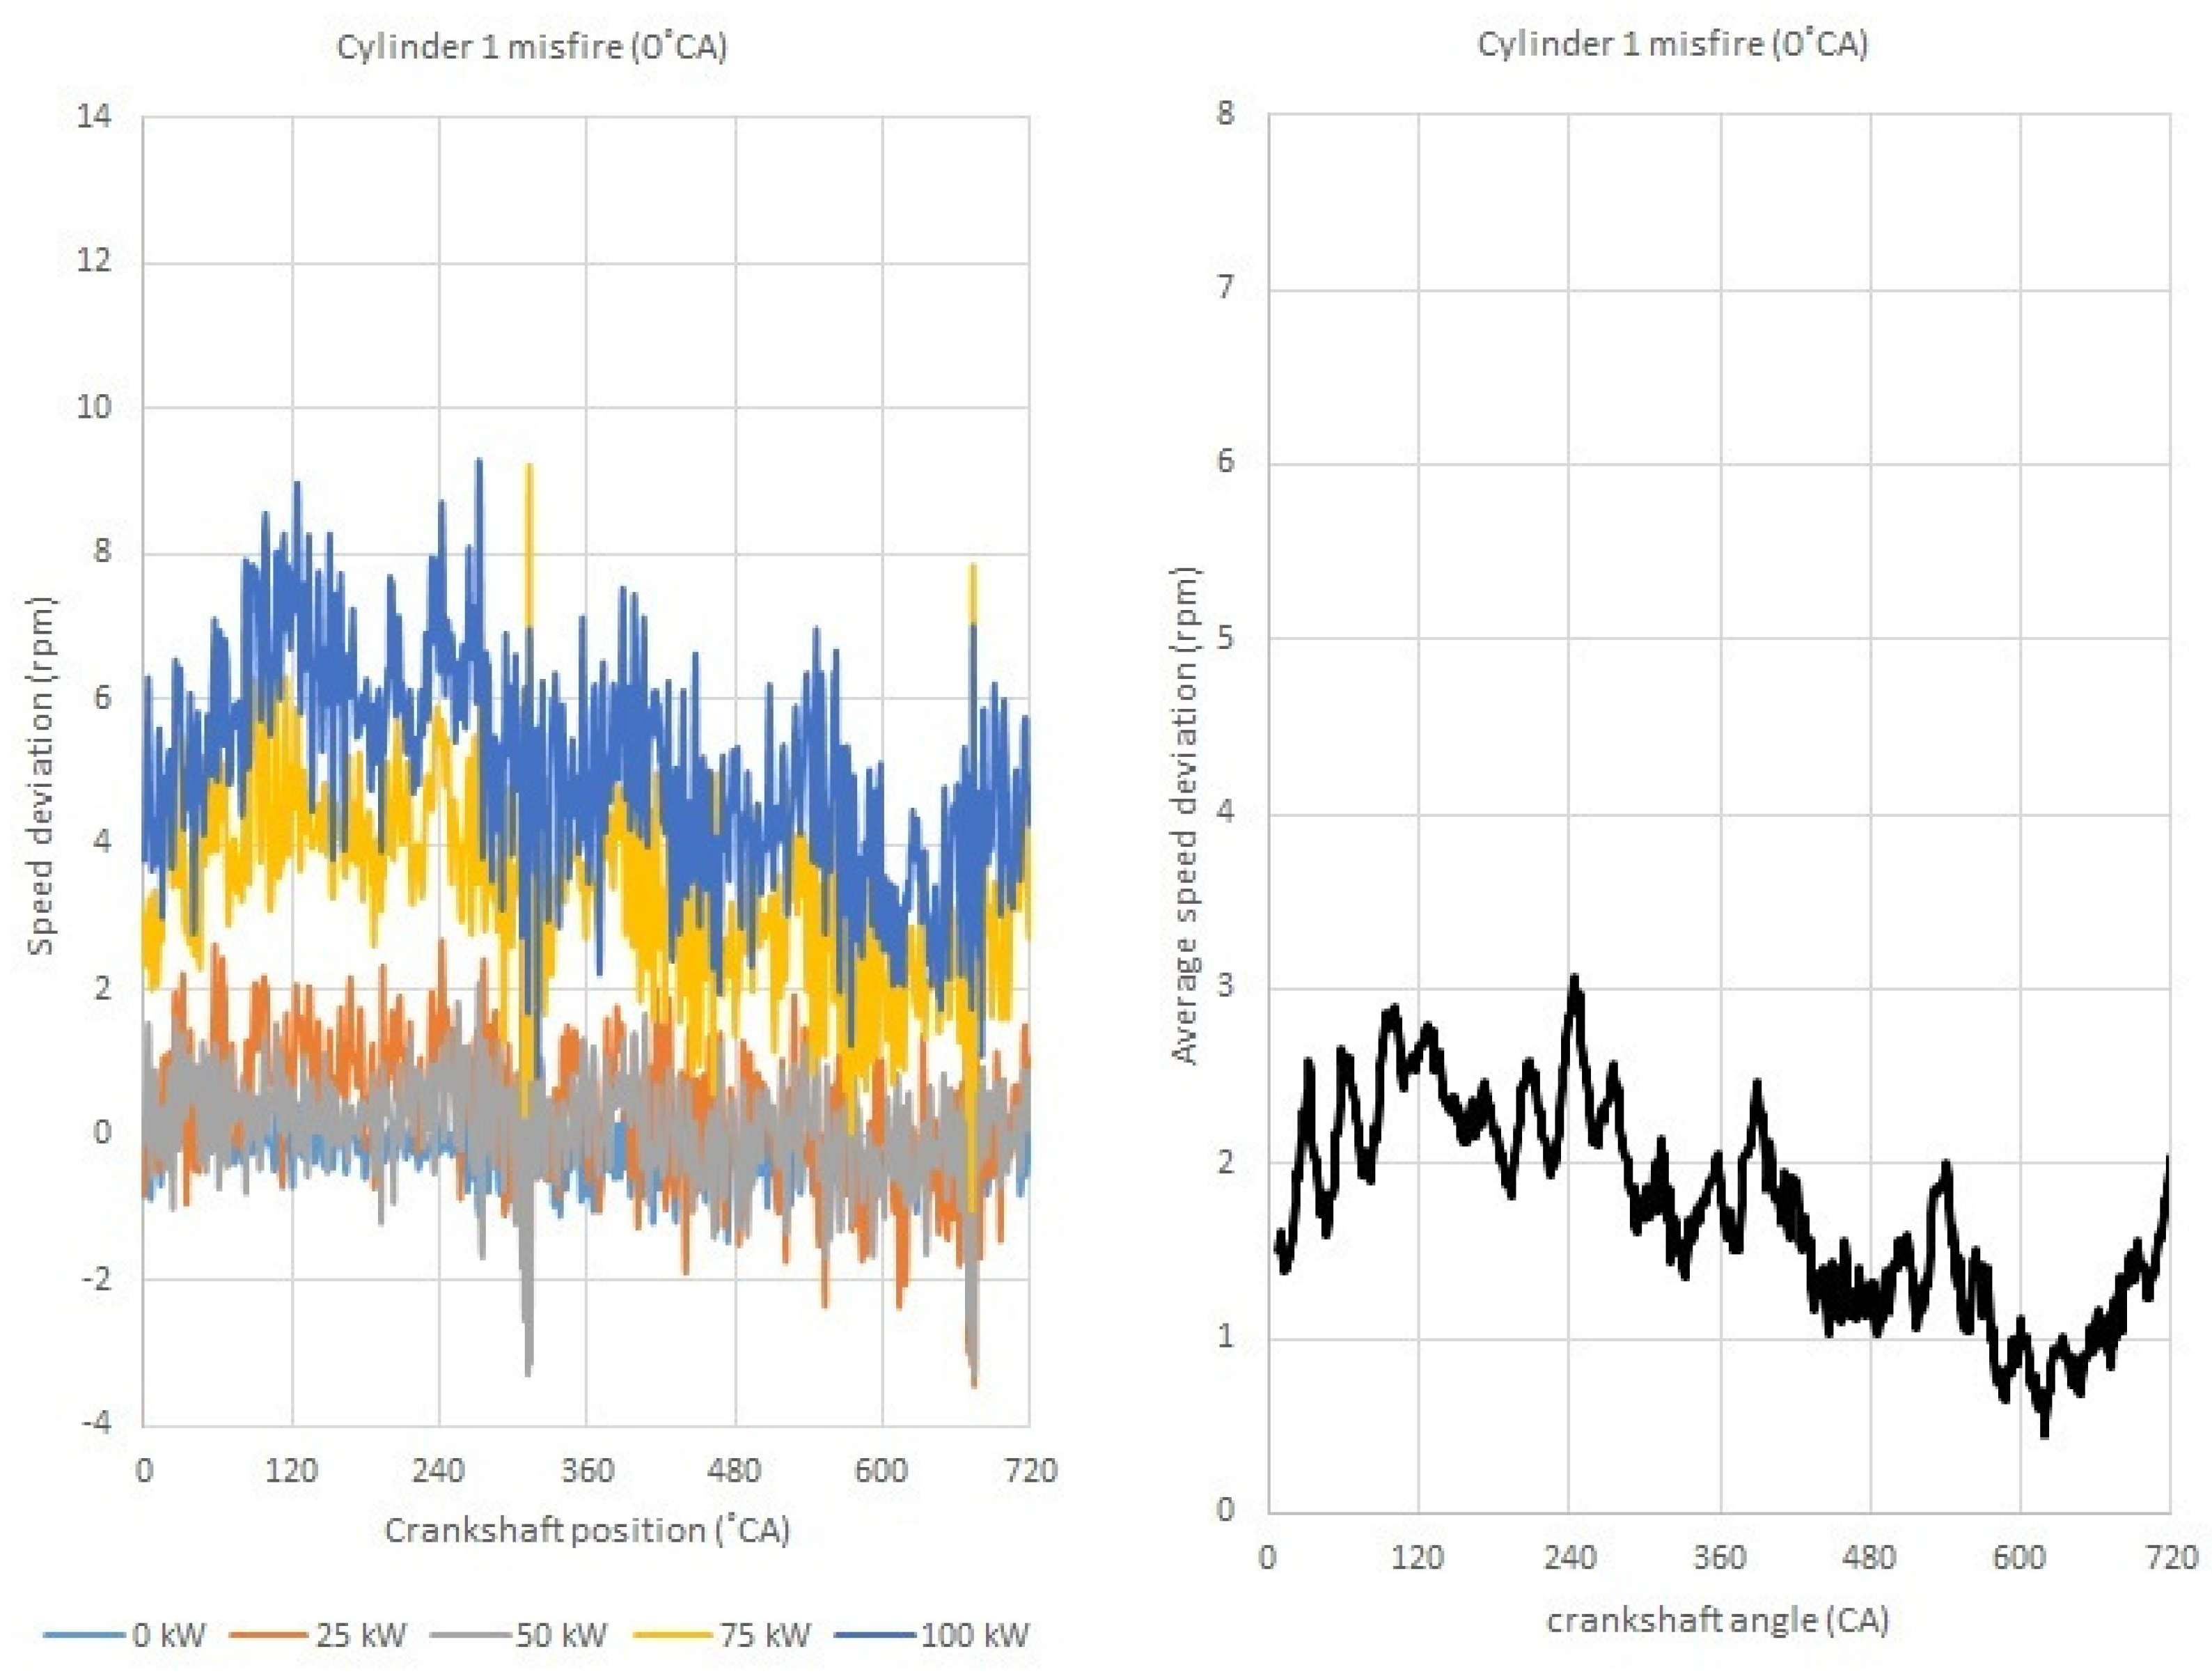
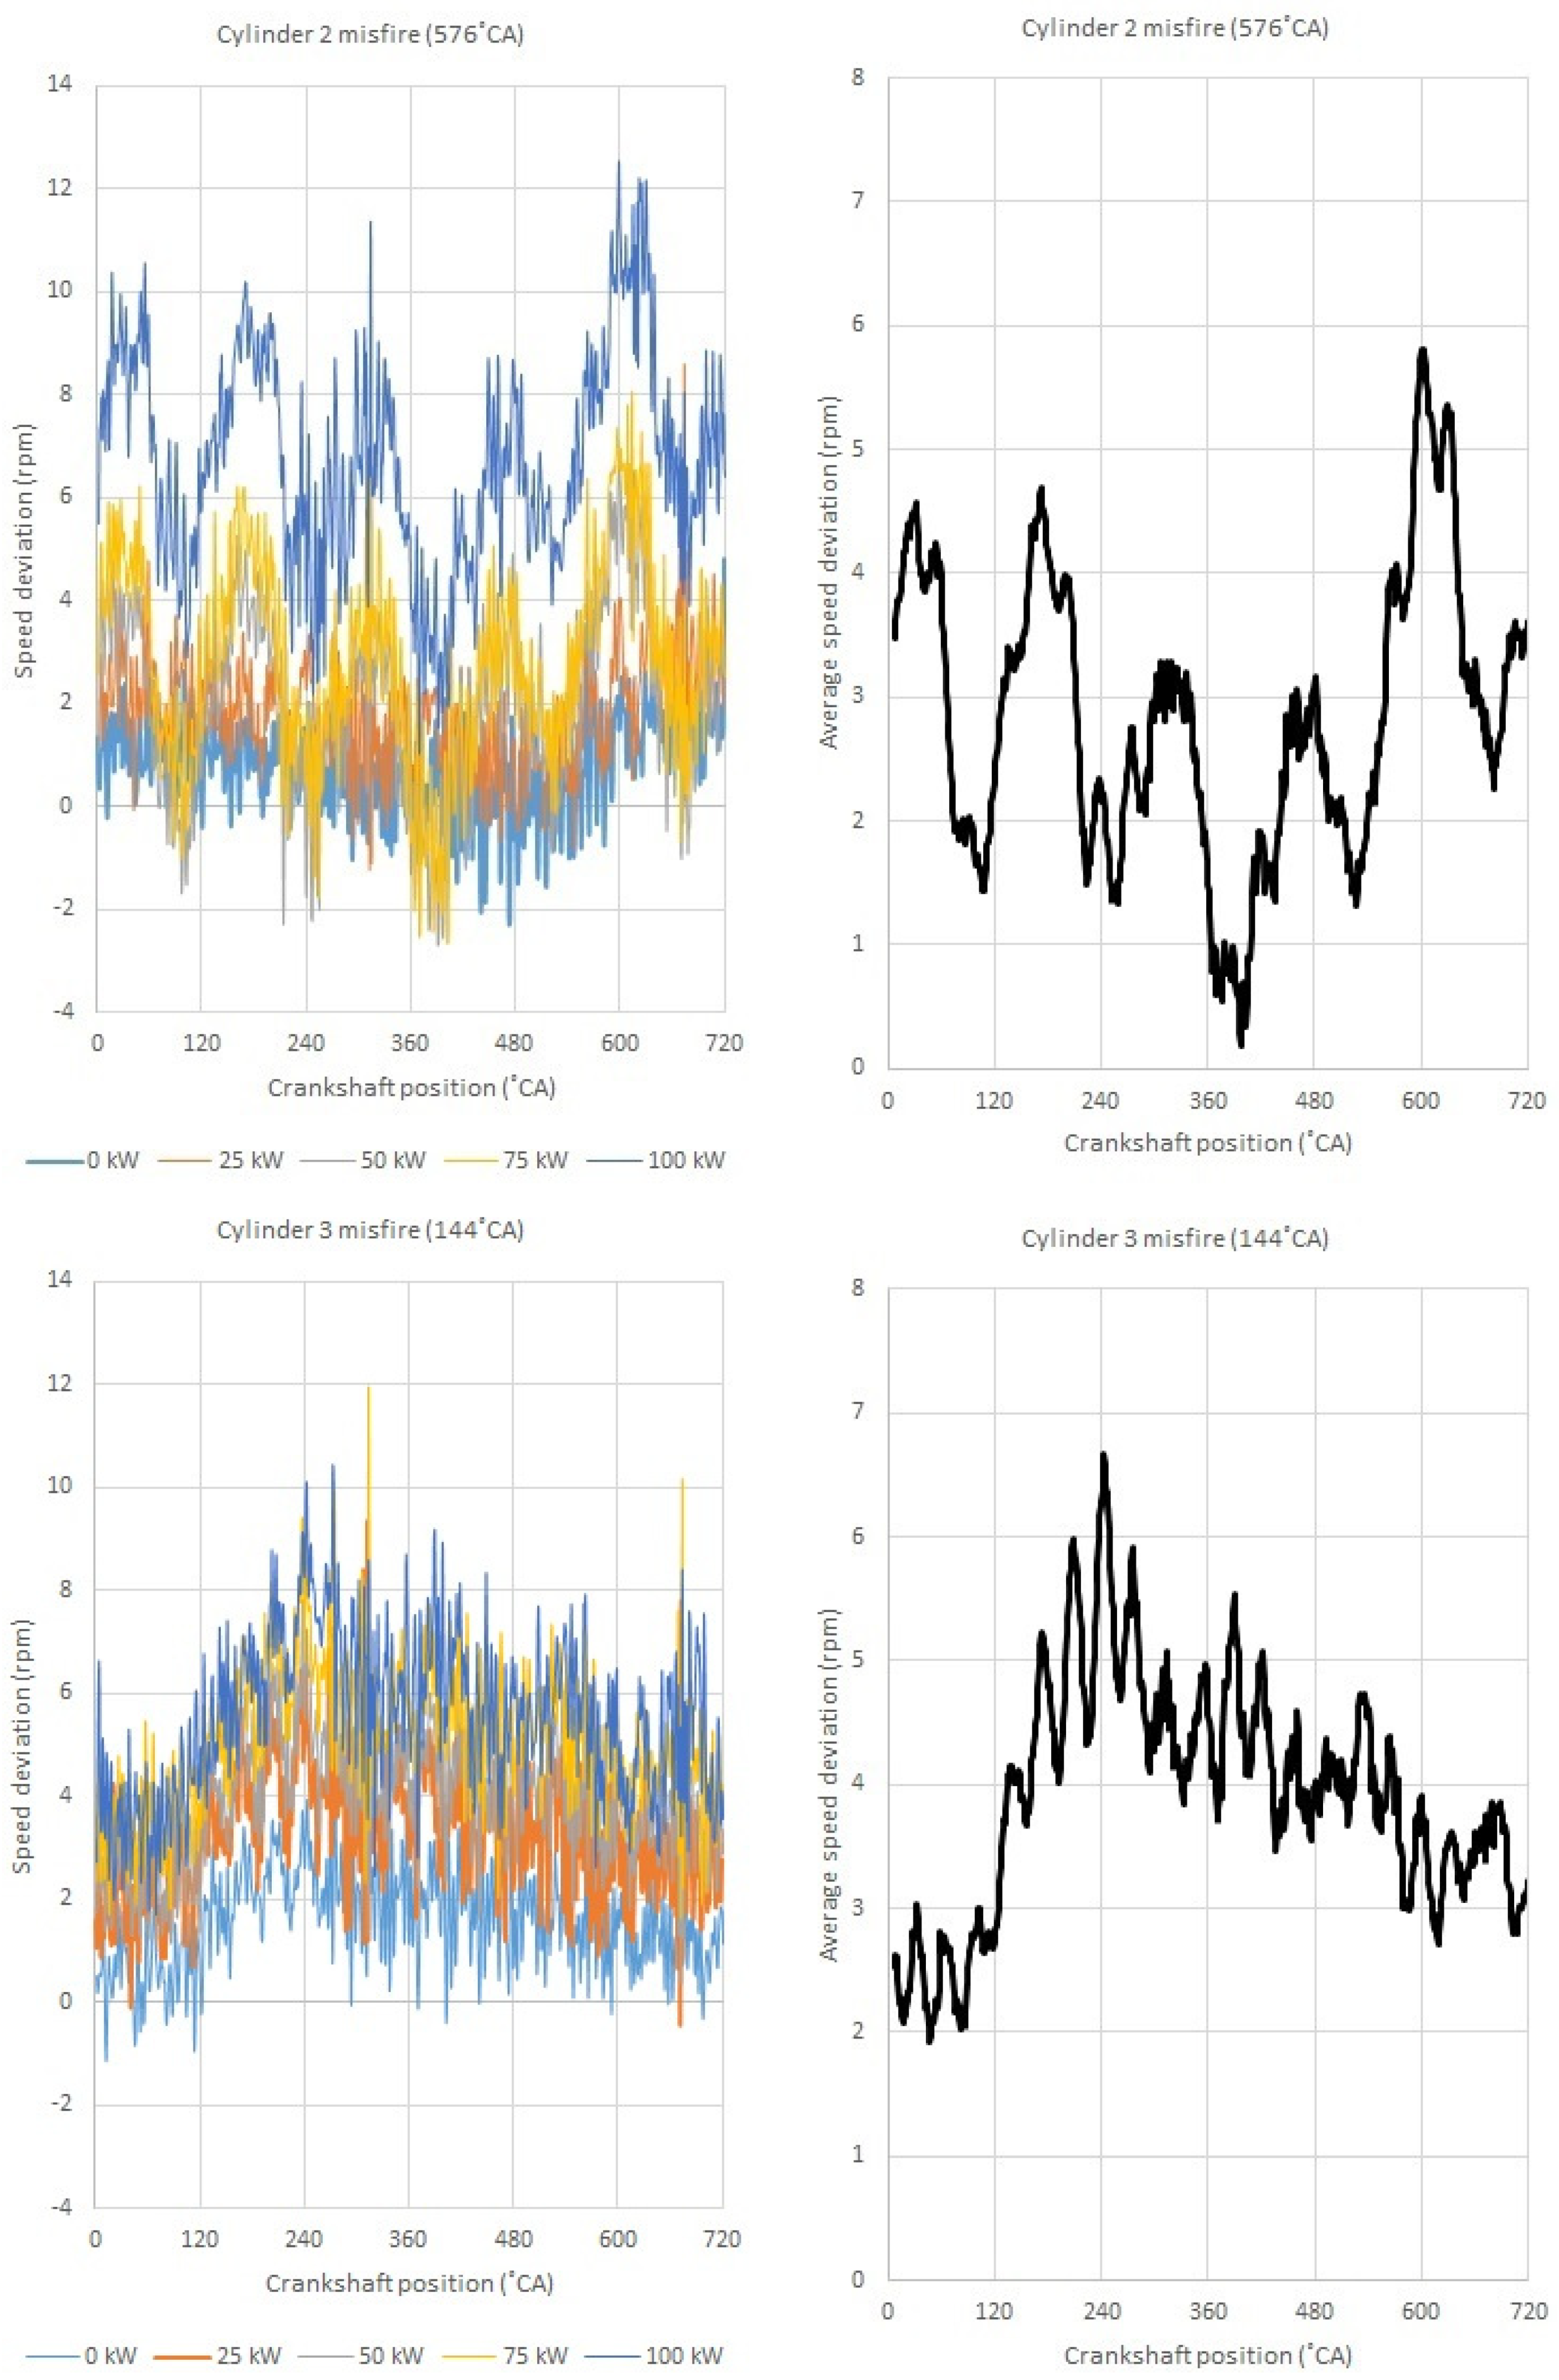
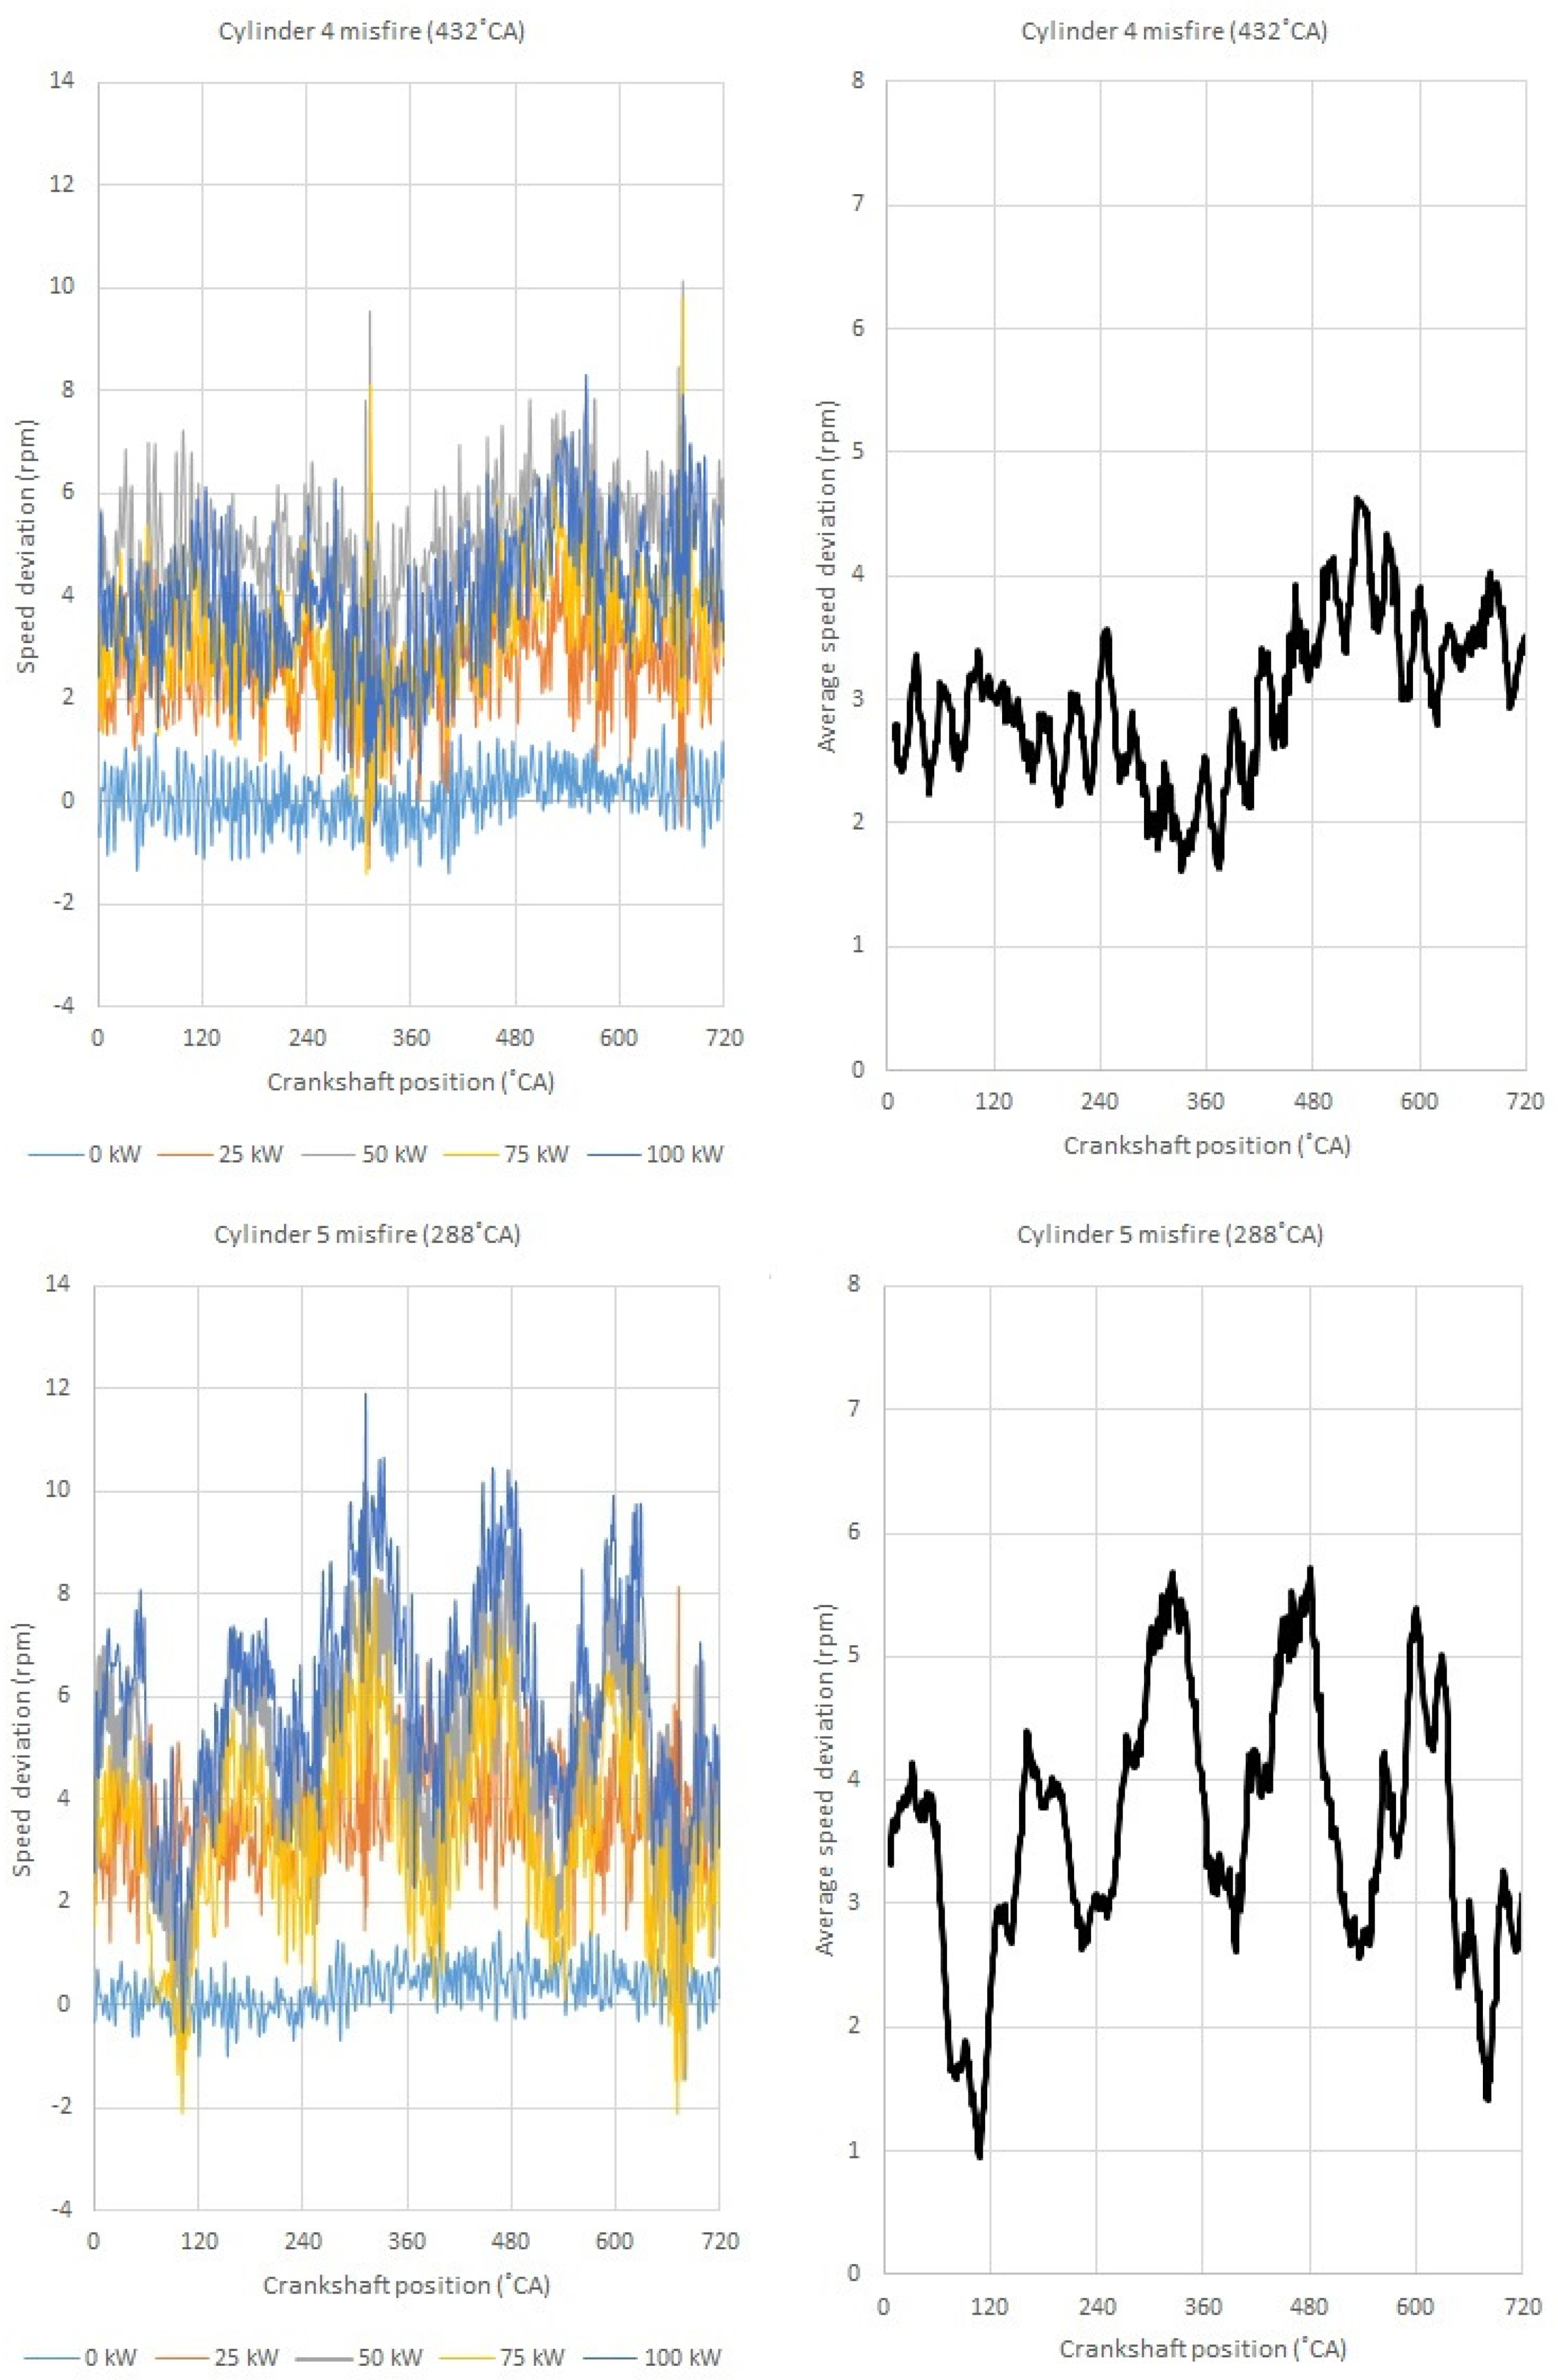
  • The deviation from the calculated average for full revolutions m of the engine’s instantaneous rotational speed for each position of the crankshaft allows the technical condition of the engine in the transient state to be evaluated and makes it possible to identify the cylinder system, causing the reduction in engine performance.
  • For a given engine and load, there are optimum m and n values that allow sufficient assessment for practical changes in the load and technical condition of the engine.
In addition, the experiment aimed at confirming the performance of the designed prototype by identifying the cylinder in which the combustion malfunction occurred. The authors presented the prototype system using the Arduino based I/O system with National Instruments NI-USB-6210 card. The solution presented in the paper was filed for patent protection and now has the status of national and European patent applications [49,50].
The presented experiment showed the applicability of the proposed system, so the authors had the grounds to build the next generation system, which would be completely based on Arduino or an alternative controller. The next-generation prototype was planned to be built with an Artmega 2560 microcontroller (2560 16CUR, Microchip Technology, Chandler, AZ, USA) installed on Arduino Mega 2560 (Rev. 3, Arduino, Turin, Italy) or Arduino Industrial 101 board (101 LGA module, Arduino, Turin, Italy).

3. Materials and Methods

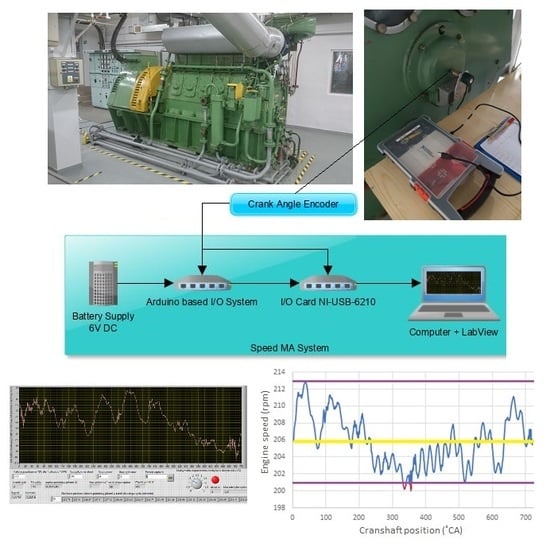
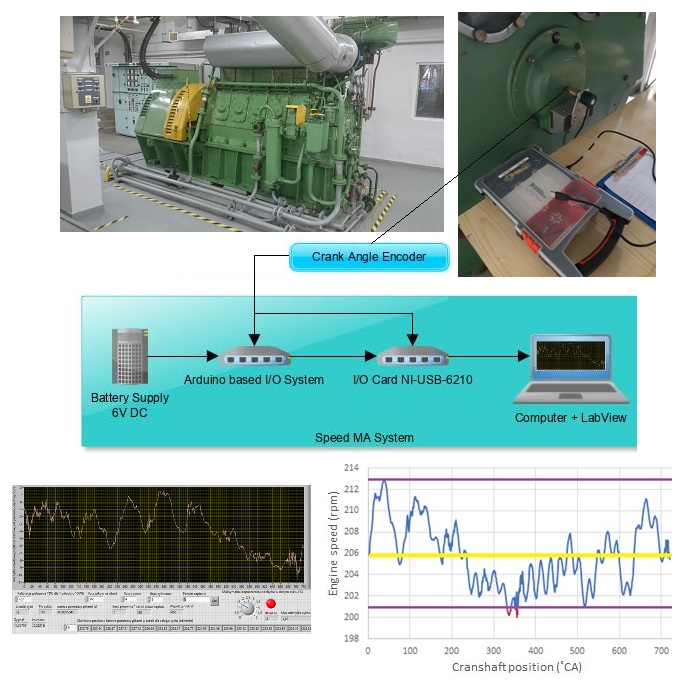
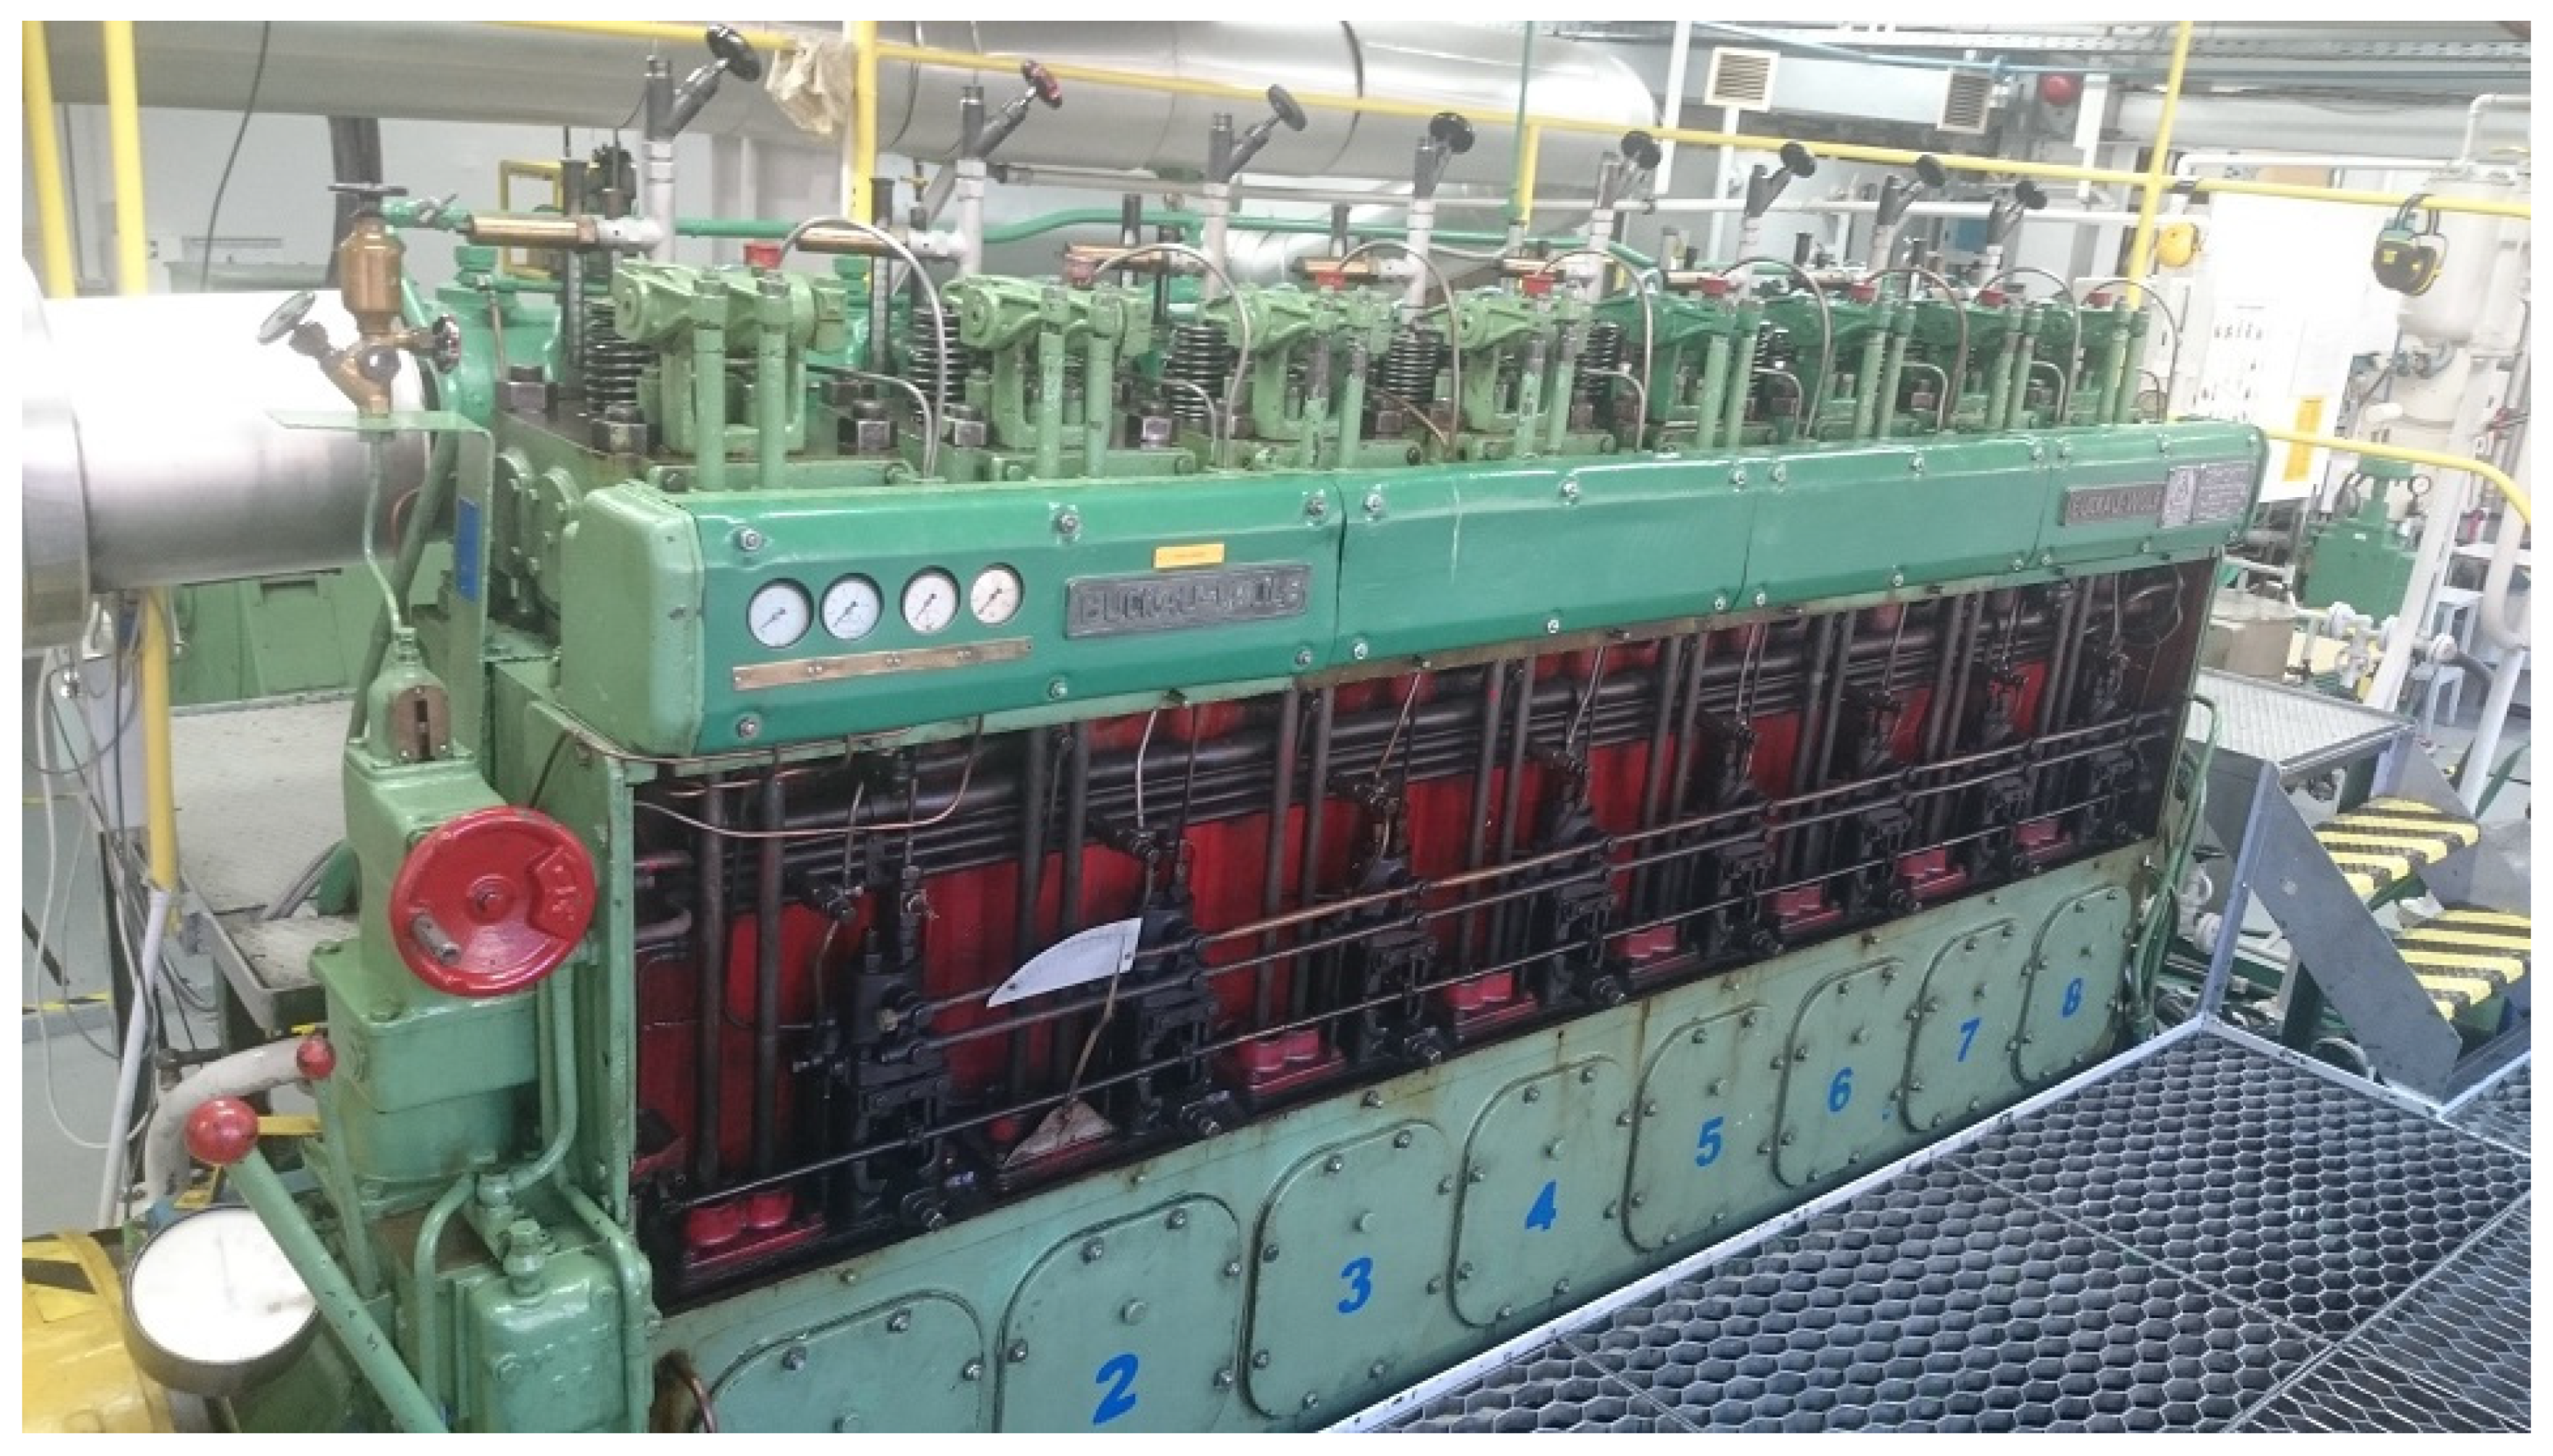
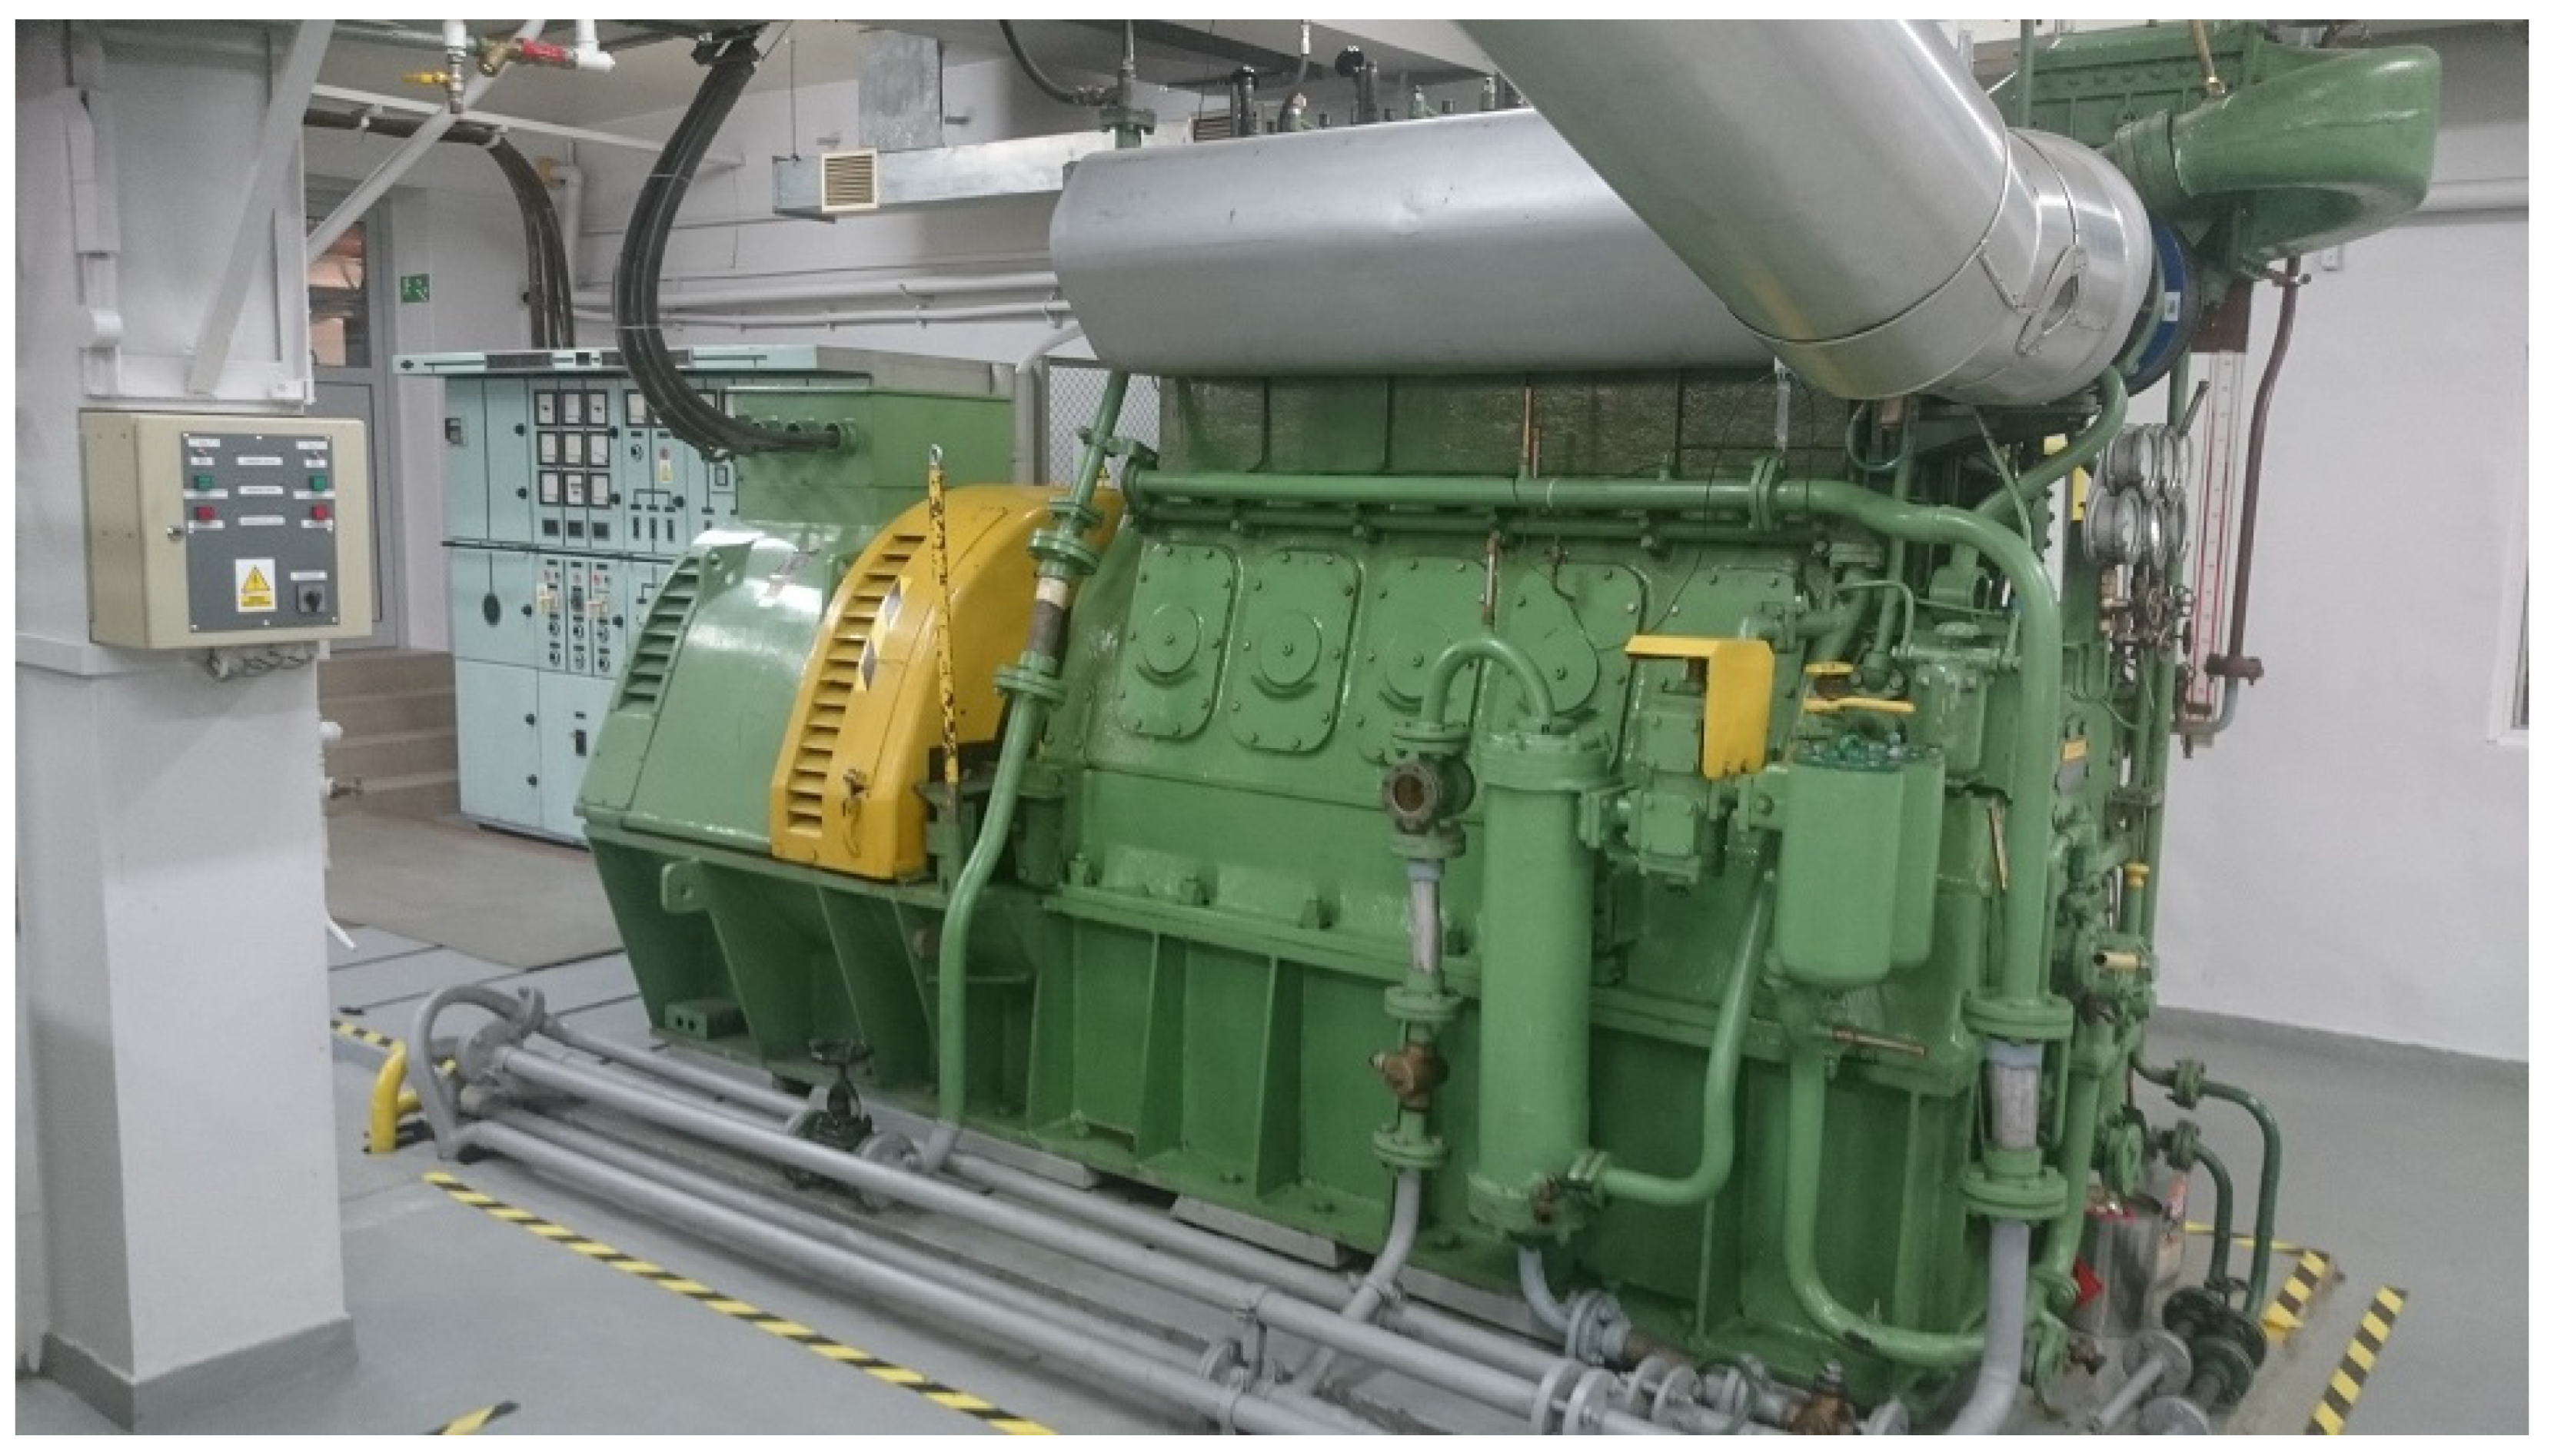
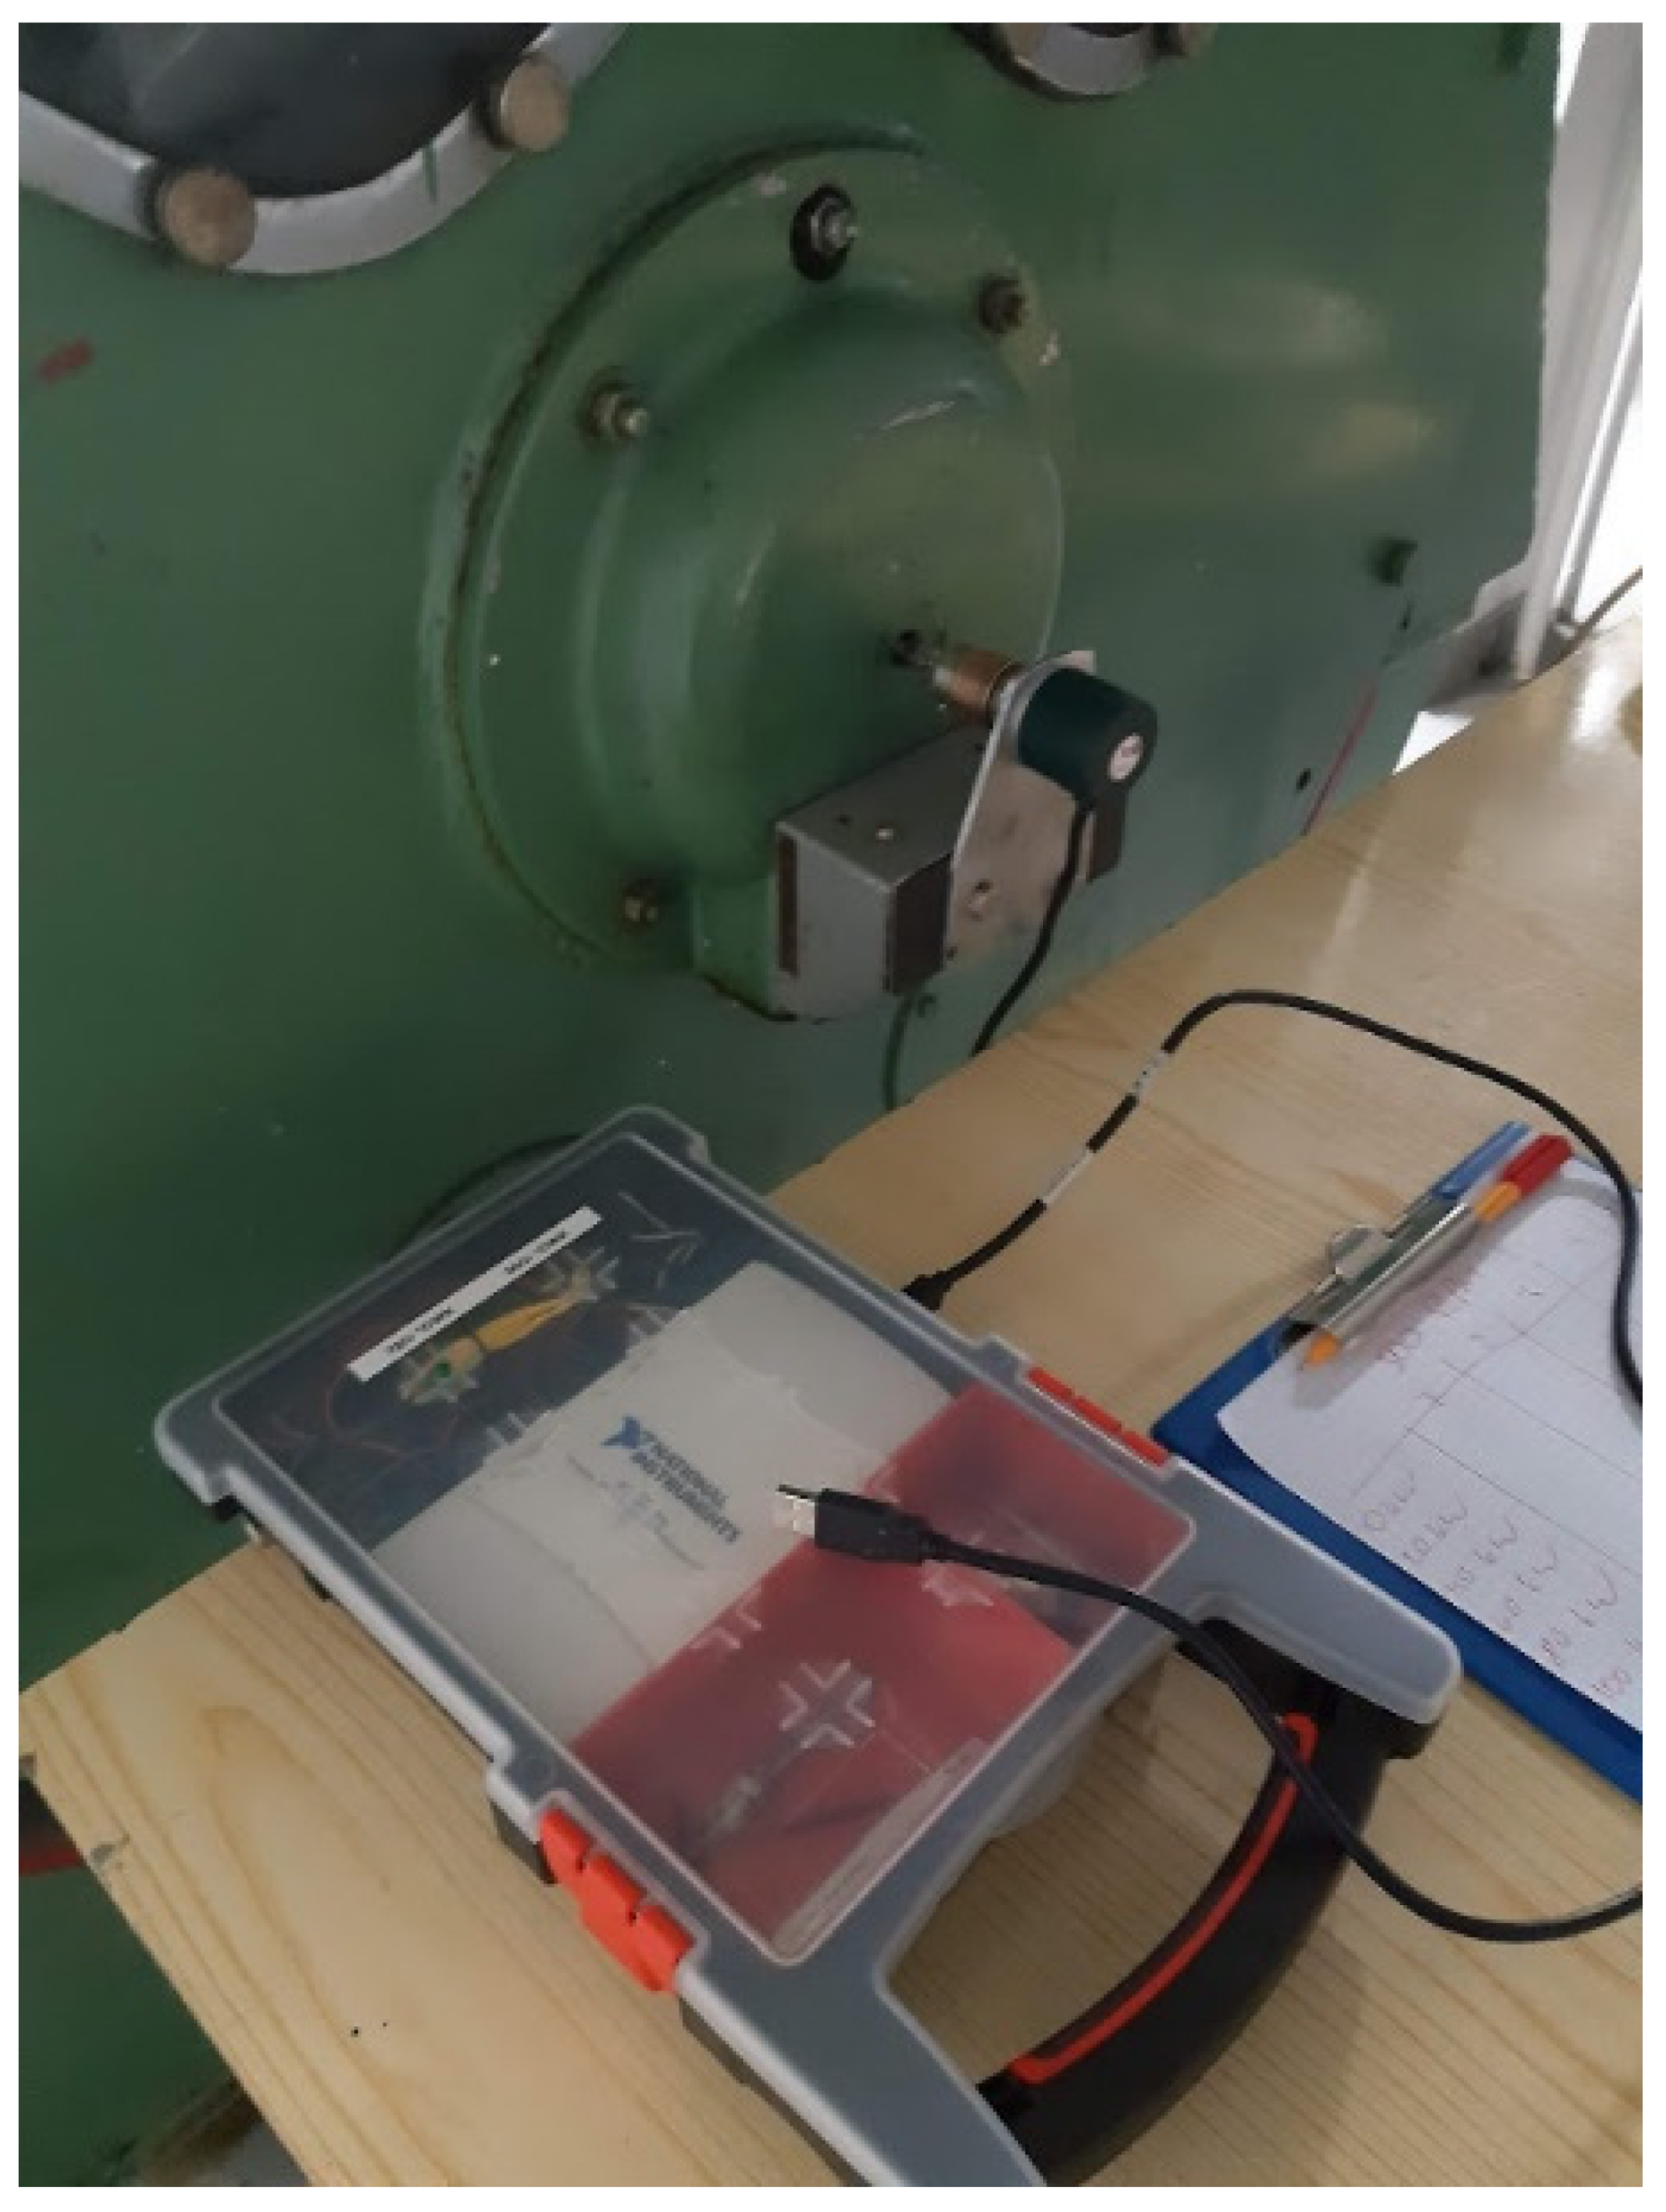
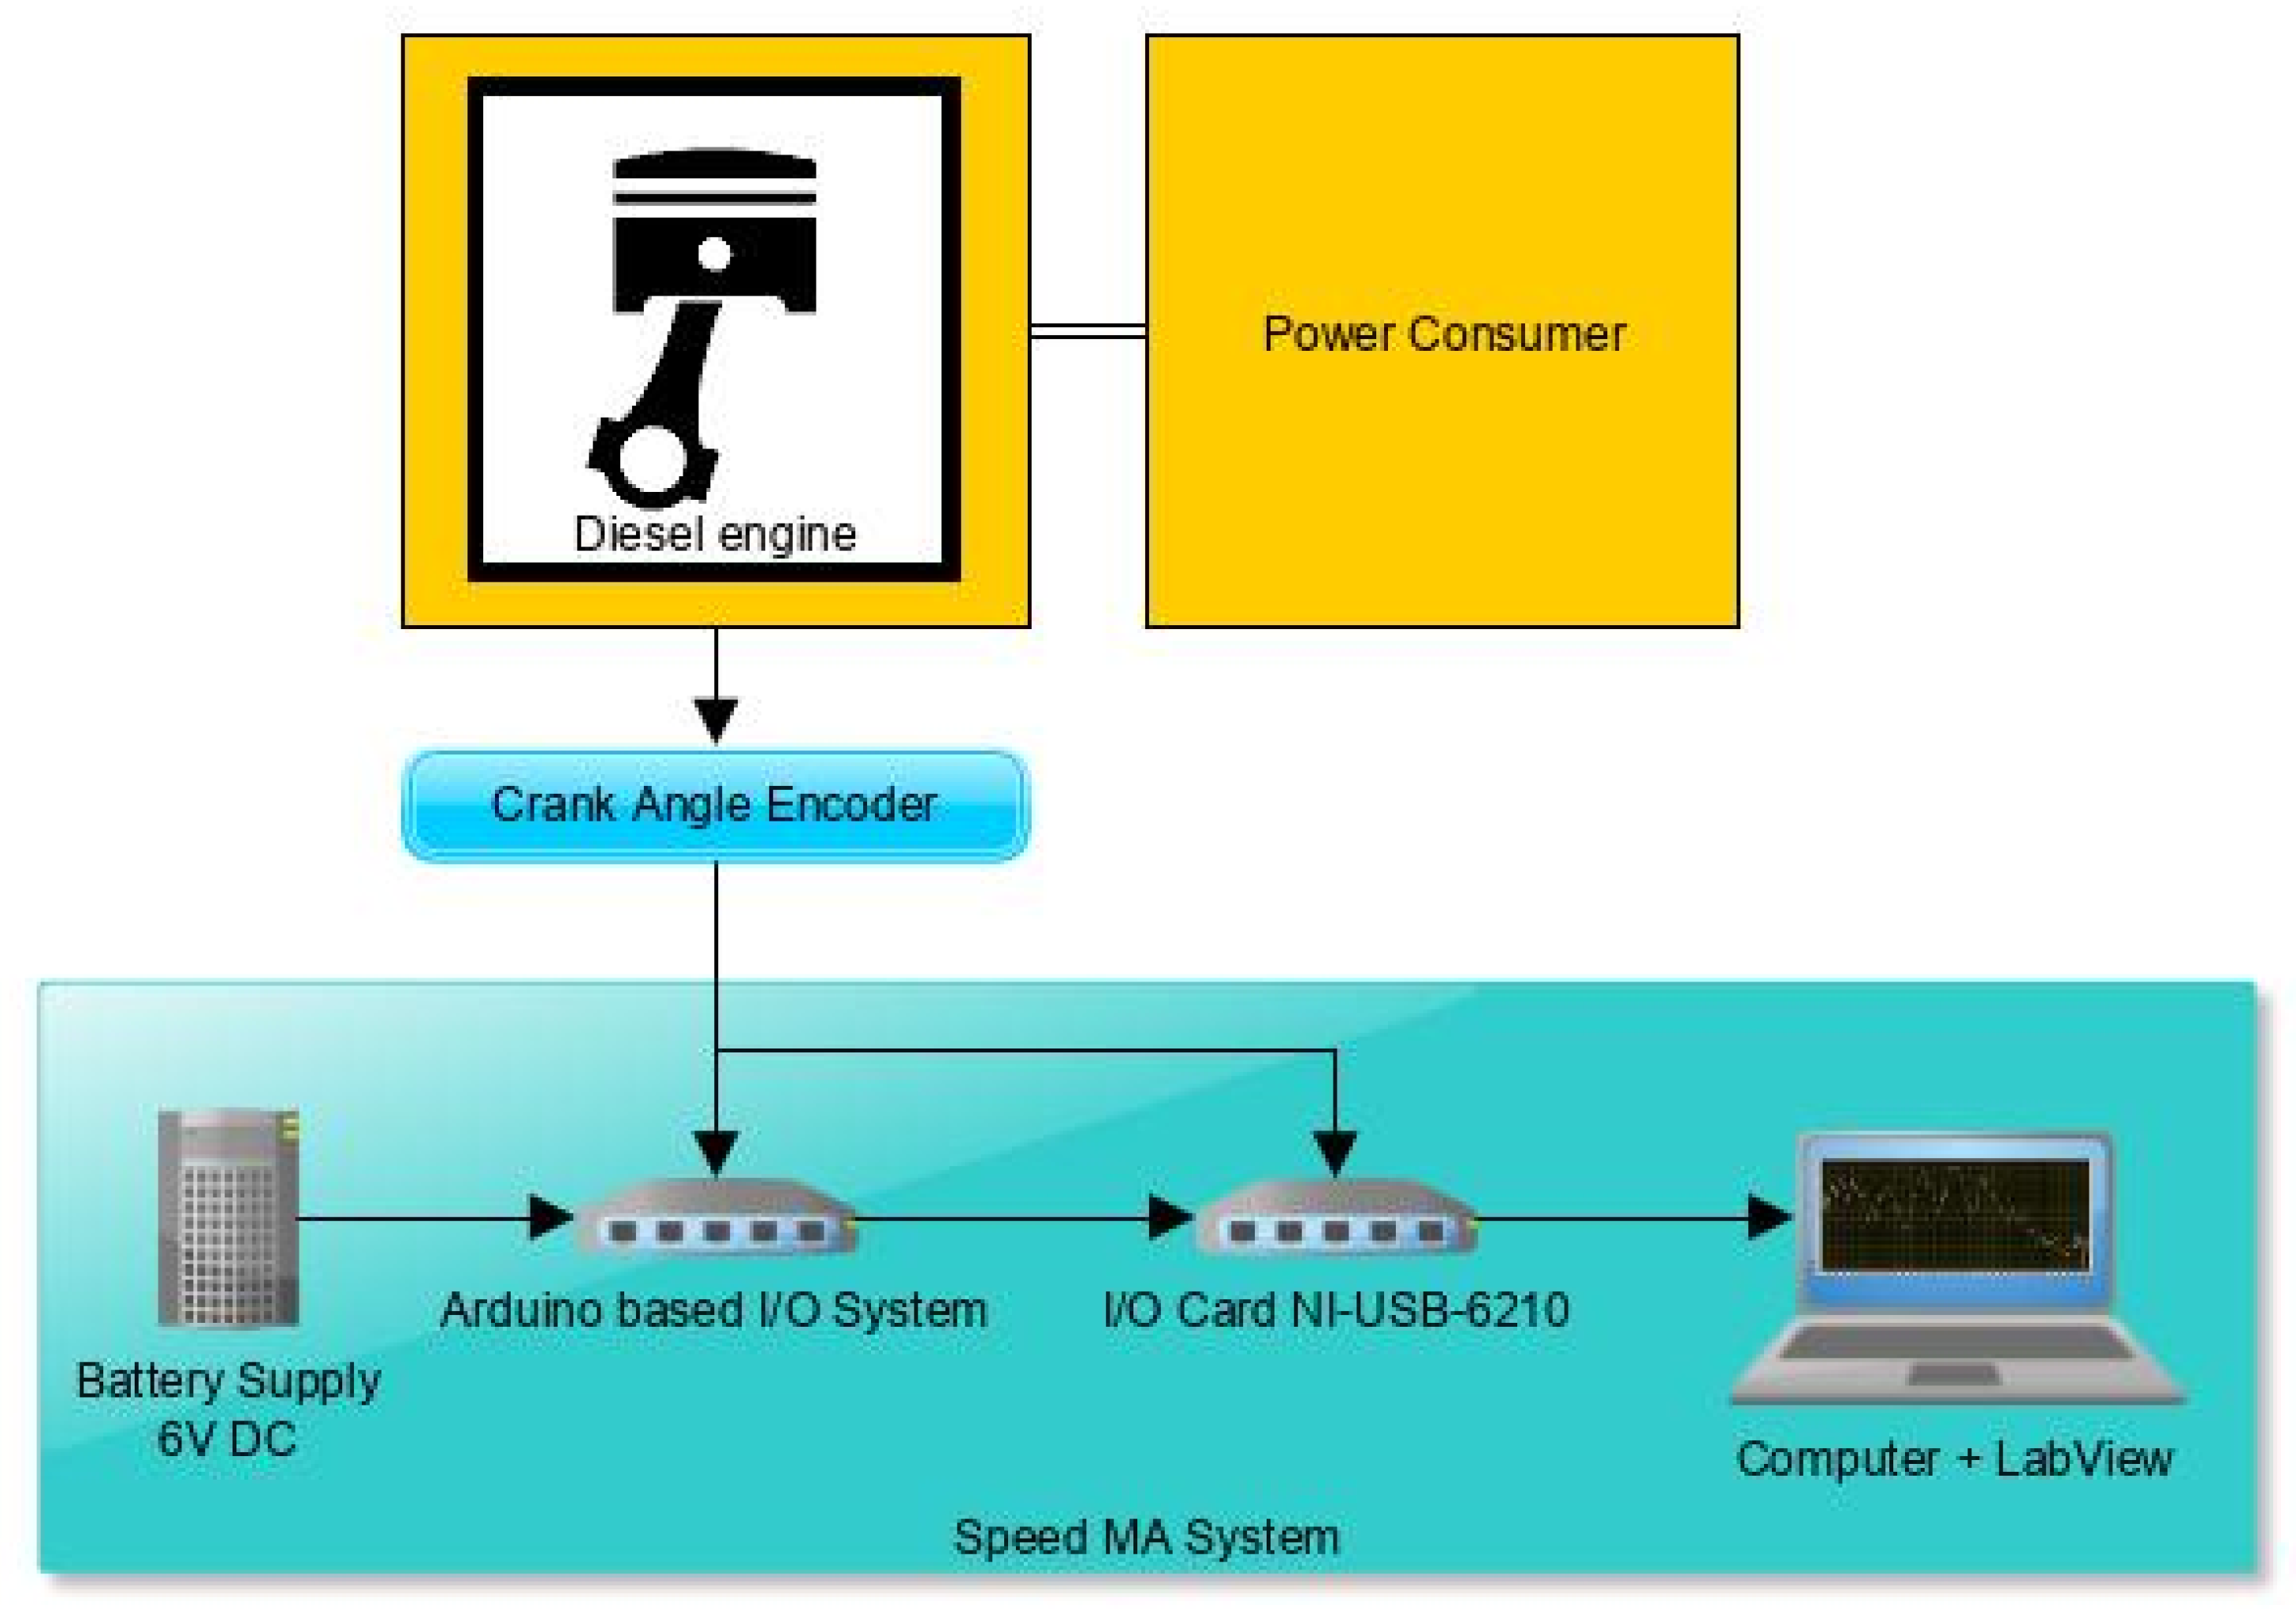
3.1. Test Subjects and Measuring System

Tests were carried out using a Buckau-Wolf R8DV-136 engine (R8DV-136, VEB SKL, Magdeburg, Germany) directly driving a fixed-pitch ship propeller and a Sulzer 5 BAH 22 engine driving (Sulzer 5 BAH 22, ZUT Zgoda, Świętochłowice, Poland) an alternating current generator loaded with a water resistor. The technical details of both engines are given in Table 2 and Table 3.
The Buckau-Wolf R8DV-136 engine that was pre-tested is shown in Figure 1. Due to the high degree of the speed uniformity reaching 5% and the possibility of quickly suspending fuel pumps using the engine spanner (a dedicated tool for the fuel pump suspension), the engine is a very good research object for assessing changes in instantaneous rotational speed. The encoder for the contour position of the crankshaft was installed at the free end of the shaft.
The second engine used during measurements was the Sulzer 5 BAH 22 engine, shown in Figure 2. Power generators have tighter requirements for the permitted instantaneous speed variation compared with main propulsion engines, affecting the correct synchronization conditions and the quality of the produced electricity. These features were the reason for selecting this engine as a test subject to verify the proposed method for diagnosing malfunctions in engine combustion processes.
Fuel system malfunctions were simulated by opening the fuel vent valve at the injection valve affected by the malfunction. An engine crankshaft angle encoder was connected to the shaft using a factory threaded mounting hole in the shaft, as shown in Figure 3.
Figure 4 shows a diagram of the measurement system, which consists of a National Instuments USB (Universal Serial Bus) measurement card (NI-USB-6210, National Instruments, Austin, TX, USA) and an Arduino Mega 2560 microcontroller (Rev. 3, Arduino, Turin, Italy) integrated with an Arduino UNO board (UNO, Arduino, Turin, Italy).
Additionally, the microcontroller had its own 6 V power supply so that the control signal from the encoder did not shift due to the disappearance of the TDC (top dead center) indication of the first cylinder due to turning the computer program off/on. The data collected by the system was processed and visualized using LabView 2018 software (2018 version, National Instruments, Austin, TX, USA).
The encoder had a resolution of 360 samples per revolution, and an additional control signal emitted once per revolution. According to the authors’ tests, this was sufficient to properly investigate the phenomena occurring during the engine combustion process up to 2000 rpm, i.e., all 2-stroke and 4-stroke engines used on ships. The four-stroke engine was characterized by two crankshaft rotations per cycle, which required the introduction of an additional impulse that correctly marked the beginning of the cycle on the first of the cylinders. This pulse could be bypassed with software at the time of installation on a two-stroke engine.
An Arduino microcontroller with its own power supply was installed in the measuring system with the USB card. By continuously interfacing with the engine, with the assistance of the algorithm, the microcontroller accurately marked the position of the shaft, through which the algorithm determined the start of combustion in each of the cylinders and the ignition sequence of the engine. The measurement algorithm created in the LabView 2018 environment (2018 version, National Instruments, Austin, TX, USA) was in operation when information about the beginning of a new cycle appeared by closing the corresponding circuit (pin 11). Additionally, in order to facilitate proper interfacing with the engine, two LEDs (light-emitting diodes) were installed in the measuring system to provide information about the presence of a control pulse during each revolution (pin 8) and every two revolutions (pin 10). The signal generated by Arduino lasted 50 ms, then the microcontroller was reset and waited for a new control signal from the encoder. The program controlling the microcontroller was written in C++ and is included in Appendix A.
The graphic code for LabView 2018 was used. Two DAQ (data acquisition) modules from the Lab-View library were used as input signals. Noise or signal distortion was removed by means of a six-points-based moving average filter. One main input that controls the main program loop was controlled by a 0˚CA (TDC) signal in the first cylinder. The impulse signal from the crankshaft pivot points, on the other hand, forced the time reading from the card clock. A computer equipped with an algorithm enabled the continuous supervision of the impulse time, after which the transformation was converted into an instantaneous speed, which directly corresponded to the combustion process occurring in the combustion chambers. It also allowed the waveforms to be saved to a text file, so they could be analyzed later.

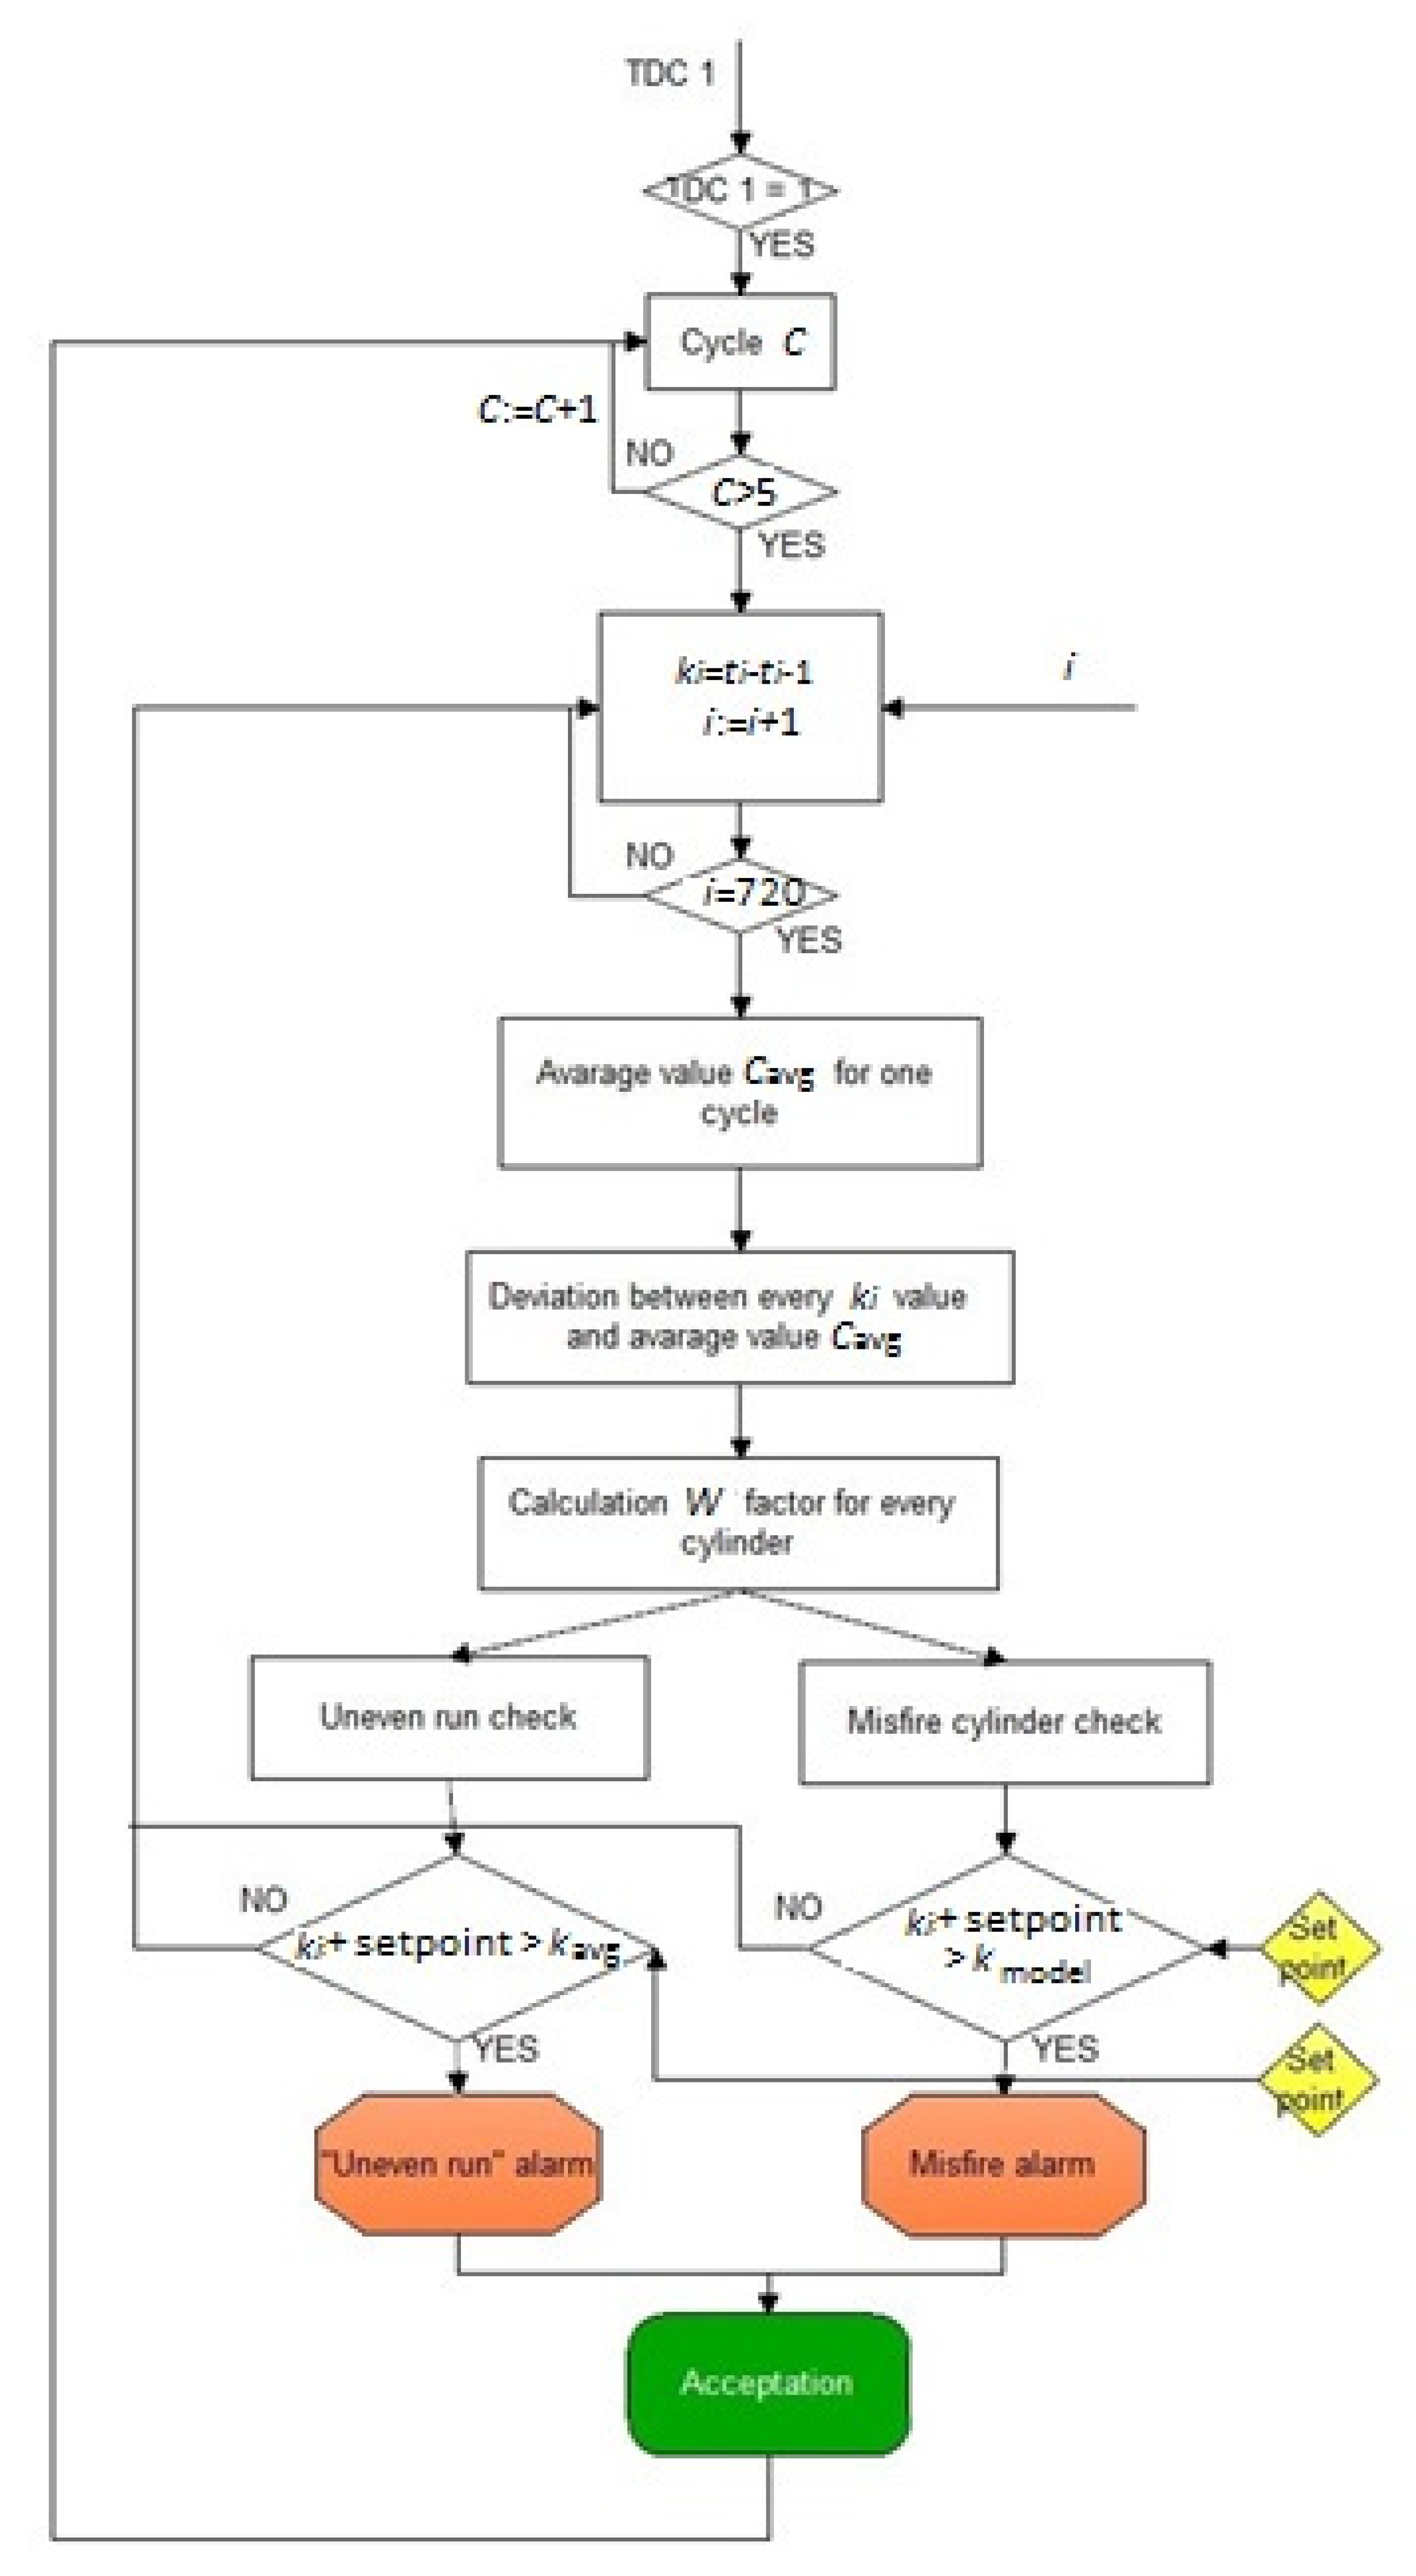
3.2. Measurement Data Processing Algorithm

To localize malfunctions during the combustion process, a signal processing algorithm in the SpeedMA system was used, which was implemented as a LabView 2018 program, whose description and graphic form are presented below. The algorithm calculated the time between the encoder impulses and determined the value of the real instantaneous speeds between impulses for the entire operating cycle.
t x = i x i x 1   ( ms sample )
n x = 1 t x ( ms sample ) · 1000 ( ms s ) · 60   ( s min ) · 2 ( rev 720   samples )   ( rpm )
where: tx—time for a given encoder position, ix, ix−1—impulses sent by the encoder, nx—instantaneous rotation speed.
After an entire cycle, the average instantaneous rotational speed and the deviation from the value for each of the collected measurements were calculated:
n ¯ = i = 1 720 n x 720   ( rpm )
Δ n d i v   x = n x n ¯   ( rpm )
where: n ¯ —average instantaneous rotation speed for the cycle, Δ n d i v   x —the deviation from the average value for each of the measurements over the cycle.
To correctly evaluate the deviation of individual cylinders, the value of the crankshaft rotation angle should be determined, the range of which includes the maximum deviation, which would enable the monitoring software to compare it with the limit value to indicate the defective cylinder. For the purpose of the algorithm, this value was called the W coefficient. This value would vary depending on the type of engine, the number of strokes or cylinders, speed controller characteristics, and the condition of the engine itself and its design. Based on our own measurements, we assumed that the angle in the cylinder number function would take the following general form, which should be estimated during calibration using a real engine test/survey:
W = ( 1 2 + 1 i ) C   ( ˚ CA )
where: i—cylinder count, C—the number of measurements in a full operating cycle, depending on the number of piston strokes per 1 operating cycle (C = 360 for a 2-stroke engine, and C = 720 for a 4-stroke engine).
In order to determine the exact W coefficient for a given engine, a calibration measurement must be carried out (Figure 5), which should take place under the conditions set for each of the possible operating loads. Then, a controlled malfunction should be introduced in the form of a loss of injection process in a known cylinder. Depending on the engine type, this could be accomplished by suspending the fuel pump, opening the bypass valve, and setting the fuel dose to “0” on the selected cylinder. The collected data, in the ˚CA function, should be combined with each other by calculating the instantaneous deviation caused by the malfunction (Figure 6). For complete data collection and averaging, a similar measurement should be carried out for each engine cylinder.
The value sought by the algorithm was the maximum sum of negative values of the defective cylinder. The location where the highest drop in speed for a given system x occurred indicated a defective cylinder or one which was not fully operational. In the described calibration process, the simulated cylinder No. 1 was defective, so further analysis and selection of the appropriate calculation range would be carried out based on it. The authors proposed one of two methods for selecting the W coefficient: a graphical method illustrating simulations for the entire cycle range or a mathematical method.
When choosing the graphical method, the sum of the deviations of cylinder 1 should be compared with the sums calculated for each of the other cylinders as a crankshaft rotation function. The sought-after value was a crank angle, which represented the maximum negative deviation between cylinders and indicated the highest speed drop among all cylinders. The course of the simulation is shown in Figure 7. According to the chart below, each W value 288–719˚CA was within the range, but the largest total deviation for all cylinders was around 445˚CA. This value was close to the value of 450˚CA, calculated according to formula No. 3, which made it possible to apply a W coefficient of 450˚CA.
The mathematical calculation used to determine the interpolating function for a graph illustrating simulations and for solving the equation digitally or analytically was an alternative to a graphical representation:
d n d a = 0   ( rpm / rad )
By consecutively determining the maximum deviation values, we determined the angle at which the deviation reached its maximum (Figure 8). The result of the calculation was a graph and the resulting value of 435˚CA, which was close to the value from Equation (3). Therefore, the W value of 450˚CA would be used for further calculations.
Knowing the value of the W coefficient allowed the algorithm to calculate the sum of speed deviations within its range after each cycle, according to Equation (4). The resulting values were comparable to the reference values, which were continuously updated after each valid cycle according to Equation (5). If the deviation of the real value exceeded the set value nx in the program, the event was indicated as an alarm for the cylinder x equal to.
n x   c y l = i = 1 5 ( φ [ TDC , TDC + W ] n ( φ ) ) 5   ( rpm )
where i = 1–5 subsequent engine cycles, n( φ ) speed at crank angles in the range between TDC in a given cylinder and angle equal to TDC+W.
Simultaneously, the deviation of the real engine was checked using the measured deviation between the real and reference values. If the deviation in the instantaneous rotational speed nśr from the average n ¯ for any of the cylinders was exceeded, an operation irregularity alarm would be activated to inform the user. The example in the diagram in Figure 9 showed an average speed of 206 rpm for the instantaneous rotational speed of the engine. The permissible deviation in the software was set to ±5 rpm, and this value was exceeded for the range 330–360˚CA. This range corresponded to the combustion process occurring in cylinder 6; therefore, an activated alarm indicated that cylinder 6 was causing an irregularity. The presented algorithm is shown in block form in Figure 10.
The algorithm operated in a loop, which could be terminated by pressing the "stop" button. Monitoring was activated when the first 6 operating cycles were completed. This was due to the need to create reference values for the first 5 cycles, to which the real values would then be compared. The limit parameters could be changed by changing the setting in the program or by adjustments using potentiometers.

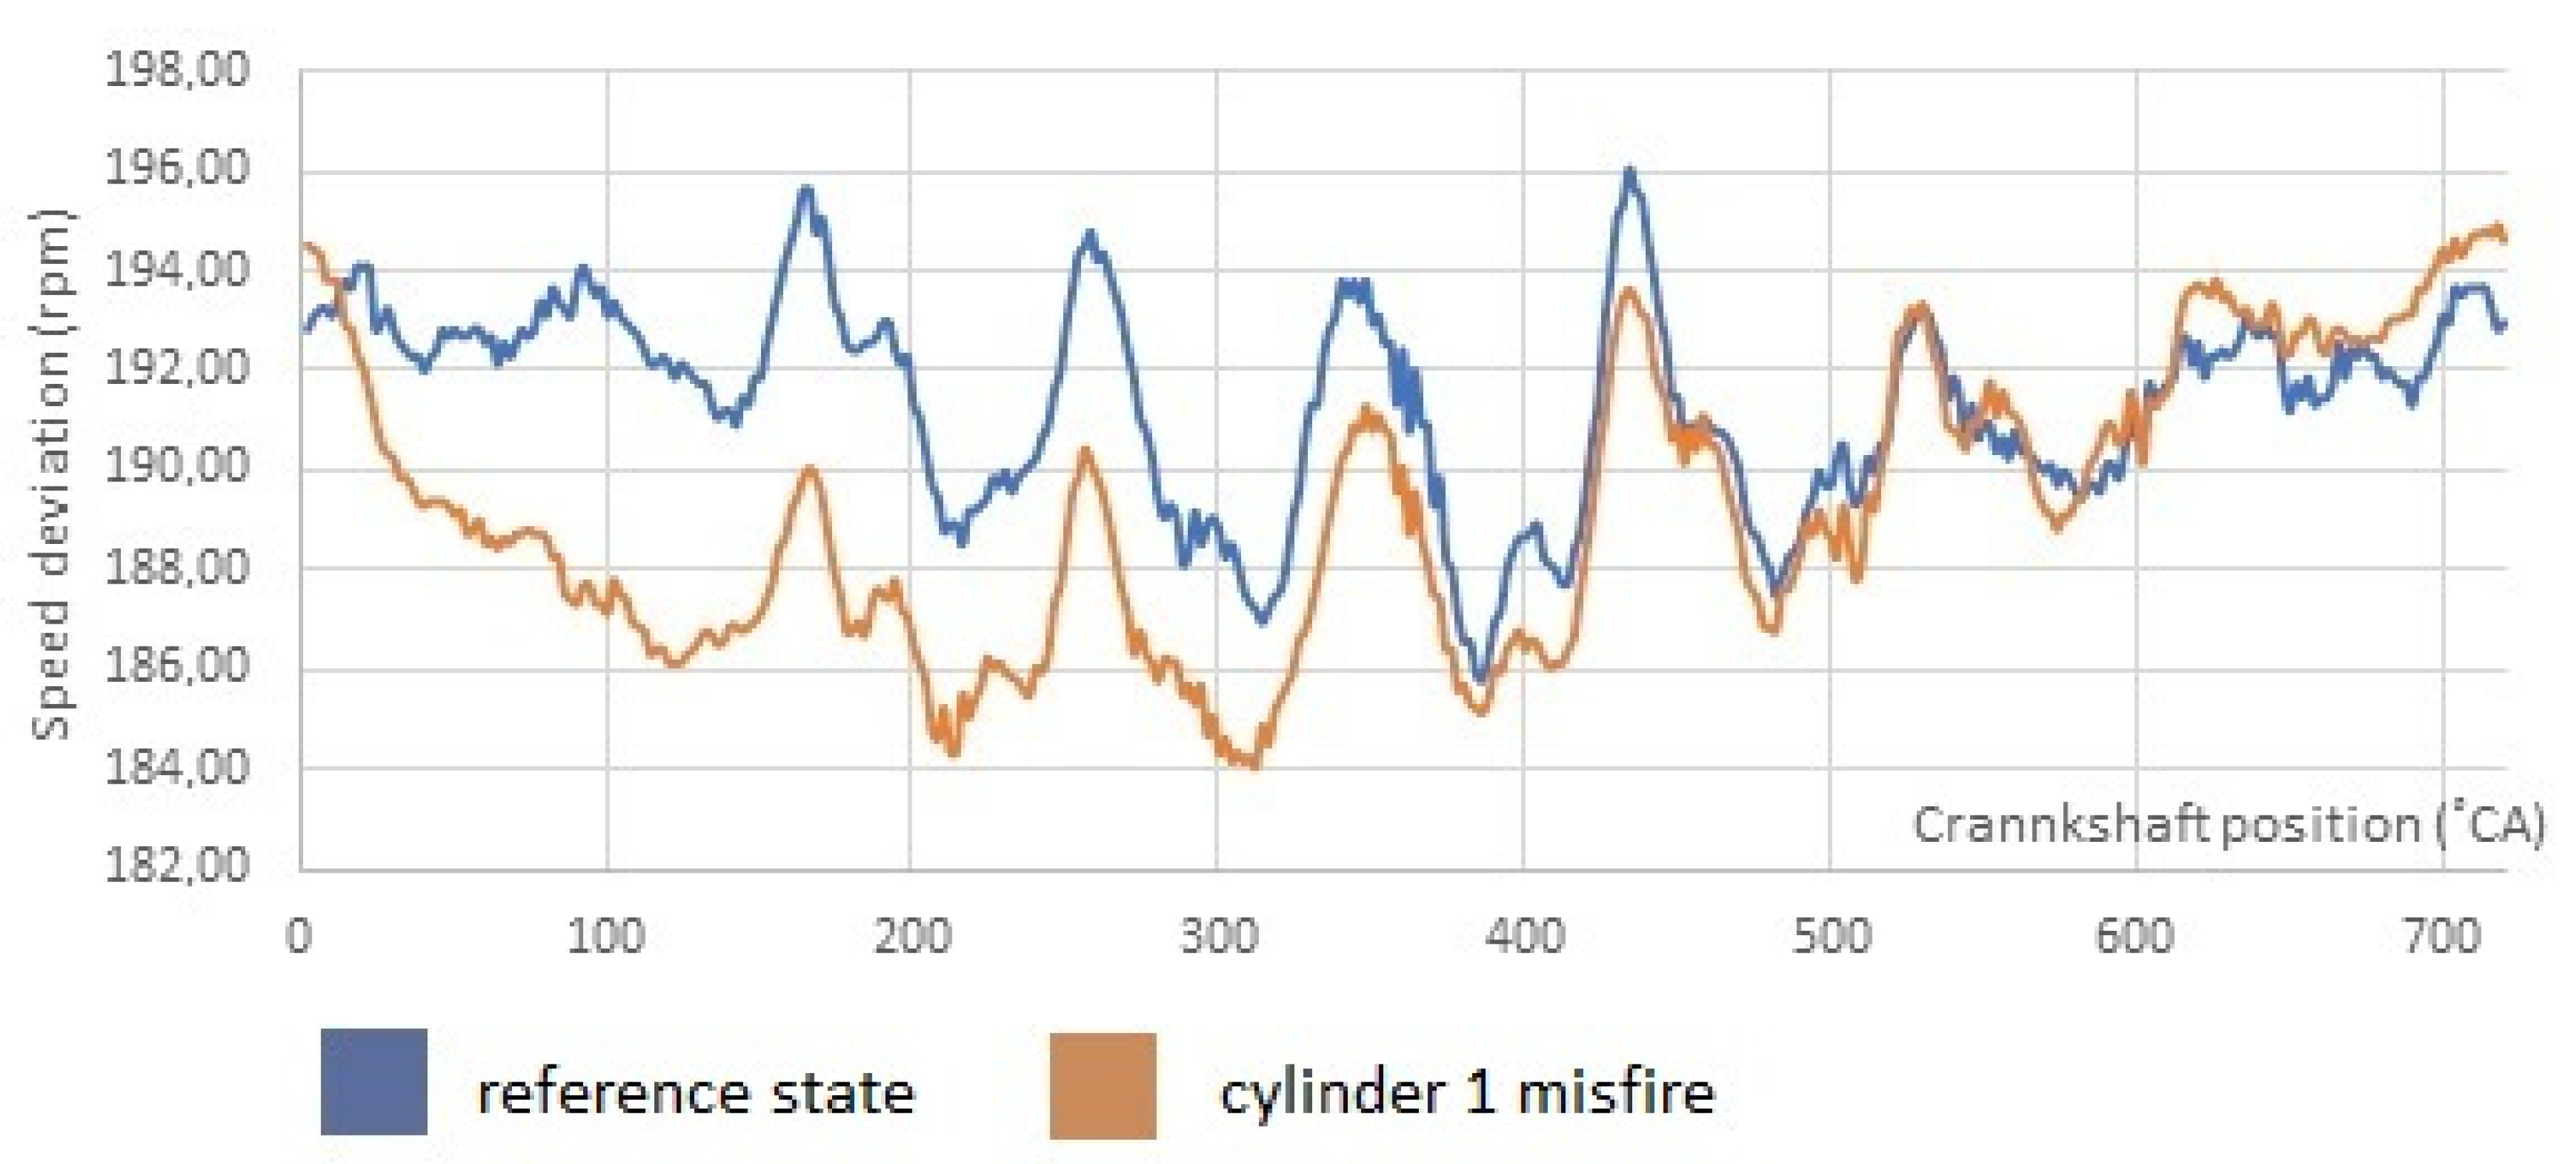
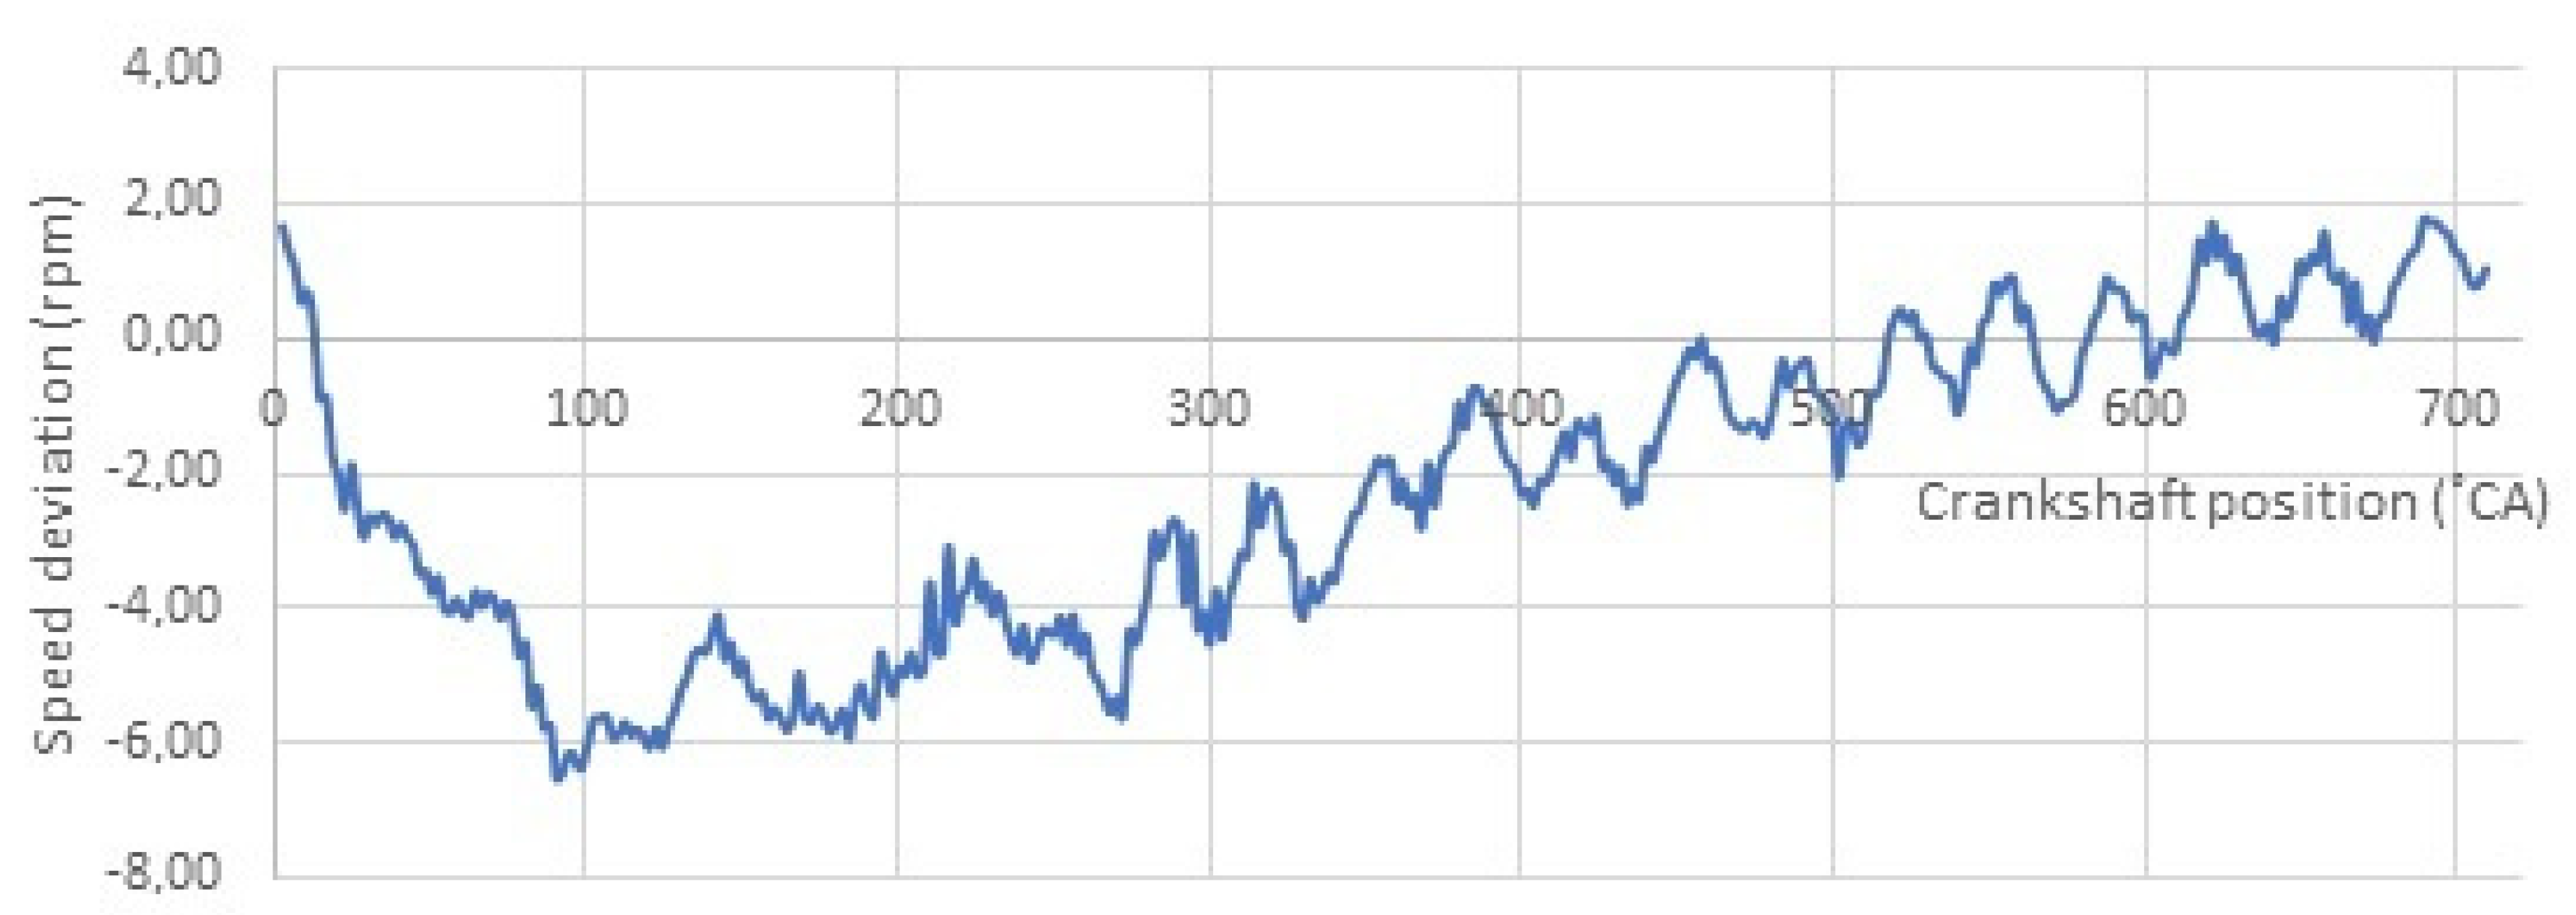
4. Results and Discussion

During the initial stage of work on the invention, the authors focused on verifying the relationship between the instantaneous angular velocity and the course of the combustion process. A laboratory motor was simultaneously measured with a combustion pressure indicator and an incremental encoder. Measurements confirmed the occurrence of characteristic elevations at the moment of combustion of the fuel-air mixture, the frequency and proportions of which coincided with each other in the two diagrams presented in Figure 11.
Instantaneous speed dropped near cylinders No. 5 and 6, which corresponded to the indicator charts, and since the increasing of the combustion pressure in these cylinders appeared to be the lowest. The engine being tested had a shifted (delayed) fuel injection due to the reverse operation, causing the combustion curves to deviate from those typical for a diesel engine. Nevertheless, even in this case, it was possible to observe an uneven load on the engine, which coincided with changes in the instantaneous rotational speed. For the sake of transparency of calculations and easy interpretation of the results, the instantaneous angular velocity was changed to instantaneous rotational speed throughout the remainder of the article.
The relevant part of the experiment began by collecting the reference values presented in Figure 12.
Next, artificial malfunctions of the injection process were introduced in individual cylinders by suspending high-pressure fuel pumps for different engine speed settings, as shown in Figure 13 and Figure 14. The order of Buckau-Wolf R8DV-136 engine ignition during the measurements was constant and involved cylinders 1-2-5-6-8-7-4-3. Ignition in the first cylinder occurred at 0˚CA, and each subsequent cylinder was a multiple of 90˚CA. The graphs in Figure 13 and Figure 14 showed a significant deviation of the instantaneous rotational speed at the time of the malfunction. This deviation occurred at the point of crankshaft rotation after a malfunction and equalized with the reference value after about 450˚CA.
Pursuant to the proposed algorithm, a comparison of the reference values with the values from the waveforms of damaged cylinders was carried out successively in the form of double diagrams for each of the malfunctions. For each cylinder, the waveforms showing the difference (deviation) of the instantaneous rotational speed during malfunction with the instantaneous reference speed and the average deviation for all analyzed speeds were collected. The results are presented in Figure 13, Figure 14, Figure 15, Figure 16, Figure 17 and Figure 18.
The program with a W coefficient set to 450˚CA selected the unsuitable suspending cylinders, correctly informing the user with a signal lamp and information about the misfired cylinder via a user interface. Once the fuel pump of the fourth cylinder was suspended, the deviation in W exceeded the set limit value, resulting in an alarm.
Measurement was carried out on a power generator, which was analogous to the experiment carried out on the main drive engine. To simulate maritime conditions, a significant droop speed was set, which was used to simulate the readiness of the unit for parallel operation similar to that on marine vessels. A decrease in the rotational speed with an increase in the load is a result of the rotational speed controller, detecting the speed droop function when a single generating unit works with the power network. According to the guidelines of classification associations, the percentage decrease in the speed characteristics should be less than 5% of the whole load range, which is 3–4% in practice.
The coefficient W was determined by the Equation (5) at 432˚CA. In the beginning, the standard measurement for the 0 kW setting was recorded, the course of which was represented by black in the diagrams below. Using the diagrams made it easy to read the˚CA values in which the pistons of individual cylinders were located in the TDC. In this instance, these would be points 0, 144, 288, 432, and 576˚CA. The instantaneous decrease in rotational speed was even more evident when calculating the difference between the reference and collected speed of a defective cylinder. According to the following graphs, this decrease was significant and could be detected by the working monitoring system. During this test, apart from saving the waveforms to text files, the device constantly supervised the combustion by correctly selecting unfit cylinders.
Similar to the engine operating at a variable speed, the suitability of the proposed algorithm was also tested for the generator set driven by Sulzer 5 BAH 22 engine. The order of engine ignition during the measurements was constant and involved cylinders 1-3-5-4-2.
Figure 19 and Figure 20 show the instantaneous engine speed waveforms for a reference state (calibration) and the waveforms with simulated combustion loss in their respective engine cylinders. A single reference run was made for the generator set engine due to small changes in the average speed within the investigated load range. The engine was loaded in the electric power range 0–100 kW with an increased step of 25 kW.
The engine was not loaded above 100 kW after simulated combustion in one of the cylinders in order to prevent damage to the engine due to thermal and mechanical stress on the other cylinders without combustion loss.
Waveforms showed the difference (deviation) in the instantaneous rotational speed at a malfunction from the instantaneous reference speed and the average deviation for all analyzed speeds. The results are shown in Figure 21, Figure 22 and Figure 23.
In order to improve the readability of the analysis results, the waveforms were presented as polar coordinate system graphs. An example of this type of visualization for the Buckau-Wolf R8DV-136 engine is shown in Figure 24, illustrating the situation when the combustion process in cylinder 1 of the engine was lost. The reference values were shown in the form of a blue outline, and the values of the damaged cylinder were shown as the space marked in orange. This was a function of the double rotation of the crankshaft equal to one four-stroke engine operating cycle. The blue field indicated the area that is the sum of the deviations caused by damage to the cylinder; in this case, it was cylinder 1.
The difference in the instantaneous rotational speed from the average rotational speed determined for a specific crankshaft position and calculated for n subsequent revolutions of the two different examined engines corresponded to a change in the steady-state engine condition. Additionally, the deviation from the instantaneous rotational speed of the engine for each position of the crankshaft from the average calculated for m full revolutions made it possible to assess the technical condition of the engine.

5. Conclusions

A method to determine the coefficient W, which expressed the differences in instantaneous speed values between standard and defective operations, was a useful method that could be applied in the final version of a device. It was found to be accurate for inline engines with different numbers of cylinders (5 and 8 cylinders). The engine speed controller type and the type of load were shown not to significantly impact the accuracy of the calculation of the coefficient. Thus, its versatility was confirmed.
The presented results supported the hypotheses made by the authors. Moreover, they showed the practical applicability of a diagnostic system based on the proposed instantaneous rotational speed processing algorithm of the engine to detect combustion loss in a cylinder. Performing an analysis like one on a Buckau-Wolf (R8DV-136, VEB SKL, Magdeburg, Germany) or Sulzer BAH engine (Sulzer 5 BAH 22, ZUT Zgoda, Świętochłowice, Poland) might provide an alternative to other currently available combustion process diagnostic methods. The algorithm, as well as the whole device, correctly indicated the lack of combustion process in an artificially-forced no firing cylinder.
Further efforts should be directed towards allowing the program to identify the type/source of malfunction present in an engine cylinder.

6. Patents

  • Chybowski L., Kazienko D., Method of mechanical load estimation of power machines, preferably piston combustion engines. European Application EP 19460053.2.
  • Chybowski L., Kazienko D., The method of mechanical load estimation of power machines, preferably piston combustion engines. Application to Polish Patent Office P.427649.
  • Chybowski L., Kazienko D., Electronic device for detecting deviations of the signal from sensors monitoring the state of the diagnosed object and a way of this detection. European Application EP 19460052.4.
  • Chybowski L., Kazienko D., Electronic device for detecting deviations of the signal from sensors monitoring the state of the diagnosed object and a way of this detection. Application to Polish Patent Office P.427648.
  • Chybowski L., Kazienko D., Universal resistance system supporting the calibration of resistance sensors in energetic machines monitoring systems, preferably internal combustion engines. Application to Polish Patent Office P.429574.
  • Chybowski L., Kazienko D., Housing of the detector of diagnostic signals values deviations. Polish Patent Office registered design 25673.

Author Contributions

Conceptualization, D.K. and L.C.; methodology, D.K. and L.C.; software, D.K. and L.C.; validation, D.K. and L.C.; formal analysis, D.K. and L.C.; investigation, D.K. and L.C.; resources, D.K. and L.C.; data curation, D.K.; writing—original draft preparation, D.K. and L.C.; writing—review and editing, D.K. and L.C.; visualization, D.K. and L.C.; project administration, D.K. and L.C.; supervision, L.C.; funding acquisition, L.C. All authors have read and agreed to the published version of the manuscript.

Funding

This research and APC were co-funded by the Ministry of Science and Higher Education of Poland from Grant 1/S/KPBMiM/20.

Acknowledgments

In this section you can acknowledge any support given which is not covered by the author contribution or funding sections. This may include administrative and technical support, or donations in kind (e.g., materials used for experiments).

Conflicts of Interest

The authors declare no conflict of interest.

Appendix A

------------------------------------------------- ENCODER-ARDUINO-LAB_VIEW----------------------------------------------
int i = 0;
int gmp = 0;
int check = 0;
void setup()
    { pinMode (2, INPUT);   pinMode (8, OUTPUT);   pinMode (9, OUTPUT);   pinMode (10,
    OUTPUT);   pinMode (11, OUTPUT);   attachInterrupt(0, blinkA, RISING);   Serial.begin
    (9600); }
void loop()
    {  while (i != check)
       { check = i;
     if (i % 2 == 0)
          { gmp++; digitalWrite(11, HIGH); digitalWrite(10, HIGH); digitalWrite(9, HIGH);
          digitalWrite(8, HIGH); delay(50);      digitalWrite(11, LOW); digitalWrite(10, LOW);
          digitalWrite(9, LOW);      digitalWrite(8, LOW);      }
     else
          { digitalWrite(10, HIGH); digitalWrite(8, HIGH); delay(50);
          digitalWrite(10, LOW); digitalWrite(8, LOW); }
     }
    }
void blinkA ()
{i++;}
---------------------------------------------------------------------------END-------------------------------------------------------------------

References

  1. Piotrowski, I.; Witkowski, K. Okrętowe Silniki Spalinowe, 3rd ed.; Trademar: Gdynia, Poland, 2003; ISBN 978-83-62227-48-8. [Google Scholar]
  2. Heywood, J.B. Internal Combustion Engine Fundamentals; McGraw-Hill, Inc.: New York, NY, USA, 1988; ISBN 0-07-028637-X. [Google Scholar]
  3. Chybowski, L.; Gawdzińska, K.; Laskowski, R. Assessing the Unreliability of Systems during the Early Operation Period of a Ship—A Case Study. J. Mar. Sci. Eng. 2019, 7, 213. [Google Scholar] [CrossRef] [Green Version]
  4. Chybowski, L.; Laskowski, R.; Gawdzińska, K. An overview of systems supplying water into the combustion chamber of diesel engines to decrease the amount of nitrogen oxides in exhaust gas. J. Mar. Sci. Technol. 2015, 20, 393–405. [Google Scholar] [CrossRef]
  5. Kazienko, D. The analysis of class survey methods and their impact on the reliability of marine power plants. Zeszyty Naukowe Akademii Morskiej w Szczecinie 2019, 55, 34–43. [Google Scholar]
  6. Bejger, A.; Drzewieniecki, J.B. The Use of Acoustic Emission to Diagnosis of Fuel Injection Pumps of Marine Diesel Engines. Energies 2019, 12, 4661. [Google Scholar] [CrossRef] [Green Version]
  7. Winterbone, D.E.; Turan, A. Advanced Thermodynamics for Engineers; Elsevier: Amsterdam, The Netherlands, 2015; ISBN 9780444633736. [Google Scholar]
  8. Bejger, A.; Chybowski, L.; Gawdzińska, K. Utilising elastic waves of acoustic emission to assess the condition of spray nozzles in a marine diesel engine. J. Mar. Eng. Technol. 2018, 17, 153–159. [Google Scholar] [CrossRef] [Green Version]
  9. Nozdrzykowski, K.; Chybowski, L. A Force-Sensor-Based Method to Eliminate Deformation of Large Crankshafts during Measurements of Their Geometric Condition. Sensors 2019, 19, 3507. [Google Scholar] [CrossRef] [Green Version]
  10. Nozdrzykowski, K.; Chybowski, L.; Dorobczyński, L. Model-based estimation of the reaction forces in an elastic system supporting large-size crankshafts during measurements of their geometric quantities. Measurement 2020, 155, 107543. [Google Scholar] [CrossRef]
  11. Chybowski, L.; Kazienko, D. The Development of an Explosion Protection System in the Starting Air Manifold of a High Power Engine. Syst. Saf. Hum. Tech. Facil. Environ. 2019, 1, 26–34. [Google Scholar] [CrossRef] [Green Version]
  12. Chybowski, L.; Grzebieniak, R.; Matuszak, Z. Diagnosis of The Technical Condition of A Marine Power Plant. Tech. Diagn. 2007, Z1, 1–6. [Google Scholar]
  13. Kluj, S. Diagnostyka Urządzeń Okrętowych; Studium Doskonalenia Kadr Wyższej Szkoły Morskiej w Gdyni: Gdynia, Poland, 2000. [Google Scholar]
  14. Chybowski, L.; Matuszak, Z. Marine Auxuliary Diesel Engine Turbocharger Damage (Explosion) Cause Analysis. J. Pol. CIMAC 2007, 2, 33–40. [Google Scholar]
  15. Korczewski, Z. Exhaust gas temperature measurements in diagnostics of turbocharged marine internal combustion engines. Part I. Standard measurements. Pol. Marit. Res. 2015, 1, 47–54. [Google Scholar] [CrossRef] [Green Version]
  16. Shrivastava, P.; Verma, T.N. Effect of fuel injection pressure on the characteristics of CI engine fuelled with biodiesel from Roselle oil. Fuel 2020, 265, 117005. [Google Scholar] [CrossRef]
  17. ICON Research DK-20 Doctor Portable Cylinder Pressure Analyser. Available online: https://iconresearch.co.uk/diesel-engine-analysis/doctor-portable/ (accessed on 30 January 2020).
  18. ABB AB Force Measurement. Cylmate® Systems Combustion under Control; ABB AB Force Measurement: Västerås, Sweden, 2012. [Google Scholar]
  19. Leutert Digital Pressure Indicator DPI. Available online: https://www.leutert.com/maritime-division/en/products/digital-pressure-indicator-dpi.php (accessed on 30 January 2020).
  20. Bueno, A.V.; Velásquez, J.A.; Milanez, L.F. A new engine indicating measurement procedure for combustion heat release analysis. Appl. Therm. Eng. 2009, 29, 1657–1675. [Google Scholar] [CrossRef]
  21. Caputo, D.C.; Cavataio, P.G.; Fonteriz, V.C.; Ferreira, R.E.; Receloglu, G.A. Processing of internal combustion engine test data using the indicated cycle provided model. Transp. Res. Procedia 2018, 33, 20–27. [Google Scholar] [CrossRef]
  22. Chybowski, L. Diagnozowanie Silników Okrętowych z Zapłonem Samoczynnym w Oparciu o Analizę Procesów Wtrysku i Spalania Paliwa; Maritime University of Szczecin Press: Szczecin, Poland, 2019. [Google Scholar]
  23. Martyr, A.J.; Plint, M.A. Engine Testing the Design, Building, Modification and Use of Powertrain Test Facilities, 4th ed.; Butterworth-Heinemann: Amsterdam, The Netherlands, 2011. [Google Scholar]
  24. Treichel, P. Basics of Prognosis Versus the Evaluation of Marine Propulsion Plant Technical Condition. Sci. J. Marit. Univ. Szczec. Zesz. Nauk. Akad. Mor. W Szczec. 2004, 1, 499–508. [Google Scholar]
  25. Bonisławski, M.; Hołub, M.; Borkowski, T.; Kowalak, P. A Novel Telemetry System for Real Time, Ship Main Propulsion Power Measurement. Sensors 2019, 19, 4771. [Google Scholar] [CrossRef] [Green Version]
  26. Kyma KPM. Shaft Power Meter; Kyma KPM: Bergen, Norway, 2010. [Google Scholar]
  27. VAF Instruments T-Sense® Optical Torque Measuring Systems. Available online: https://www.vaf.nl/media/1049/pb-660-gb-0119-t-sense.pdf?type=Brochure (accessed on 30 January 2020).
  28. LEMAG. Shaftpower; LEMAG: Rellingen, Germay, 2018. [Google Scholar]
  29. Borkowski, T.; Kowalak, P.; Myśków, J. Vessel main propulsion engine performance evaluation. J. KONES 2012, 19, 53–60. [Google Scholar] [CrossRef]
  30. Charchalis, A.; Dereszewski, M. Processing of instantaneous angular speed signal for detection of a diesel engine failure. Math. Probl. Eng. 2013, 2, 659243. [Google Scholar] [CrossRef]
  31. Connolly, F.T.; Yagle, A.E. Modeling and Identification of the Combustion Pressure Process in Internal Combustion Engines: II—Experimental Results. J. Eng. Gas Turbines Power 1993, 115, 801–809. [Google Scholar] [CrossRef]
  32. Hao, D.; Zhao, C.; Li, Y.H.G.; Zeng, W.; Li, H. Dynamic Indicated Torque Estimation for Turbocharged Diesel Engines Based on Back Propagation Neural Network. IFAC-PapersOnLine 2018, 51, 720–725. [Google Scholar] [CrossRef]
  33. Chybowski, L. Assessment Of Marine Engines Torque Load Without Using of The Torquemeter. J. Pol. CIMAC 2008, 3, 60–68. [Google Scholar]
  34. Dereszewski, M. Wykorzystanie modelu dynamicznego silnika Sulzer 3AL 25/30 do symulacji wpływu obciążenia i uszkodzeń oraz wpływ na niestacjonarność prędkości kątowej. Zesz. Nauk. Akad. Mor. W Gdynii 2013, 81, 28–37. [Google Scholar]
  35. Xiang, L.; Yang, S.; Gan, C. NoTorsional Vibration Measurements on Rotating Shaft System Using Laser Doppler Vibrometer. Title. Opt. Laser Eng. 2012, 50, 1596–1601. [Google Scholar] [CrossRef]
  36. Dereszewski, M.; Charchalis, A.; Polanowski, S. Analysis of diagnostic utility of instantaneous angular speed of a sea going vessel propulsion shaft. J. KONES 2011, 18, 77–83. [Google Scholar]
  37. Rizzoni, G. Diagnosis of Individual Cylinder Misfires by Signature Analysis of Crankshaft Speed Fluctuations. SAE Trans. 1989, 98, 1572–1580. [Google Scholar]
  38. Johnsson, R. Cylinder pressure reconstruction based on complex radial basis function networks from vibration and speed signals. Mech. Syst. Signal Process. 2006, 20, 1923–1940. [Google Scholar] [CrossRef]
  39. Lin, T.R.; Tan, A.C.; Ma, L.; Mathew, J. Condition monitoring and fault diagnosis of diesel engines using instantaneous angular speed analysis. Proc. Inst. Mech. Eng. Part C J. Mech. Eng. Sci. 2015, 229, 304–315. [Google Scholar] [CrossRef] [Green Version]
  40. Łutowicz, M. Unsteady Angular Speed of Diesel Engine Crankshaft Preliminary Examination. J. KONES Powertrain Transp. 2012, 19, 393–399. [Google Scholar] [CrossRef]
  41. Dereszewski, M. Monitoring of torsional vibration of a crankshaft by intstanteous angular speed observations. J. KONES Powertrain Transp. 2016, 23, 99–106. [Google Scholar] [CrossRef]
  42. Johnsson, R. Crankshaft Speed Measurements and Analysis for Control and Engines. Ph.D. Thesis, Luleå Tekniska Universitet, Luleå, Sweden, 2001. [Google Scholar]
  43. Wang, T.; Yan, Y.; Wang, L.; Hu, Y.; Zhang, S. Instantaneous Rotational Speed Measurement Using Image Correlation and Periodicity Determination Algorithms; IEEE: Piscataway, NJ, USA, 2019. [Google Scholar]
  44. Desbazeille, M.; Randall, R.B.; Guillet, F.; El Badaoui, M.; Hoisnard, C. Model-based diagnosis of large diesel engines based on angular speed variations of the crankshaft. Mech. Syst. Signal Process. 2010, 24, 1529–1541. [Google Scholar] [CrossRef]
  45. Zhang, M.; Zi, Y.; Niu, L.; Xi, S.; Li, Y. Intelligent Diagnosis of V-Type Marine Diesel Engines Based on Multifeatures Extracted From Instantaneous Crankshaft Speed. IEEE Trans. Instrum. Meas. 2019, 68, 722–740. [Google Scholar] [CrossRef]
  46. Douglas, R.M.; Steel, J.A.; Reuben, R.L.; Fog, T.L. On-line power estimation of large diesel engines using acoustic emission and instantaneous crankshaft angular velocity. Int. J. Engine Res. 2006, 7, 399–410. [Google Scholar] [CrossRef]
  47. Roy, S.K.; Mohanty, A.R.; Kumar, C.S. Fault detection in a multistage gearbox by time synchronous averaging of the instantaneous angular speed. J. Vib. Control 2016, 22, 468–480. [Google Scholar] [CrossRef]
  48. Al-Hashmi, S.; Gu, F.; Li, Y.; Ball, A.D.; Fen, T.; Lui, K. Cavitation Detection of a Centrifugal Pump Using Instantanous Angular Speed. In Proceedings of the ESDA04 7th Biennial Conference on Engineering Systems Design and Analysis, Manchester, UK, 19–22 July 2004; ASMEDC: New York, NY, USA, 2004; pp. 185–190. [Google Scholar]
  49. Chybowski, L.; Kazienko, D. The Method of Mechanical Load Estimation of Power Machines, Preferably Piston Combustion Engines. Patent Application to Polish Patent Office P.427649, 2018. [Google Scholar]
  50. Chybowski, L.; Kazienko, D. Method of Mechanical Load Estimation of Power Machines, Preferably Piston Combustion Engines. European Patent Application EP 19460053.2, 2019. [Google Scholar]
  51. Biočanin, S.; Biočanin, M. Measurement crankshaft angular speed of an OM403 engine. Serb. J. Electr. Eng. 2017, 14, 257–275. [Google Scholar] [CrossRef]
  52. Charles, P.; Sinha, J.K.; Gu, F.; Lidstone, L.; Ball, A.D. Detecting the crankshaft torsional vibration of diesel engines for combustion related diagnosis. J. Sound Vib. 2009, 321, 1171–1185. [Google Scholar] [CrossRef]
  53. He, Y.; Yang, J.; Li, C.; Duan, F. Experimental Research on Misfire Diagnosis Using the Instantaneous Angular Speed Signal for Diesel Engine; Springer International Publishing: New York, NY, USA, 2015; pp. 637–646. [Google Scholar]
  54. Li, Z.; Yan, X.; Yuan, C.; Peng, Z. Intelligent fault diagnosis method for marine diesel engines using instantaneous angular speed. J. Mech. Sci. Technol. 2012, 26, 2413–2423. [Google Scholar] [CrossRef]
  55. Margaronis, I.E. The torsional vibrations of marine Diesel engines under fault operation of its cylinders. Forsch. Ingenieurwes. 1992, 58, 13–25. [Google Scholar] [CrossRef]
  56. Taglialatela, F.; Lavorgna, M.; Mancaruso, E.; Vaglieco, B.M. Determination of combustion parameters using engine crankshaft speed. Mech. Syst. Signal Process. 2013, 38, 628–633. [Google Scholar] [CrossRef]
  57. Yang, J.; Pu, L.; Wang, Z.; Zhou, Y.; Yan, X. Fault Detection in a Diesel Engine by Analysing the Instantaneous Angular Speed. Mech. Syst. Signal Process. 2001, 15, 549–564. [Google Scholar] [CrossRef]
Figure 1. View of the analyzed Buckau-Wolf R8DV-136 engine.
Energies 13 01396 g001
Figure 2. View of the analyzed Sulzer 5 BAH 22 engine.
Energies 13 01396 g002
Figure 3. View of the BAH engine with a connected measuring device.
Energies 13 01396 g003
Figure 4. Diagram of the SpeedMA measuring system.
Energies 13 01396 g004
Figure 5. Reference instantaneous Buckau-Wolf R8DV-136 engine speed for the pre-set speed of 190 rpm.
Energies 13 01396 g005
Figure 6. The waveform of instantaneous angular velocity deviation of the engine Buckau-Wolf R8DV-136 for a pre-set speed of 190 rpm with no combustion in cylinder 1.
Energies 13 01396 g006
Figure 7. Summary deviations of rotational speed with a crankshaft rotation function for a Buckau-Wolf R8DV-136 engine.
Energies 13 01396 g007
Figure 8. Determination of the maximum deviation angle of a Buckau-Wolf R8DV-136 engine obtained by a differential equation.
Energies 13 01396 g008
Figure 9. Graph showing a situation that exceeds the allowed operation deviation.
Energies 13 01396 g009
Figure 10. Engine cylinder misfire detection algorithm.
Energies 13 01396 g010
Figure 11. Example of the instantaneous rotational speed and combustion pressure as a function of crank angle.
Energies 13 01396 g011
Figure 12. Reference measurements for a Buckau-Wolf R8DV-136 engine speeds from 180–280 rpm.
Energies 13 01396 g012
Figure 13. Instantaneous speed ranges at the time of combustion loss in cylinders 1–4 of a Buckau-Wolf R8DV-136 engine with pre-set speeds of 180–280 rpm.
Energies 13 01396 g013
Figure 14. Instantaneous speed ranges at the time of combustion loss in cylinders 5–8 of a Buckau-Wolf R8DV-136 engine for the pre-set speeds of 180–280 rpm.
Energies 13 01396 g014
Figure 15. Instantaneous speed differences and the average deviation of the combustion loss in cylinders 1 and 2 of a Buckau-Wolf R8DV-136 engine.
Energies 13 01396 g015
Figure 16. Instantaneous speed differences and the average deviation of the combustion loss in cylinders 3 and 4 of the Buckau-Wolf R8DV-136 engine.
Energies 13 01396 g016
Figure 17. Instantaneous speed differences and the average deviation of the combustion loss in cylinders 5 and 6 of the Buckau-Wolf R8DV-136 engine.
Energies 13 01396 g017
Figure 18. Instantaneous speed differences and the average deviation of the combustion loss in cylinders 7 and 8 of the Buckau-Wolf R8DV-136 engine.
Energies 13 01396 g018
Figure 19. Reference measurement and instantaneous speed cycles at the moment of combustion loss in cylinders 1–3 of Sulzer 5 BAH 22 engine for pre-set electric loads of 0–100 kW.
Energies 13 01396 g019
Figure 20. Instantaneous speeds at the moment of combustion loss in cylinders 4 and 5 of a Sulzer 5 BAH 22 engine for pre-set electrical loads of 0–100 kW.
Energies 13 01396 g020
Figure 21. Instantaneous speed differences and the average deviation of the combustion process in cylinder 1 of a Sulzer 5 BAH 22 engine.
Energies 13 01396 g021
Figure 22. Instantaneous speed differences and the average deviation of the combustion process in cylinders 2 and 3 of a Sulzer 5 BAH 22 engine.
Energies 13 01396 g022
Figure 23. Instantaneous speed differences and the average deviation of the combustion process in cylinders 4 and 5 of a Sulzer 5 BAH 22 engine.
Energies 13 01396 g023
Figure 24. Changes in the instantaneous rotational speed of the engine shown in the form of a polar coordinate system. Blue: engine in up-state; Orange: cylinder 1 misfire.
Energies 13 01396 g024
Table 1. Comparison between the proposed instantaneous speed monitoring system and the works of other researchers.
Authors/SystemEngine MakerNominal/Test Speed (rpm)TypeCylinder NumberNominal/Test Power (kW)Monitored System TypeApplicationData Presentation/Type of Diagram
SpeedMA System [49,50]Sulzer 5 BAH 22500L5220Marine gen-setLoad balance evaluation, cylinder misfire detection, and locationOrthogonal, polar
Buckau-Wolf R8DV-136180-360L8220Marine main engine
S. Biočanin, M. Biočanin [51]OM4032200V10287Vehicle engineMisfire detection and locationOrthogonal
P. Charles et. al. [52]No data740, 1000V16, 208400, 9000No dataPolar
M. Dereszewski, A. Charchalis [30,36]Sulzer 3BAH22600–750L3100–220Marine gen-setEngine failure detectionOrthogonal
M. Desbazeille et. al. [44]Wartsila diesel V50*1500V204000Marine/stationary gen-setFaulty fuel pump detectionOrthogonal
Y. He et. al. [53]Weichai WP10-24021,002,200L6175Vehicle engineMisfire detectionOrthogonal
R. Johnsson [38,42]Scania DCS9 08800–2200L6280Test engine modified for the experimentPrediction of the maximum combustion pressureOrthogonal
Z. Li et al. [54]Volvo Penta TAMD165C1500L6ca. 560Marine gen-setEngine fault diagnosisOrthogonal, spectral
I. Margaronis [55]Mirrlees JVSS12750No data6920Marine main engineAnalysis of torque and cylinder pressure correlationQuantitative measures
G. Rizzoni [37]No dataNo dataV6N/AVehicle engineCylinder misfire detection and locationQuantitative measures
F. Taglialatela et. al. [56]PFI2500L110Test gasoline engineMaximum combustion pressure estimationQuantitative measures
J. Yang et al. [57]4120 SG800–1400L448.5Test standEngine failure detectionQuantitative measures
Table 2. The basic technical and operational parameters of a Buckau-Wolf R8DV-136 Engine.
ParameterDescription
ManufacturerVEB SKL–Magdeburg
Power ConsumerFixed pitch propeller
Type4-stroke, naturally aspirated, trunk engine
Number of Cylinders8
Cylinder Bore240 mm
Piston Stroke360 mm
Cylinder Working Volume16.290 dm3
Compression Chamber Volume1.205 dm3
Nominal Effective Power220 kW
Nominal Speed360 rpm
Mean Piston Speed4.32 m/s
Nominal Specific Fuel oil Consumption238 g/kWh
Table 3. The basic technical and operational parameters of a Sulzer 5 BAH 22 Engine.
ParameterDescription
ManufacturerZUT Zgoda
Power ConsumerAlternator
Type4-stroke, turbocharged, trunk engine
Number of Cylinders5
Cylinder Bore220 mm
Piston Stroke320 mm
Nominal Effective Power220 kW
Nominal Speed500 rpm
Mean Piston Speed5.33 m/s
Nominal Specific Fuel Oil Consumption232 g/kWh

