Abstract
System operators have moved towards the integration of renewable resources. However, these resources make network management unstable as they have variations in produced energy. Thus, some strategic plans, like demand response programs, are required to overcome these concerns. This paper develops an aggregator model with a precise vision of the demand response timeline. The model at first discusses the role of an aggregator, and thereafter is presented an innovative approach to how the aggregator deals with short and real-time demand response programs. A case study is developed for the model using real-time simulator and laboratory resources to survey the performance of the model under practical challenges. The real-time simulation uses an OP5600 machine that controls six laboratory resistive loads. Furthermore, the actual consumption profiles are adapted from the loads with a small-time step to precisely survey the behavior of each load. Also, remuneration costs of the event during the case study have been calculated and compared using both actual and simulated demand reduction profiles in the periods prior to event, such as the ramp period.
1. Introduction
Electrical energy demand has significantly increased in the last decades. This has led to huge peak of greenhouse gas emissions in order to provide and supply the required demand [1]. In the past decades, fossil fuels were the raw materials for electricity production [2]. However, nowadays several low carbon technologies and renewable energy resources (RERs) have been utilized to produce electricity [3]. Smart grids and microgrids are new some new concepts for the future distribution networks to eliminate the hierarchical structure of the grid and convert them to a fully decentralized and transactive energy system [4]. To do this, the process of energy production should be also placed in the demand side, among all electricity consumers. Therefore, the concept of prosumer (a consumer who also produces electricity) has been raised [5]. However, this makes the network instabilities more tangible than before, as a significant number of small and medium scale consumers and producers will be involved in the network management scenarios [6].
Distributed generation (DG) and RERs are considered as one of the bases of smart grids and microgrids implementation [7]. However, these paradigms would be fully addressed while they have been integrated with demand response (DR) programs [8].
In fact, the DR program is a feature in the upcoming distribution network to connect low carbon technologies without the need for reinforcement [9]. There are various definitions in the literature for DR program. While each definition has its own strengths and weak points, the most completed one is defined by Federal Energy Regulatory Commission (FERC) [10] as:
“Changes in electric use by demand-side resources from their normal consumption patterns in response to changes in the price of electricity, or to incentive payments designed to induce lower electricity use at times of high wholesale market prices or when system reliability is jeopardized.”
According to the definition mentioned above, in a simple word, DR can be described as the reaction of electricity consumers to the price signals considered as incentives to reduce/modify the electricity use pattern. There are several types of DR programs: price-based and incentive-based [11]. In Price-based category, there are several programs such as real-time pricing (RTP), time-of-use (TOU), critical peak pricing (CPP), etc. [12]. Also, in the incentive-based DR programs, various strategies are proposed, namely direct load control (DLC), emergency demand response service (EDRS) capacity market programs (CMP), interruptible demand response program (IDRP), etc. [13]. Each program has its own specifications that are applicable depending on technical or economic reasons of the electricity network. As an example, the ERCOT market in Texas utilizes EDRS to maintain network stability in emergency conditions to reduce power outages. In this market, EDRS participants can provide DR reduction within a 10 to 30 min ramp period in advance to the event [14]. However, there is a minimum reduction capacity for the DR event and its participants in order to directly participate in the electricity markets. According to the surveyed references [15,16,17], this minimum reduction capacity for a consumer who intends to have an active role in the electricity market negotiations, is various depending on the DR type, typically from a few kilowatts to megawatts. In other words, this makes small scale consumers almost incapable to directly participate in electricity markets [18]. To overcome this barrier, an aggregator can be considered as a third-party entity between the upstream and downstream sides of the network [19,20]. In fact, this entity aggregates all small and medium scales DR participants and contribute them as a unique DR resource in the electricity market negotiations [21].
By a simple look on the current trends, a lot of papers and research projects can be found that are focused on the concepts of aggregator, as the role of the aggregator is being legalized in several European countries (e.g., France, Finland, Austria, Denmark, etc.) [22]. However, one of the aspects of aggregator that has not been discussed widely in the literature is the way that aggregator deals with ramp period before the DR event is started. Incentive calculations and payments between aggregator and DR participants during the ramp period, required information exchange between aggregator and network operators (e.g., independent system operator–ISO) during the ramp period, and several other issues need to be discussed before the models move from theoretical phase towards implementation level. Besides this, both scientific and practical features of any model should be scrutinized, learning from past experiences to estimate and prevent probable future issues. To do this, adequate real models and laboratory tools are essential to test and verify the functionalities of any developed model under practical challenges.
To address these issues, this paper proposes an aggregator model with a precise vision of DR timeline and ramp period. The model includes introducing the roles of aggregator in the electricity system as a third party, and how it deals with DR programs implementation and remuneration payments. Furthermore, a case study is developed in this paper to validate the model under practical challenges and technical issues. This has been done by a real-time simulator machine (OP5600) and a set of laboratory equipment as hardware-in-the-loop (HIL). In this way, the behavior of aggregator is surveyed in each moment of DR implementation, especially in the ramp period before the event being started. In the end, the remuneration costs are compared using both experimental and numerical results to reveal the importance of experimental tests and validations.
The rest of the paper is organized as follows: A literature review is presented in Section 2 to identify the challenges and gaps in the current trend of aggregator and DR programs. Section 3 presents the proposed methodology in four different subsections including the role of the aggregator in the power system, DR timeline, and ramp period evaluation, key points of aggregator to define DR programs, and a linear programming optimization for the aggregator to minimize DR remuneration costs. Subsequently, Section 4 proposes a case study and real-time simulation model developed for the aggregator to validate it using practical challenges, and its results are shown in Section 5. Finally, the main conclusions of the work are presented in Section 6.
2. Literature Review and Paper Contributions
There are plenty of research works focused on the context of the aggregator model and DR implementation. In [8], a methodology has been described to use multitype DR programs to smooth the uncertainty of RERs. The method utilizes a multi-objective scheduling algorithm for smoothing the fluctuations in RERs. Several constraints for DR programs have been considered in the same paper in order to maximize the user of RERs and maintain the balance in the network.
A real-time simulation model has been proposed in [12] for an aggregator entity, which uses several real hardware resources to emulate the consumption and generation profiles. Also, an optimization problem has been developed in the same work to optimally schedule the DR resources and RERs aiming at minimizing the aggregator operational costs. Although an actual infrastructure has been proposed in [12] for testing aggregator’s concepts, there is no discussion about the ramping of DR programs prior to the event, and how aggregator deals with remunerations in this period. A realistic model of an aggregator in the scope of curtailment service provider has been presented in [17]. The authors proposed a real-time simulation model that supports decision making for DR validation in real-time. Also, a preliminary discussion has been proposed in the paper regarding the ramp period before DR events proposing the use of RERs and DR programs. The presented results proved the performance of the curtailment service provider using real measured data from the laboratory equipment. However, there is no discussion about how curtailment service provider behaves with incentive payments, and also a precise vision to the DR program information received from system operator, such as notification deadline, program duration, etc.
In [23], the authors proposed an assessment of a DR program for consumers who are equipped with a smart meter. A load-serving entity plays the role of the aggregator to offer incentives to the participant relying on near real-time information. Moreover, a timeline has been proposed in the same work regarding the information exchange between the load-serving entity and ISO regarding DR programs. Although the paper presented an interesting model, the authors validated their model through a numerical case study, and there is a lack of an experimental test and validation.
A bottom-up model has been proposed in [24] for an aggregator dealing with DR programs. Load shifting, load recovery, and load curtailment are considered as three types of DR programs available in the aggregator network. Also, through this model, the aggregator participates in the day-ahead markets by trading these DR flexibilities. In the end, the authors validated their model by a numerical case study using Nordic electricity market.
In [25], the authors discussed a short-term decision-making model for an electricity retailer that included RERs. Also, short-term DR trading methodology has been proposed somehow the retailer submits this flexibility to the markets in each hour. Through the simulation performed in the case study, the authors validated that the financial profits of the retailer will be increased if it participates in both real-time market and short-term DR trading mechanism. A short-term self-scheduling model has been developed in [26], which is used by the DR aggregators. It also addressed the uncertainties of the electricity customers participating in the market. Two types of DR programs have been used in this model, which are reward-based DR and time-of-use. The proposed approach has been validated through a case study with realistic data from electricity markets.
Focusing on communication infrastructures in the aggregator network, the work presented in [27] focused on an energy quality aware bandwidth aggregation scheme. The authors firstly modelled the delay-constrained energy quality tradeoff for multipath video communications using wireless networks, and then, they present an approach to merge the rate adaptation. They surveyed the performance of the system using real wireless networks and emulations test beds. In addition to this work, in [28], the authors provided an energy efficient and quality guaranteed video transmission solution. In fact, they proposed an approach to characterize energy distortion tradeoff for video transmission in wireless networks. Furthermore, the authors of the same work developed an algorithm to optimize the energy consumption to achieve video quality target. Their experimental results demonstrated that the developed solution has performance advantages comparing to the schemes in term of energy conversion and video quality.
The main contribution of the present paper, according to the reviews presented above, where only a few of them were focused on the behavior of aggregator during ramp period of DR implementation, is the development of a model that considers short and real-time DR programs ramping, using real-time simulator and laboratory equipment. In fact, most of the previous works considered a simple period prior to the event showing and mainly focusing on the aggregator scheduling process or DR programs itself. Furthermore, a lot of interesting models and research works are available in the literature focusing on the concepts of aggregator under short and real-time DR programs. However, those lack adequate testing on real infrastructures under practical challenges and technical issues.
The following topics are addressed, supporting the main contribution of the paper:
- Evaluating the performance of aggregator during DR implementation timeline, especially the ramp period, in term of scheduling and remuneration;
- Improving aggregator resources management in short and real-time DR;
- Developing a real-time simulation model using a set of laboratory equipment to evaluate the aggregator’s performance under practical and technical challenges;
- Remunerating consumers by comparing costs between the actual and simulated demand reduction profiles.
3. Proposed Methodology
This section presents the entire developed model for the aggregator and DR programs. The structure of this section consists of proposing the aggregator model focusing on its role in the electricity systems and wholesale markets. Then, it focuses directly on the DR timeline and the ramp period before the event being started. Later, DR programs specifications presented for the aggregator are demonstrated, and in the last subsection, a linear programming with the objective of DR cost minimization is shown for the aggregator model.
3.1. Aggregator Architecture
This part describes the architecture of the presented aggregator model for DR programs. In fact, the responsibility of the aggregator in this paper is to gather all small and medium scale DR participants located in the same geographical area and present this flexibility to the electricity market negotiation as a unique resource. To do this, the aggregator has to make bidirectional contracts with the electricity consumers who intend to participate in one or more DR programs. This enables the aggregator accordingly to control and monitor the consumption of the end-users. Figure 1 shows the role of aggregator as a network player in electricity systems and smart grid technology.
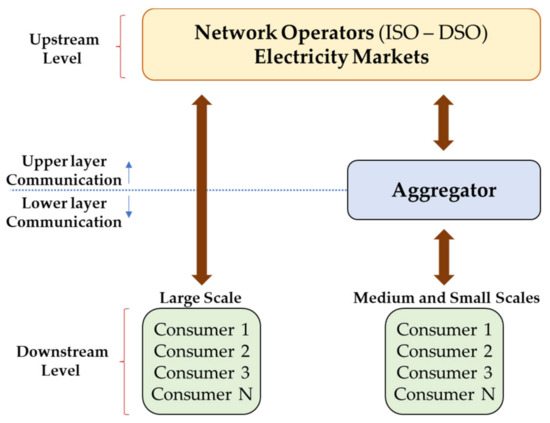
Figure 1.
Participation of aggregator in the electricity system as a third-party entity.
As Figure 1 illustrates, the aggregator has a transactional role between the downstream (medium and small-scale DR participants) and upstream (electricity markets and network operators) sides of the network. Indeed, the aggregator has two layers, namely communication-based controlling and monitoring sides. In the upper layer, the aggregator is in touch with network operators or electricity market operators. While some technical or economic instabilities occur in the network, and it is required to reduce network consumption, the aggregator will be notified by the upstream level players to apply DR programs. Subsequently, in the lower layer, the aggregator has a multi-round communication with the downstream level of the network (i.e., consumers), as it may have some voluntary DR programs. In other words, the aggregator cannot forecast the response of consumers to each DR event. This leads to having several iterations of DR requests from aggregator to the consumers, and in response, the consumers reply with their preferences, demand bids, reduction capacity, price signal, etc. This procedure will be continued until the aggregator reaches the reduction baseline, which is, in fact, one of the responsibilities of the aggregator during the ramp period. In the last step, the aggregator presents DR bids in the electricity markets with a certain rate based on the real-time price of the market. Generally, the aggregator has day-ahead information of DR bids, such as forecasted reduction rate. Therefore, it should consider the reduction rate a bit higher than the forecasted baseline. This is due to preventing possible failures in the case of some consumers opting out during the event.
In the practical phase, communication infrastructures are very important as they play as a base for the network management strategies, as all network players must exchange data continuously in real-time. This is more visible in critical moments, such as the ramp period, as the aggregator should have real-time information of the DR participants. Furthermore, there are instances during the DR event or ramp period whereby aggregator needs to verify that the consumers have followed the DR programs and contractual reduction correctly, according to the request of the operator (in the case of incentive-based DR). Therefore, all consumers should be equipped with a local energy management system, smart metering, and advanced metering infrastructure (AMI) to monitor real-time data, especially power consumption.
3.2. DR Timeline and Ramp Period
The ramp period is the time that the DR program manager gives to consumers in order to reach the contractual DR event baseline. The duration of the ramp period can be various based on the type of consumers, type of loads, the geographical location of the electricity market and system operator, etc. Also, all consumers will be notified in advance (from several months to 5 min) prior to the ramp period. Consequently, in short, and real-time DR programs, the tasks of aggregator are more complex as it should process the advance notification time, ramp period, and response duration before starting the event.
While the DR program manager specifies a DR event to be implemented by the aggregator, lots of information and setpoints will be dispatched and transmitted between these two entities. Figure 2. illustrates the timeline and information specified for a DR program. In fact, most of the parameters in the following timeline, such as the duration of assessment and ramp period, are defined by the DR program manager and transmitted to the aggregator using the upper communication layer shown in Section 3.1.
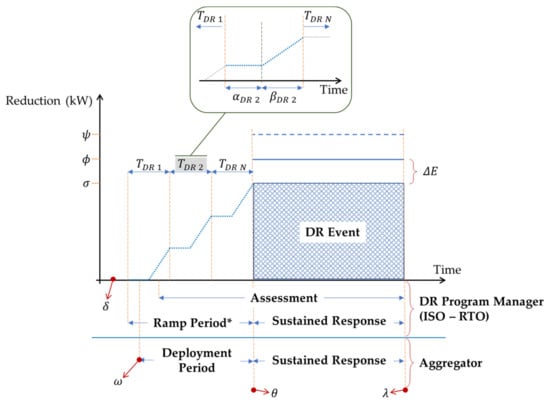
Figure 2.
Timeline for demand response implementation by the aggregator.
The first point in the timeline shown in Figure 2 is the announcement deadline (), which is the last opportunity for the DR program manager to notify the aggregator for the DR event. After then, there is a ramp period considered as the time that aggregator is allowed to reach the desired amount of reduction. In the meanwhile, the deployment starting point () is a moment during the ramp period that aggregator can take a risk to start the event by relying on forecasting the availability of DR resources. The main difference between deployment and assessment periods is that assessment is a paid period. The deployment period is the period that aggregator collects all the DR amount by different programs. In fact, the aggregator is able to collect all DR amounts within the ramp period, but it is free to start the event a bit later than the starting point of the ramp period. However, the aggregator can operate cautiously and notify DR resources for the event, during the ramp period, and wait for their response. In the last stage, the reduction deadline () is the point at which the aggregator evaluates the available reduction capacity and verifies that their capacity is above the forecasted reduction baseline (). However, the event could also be started if the available reduction capacity is in the margin of forecast error (), above the reduction baseline () defined by the DR program manager. While the DR event has been started, the timeline enters a sustained response period, which is the time that DR participants have to maintain their committed level of reduction until the end of the event (). During the sustained response period, both communication layers shown in Figure 1 are involved. In the lower layer, consumers transmit the related information to the aggregator, namely real-time consumption, and in the upper layer, aggregator conveys the consumer’s information to the DR program manager.
Focusing on the ramp period in the lower communication layer of aggregator, Figure 3 demonstrates a cascade communication process during the ramp period between aggregator and consumers. By comparing Figure 2 and Figure 3, in the first point of the ramp period, aggregator notifies consumers associated with demand response program (DRP) 1. This leads to having an activation notification period, indicated by in the timeline illustrated in Figure 2. After that, consumers reply with OPT IN or OPT OUT, and then if they are OPT IN, they will start the load reduction process. This has been indicated by in the timeline shown in Figure 2 that stands for the actual response period.
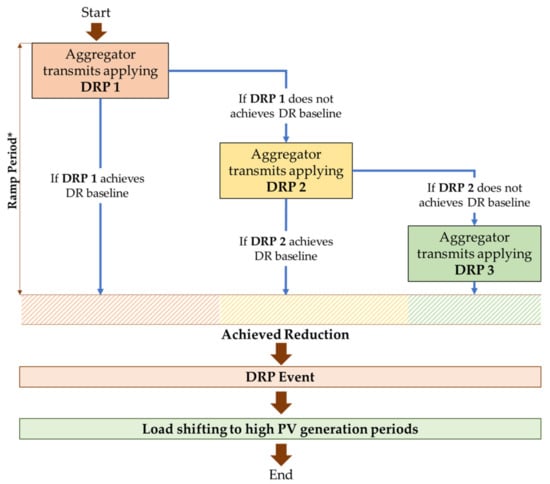
Figure 3.
Ramp period evaluation process by the aggregator.
While consumers are replying with the actual reduction, the aggregator assesses the DRP 1 to check if it is sufficient for achieving the reduction baseline. If DRP 1 was insufficient, the aggregator evaluates the use of DRP 2 and notifies the consumers associated with DRP 2. This procedure is continued until the aggregator achieves to the forecasted reduction baseline, so it can inform the DR program manager and start the event.
3.3. Demand Response Programs
The aggregator is able to implement various types of DR programs. However, each program has its specific timescale. Therefore, the aggregator should select the most appropriate program according to the available timescale and objective, from long-term to real-time (Figure 4). In this paper, the main focus is given to short and real-time programs, as the ramp period is more critical in such programs. Therefore, the programs with long-term timescale (months or years planning) will be ignored.
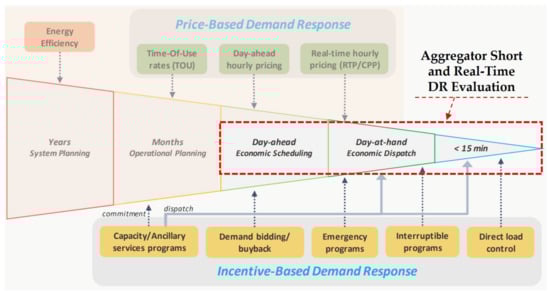
Figure 4.
The timescale of demand response implementation. Adapted from [22].
Furthermore, short and real-time DR programs are more applicable comparing to other types of programs. The reason is they are usually implemented for improving or maintaining power quality as well as security of the power distribution network (e.g., voltage and frequency instabilities issues). In this context, incentive-based DR programs are the ones that can be implemented in short-term to real-time timescale, especially less than 15 min. If the aggregator intends to define a DR program, there are plenty of parameters and specifications that have to be considered. In below, there is a list of the most relevant ones to the model proposed in this paper:
- Program Type: Depending on the specification of the market, the DR program can be mandatory or voluntary. In voluntary programs, consumers can decide to participate in the event or not. In mandatory programs (e.g., DLC), the aggregator has full control over the contractual equipment as there is no need for consumer’s permission. However, all DR participants will be notified before events whether in mandatory or voluntary programs;
- Remuneration: Most of DR programs has a remuneration rate that can be a power tariff discount, or an incentive paid for reduced kWh. However, some DR programs can be without remuneration as they are price-based;
- Activation signal: The aggregator can activate the event by transmitting a signal to the local controller on the consumer side. This signal can be a reduction notification, actual consumption level, electricity price notification, DLC control signal, etc.;
- Measure/Contract: The aggregator should specify in the program that what kinds of information DR participants must convey to the aggregator during the sustained response period. As an example, it can be the actual kWh reduction or real-time consumption data.
While a lot of DR programs with various specifications and parameters are accessible for the aggregator to implement, a question would be raised that which program is the most economical and optimal solution for the network. Therefore, DR program dispatch can make the use of a linear programming approach as will be explained in the next subsection.
3.4. Optimization
In this part, a set of the mathematical formulation is proposed for the aggregator model to choose the most optimal DR solution. The formulation is related to linear programming with the objective of DR cost minimization from the aggregator standpoint. As mentioned before, all consumers participating in DR programs have a contractual reduction limit as well as a remuneration tariffs associated with each program.
Equation (1) shows the objective function of the proposed linear programming, which aims to minimize the costs related to the DR programs. In this model, technical specifications of the grid, such as load balance, voltage control, etc. are not considered as it is assumed that the network operator is accountable for them. Furthermore, it is presumed aggregator will not sell/buy electricity to/from consumers, and it is only responsible for DR program implementation and provide these flexibilities to the market negotiations. So, the focus of these formulations is only given to economic aspects of DR programs from aggregator standpoint.
The proposed objective function is modeled as a linear programming optimization problem using Rstudio® tool (www.rstudio.com), using a computer with Intel® Xeon® CPU @2.10 GHz, and 16 GB RAM. The linear and convex problem implemented, which includes in the present case study 4860 variables, can be solved by brute-force, heuristics, and others. There are several constraints that are applied to this objective function. Equation (2) shows the limitation of each DR resource in terms of minimum and the maximum capacity of them. Also, Equation (3) presents that the sum of capacity in available schedulable and non-schedulable DR resources ( during the event should be higher than the reduction baseline in addition to the forecast margin error. This means that aggregator is always counting on an extra reduction capacity higher than the defined baseline to prevent the possible failures if some consumers opted out during the event. However, there is a limit for this extra capacity, and if the reduction goes higher than this limit, the additional capacity is not being paid. This is shown by Equation (4).
In sum, this section presented the developed aggregator model with a focus on the DR timeline and aggregator’s responsibility during the ramp period before the DR event is started. In the next section, a case study is proposed in order to validate and survey the functionalities of the presented model using an actual methodology and real infrastructures.
4. Case Study and Real-Time Simulation
This part explains a case study for validating and surveying the performance of the developed model under different challenges. To do this, it is considered that there is a small village with a lot of residential and commercial consumers, and only 27 of the residential consumers have direct DR contract with the aggregator. This means that the aggregator has no interaction with other consumers that are not participating in the DR programs. In the aggregator network, there are 10 consumers equipped with Photovoltaic (PV) panels as RERs, and five consumers with energy storage system (ESS). The use of RERs makes the aggregator capable to shift the load in the high PV generation periods, as the energy produced by this resource is uncontrollable. Figure 5 shows the village and the related aggregator network. In this case study, a part of the DR participants in the aggregator is being emulated by a set of laboratory equipment, so-called resistive loads bench in this paper. In this way, the aggregator’s performance can be surveyed in both simulation and experimental aspects.
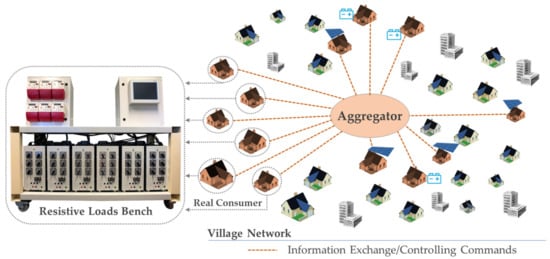
Figure 5.
Schematic of the aggregator network in the case study.
The resistive loads bench consists of six resistive consumer loads that each of which has a nominal capacity of 4 kW. The bench is equipped with a set of controlling and monitoring devices, including a programmable logic controller (PLC) as a central controller of the bench, a set of relays to control the rate of consumption in each load, and a set of energy meters and commercial smart meters in order to monitor the real-time consumption of the loads. To survey both numerical and experimental features of the aggregator, a MATLAB™/Simulink model has been developed representing the electrical network of the 27 consumers in the aggregator model, as Figure 6 shows. Moreover, the OP5600 real-time simulator has been utilized to integrate the resistive loads bench in the Simulink model as hardware-in-the-loop (HIL). In fact, OP5600 executes the Simulink model in real-time enabling the user to control and monitor real hardware resources outside of simulation environments. This is done through several communication protocols as well as Digital and Analog slots in OP5600. More information about the performance of OP5600 and HIL methodology are available in [12].
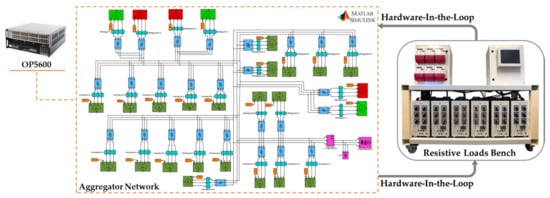
Figure 6.
Real-Time simulation model of aggregator integrated with HIL methodology.
Regarding the DR programs, three types of programs are considered that consumers are able to establish with the aggregator, as Table 1 shows. Each program has its own features and specifications, which the aggregator defined according to the instructions and regulations of the upstream network players, such as market operator and DR program manager.

Table 1.
DR contracts available for consumers to establish with aggregator.
The DR programs and the related remuneration rates shown in Table 1, has been developed by the authors in the scope of their previous works, and only the most relevant description has been mentioned in this part. More detailed information about these DR programs is available in [29]. According to Table 1, if a consumer establishes a contract with the aggregator for DLC T1, it will give permission to the aggregator to directly control its air conditioner, and in exchange, the consumer receives an incentive of 0.05 EUR/kWh for the reduction. In the DLC T2 contract, the aggregator is able to directly control the washing machine and dishwasher of the DR participant for a contractual number of events per month. Consumers who participate in DLC T2 receive an incentive of 0.06 EUR/kWh for the reduction. The last DR contract that consumers can establish with aggregator is IDRP. As this program is voluntary, the consumer can decide to participate or not. Therefore, a longer notification time is considered for this program, so the consumer has an adequate amount of time to make a decision. Table 2 demonstrates the capacity of the associated devices in all 27 consumers related to the aggregator network. The capacities shown on the same table are in kiloWatt (kW). As is clear in Table 2, each consumer has at least one DR contract with the aggregator. This means that the associated devices dedicated in Table 2, are being controlled by aggregator in DLC T1 and T2 programs, and by consumer itself in IDRP. The capacities shown in Table 2 are an average between the minimum and maximum active power consumption of each during an entire day.
Table 2.
Controllable devices involved in the DR programs (AC = Air Conditioner, WM = Washing Machine, DW= Dishwasher, WH= Water Heater, FH = Fan Heater).
Furthermore, as Table 2 shows, 85% of consumers are equipped with air conditioner, 26% of them have washing machine, 52% include dish washer, 33% have water heater, and 22% of them have fan heater. Figure 7 illustrates a day-ahead consumption and generation profile of the entire aggregator network as well as available DR capacities presumed for the case study based on Table 2. The data shown in Figure 7 are for a random winter day with a 15-min time interval, and adapted from a research project [30] related to the implementation of an intelligent energy management system in two small cities in Portugal.
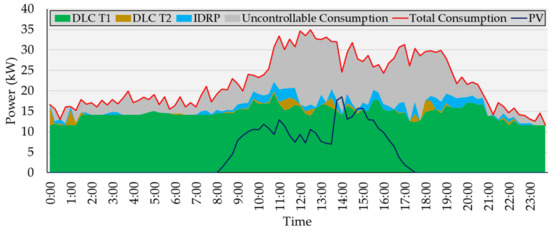
Figure 7.
Aggregator consumption profile and stacked available DR capacities.
The consumption shown in Figure 7 is only related to the aggregator network (27 consumers) and not to the entire village. Moreover, the uncontrollable part of consumption is related to the devices on the consumer side that aggregator has no interaction with them. In this case study, it is considered that the aggregator receives a DR event from the DR program manager with 10 kW as the reduction baseline, starting at 12:00 PM for two hours. Also, the aggregator is notified one hour in advance. The reason for this DR event could be a technical fault or any economic causes in the main grid. Figure 8 shows the DR event applied in the aggregator consumption profile.
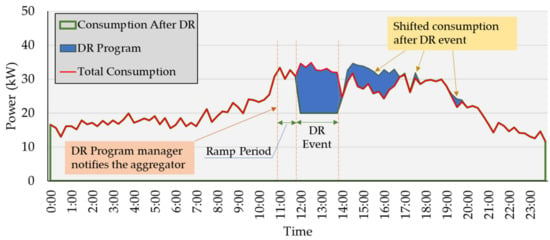
Figure 8.
Proposed DR event applied in the aggregator consumption profile.
As Figure 8 shows, the reduced consumption during the DR event has been shifted to some periods after the event that have a high rate of PV generation. This enables the aggregator to use the energy produced by the local resources. Since the notification time of the event is one hour in advance, the aggregator should reach the reduction baseline for one hour (i.e., ramp period). Therefore, the aggregator starts announcing the consumers one by one to participate in the event. In the meantime, if some consumers have delay on replying to the DR announcement, the aggregator is able to use and discharge the available ESS in order to compensate the response time of the consumers. Also, the aggregator adjusts its internal reduction baseline to around 15 kW for keeping the consumption rate at 20 kW. This is due to overcoming the possible issues during the event, namely some consumers opting out.
In practice, a consumption profile with a 15-min time interval is not that applicable for remuneration and scheduling purposes, as a lot of changes could happen during this time. In some cases, it is possible that the DR program manager pays incentives to the aggregator with a 15-min time interval. However, in the downstream side of the network, as the aggregator is dealing with every single consumer, the 15-min time interval is a long period. Consequently, in order to have a clear vision of the consumption profile during the ramp period and DR event, Figure 9 illustrates the aggregator consumption curve between 11:00 to 14:00, with a 1-min time interval. In the same figure, the uncontrollable part of aggregator consumption is not shown as the focus is given to the controllable part of consumption.
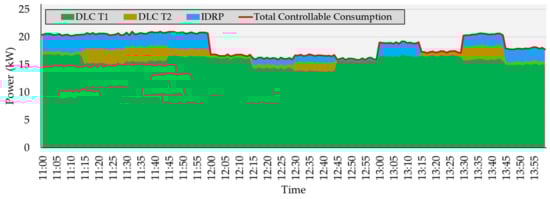
Figure 9.
Available Demand response programs during ramp period and event.
As is clear in both Figure 7 and Figure 9, almost half of the consumption during ramp period and the event itself is dedicated to DLC T1 (air conditioner), and only a few parts are devoted to DCL T2 (washing machine and dishwasher) and IDRP (water heater and fan heater). As the fan heaters in the IDRP program are resistive loads, they are a suitable target for emulating by resistive loads bench. Thus, in the next section (results) all fan heaters in the aggregator that are associated in the IDRP program are being emulated by the resistive loads bench and the behavior of each device as well as the aggregator facing an actual profile will be scrutinized.
5. Results
This section presents all the gained results from the aggregator standpoint. All the results provided in this section are for surveying the performance of the aggregator model during the ramp period and the DR event itself. Figure 10 shows the consumption reduction profiles after applying DR programs. The results shown in the same figure are with the one-minute time interval between 11:00 where the DR program manager notified the aggregator for the event, until the end of the event (14:00).
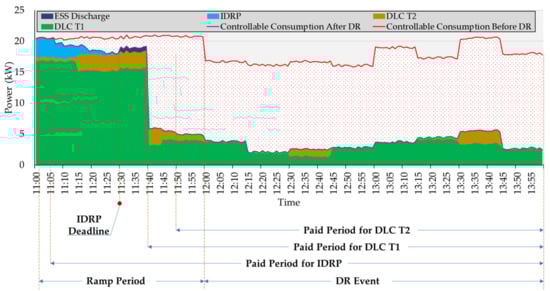
Figure 10.
Results of applying demand response programs by the aggregator.
As it is clear in Figure 10, the aggregator firstly started to apply IDRP since it has the lowest remuneration rate from the aggregator point of view. To do this, the aggregator announced all the IDRP resources one by one and waited for their response as the program is voluntary. Then, all IDRP participants replied with their desired responses (OPT IN or OPT OUT) until 11:30 (program deadline). After that, the aggregator evaluates the use of the IDRP program and as it did not reach the reduction baseline, it decided to apply DLC T1 program. Therefore, the aggregator notifies DLC T1 participants 5 min in advance (11:35) to the starting point of the event (11:40). During this 5 min, the aggregator takes advantage of the available ESSs and start discharging them, so there would be a reduction in the consumption. While all resources in DLC T1 have participated in the event and the reduction rate of DLC T1 has been reached, the aggregator stops discharging the ESSs. The same procedure is also applied for DLC T2, and finally, at 11:50, when the aggregator reached the desired reduction baseline and it is ready to start the event at 12:00.
Moreover, as Figure 10 shows, the starting point of the paid period for each program is the moment that the first participant reduced its consumption, so the aggregator has to pay the contractual remuneration according to the reduced power. In other words, the aggregator receives the remuneration from the DR program manager only for event duration (i.e., in this case, two hours between 12:00 to 14:00). However, the aggregator must start paying the remuneration before the event during ramp period as the DR participants started the consumption reduction. That’s why aggregator should pay remuneration to the DR participant with a lower rate than the one that it receives from the DR program manager, so it would be able to manage all the paid periods without a financial downturn.
In order to have a more precise and technical vision to the model, Figure 11 illustrates the experimental results adapted from the real-time simulation model and Resistive Loads Bench as HIL. The results shown Figure 11 are related to the 6 DR participants that own Fan Heater and they are involved in the IDRP (indicated in Table 2). In fact, each consumer load in the Resistive Loads Bench emulates a Fan Heater in each DR participant. The results demonstrated in Figure 11 are adapted from MATLAB™/Simulink and OP5600 in 3600 periods of 0.5 s, which is in total 30 min, between 11:00 to 11:30 while all IDRP resources are announced to participate. In other words, the time step of this model in real-time simulation is set at 0.5 s. This means OP5600 conveys the reference signal (power reference in Figure 11) to the resistive load bench with one-minute time interval, and then, it acquires real-time consumption data with 0.5 s time interval. The actual power measurement curve in Figure 11 shows the real behaviors and reactions of resistive consumer loads, and it is only shown until the IDRP deadline, as after this moment all their consumption was cut.
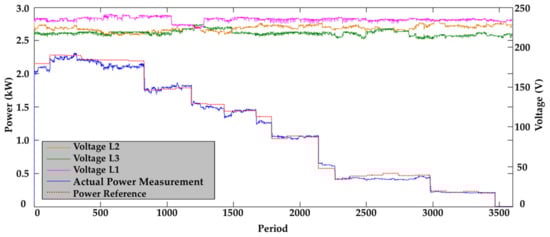
Figure 11.
Experimental results adapted from OP5600 and Resistive Loads Bench.
Indeed, employing real-time simulation (OP5600) and laboratory equipment as HIL for emulating consumption profiles have several advantages. One of them is that we validate the actual demand reduction under the technical parameters of the grid, namely voltage variations (as shown in Figure 11). This leads to having a gap between the experimental and simulation results. This gap is clearly visible in Figure 11 between the red dashed line as Power Reference and the blue line as actual power measurement. Consequently, it is interesting to calculate and compare the remuneration costs of aggregator using both experimental and simulation results. Figure 12 shows the accumulated remuneration costs during the ramp period and the event using simulation profiles.
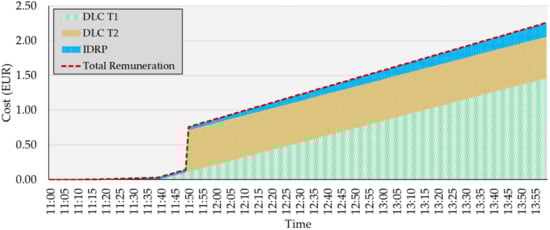
Figure 12.
Accumulated remuneration costs of aggregator during the ramp period and the event.
As Figure 12 shows, there are a few remuneration costs for the IDRP program as the remuneration rate and the available capacity were not significant. Also, the costs of DLC T1 has a linear ascending gradient since the available capacity of this program was constant during the event. Finally, as DLC T2 has a fixed remuneration rate per event, it has a constant ratio in the aggregator’s remuneration expenses. Table 3 demonstrates the detailed cost calculation for each program. In Table 3, the main focus is given to the first 30 min of the IDRP program as the real-time simulation and HIL methodology have been implemented for this specific program. The actual and simulation profiles are respectively the blue (actual power measurement) and red dashed line (power reference) in Figure 11.
Table 3.
Remuneration costs for each program paid by the aggregator to DR participants.
As Table 3 shows, the calculated remuneration cost between 11:00 to 11:29 in IDRP has a difference between the actual and simulation profiles. This cost difference is not significant because in this specific model it is only for six fan heater devices as a part of the IDRP program, which has a little reduction capacity for 30 min. Suppose that the aggregator has a huge number of DR participants, namely 1 million customers with a longer DR event. Therefore, this little difference becomes remarkable in this case as it would mean a huge amount of cost variation between what it is expected and what occurs in actual cases.
6. Conclusions
Using renewable energy resources and distributed generation has an important role to reduce the peak of greenhouse gas emissions. Innovative management strategies, such as integrating demand response programs, are required. This paper presented a precise vision of the demand response timeline in an aggregator model. The proposed aggregator has been considered as a third party between the upstream and downstream sides of the network, to aggregate small scale demand response resources. The time needed in the short and real-time demand response programs to notify all participants, to wait for their response, and evaluate the available resources is addressed.
For real-time simulation, a set of resistive loads to emulate the actual demand reduction of some demand response participants have been used. The numerical results highlight that the costs related to the periods prior to the event, such as ramp period, should be taken into account as in the most of model, demand response costs are only related to the period between the starting and ending point of the event. It should always be considered that normally the aggregator does not reach the desired reduction level immediately, and it requires some time to reach the desired reduction level. Regarding the remuneration, while the consumption is being reduced, consumers expect to receive remunerations for the related consumption reduction, even if the reduction has occurred prior to the starting of the event.
The experimental results obtained through emulation of loads indicate that there is a gap between the expected and actual results. In this way, laboratory tests play an important role to reveal technical issues of any model under practical challenges, namely voltage variations, frequency instabilities, and other electrical grid conditions.
Author Contributions
Conceptualization, P.F.; investigation, O.A.; methodology, P.F.; project administration, Z.V.; resources, O.A.; writing—original draft, O.A.; writing—review and editing, P.F. and Z.V. All authors have read and agreed to the published version of the manuscript.
Acknowledgments
The present work was done and funded in the scope of the following projects: UIDB/00760/2020, CEECIND/02887/2017, and COLORS PTDC/EEI-EEE/28967/2017, funded by FEDER Funds through the COMPETE program. This work has also received funding from the European Union’s Horizon 2020 research and innovation programme under project DOMINOES (grant agreement No 771066).
Conflicts of Interest
The authors declare no conflict of interest.
Nomenclature
| Required time to achieve demand response baseline | |
| Notification time specified for each demand response program | |
| Actual response time of demand response program | |
| Maximum paid reduction | |
| Forecasted reduction baseline | |
| Reduction baseline | |
| Announcement deadline | |
| Deployment deadline | |
| Reduction deadline | |
| The finishing point of the demand response event | |
| The forecast error margin of reduction baseline | |
| C | Number of consumers |
| Incentive paid for each demand response program | |
| The non-schedulable demand response program | |
| The schedulable demand response program |
References
- Wang, S.; Tarroja, B.; Schell, L.S.; Shaffer, B.; Samuelsen, S. Prioritizing among the end uses of excess renewable energy for cost-effective greenhouse gas emission reductions. Appl. Energy 2019, 235, 284–298. [Google Scholar] [CrossRef]
- Leonard, M.D.; Michaelides, E.E.; Michaelides, D.N. Energy storage needs for the substitution of fossil fuel power plants with renewables. Renew. Energy 2020, 145, 951–962. [Google Scholar] [CrossRef]
- Ghorbani, N.; Aghahosseini, A.; Breyer, C. Assessment of a cost-optimal power system fully based on renewable energy for Iran by 2050—Achieving zero greenhouse gas emissions and overcoming the water crisis. Renew. Energy 2020, 146, 125–148. [Google Scholar] [CrossRef]
- Abrishambaf, O.; Lezama, F.; Faria, P.; Vale, Z. Towards transactive energy systems: An analysis on current trends. Energy Strategy Rev. 2019, 26, 100418. [Google Scholar] [CrossRef]
- Sikorski, T.; Jasiński, M.; Ropuszyńska-Surma, E.; Węglarz, M.; Kaczorowska, D.; Kostyła, P.; Leonowicz, Z.; Lis, R.; Rezmer, J.; Rojewski, W.; et al. A Case Study on Distributed Energy Resources and Energy-Storage Systems in a Virtual Power Plant Concept: Economic Aspects. Energies 2019, 12, 4447. [Google Scholar] [CrossRef]
- Abrishambaf, O.; Faria, P.; Gomes, L.; Spínola, J.; Vale, Z.; Corchado, J. Implementation of a Real-Time Microgrid Simulation Platform Based on Centralized and Distributed Management. Energies 2017, 10, 806. [Google Scholar] [CrossRef]
- Morales González, R.; Shariat Torbaghan, S.; Gibescu, M.; Cobben, S. Harnessing the Flexibility of Thermostatic Loads in Microgrids with Solar Power Generation. Energies 2016, 9, 547. [Google Scholar] [CrossRef]
- Yi, W.; Zhang, Y.; Zhao, Z.; Huang, Y. Multiobjective Robust Scheduling for Smart Distribution Grids: Considering Renewable Energy and Demand Response Uncertainty. IEEE Access 2018, 6, 45715–45724. [Google Scholar] [CrossRef]
- Althaher, S.; Mancarella, P.; Mutale, J. Automated Demand Response From Home Energy Management System Under Dynamic Pricing and Power and Comfort Constraints. IEEE Trans. Smart Grid 2015, 6, 1874–1883. [Google Scholar] [CrossRef]
- Federal Energy Regulatory Commission. Assessment of Demand Response & Advanced Metering; Federal Energy Regulatory Commission: Washington, DC, USA, 2011. [Google Scholar]
- Behboodi, S.; Chassin, D.P.; Djilali, N.; Crawford, C. Transactive control of fast-acting demand response based on thermostatic loads in real-time retail electricity markets. Appl. Energy 2018, 210, 1310–1320. [Google Scholar] [CrossRef]
- Abrishambaf, O.; Faria, P.; Vale, Z. Application of an optimization-based curtailment service provider in real-time simulation. Energy Inform. 2018, 1, 3. [Google Scholar] [CrossRef]
- Alasseri, R.; Rao, T.J.; Sreekanth, K.J. Conceptual framework for introducing incentive-based demand response programs for retail electricity markets. Energy Strategy Rev. 2018, 19, 44–62. [Google Scholar] [CrossRef]
- Du, P.; Lu, N.; Zhong, H. Demand Response in Smart Grids; Springer: Berlin/Heidelberg, Germany, 2019; ISBN 978-3-030-19768-1. [Google Scholar]
- Bakr, S.; Cranefield, S. Using the Shapley Value for Fair Consumer Compensation in Energy Demand Response Programs: Comparing Algorithms. In Proceedings of the 2015 IEEE International Conference on Data Science and Data Intensive Systems, Sydney, Australia, 11–13 December 2015; pp. 440–447. [Google Scholar]
- Martínez Ceseña, E.A.; Good, N.; Mancarella, P. Electrical network capacity support from demand side response: Techno-economic assessment of potential business cases for small commercial and residential end-users. Energy Policy 2015, 82, 222–232. [Google Scholar] [CrossRef]
- Abrishambaf, O.; Faria, P.; Vale, Z.; Corchado, J.M. Real-Time Simulation of a Curtailment Service Provider for Demand Response Participation. In Proceedings of the 2018 IEEE/PES Transmission and Distribution Conference and Exposition (T&D), Colorado, CO, USA, 16–19 April 2018; pp. 1–9. [Google Scholar]
- Kwon, S.; Ntaimo, L.; Gautam, N. Optimal Day-Ahead Power Procurement with Renewable Energy and Demand Response. IEEE Trans. Power Syst. 2017, 32, 3924–3933. [Google Scholar] [CrossRef]
- Della Giustina, D.; Ponci, F.; Repo, S. Automation for smart grids in Europe. In Application of Smart Grid Technologies; Elsevier: Amsterdam, The Netherlands, 2018; pp. 231–274. [Google Scholar]
- Abrishambaf, O.; Faria, P.; Vale, Z. SCADA Office Building Implementation in the Context of an Aggregator. In Proceedings of the 2018 IEEE 16th International Conference on Industrial Informatics (INDIN), Porto, Portugal, 18–20 July 2018; pp. 984–989. [Google Scholar]
- Khorram, M.; Abrishambaf, O.; Faria, P.; Vale, Z. Office building participation in demand response programs supported by intelligent lighting management. Energy Inform. 2018, 1, 1–14. [Google Scholar] [CrossRef]
- Spinola, J.; Abrishambaf, O.; Faria, P.; Vale, Z. Identified Short and Real-Time Demand Response Opportunities and the Corresponding Requirements and Concise Systematization of the Conceived and Developed DR Programs—Final Release. Available online: http://dream-go.ipp.pt/PDF/DREAM-GO_Deliverable2-3_v3.0.pdf (accessed on 15 January 2020).
- Zhong, H.; Xie, L.; Xia, Q. Coupon Incentive-Based Demand Response: Theory and Case Study. IEEE Trans. Power Syst. 2013, 28, 1266–1276. [Google Scholar] [CrossRef]
- Mahmoudi, N.; Heydarian-Forushani, E.; Shafie-khah, M.; Saha, T.K.; Golshan, M.E.H.; Siano, P. A bottom-up approach for demand response aggregators’ participation in electricity markets. Electr. Power Syst. Res. 2017, 143, 121–129. [Google Scholar] [CrossRef]
- Do Prado, J.C.; Qiao, W. A Stochastic Decision-Making Model for an Electricity Retailer with Intermittent Renewable Energy and Short-Term Demand Response. IEEE Trans. Smart Grid 2019, 10, 2581–2592. [Google Scholar] [CrossRef]
- Vahid-Ghavidel, M.; Mahmoudi, N.; Mohammadi-Ivatloo, B. Self-Scheduling of Demand Response Aggregators in Short-Term Markets Based on Information Gap Decision Theory. IEEE Trans. Smart Grid 2019, 10, 2115–2126. [Google Scholar] [CrossRef]
- Wu, J.; Cheng, B.; Wang, M.; Chen, J. Energy-Efficient Bandwidth Aggregation for Delay-Constrained Video over Heterogeneous Wireless Networks. IEEE J. Sel. Areas Commun. 2016, 35, 30–49. [Google Scholar] [CrossRef]
- Wu, J.; Cheng, B.; Wang, M.; Chen, J. Quality-Aware Energy Optimization in Wireless Video Communication With Multipath TCP. IEEE/ACM Trans. Netw. 2017, 25, 2701–2718. [Google Scholar] [CrossRef]
- Abrishambaf, O.; Faria, P.; Vale, Z. Participation of a Smart Community of Consumers in Demand Response Programs. In Proceedings of the 2018 IEEE Clemson University Power Systems Conference (PSC), Clemson, SC, USA, 8–11 March 2018; pp. 1–5. [Google Scholar]
- Faria, P.; Barreto, R.; Vale, Z. Demand Response in Energy Communities Considering the Share of Photovoltaic Generation from Public Buildings. In Proceedings of the 2019 IEEE International Conference on Smart Energy Systems and Technologies (SEST), Porto, Portugal, 9–11 September 2019; pp. 1–6. [Google Scholar]


© 2020 by the authors. Licensee MDPI, Basel, Switzerland. This article is an open access article distributed under the terms and conditions of the Creative Commons Attribution (CC BY) license (http://creativecommons.org/licenses/by/4.0/).