Eco-Energetical Life Cycle Assessment of Materials and Components of Photovoltaic Power Plant
by
 , , and
Izabela Piasecka
1 ,
,
Patrycja Bałdowska-Witos
1,* ,
,
Katarzyna Piotrowska
2 and
Andrzej Tomporowski
1,* 1
Faculty of Mechanical Engineering, University of Science and Technology in Bydgoszcz, 85-796 Bydgoszcz, Poland
2
Faculty of Mechanical Engineering, Lublin University of Technology, 20-618 Lublin, Poland
*
Authors to whom correspondence should be addressed.
Energies 2020, 13(6), 1385; https://doi.org/10.3390/en13061385
Submission received: 12 February 2020
/
Revised: 10 March 2020
/
Accepted: 12 March 2020
/
Published: 16 March 2020
(This article belongs to the Special Issue Life Cycle Assessment (LCA) of Environmental and Energy Systems)
Abstract
:During the conversion of solar radiation into electricity, photovoltaic installations do not emit harmful compounds into the environment. However, the stage of production and post-use management of their elements requires large amounts of energy and materials. Therefore, this publication was intended to conduct an eco-energy life cycle analysis of photovoltaic power plant materials and components based on the LCA method. The subject of the study was a 1 MW photovoltaic power plant, located in Poland. Eco-indicator 99, CED and IPCC were used as calculation procedures. Among the analyzed elements of the power plant, the highest level of negative impact on the environment was characterized by the life cycle of photovoltaic panels stored at the landfill after exploitation (the highest demand for energy, materials and CO2 emissions). Among the materials of the power plant distinguished by the highest harmful effect on health and the quality of the environment stands out: silver, nickel, copper, PA6, lead and cadmium. The use of recycling processes would reduce the negative impact on the environment in the context of the entire life cycle, for most materials and elements. Based on the results obtained, guidelines were proposed for the pro-environmental post-use management of materials and elements of photovoltaic power plants.
1. Introduction
Climate change has occurred many times in the history of the planet Earth. For the first time, however, the climate is changing faster than before. The natural greenhouse effect, necessary for life, has been intensified in modern times as a result of human activity, and the thermal balance has been significantly shaken. For the protection of the climate, the energy sector is of strategic importance as the largest consumer of energy raw materials and emitter of pollution. A sustainable energy policy should ensure that the social needs of current and future generations are best met by maintaining a balance between energy security, competitiveness of the economy and environmental protection, including the climate [1,2,3,4].
Modern civilization has become almost completely dependent on energy. Economic and social analyses indicate that the civilization changes taking place are deepening this relationship (Table 1). Energy in all forms will play an increasingly important role not only in the economic but also in the social sphere [5,6,7].
With the current state of technological development, energy is most often obtained by processing energy raw materials, such as coal, natural gas or oil, and to a lesser extent from renewable energy sources (e.g., solar radiation, water, wind, biomass). Energy resources are not evenly distributed everywhere. Some countries do not have them at all or the resources they have at their disposal do not fully meet their energy needs. For this reason, they are forced to obtain the necessary raw materials from regions where they occur in excess. The problem with energy resources is further complicated by the fact that, in the opinion of numerous experts, their resources are limited and are running out [8,9,10].
One of the reasons that leads to rapid environmental degradation is excessive consumption of energy obtained from conventional sources. Pollution caused by burning fossil fuels is associated with the production of a very large amount of harmful compounds, which include SO2, NOx, CO2, CO, as well as ashes and waste heat. The effects of air pollution by conventional fuel power plants include: human and animal diseases, destruction of vegetation, destruction of building structures (including historic buildings), metal corrosion and increased machine wear, etc. [11,12,13].
The need to increase the share of renewable energy in the energy balance of each country results from the obligation to reduce CO2 and other greenhouse gas emissions as a result of the growing greenhouse effect, the need to replace depleting fossil fuel resources with other energy sources, and the desirability of reducing dependence on energy suppliers from other countries [14,15].
Solar installations are becoming increasingly popular around the world. The advantage of photovoltaic cells is undoubtedly that their long-term, trouble-free operation allows for a significant reduction of harmful emissions. However, their production is very energy-intensive, which entails the emission of combustion products. Due to the presence of heavy metals in PV panels, their future recycling may also become a problem. The advantage of this branch of energy is the ubiquity of the sun’s rays, environmental friendliness and inexhaustibility. However, disadvantages include daily and annual cyclicity, radiation dispersion and significant costs of the equipment used [16,17,18,19].
In the global literature, many analyses can be found, mainly regarding the evaluation of solar panels with particular emphasis on the conditions of the production process. Kumar et al. (2018) indicated that the effect of shape of abrasive and silicon crystal is relevant to the yield and the life cycle of the solar cells over 20+year lifetime. In addition, the production process and the materials and raw materials used are very important for the quality of the solar farm. A detailed analysis of quality and durability was carried out by Kumar et al. (2017), proving that the impact of diamond wire wear impact on surface morphology, roughness and properties of silicon wafer subsurface. Despite numerous publications describing the stages of the production process, no studies have been found on the impact of selected system elements on the condition and development of the natural environment. Therefore, the following hypothesis is worth considering: which of the analyzed elements of the solar plant show the highest level of negative impact on the environment?
The pro-ecological attitude adopted by the authors is aimed at reducing gas emissions due to the operation of PV cells, which must correspond with environmentally friendly technology for producing photovoltaic cells. To this end, the authors made a detailed LCA (Life Cycle Assessment) analysis showing stages throughout the life cycle of the system that have a negative impact on the environment.
Increasing care for nature leads to the development and use of increasingly complex methods that give control of, and the ability to counteract, the human impact on the environment. Therefore, many new ways of assessing the impact of processes, products and industries on the environment have been created. One of them is the method of analysis and assessment in the context of the entire life cycle of products, i.e., their impact from the acquisition of raw materials to development. The Life Cycle Assessment (LCA) method covers the environmental impact of production, operation and post-use management and is in accordance with the principle of sustainable development [20,21,22].
Each source of energy, even classified as renewable, has a certain impact on the environment. Photovoltaics are widely regarded as a “green”, environmentally friendly energy source. During photovoltaic installation exploitation, solar radiation is converted into electricity. This process does not cause emissions of harmful substances into the environment, unlike analogous ones, when using conventional resources (e.g., emissions of CO2, SO2, NOx, dust, etc., as a result of burning coal). The fact that the production and post-use development of plastics and components of photovoltaic power plant is usually overlooked is the need for large material expenditures, for example related to the extraction of raw materials for the production of plant components or chemicals necessary for recycling processes. In addition, the accompanying processes (for example production of PV cells using the Czochralski method) are extremely energy-consuming. During the entire lifecycle of a photovoltaic installation, many compounds and chemicals are emitted that can have a negative impact on the environment, and large amounts of energy are required (especially at the production stage). In view of the above, main target of this study is an ecological and energetical life cycle assessment of materials and components of photovoltaic power plant.
2. Materials and Methods
2.1. Object and Plan of Analysis
The object of this study is a photovoltaic power plant with a capacity of 1 MW, situated in the northern Poland, which produces from 950 to 1100 MWh of electricity per year. As a reference for the purpose of further analyses, it was assumed that the system produced 1,000 MWh per year. The basic elements of the parsed photovoltaic power plant are: supporting structures, photovoltaic panels, cables and straight connectors for electrical installations, container station along with the static inverters (including DC switchgear, DC/AC inverters, AC/LV switchgear, LV/MV transformer, MV switchgear, control and surveillance system, the system of measurement of energy generated).
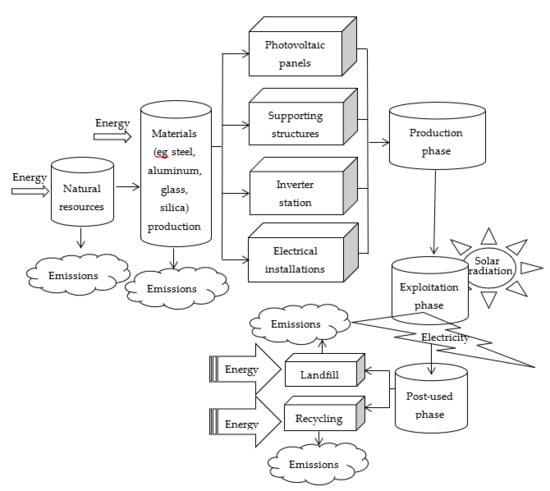
An LCA study (in accordance with ISO 14000) consists of four stages: determination of goal and scope, life cycle inventory (LCI), life cycle impact assessment (LCIA) and interpretation (Figure 1) [23,24,25].
In accordance with the mentioned ISO standards, the analysis plan consisted of four basic steps. In the first of them, the purpose of the study and its scope were determined, which are described in detail in Section 2.2. The basis for their formulation was the collection of the largest possible amount of data on the studied object. Key data for the analysis were provided by the owner of a 1 MW photovoltaic power plant located in Poland. In addition, detailed information on the production and operation of photovoltaic panels, inverter stations, cables and cabling accessories was obtained from their manufacturers. We also managed to obtain data from a post-use PV panel management company. Details on the second step of the analysis are provided in Section 2.3. The third step involved performing a comprehensive ecological and energetical analysis of the life cycle of the photovoltaic power station under study. SimaPro 8.4 software (PRé Sustainability, LE Amersfoort, Netherlands) was used for this purpose. The basic calculation procedure was the Eco-indicator 99 method, which allows the assessment of the impact of the photovoltaic power plant’s life cycle on the environment, including human health, ecosystem quality, and resources. To determine the energy demand and CO2 emissions at each stage of the life cycle, in addition the CED and the IPCC methods were used. The IPPC method was used for CO2 emission quantitative assessment to indicate which of the material stages of the life cycle involves the highest level of greenhouse gas emissions (CO2), the reduction of which is one of the key aims of the European Union countries. The CED method was used to identify the share of a photovoltaic power plant life stages in the energy demand from different sources. In this way, a comprehensive analysis of a photovoltaic power plant cycle, including important areas of sustainable development, that is, CO2 emission (IPCC method), energy consumption (CED method), human health, ecosystem quality and resources (Eco-indicator 99 method), was provided.
The characteristics of this stage of the analysis are described in Section 2.4 and the results are presented in Section 3.1, Section 3.2, Section 3.3, Section 3.4 and Section 3.5. The last, fourth step was the interpretation of the results of the analysis, which are presented in Section 2.5 and Section 4 (“Conclusions”).
2.2. Determination of Goal and Scope
This work analyzes several single products connected in a one system—a photovoltaic power station. The analysis, which was conducted as part of this publication, aimed at the numerical determination of the value of the environmental impact related to the life cycle of a 1 MW PV power station. The purpose of the analysis is, most of all, to describe the existing reality (retrospective LCA), but also to model future changes and determine recommendations aimed at developing more pro-environmental solutions (prospective LCA). The procedure will constitute a classic process LCA, the purpose of which will be to determine the extent of the negative environmental impact of the life cycle of the analyzed object [26,27,28]. For this purpose, selected elements of the solar installation were analyzed: photovoltaic panels, supporting structures, inverter station, electrical installations. The environmental assessment included 11 impact categories: Carcinogens, Resp. Organics, Resp. Inorganics, Climate change, Radiation, Ozone layer, Ecotoxicity, Acidification / eutrophication, Land use, Minerals, Fossil fuels. The research results are divided into four phases, described as: production, exploitation, landfill and recycling. Among the eleven categories available, categories with the highest level of significance were selected for which detailed emissions of compounds into the environment were presented.
Most of the processes performed under the analyzed stages of the life cycle of the photovoltaic power station (production, exploitation, post-use management) take place in Europe. Therefore, the study scope was referenced to the European conditions. The territory of Poland was taken as the geographical area, while the time horizon taken was 20 years (average operation time of photovoltaic systems). Electric energy production was assumed as a function of the photovoltaic power plant. A functional unit was defined as a production of 1000 MWh of electric power by the relevant system in a year. The analysis did not cover the stages of transport, sales, technical tests, and storage. The main reason for this was the lack of appropriate data and large differences in the effects of transport depending on the power plant location.
2.3. Life Cycle Inventory (LCI)
To collect data, special sheets were prepared. Each sheet was assigned to a specific unit process, with a division into process inputs, process performance, and process outputs (Figure 2). Process inputs included main materials, auxiliary materials, and water; process performance involved duration and media consumption; process outputs included main product, waste, and emissions. Data concerning processes and materials less significant from the point of view of environmental impact were obtained from databases included in the SimaPro 8.4 software(PRé Sustainability, LE Amersfoort, Netherlands). Due to confidentiality agreements with companies manufacturing photovoltaic power station elements, any detailed information regarding the design of the analyzed objects and process data are not subject to disclosure in this publication [29,30].
After the data were assigned to the unit processes, they were validated through bilateral energy and mass balance. Models were constructed systematically and filled with data. The input value was equilibrated by the output value. This operation made data aggregation and quantification per functional unit and reference flows possible. By totaling environmental interventions of the same type (inputs of material, energy, waste, emissions, etc.) for all the unit processes, input–output matrices were obtained that were referenced to the reference flows. The next step was to adapt them to a format compatible with the SimaPro 8.4 software. This allowed us to enter data into a calculator and proceed with another stage of the analysis. Information supplied by the manufacturer allowed a precise determination of the values of the materials and energy used in the photovoltaic power station life cycle [31,32,33].
The relevant power station was equipped with photovoltaic panel support structures made of galvanized steel (mainly due to economic benefits and numerous technical advantages). The support structure in a dual system was placed directly in the ground. Properly selected photovoltaic panels constitute a key element of the entire photovoltaic plant. The construction of the relevant power plant needed a system of 4170 polycrystalline photovoltaic modules with a capacity of 240 W demonstrating a performance up to 17.7%. The manufacturer’s declared performance amounts to 91.2% of rated capacity for the first 10 years and 80.7% for a period of another 15 years. Each single module is composed of 60 photovoltaic cells. The panels are made of glass, aluminum, silica, EVA (ethylene-vinyl acetate copolymer), PVB (polyvinyl butyral), cadmium, lead, copper, nickel, selenium, and silver. The modules are connected in series and are inclined at an angle of 35° in the southern direction (this is due to the fact that the angle of the PV panels tilt relative to the horizon depends on the latitude (φ). The location of the analyzed object is 54°N. The angle of the sun above the horizon is H = 90 °-φ; therefore, for the location considered it will be 36°. The highest efficiency is obtained with a perpendicular angle of incidence of sunlight on the panel surface. In Poland, for year-round operation, the optimal angle for placing PV panels is about 30-40° and pointing southwards). To function properly, each photovoltaic system should be equipped with proper wires and cabling accessories. The relevant plant, located on the ground, employed wires with pre-terminated ends (galvanized copper conductor, internal insulation and external sheath made of cross-linked polyolefin), control cables and wires, different types of connectors and splitters (galvanized copper contacts), cable glands (body: PVDF—polyvinylidene fluoride and polyamide PA6; seal: silicone or neoprene) and protection hoses (modified polyamide PA12). In the relevant solution of photovoltaic power station, a central inverter substation was used. Megawatt substation constitutes a comprehensive solution dedicated for solar power plants with a high installed capacity. It contains the electrical equipment necessary to connect photovoltaic power stations to a medium voltage electric power network. The station accommodates two central inverters, optimized transformer, MV switchgear, DC connections for PV modules, and a monitoring system. Made of steel, the insulated container is placed on a concrete base. The entire megawatt substation weighs nearly 20 tons, while the volume of the container amounts to almost 50 m3 (manufacturer’s data).
2.4. Life Cycle Impact Assessment (LCIA)
Life cycle impact assessment was performed with the use of the SimaPro 8.4 calculation software. Cut-off level amounted to 0.1%. LCIA results are presented in Section 3 of this article.
2.4.1. Eco-indicator 99 method
Eco-indicator 99 method was chosen as the base calculation procedure. Eco-indicator 99 belongs to a group methods for modeling the environmental impact of environmental endpoint mechanism. The process of characterization is done for the eleven categories of impact, coming within three larger groups referred to as impact areas or categories of damages. There are the following areas of impact: human health, ecosystem quality, and resources. The results of the impact area indicators are further analyzed through normalization, grouping and weighting into the final Ecolabel. Eco-indicator 99 method offers 11 impact categories with a wide spectrum of analysis areas (Figure 3). The first damage category (carcinogens, resp. organics, resp. inorganics, climate change, radiation, ozone layer) is expressed in DALY (Disability Adjusted Life Years)—the number of years spent in the disease or lost. Assessment of the impact on the environment was performed with the use of a scale from 0 to 1, where 0 stands for a lack of impact on the human health and 1 stands for death. The damage to ecosystem quality is expressed in terms of the percentage of species that have disappeared in a certain area due to the environmental load. Ecotoxicity covers the percentage of all species present in the environment living under toxic stress (PAF—Potentially Affected Fraction). Regarding acidification/eutrophication and land use, the damage to a specific target species (vascular plants) in natural areas is modeled (PDF—Potentially Disappeared Fraction). The damage category covering resource extraction gives a value expressed in MJ surplus energy to indicate the quality of the remaining mineral and fossil resources. The final goal of the grouping and weighting analysis was to obtain environmental factors expressed in environmental points (Pt), constituting aggregated units enabling comparisons of eco-balance sheets. A thousand environmental points are equal to the impact on one’s environment, the average European within a year. The value of 1 Pt (eco-point) is representative for one thousandth of the yearly environmental load of one average European inhabitant. It is calculated by dividing the total environmental load in Europe by the number of inhabitants and multiplying it with 1000. Due to the lack of express premises for exclusions, all the impact categories functioning within the Eco-indicator 99 (Eco-indicator 99 (H) V2.06/Europe EI 99 H/A) were subject to analysis [34,35,36,37].
Due to the fact that the purpose of the research was to carry out ecological and energy life cycle analysis of photovoltaic power plant materials and components, in addition to the Eco-indicator 99 method, it was decided to additionally use two other methods—CED and IPCC. As part of Eco-indicator 99, two impact categories (“minerals” and “fossil fuels”) refer to energy analyzes (value expressed in MJ surplus energy), but due to the need for expand the scope of their research with an additional assessment of cumulative energy demand in each phase lifecycle. Therefore, the CED method was used, as described in Section 2.4.3. Nowadays, great attention is also paid to the issue of excessive CO2 emissions, which is why it was decided to use another method, IPCC, which makes it possible to assess the impact of greenhouse gases on the increase of the greenhouse effect and obtain results for each stage of the life cycle expressed in kg CO2 eq. As a result of this procedure, the results obtained under the category “climate change” in the Eco-indicator 99 method are more detailed. A more detailed description of the IPCC method is provided in Section 2.4.2.
2.4.2. IPCC Method
The IPCC (Intergovernmental Panel on Climate Change, Global Warming Potential) method has made it possible to perform a quantitative assessment of the impact of particular greenhouse gasses (GHG) for the greenhouse effect, with respect to CO2. The carbon dioxide indicator in order to assess the impact on the greenhouse effect is equal to 1 (GHG = 1). This research was conducted in accordance with the IPCC standard: IPCC 2007 GWP 100a V1.01 (Intergovernmental Panel on Climate Change, Global Warming Potential, time horizon: 100 years) [38,39,40,41].
2.4.3. CED Method
The CED (Cumulative Energy Demand) method allows the determination of the cumulative energy demand. The impact indicators are divided into seven impact categories: two non-renewable (nuclear power, fossil fuels) and five renewable (biomass, water, solar, wind and geothermal energy). The research was conducted in accordance with the CED standard: Cumulative Energy Demand V1.05 [42,43,44].
2.5. Interpretation
During the analysis, its completeness was checked against the positive result. All the important information and data necessary for interpretation were complete and obtainable directly from the manufacturer, the recycling company, and from the databases of the SimaPro software (PRé Sustainability, LE Amersfoort, Netherlands). Conformity was checked during the analysis. Assumptions, methods, analysis depth, specificity and precision of data for both systems are compliant with the previously assumed goal and scope of analysis. Detailed interpretation of the results obtained is presented in Section 3 and Section 4.
3. Results and Discussion
3.1. Eco-Indicator 99
Table 2 presents the results of characterizing the environmental consequences occurring in the life cycle of selected components of the 1 megawatt photovoltaic power plant. Impacts are presented in the 11 categories of impact characteristic of the Eco-indicator 99 method. Two impact models were distinguished: the first one was the life cycle, including landfill disposal as a form of post-disposal management, while the second one was recycling. For all adverse effects in the area of human health, all tested groups showed the highest negative impact on the category of inorganic compounds causing respiratory diseases (e.g., life cycle of photovoltaic panels with landfill: 0.22 DALY; inverter life cycle with storage: 0.14 DALY). The largest quantity is formed at the stage of production of materials and elements, and the maximum share is characterized by sulfur dioxide and nitrogen oxides. These compounds are poisonous to humans and animals and have a harmful effect on plants. Sulfur dioxide is a by-product of burning fossil fuels, which, for example, contributes to atmospheric pollution (smog). In turn, nitrogen oxide is a compound with high biological activity and easily penetrates biological membranes. It is also created, among other things, as a result of burning fossil fuels and industrial processes that can cause smog. For categories affecting environmental deterioration, the ecotoxic compounds category was the most important, for which the maximum level of harmful impact was recorded for photovoltaic panels deposited in landfill: 137,741 PAF·m2/a. Ecotoxic compounds are substances which, due to their origin, chemical, biological or other properties, constitute or may pose a direct or delayed threat to humans, animals and plants. In the life cycle of a photovoltaic power plant, the largest amount arises from the storage of materials and components at the landfill. A particular threat is copper ion emissions, which in addition to reducing the quality of the environment, can contribute to the formation of diseases of the nervous and digestive systems in humans (for example: mental disorders or liver damage). In the area of processes affecting the depletion of raw material resources, the highest level of harmful impact was recorded in the raw materials category for the life cycle of electrical installations with post-consumer use in the form of landfill (322,646 MJ), and in the fossil fuels category for the life cycle of photovoltaic panels placed in landfill after use (400,584 MJ). The largest amount of fossil fuels is consumed during the plastics and materials plant production phase. The most processes with the highest energy demand include, for e.g., the production of PV cells. Burning of conventional fuels is associated with many hazardous emissions to the atmosphere, water and soil, which are the causes of, for examplem, diseases, increasing the greenhouse effect, ozone layer depletion or increased smog and acid rain. In most of the categories considered, there is a positive impact of the use of recycling processes, to reduce the harmful impact of particular groups of components of the analyzed photovoltaic power plant.
The results of grouping and weighting the environmental after-effects of the existence of selected groups of 1 MW photovoltaic power plants are summarized in Table 3. For the life cycle of photovoltaic panels deposited in landfill, the highest level of harmful impact was recorded in terms of: fossil fuel extraction (9534 Pt), inorganic compounds causing respiratory diseases (5729 Pt), mining of minerals (1621 Pt) and carcinogenic compounds (1822 Pt). Silicon cell production processes are associated with a huge demand for energy, which in the case of the analyzed power station is about 5 million MJ. This energy is most often obtained from non-renewable sources, which causes many negative impacts in relation to human and animal health, and a reduction in the quality of the environment. Another problem is the excessive exploitation of raw material deposits, including silver, used in the electrical contacts of the cells, whose extraction causes the most negative consequences in comparison to other substances and chemical compounds used in the production of PV cells. For the life cycle of supporting structures, including post-use disposal, the categories were: ecotoxic compounds (832 Pt), carcinogenic compounds (827 Pt), and fossil fuel extraction (606 Pt). Supporting structures were made mainly of galvanized steel. The galvanizing process of steel poses a threat to health and the environment. In thermal processes, smoke and zinc vapors (especially particles smaller than 1 µm) can, for example, get into the respiratory system, causing many diseases. In the life cycle of the inverter station including landfill disposal, the highest levels of negative impact were reported in terms of: inorganic compounds causing respiratory disease (3725 Pt), and fossil fuel extraction (1887 Pt). In the cycle of existence of an electrical installation, which after ending its life cycle will be deposited in landfill, the most negative influence on the environment was attributed to mineral extraction (7679 Pt) and inorganic compounds causing respiratory diseases (1327 Pt). An important element found in both inverter station and electrical installation are electrical cables and wires. The main raw material for their production is copper, the extraction and processing of which is associated with very high energy inputs, obtained from conventional sources. As a consequence, many harmful compounds are emitted into the environment, and the resources of raw materials and fuels are depleted. The application of recycling would reduce the harmful impact on the environment of all analyzed groups of photovoltaic elements.
The highest total level of harmful impact on the environment is the life cycle of photovoltaic panels ending in landfill storage (22,029 Pt), but in this case, the use of recycling processes significantly reduces their negative impact on the environment. The key reason for this is the abovementioned very high energy demand in the production of PV cells. Reuse of cells recovered in the recycling process is associated with large savings in both energy and materials (e.g., elimination of significant material losses arising during cutting silicon rollers). The lowest total damaging effect was found in the supporting structures (1089 and 3197 Pt) (Figure 4).
The highest level of harmful impact on the environment of 1 MW photovoltaic power plant was observed at the manufacturing stage. The largest category of harmful effects was characterized by the categories of fossil fuel extraction and minerals, while the smallest – compounds causing the increase of the ozone hole. The largest share in the negative impact on the environment was characterized by the production processes of PV panels, which are part of the photovoltaic power plant with the highest demand for energy and materials. The lowest level of negative impact was the exploitation stage (32 Pt total). By comparing the received forms of post-use management, the most negative influence on the environment is the landfill. Carcinogenic compounds and ecotoxic compounds can be classified as the most potent adverse effects. The use of recycling processes would reduce the impact of the life cycle in most of the impact categories analyzed. The fossil fuel mining processes and emissions of inorganic compounds affecting respiratory diseases would be most positively affected (Figure 5).
Post-use disposal of photovoltaic power plant components could be the most important source of oncogenic factors contributing to the development of cancer by mutation of genetic material. The highest level of harmful emissions was recorded for cadmium ions (2547 Pt). Cadmium is an element that easily concentrates in air, water and soil and quickly moves in the soil–plant–human trophic chain. Due to easy absorption and bioaccumulation in living organisms and toxic influence, it is one of the most serious threats to the natural environment and man. For this reason, it is important to minimize the storage of materials and components of solar power plants in landfills. The production phase also has a significant impact on the carcinogenic emissions—538 Pt total—and the highest share of arsenic: 363 Pt. The use of recycling would reduce the harmful impact of carcinogens by a total of 824 Pt, mainly in the range of arsenic (-514 Pt) (Table 4).
The production stage is distinguished by the highest level of negative impact in organic compounds causing respiratory diseases, altogether 11 Pt, especially in the emissions of non-methane volatile organic compounds (10 Pt). NMVOC is a group of organic compounds that occur as by-products in many industrial processes and are a source of environmental pollution, including, for example: acetone (paints, protective covers, sealants), aliphatic hydrocarbons (paints, glues, sealants, combustion processes), aromatic hydrocarbons (paints, glues, combustion processes), polycyclic aromatic hydrocarbons (paints, polymeric materials, incomplete combustion processes, e.g., car exhaust gas) or chlorine-containing compounds (varnishes, solvents). During storage of the power plant components in landfill, biogenic methane may be the greatest risk: 1 Pt. Recycling processes would reduce the damaging impact of the total lifetime by 17 Pt, including non-methane volatile organic compounds by 16 Pt (Table 5).
The highest level of harmful impact on the environment of respiratory organisms caused by respiratory diseases occurring during the 1 MW photovoltaic power plant cycle was recorded for the production stage–10,837 Pt in total. The highest share was in sulfur dioxide (3194 Pt) and nitrogen oxide (3091 Pt). Recycling would allow a total reduction of harmful effects of 7423 Pt, mainly in the sulfur oxide (-3274 Pt) and particulates in total (-2521 Pt). A key negative health role is played by atmospheric aerosols or particulate matter (PM). They are drops or solid particles of natural or anthropogenic origin (impurities). PM 2.5 (particle size 2.5 µm or smaller) is the most harmful because prolonged exposure to it results in a reduction in life expectancy, while short-term exposure to high concentrations causes an increase in deaths from respiratory and circulatory diseases and increases the risk of emergencies that require hospitalization (for example: worsening of asthma, decreased lung function), because dust enters the blood directly through the lungs. Atmospheric aerosols also contribute to smog (Table 6).
The highest level of emissions of substances causing climate change is the production of materials, and components, which results in a total of 2049 Pt, mainly composed of carbon dioxide (891 Pt). Over the past two centuries there has been a marked acceleration of climate change. The basic factor shaping the speed of these changes is the emission of carbon dioxide and other greenhouse gases, which arise, for example: during the exploitation of fossil fuels, used in the life cycle of a photovoltaic power plant most often for obtaining electricity for various processes, including the energy most intensive—PV cell production. Landfill disposal can result in total negative emissions of 292 Pt, primarily biogenic methane (201 Pt). Recycling, as a form of post-use management, would allow the reduction of dangerous emissions by a total of 2685 Pt, mainly in carbon dioxide (-1947 Pt) (Table 7).
Radioactive compounds are characterized by possessing nuclear nuclei with radioactive decay, most commonly associated with alpha particle emission, beta particles, and gamma radiation. The highest number of such elements in the 1 MW photovoltaic power plant cycle was noted for the production phase (total 28 Pt). It is associated with the processes of extracting mineral resources and fossil fuels, during which there are not only emissions of dust and gases containing many harmful substances (e.g., sulfur and nitrogen oxides, chlorine, fluorine, heavy metals), but also radioactive elements such as uranium, thorium, and potassium, and their breakdown products, for example: radium and radon. In this case, these are mainly radon isotopes—222Ra (21 Pt)—and carbon—14C (7 Pt) (Table 8).
The ozone hole is a phenomenon of a decrease in the concentration of ozone (O3) in the stratosphere, resulting in a decrease in the level of absorption of ultraviolet radiation reaching the Earth from the Sun. It is, therefore, a threat to living organisms. During the processes of producing materials, and components of the plant under investigation, harmful substances causing the ozone hole to increase in total 2 Pt are formed, mainly bromotrifluoromethane (1,5 Pt). Halon 1301 may have a toxic effect on the central nervous system and other bodily functions (Table 9).
Comparing all phases of the life cycle, particularly high levels of harmful impact of waste disposal in the form of waste landfills are visible in the category of ecotoxic compounds (a total of 1503 Pt). The most significant level of negative emissions was copper ions (1200 Pt). The high level of emissions of ecotoxic substances is also characterized by the production phase (total 837 Pt), which consists mainly of the harmful effects of nickel (280 Pt) and zinc (263 Pt). Recycling could significantly reduce emissions by a total of -397 Pt, primarily in terms of minimizing the negative impact of nickel (-212 Pt). Nickel is used in the manufacture of many materials and components of a photovoltaic power plant, ranging from steel elements to resistors. The main source of nickel in the environment is the combustion of conventional fuels (especially coal and oil), as well as steel production and electroplating processes. The absorption of nickel into the body is primarily through the respiratory system. Nickel tends to accumulate in the lungs. With wind and rain, it gets into soil and groundwater. It is also one of the components of smog (Table 10).
Acidification of the environment is a phenomenon of progressive decrease in the pH value of its individual components. It can be caused by anthropopressure, for example: by emissions of air pollutants (e.g., SO2, NOx, NH3) as a result of combustion of conventional fuels. Eutrophication, on the other hand, consists of enriching the environment with biophilic elements, mainly phosphorus, which causes an excessive increase in their trophic (biological productivity). Materials and elements of a 1 megawatt photovoltaic power plant can be distinguished primarily by nitrogen oxide (596 Pt) and sulfur dioxide (182 Pt). The total negative impact of the production stage is 975 Pt. Recycling processes would minimize harmful emissions by a total of 502 Pt, including 314 Pt for nitrogen oxide and 187 for sulfur oxide (Table 11).
The highest level of negative impact of land use category was characterized by the production stage (total of 1551 Pt), including primarily the processes related to the transformation to mineral extraction site (338 Pt). A significantly lower level of adverse impact is the potential for landfill disposal—a total of 35 Pt. Extraction of mineral resources is an area of economic activity with one of the highest harmful impacts on human health and the quality of the environment. It is associated with environmental destruction, especially serious in the case of open pit mines. It is characterized by the consumption of huge amounts of water, often causing shortages, and at the same time results in the contamination of surface and groundwater, as well as a reduction in their level by up to several meters (Table 12).
Economic development entails an increase in demand for various types of natural resources, resulting in the depletion of non-renewable resources. Although their deposits are limited, their exploitation continues to grow. The stage of production of 1 megawatt photovoltaic power plant, characterized by the highest value of harmful influence in the mineral mining sector, is the production phase (total 9453 Pt), mainly in the field of tin mining (6610 Pt) and copper (2230 Pt). Due to its physical and chemical properties, tin is very important for industry. Its use in the metallurgical industry is the largest. In addition, this element is used for solders alloys. Tin is also used to coat other metals, e.g., steel, with a thin anti-corrosive layer. Recycling would minimize the pervasive effects analyzed, a total of 1889 Pt, mainly in the field of bauxite mining (-1835 Pt) (Table 13).
The highest level of harmful impacts in the category of fossil fuel extraction processes is characterized by a production phase (total of 12,159 Pt), which consists primarily of processes related to extraction of natural gas (5509 Pt) and crude oil (2366 Pt). This is connected to the high energy demand of production processes, in particular PV cells. Recycling as a form of post-disposal management would reduce several adverse effects by a total of 10,095 Pt, mainly in the oil-related processes (-7794 Pt). However, landfill disposal would result in an increase in the unfavorable impact on the life cycle of the tested power plant by 137 Pt (Table 14).
3.2. IPCC
The analyzed groups of photovoltaic power plant components were also subjected to an IPCC analysis to determine greenhouse gas emissions in kilograms CO2 equivalents. The results are shown in Figure 6. It follows from that that the largest amount of greenhouse gases is generated in the life cycle of photovoltaic panels that end in landfill storage (269,099 kg CO2 eq). However, if they are recycled, there is the possibility of significantly reducing the volume of the emissions in question. The lowest greenhouse gas emissions were recorded for post-consumption in recycling cycles (support structures: 3880 Pt, inverter 10,017 Pt, electrical installation: 16,091 Pt). The sources of CO2 emissions throughout the life cycle include, above all, the burning of fossil fuels to obtain electricity. Its highest demand was observed during the production of photovoltaic cells.
3.3. CED
The last factor considered was the energy consumption of the life cycle of individual groups of photovoltaic power plants, which was estimated using the CED method. Sustainable development of technical facilities, in addition to having the lowest demand for materials and the least harmful environmental impact of the life cycle, also includes the maximum reduction of energy consumption within its individual stages (which also translates into improving the quality of the environment, especially considering the fact that the main source of energy are conventional fuels). The largest amount of energy is needed to produce photovoltaic panels (e.g., to produce silicon with proper purity), a life cycle that covers the production, operation and management of panels in the form of landfill, consumes nearly 5 million MJ. Similarly, the case of an inverter station represents over 800 thousand MJ, and for supporting structures, a further more than 1 million MJ, and with regard to the electrical installation, almost 250 thousand MJ. The use of recycling processes reduces the energy consumption of all groups of components of the power plant in question. Reuse of photovoltaic cells recovered in recycling processes would minimize energy and material consumption (Figure 7).
3.4. Recapitulation
Figure 8 shows the results of grouping and weighting the environmental consequences of 1000 kg of selected plastics and materials that are part of the photovoltaic farm components. The highest level of harmful influence on the environment is distinguished by silver (20,512 Pt/1 Mg), nickel (3842 Pt/1 Mg), copper (2363 Pt/1 Mg), PA 6 (656 Pt/1 Mg), lead (638 Pt/1 Mg) and cadmium (586 Pt/1 Mg). The most widely used in photovoltaic panels are: silver, nickel, lead, cadmium, EVA, selenium, silicon, and aluminum; in supporting structures: nickel and steel; in inverter stations: copper, PA6, PVDF, rubber, and steel; and in electrical installations: copper, PA6, PVDF, and rubber.
3.5. Other Energy Sources
Using the databases available in the SimaPro software and calculations made previously for a 1 MW photovoltaic power plant, a comparison was made of the environmental impact of the processes of obtaining electricity from photovoltaics with selected, commonly used conventional energy sources and with the structure of the mixed energy characteristic of Poland, mainly based on hard and brown coal (approximately 80%).
The analyzed photovoltaic power station, during its 20-year life cycle, is able to produce about 20,000 MWh of electricity, which value was taken as a reference value. The degree of impact on the surroundings resulting from the combustion of an amount of hard coal, brown coal, and heating oil necessary to obtain the same amount of electricity was analyzed. In addition, an analogous analysis was carried out when 20,000 MWh of energy was obtained in Poland.
Table 15 summarizes the results of the characterization of the environmental after-effects arising from the generation of 20,000 MWh of electricity from the selected energy sources. The highest level of harmful impact of the analyzed energy sources is visible in the area of emissions of compounds having a negative impact on the quality of the environment (category: ecotoxic compounds, compounds causing acidification/eutrophication, land use) and in processes related to the depletion of raw material resources (categories: mineral extraction, extraction of fossil fuels). This is characteristic of energy extraction processes, especially from conventional sources.
The results of grouping and weighting environmental consequences arising as a result of generating 20,000 MWh of electricity from selected energy sources are presented in Table 16. The highest value of harmful impact on the environment was noted in the following categories: inorganic compounds causing respiratory diseases (from 3437 to 357,703 Pt), compounds that cause climate change (from 2351 to 163,556 Pt), and the extraction of fossil fuels (from 2198 to 246,591 Pt).
The highest total level of harmful impact on the environment was from the production of 20,000 MWh of electricity was determined to be from hard coal (709,17 Pt) and brown coal (633,445 Pt). A high degree of negative impact on the environment was also noted for the Polish energy mix (683,220 Pt), due to the fact that it is mainly based on the burning of brown and hard coal. Obtaining energy from solar radiation possessed the lowest level of adverse impact on the environment, with this type of installation exerting an impact from 13,997 (recycling) to 42,492 Pt (storage) throughout its entire life cycle, depending on the form of post-use management. Despite some expenditure of energy and materials in the production and post-use management phase, the use of a renewable energy source, i.e., photovoltaics, causes the least negative environmental consequences compared to conventional energy sources (Figure 9).
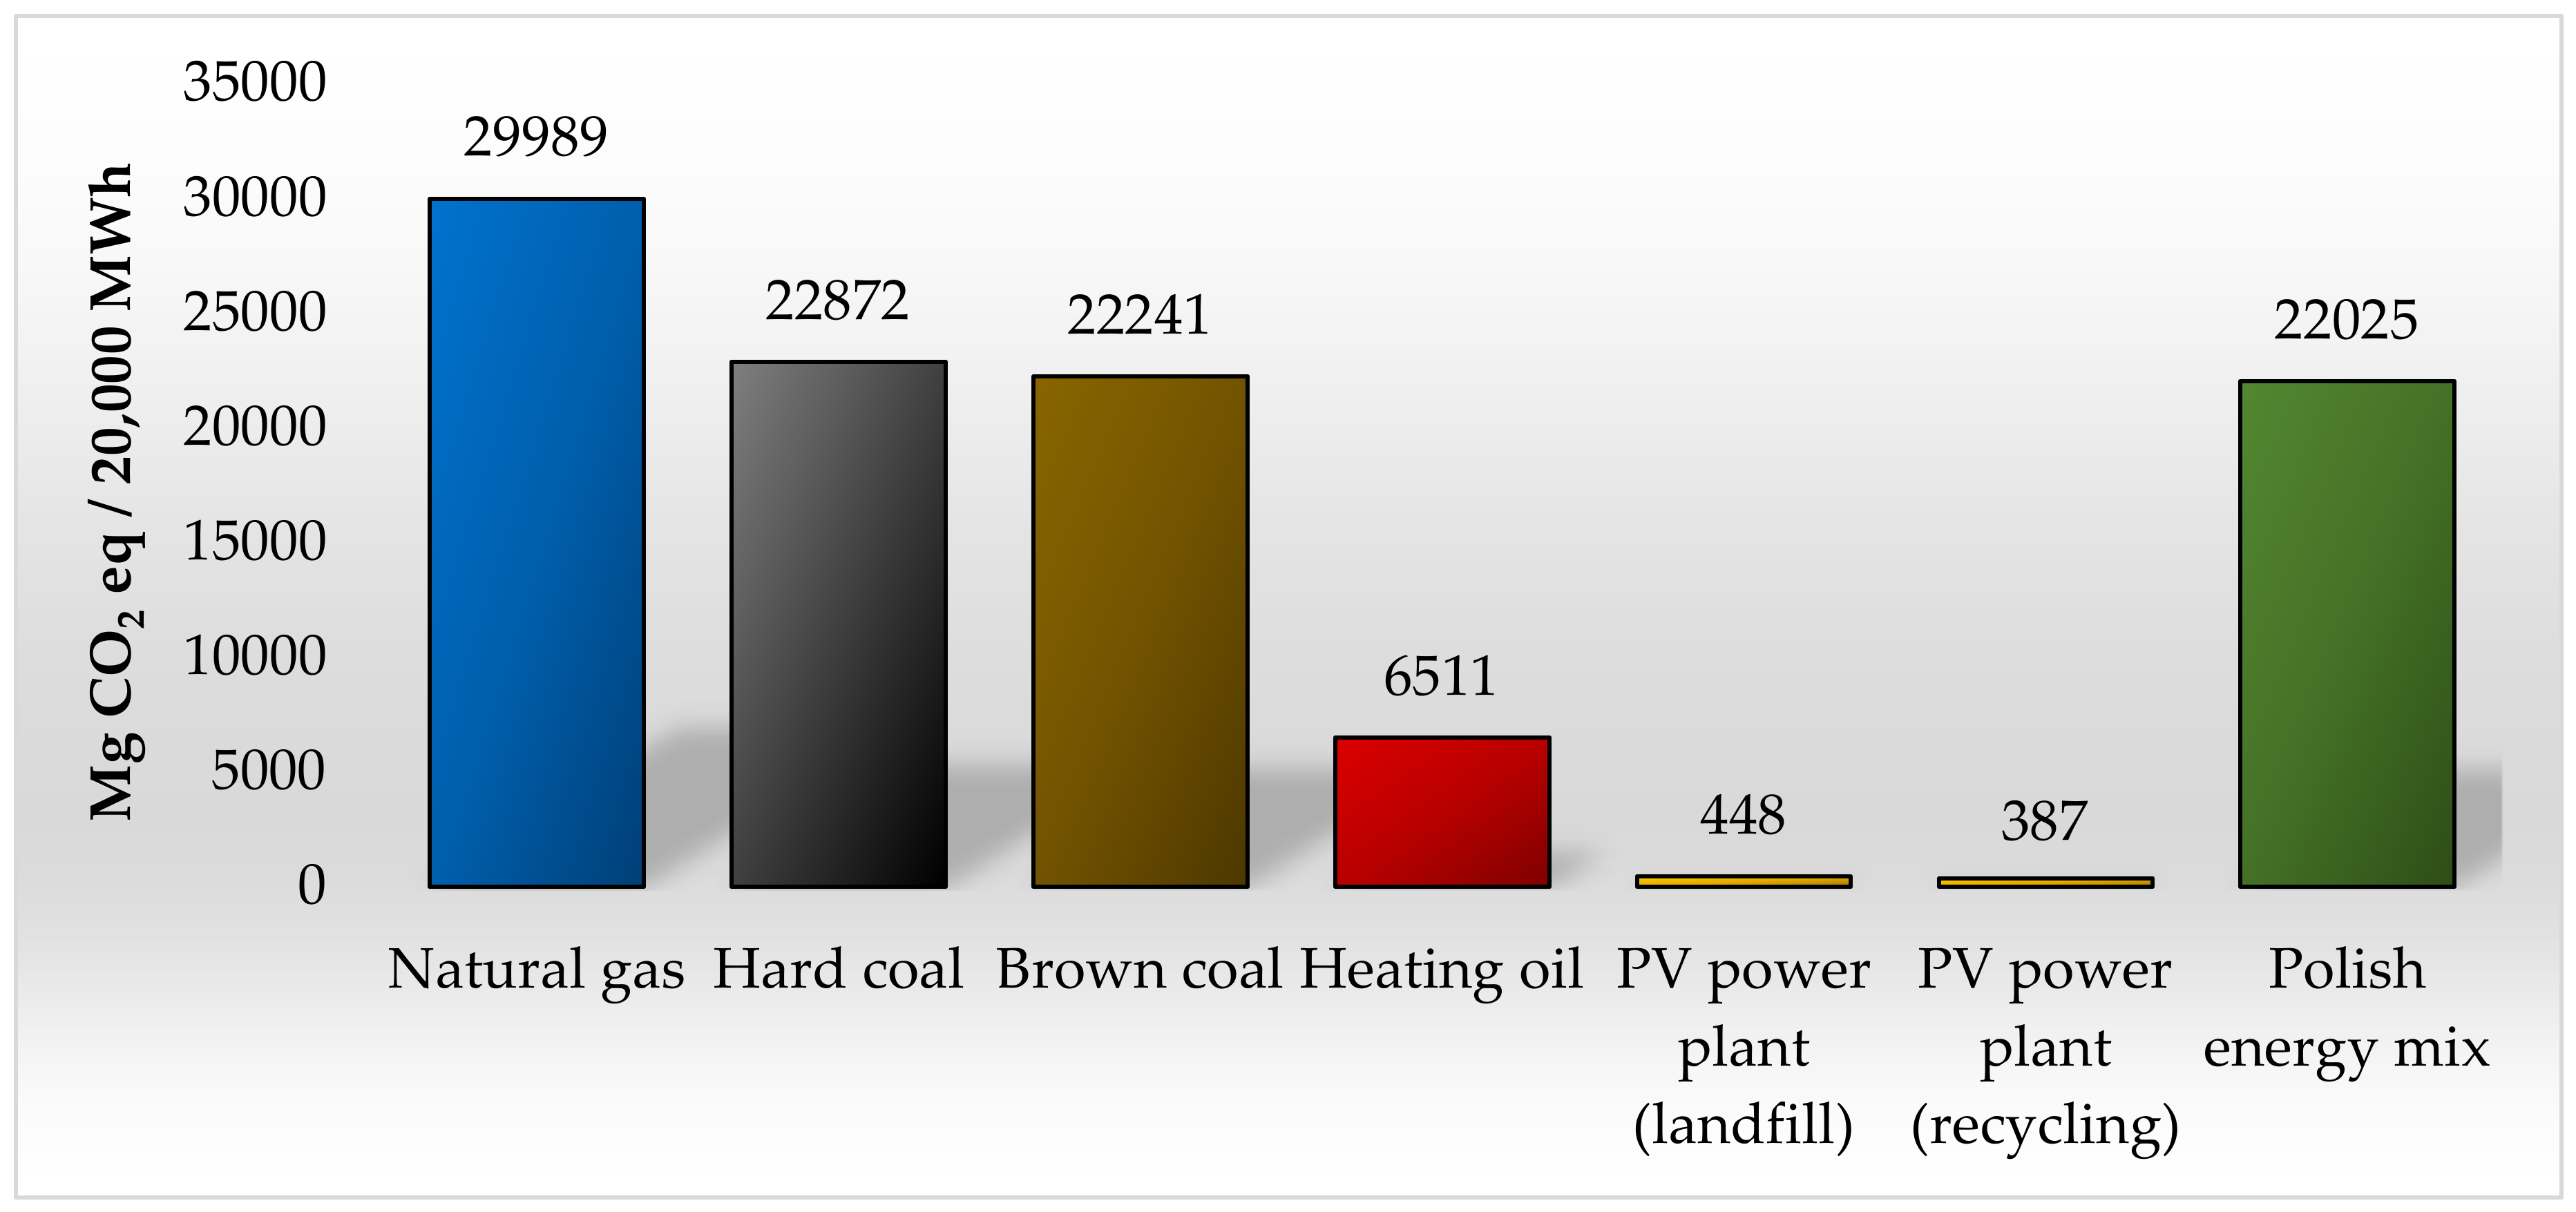
Additionally, the amount of greenhouse gas emissions resulting from the production of 20,000 MWh of electricity was analyzed from the same energy sources using the IPCC method. The highest level of GHG emissions was found when obtaining energy from natural gas (29,989 Mg CO2 eq), hard coal (22,872 Mg CO2 eq), and brown coal (22,241 Mg CO2 eq). In the case of photovoltaic power plants, the emission level was the lowest and amounted to about 400 Mg CO2 eq. The obtained results confirm that photovoltaic power plants can be a source of energy enabling the reduction of greenhouse gas emissions, and hence are one of the ways of reducing the greenhouse effect (Figure 10).
As a result of these considerations it was found that the total highest level of harmful impact on the environment is the life cycle of post-consumer photovoltaic panels when stored in landfill (22,029 Pt). The largest amount of greenhouse gases generated during the post-consumer life cycle of photovoltaic panels is from storage in landfill (269,099 kg CO2 eq). The greatest amount of energy absorbed during the life cycle of photovoltaic panels is from the use of this form of storage—nearly 5 million MJ. The use of recycling processes reduces the energy consumption of all groups of components of the power plant in question. Silver, nickel, copper, PA 6, lead, and cadmium are among the materials with the most harmful influence on the environment.
An additional element of the analysis was the comparison of the environmental impact of the processes of obtaining electricity from photovoltaics with selected, most commonly used conventional energy sources and with the structure of the mixed energy characteristic of Poland, which is mainly based on hard and brown coal (approximately 80%). The highest level of harmful impact of the analyzed energy sources is visible in the area of compound emissions: ecotoxic (2,671,933 PAF·m2/a brown coal), compounds causing acidification/eutrophication (335,746 PAF·m2/a hard coal), land use (192,997 PAF·m2/a hard coal) and within processes related to the depletion of raw material resources includes: mineral extraction (398,914 MJ PV power plant (landfill)), and extraction of fossil fuels (10,360,976 MJ heating oil).
4. Conclusions
Renewable energy sources, including solar energy, possess many positive environmental aspects in terms of local, regional and national and, most importantly, global aspects. The beneficial effect of the use of alternative energy sources can be considered in three areas: continuous sustainable development, the environment protection and natural resources, and the timeless and endless nature of the raw materials used [45,46].
Energy security is understood as providing the security of energy supplied to recipients in a particular time and place, and it is one of the priority actions in economic policy. Scattered generation ensures even distribution of heat sources and energy (derived from a wide variety of energy sources, including renewable sources of energy) and have been the subject of considerable interest. They are considered to be important not only for increasing energy security, but also for the reduction of greenhouse gas emissions, particularly carbon dioxide, from burning fossil fuels. Each energy type impacts the quality of the environment, but not all to an identical extent [47,48,49]. That is why processes related to solar cell production have become so important in environmental assessment, determined by assessing the surface properties, including roughness, thickness and machining [50,51].
In the opinion of society, the use of only conventional energy sources (for example coal or oil), is a threat to human health and the quality of the environment. However, the depletion of non-renewable resources concerns not only traditional ways of obtaining energy, but also alternative ones. As a consequence, we are constantly striving to minimize negative environmental impacts, e.g., by reducing CO2 emissions [52]. Bearing in mind the future prospects of sustainable development, directions for the environmental assessment of wind farms, small hydropower plants and solar farms have become attractive. This approach makes it possible to strive to meet the growing demand for electricity without burning fossil fuels [53,54]. Thus, this work proved that at the production stage of the elements for a photovoltaic power plant, there is also a demand for raw materials and energy. The same applies to processes related to post-use management. Assuming that the analyzed power station produces annual energy equal to about 1000 MWh, it must work for up to about 2 years to produce an amount of energy equal to the demand for it throughout its entire life cycle (total energy demand for the life cycle with post-use management in the form of storage on the dump is about 2024 MWh—Figure 7). For this reason, it was considered justified to conduct research aimed at ecological and energetical assessment of the life cycle of materials and components of a photovoltaic power plant, and the hypothesis adopted in the work was confirmed.
Based on the results of the research performed and an evaluation of the material stages of the life cycle of the analyzed PV power plant, in terms of pro-environmental, post-production use of materials, materials and elements of photovoltaic power plants, the following suggestions are proposed:
- -
- ameliorating the detrimental effect on the environment of production process (mainly PV panels), which is the most deleterious phase of all phases in environmental life cycle, by introducing the latest technologies, which are less energy absorbent, with lesser usage of materials and lower emissions of harmful particles and substances,
- -
- creating the most pro-environmental algorithm for dealing with plastic materials and elements of photovoltaic power plants after their completion, taking into account, in particular, recycling processes, reducing the energy consumption, material consumption and emissions of harmful substances throughout the life cycle of the power plant,
- -
- employing more environmentally friendly construction materials while at the same time maintaining proper technical, mechanical and qualitative characteristics for specific roles in photovoltaic power plants, in particular limiting the use of materials with the highest levels of negative environmental impact such as silver, nickel, copper, PA 6, lead and cadmium,
- -
- employing construction strategies that allow for easier separation of individual materials, making them easy to identify during post-consumer use,
- -
- development of comprehensive, pro-environmental standards with respect to post-consumption management of materials and elements of photovoltaic power plants,
- -
- popularizing the idea of research and assessment of the impact of renewable energy throughout their life cycle.
Author Contributions
Conceptualization, I.P. and P.B.-W.; methodology, I.P. and P.B.-W.; software, I.P.; validation, I.P., P.B.-W. and K.P.; formal analysis, I.P, P.B.-W, K.P. and A.T..; investigation, I.P. and P.B.-W.; resources, I.P.; data curation, I.P.; writing—original draft preparation, I.P.; writing—review and editing, I.P, P.B.-W, K.P. and A.T.; visualization, I.P.; supervision, I.P, P.B.-W, K.P. and A.T.; project administration, P.B.-W. All authors have read and agreed to the published version of the manuscript.
Funding
This research received no external funding.
Conflicts of Interest
The authors declare no conflict of interest.
References
- Corcelli, F.; Ripa, M.; Ulgiati, S. End-of-life treatment of crystalline silicon photovoltaic panels. An emergy-based case study. J. Clean. Prod. 2017, 9, 1129–1142. [Google Scholar] [CrossRef]
- Goe, M.; Gaustad, G. Strengthening the case for recycling photovoltaics: An energy payback analysis. Appl. Energy 2014, 5, 41–48. [Google Scholar] [CrossRef]
- McLellan, B. Sustainable Future for Human Security. In Environment and Resources; Springer: Singapore, 2018; pp. 37–68. [Google Scholar] [CrossRef]
- Singh, R.; Kumar, S. Green Technologies and Environmental Sustainability; Springer: Cham, Switzerland, 2017; pp. 157–178. [Google Scholar] [CrossRef]
- Andersen, O. Unintended Consequences of Renewable Energy; Springer: London, UK, 2013; pp. 81–89. [Google Scholar] [CrossRef]
- Coulson, N.E.; Wang, Y.; Lipscomb, C.A. Energy Efficiency and the Future of Real Estate; Palgrave Macmillan: New York, NY, USA, 2017; pp. 83–89. [Google Scholar] [CrossRef]
- Gronowicz, J. Ochrona Środowiska w Transporcie Lądowym; Biblioteka problemów eksploatacji, Instytut Technologii Eksploatacji–PIB: Radom, Poland, 2004; pp. 11–32. ISBN 83-7204-374-4. [Google Scholar]
- Granata, G.; Pagnanelli, F.; Moscardini, E.; Havlik, T.; Toro, L. Recycling of photovoltaic panels by physical operations. Sol. Energy Mater. Sol. Cells 2014, 6, 239–248. [Google Scholar] [CrossRef]
- Kruszelnicka, W.; Bałdowska-Witos, P.; Kasner, R.; Flizikowski, J.; Tomporowski, A.; Rudnicki, J. Evaluation of emissivity and environmental safety of biomass grinders drive. Przem. Chem. 2019, 10, 1494–1498. [Google Scholar] [CrossRef]
- Tao, J.; Yu, S. Review on feasible recycling pathways and technologies of solar photovoltaic modules. Sol. Energy Mater. Sol. Cells 2015, 10, 108–124. [Google Scholar] [CrossRef]
- Demirel, Y. Energy: Production, Conversion, Storage, Conservation and Coupling; Springer: Cham, Switzerland, 2016; pp. 441–484. [Google Scholar] [CrossRef]
- Merkisz, J.; Rymaniak, Ł. The assessment of vehicle exhaust emissions referred to CO2 based on the investigations of city buses under actual conditions of operation. Eksploat. Niezawodn. 2017, 19, 522–529. [Google Scholar] [CrossRef]
- Wang, Z.; Wu, J.; Liu, C.; Gu, G. Integrated Assessment Models of Climate Change Economics; Springer: Singapore, 2017; pp. 1–19. [Google Scholar] [CrossRef]
- Dahlquist, E.; Hellstrand, S. Natural Resources Available Today and in the Future: How to Perform Change Management for Achieving a Sustainable World; Springer: Cham, Switzerland, 2017; pp. 245–268. [Google Scholar] [CrossRef]
- Heshmati, A.; Abolhosseini, S.; Altmann, J. The Development of Renewable Energy Sources and Its Significance for the Environment; Springer: Singapore, 2015; pp. 7–29. [Google Scholar] [CrossRef]
- Bauer, G.H. Photovoltaic Solar Energy Conversion; Springer: Berlin, Germany, 2015; pp. 5–37. [Google Scholar] [CrossRef]
- Dincer, I.; Midilli, A.; Kucuk, H. Progress in Sustainable Energy Technologies: Generating Renewable Energy; Springer: Cham, Switzerland, 2014; pp. 339–353. [Google Scholar] [CrossRef]
- Márquez, F.P.G.; Karyotakis, A.; Papaelias, M. Renewable Energies; Springer: Berlin, Germany, 2018; pp. 1–15. [Google Scholar] [CrossRef]
- Rigatos, G.G. Intelligent Renewable Energy Systems: Modelling and Control; Springer: Cham, Switzerland, 2016; pp. 339–409. [Google Scholar] [CrossRef]
- Hossain, J.; Mahmud, A. Renewable Energy Integration: Challenges and Solutions; Springer: Singapore, 2014; pp. 69–95. [Google Scholar] [CrossRef]
- Toke, D. Ecological Modernization and Renewable Energy; Palgrave Macmillan: New York, NY, USA, 2011; pp. 167–179. [Google Scholar] [CrossRef] [Green Version]
- Traverso, M.; Asdrubali, F.; Francia, A.; Finkbeiner, M. Towards life cycle sustainability assessment: An implementation to photovoltaic modules. Int. J. Life Cycle Assess 2012, 17, 1068–1079. [Google Scholar] [CrossRef]
- Bałdowska-Witos, P.; Kruszelnicka, W.; Kasner, R.; Rudnicki, J.; Tomporowski, A.; Flizikowski, J. Impact of the plastic bottle production on the natural environment. Part 1. Application of the ReCiPe 2016 assessment method to identify environmental problems. Przem. Chem. 2019, 10, 1662–1667. [Google Scholar] [CrossRef]
- Kulczycka, J.; Lelek, Ł.; Lewandowska, A.; Zarębska, J. Life Cycle Assessment of municipal solid waste management—Comparison of results using different LCA models. Pol. J. Environ. Stud. 2015, 1, 125–140. [Google Scholar] [CrossRef]
- Lelek, Ł.; Kulczycka, J.; Lewandowska, A.; Zarębska, J. Life cycle assessment of energy generation in Poland. Int. J. Life Cycle Assess 2016, 21, 1–14. [Google Scholar] [CrossRef] [Green Version]
- Guineé, J. Handbook on Life Cycle Assessment: Operational Guide to the ISO Standards; Springer: Dordrecht, The Netherlands, 2002; pp. 31–108. [Google Scholar] [CrossRef]
- Treloar, G.J.; Love, P.E.D.; Faniran, O.O.; Iyer-Raniga, U. A hybrid life cycle assessment method for construction. Constr. Manag. Econ. 2000, 18, 5–9. [Google Scholar] [CrossRef]
- Ulgiati, S.; Raugei, M.; Bargigli, S. Overcoming the in adequacy of single-criterion approaches to Life Cycle Assessment. Ecol. Modell. 2006, 3, 432–442. [Google Scholar] [CrossRef]
- Guinée, J.; Heijungs, R.; Huppes, G.; Zamagni, A.; Masoni, P.; Buonamici, R.; Rydberg, T. Life Cycle Assessment: Past, present, and future. Environ. Sci. Technol. 2011, 1, 90–96. [Google Scholar] [CrossRef] [PubMed]
- Tomporowski, A.; Flizikowski, J.; Wełnowski, J.; Najzarek, Z.; Topoliński, T.; Kruszelnicka, W.; Piasecka, I.; Śmigiel, S. Regeneration of rubber waste using an intelligent grinding system. Przem. Chem. 2018, 10, 1659–1665. [Google Scholar] [CrossRef]
- Klinglmair, M.; Sala, S.; Brandão, M. Assessing resource depletion in LCA: A review of methods and methodological issues. Int. J. Life Cycle Assess 2014, 19, 580–592. [Google Scholar] [CrossRef]
- Kłos, Z. Ecobalancial assessment of chosen packaging processes in food industry. Int. J. Life Cycle Assess 2002, 7, 309. [Google Scholar] [CrossRef]
- Rebitzer, G.; Loerincik, Y.; Jolliet, O. Input-output life cycle assessment: From theory to applications. Int. J. Life Cycle Assess 2002, 7, 174–176. [Google Scholar] [CrossRef] [Green Version]
- Dreyer, L.C.; Niemann, A.L.; Hauschild, M.Z. Comparison of Three Different LCIA Methods: EDIP97, CML2001 and Eco-indicator 99. Int. J. Life Cycle Assess 2003, 8, 191–200. [Google Scholar] [CrossRef]
- Piasecka, I.; Tomporowski, A.; Flizikowski, J.; Kruszelnicka, W.; Kasner, R.; Mroziński, A. Life Cycle Analysis of Ecological Impacts of an Offshore and a Land-Based Wind Power Plant. Appl. Sci. 2019, 9, 231. [Google Scholar] [CrossRef] [Green Version]
- Piotrowska, K.; Kruszelnicka, W.; Bałdowska-Witos, P.; Kasner, R.; Rudnicki, J.; Tomporowski, A.; Flizikowski, J.; Opielak, M. Assessment of the Environmental Impact of a Car Tire throughout Its Life Cycle Using the LCA Method. Materials 2019, 12, 4177. [Google Scholar] [CrossRef] [Green Version]
- Tomporowski, A.; Flizikowski, J.; Kruszelnicka, W.; Piasecka, I.; Kasner, R.; Mroziński, A.; Kovalyshyn, S. Destructiveness of profits and outlays associated with operation of offshore wind electric power plant. Part 1: Identification of a model and its components. Pol. Marit. Res. 2018, 2, 132–139. [Google Scholar] [CrossRef] [Green Version]
- Kendall, A. Time-adjusted global warming potentials for LCA and carbon footprints. Int. J. Life Cycle Assess 2012, 17, 1042–1049. [Google Scholar] [CrossRef]
- Muñoz, I.; Schmidt, J.H. Methane oxidation, biogenic carbon, and the IPCC’s emission metrics. Proposal for a consistent greenhouse-gas accounting. Int. J. Life Cycle Assess 2016, 21, 1069–1075. [Google Scholar] [CrossRef]
- Peter, C.; Fiore, A.; Hagemann, U.; Nendel, C.; Xiloyannis, C. Improving the accounting of field emissions in the carbon footprint of agricultural products: A comparison of default IPCC methods with readily available medium-effort modeling approaches. Int. J. Life Cycle Assess 2016, 21, 791–805. [Google Scholar] [CrossRef] [Green Version]
- Stichnothe, H.; Schuchardt, F.; Rahutomo, S. European renewable energy directive: Critical analysis of important default values and methods for calculating greenhouse gas (GHG) emissions. Int. J. Life Cycle Assess 2014, 19, 1294–1304. [Google Scholar] [CrossRef]
- Frischknecht, R.; Wyss, F.; Büsser-Knöpfel, S.; Lützkendorf, T.; Balouktsi, M. Cumulative energy demand in LCA: The energy harvested approach. Int. J. Life Cycle Assess 2015, 20, 957–969. [Google Scholar] [CrossRef]
- Puig, R.; Fullana-Palmer, P.; Baquero, G.; Riba, J.R.; Bala, A. A Cumulative Energy Demand indicator (CED), life cycle based, for industrial waste management decision making. Waste Manag. 2013, 12, 2789–2797. [Google Scholar] [CrossRef]
- Scipioni, A.; Niero, M.; Mazzi, A.; Manzardo, A.; Piubello, S. Significance of the use of non-renewable fossil CED as proxy indicator for screening LCA in the beverage packaging sector. Int. J. Life Cycle Assess 2013, 18, 673–682. [Google Scholar] [CrossRef]
- Tiwari, G.N.; Mishra, R.K. Advanced Renewable Energy Sources; Royal Society of Chemistry: Cambridge, UK, 2012; pp. 46–71. ISBN 978-1-84973-380-9. [Google Scholar]
- Zacher, L.W. ; Technology, Society and Sustainability: Selected Concepts, Issues and Cases; Springer: Basel, Switzerland, 2017; pp. 203–221. [Google Scholar] [CrossRef]
- Solmes, L.A. Energy Efficiency: Real Time Energy Infrastructure Investment and Risk Management; Springer: Dordrecht, The Netherlands, 2009; pp. 1–34. [Google Scholar] [CrossRef]
- Twidell, J.; Weir, T. Renewable Energy Resources; Routledge: London, UK, 2015; pp. 151–202. [Google Scholar] [CrossRef]
- Yang, M.; Yu, X. Energy Efficiency: Benefits for Environment and Society; Springer: London, UK, 2015; pp. 11–42. [Google Scholar] [CrossRef]
- Kumar, A.; Melkote, S.N. Diamond Wire Sawing of Solar Silicon Wafers: A Sustainable Manufacturing Alternative to Loose Abrasive Slurry Sawing. Procedia Manuf. 2018, 21, 549–566. [Google Scholar] [CrossRef]
- Kumar, A.; Melkote, S.N.; Kamiński, S.; Arcona, C. Effect of grit shape and crystal structure on damage in diamond wire scribing of silicon. J. Am. Ceram. Soc. 100 2017, 4, 1350–1359. [Google Scholar] [CrossRef]
- Bai, A.; Popp, J.; Pető, K.; Szőke, I.; Harangi-Rákos, M.; Gabnai, Z. The Significance of Forests and Algae in CO2 Balance: A Hungarian Case Study. Sustainability 2017, 9, 857. [Google Scholar] [CrossRef] [Green Version]
- Tremeac, B.; Meunier, F. Life cycle analysis of 4.5 MW and 250 W wind turbines. Renew. Sustain. Energy Rev. 2009, 13, 2104–2110. [Google Scholar] [CrossRef]
- Verán-Leigh, D.; Vázquez-Rowe, I. Life cycle assessment of run-of-river hydropower plants in the Peruvian Andes: A policy support perspective. Int. J. Life Cycle Assess 2019, 24, 1376–1395. [Google Scholar] [CrossRef]
Figure 1.
Life Cycle Assessment (LCA) framework.
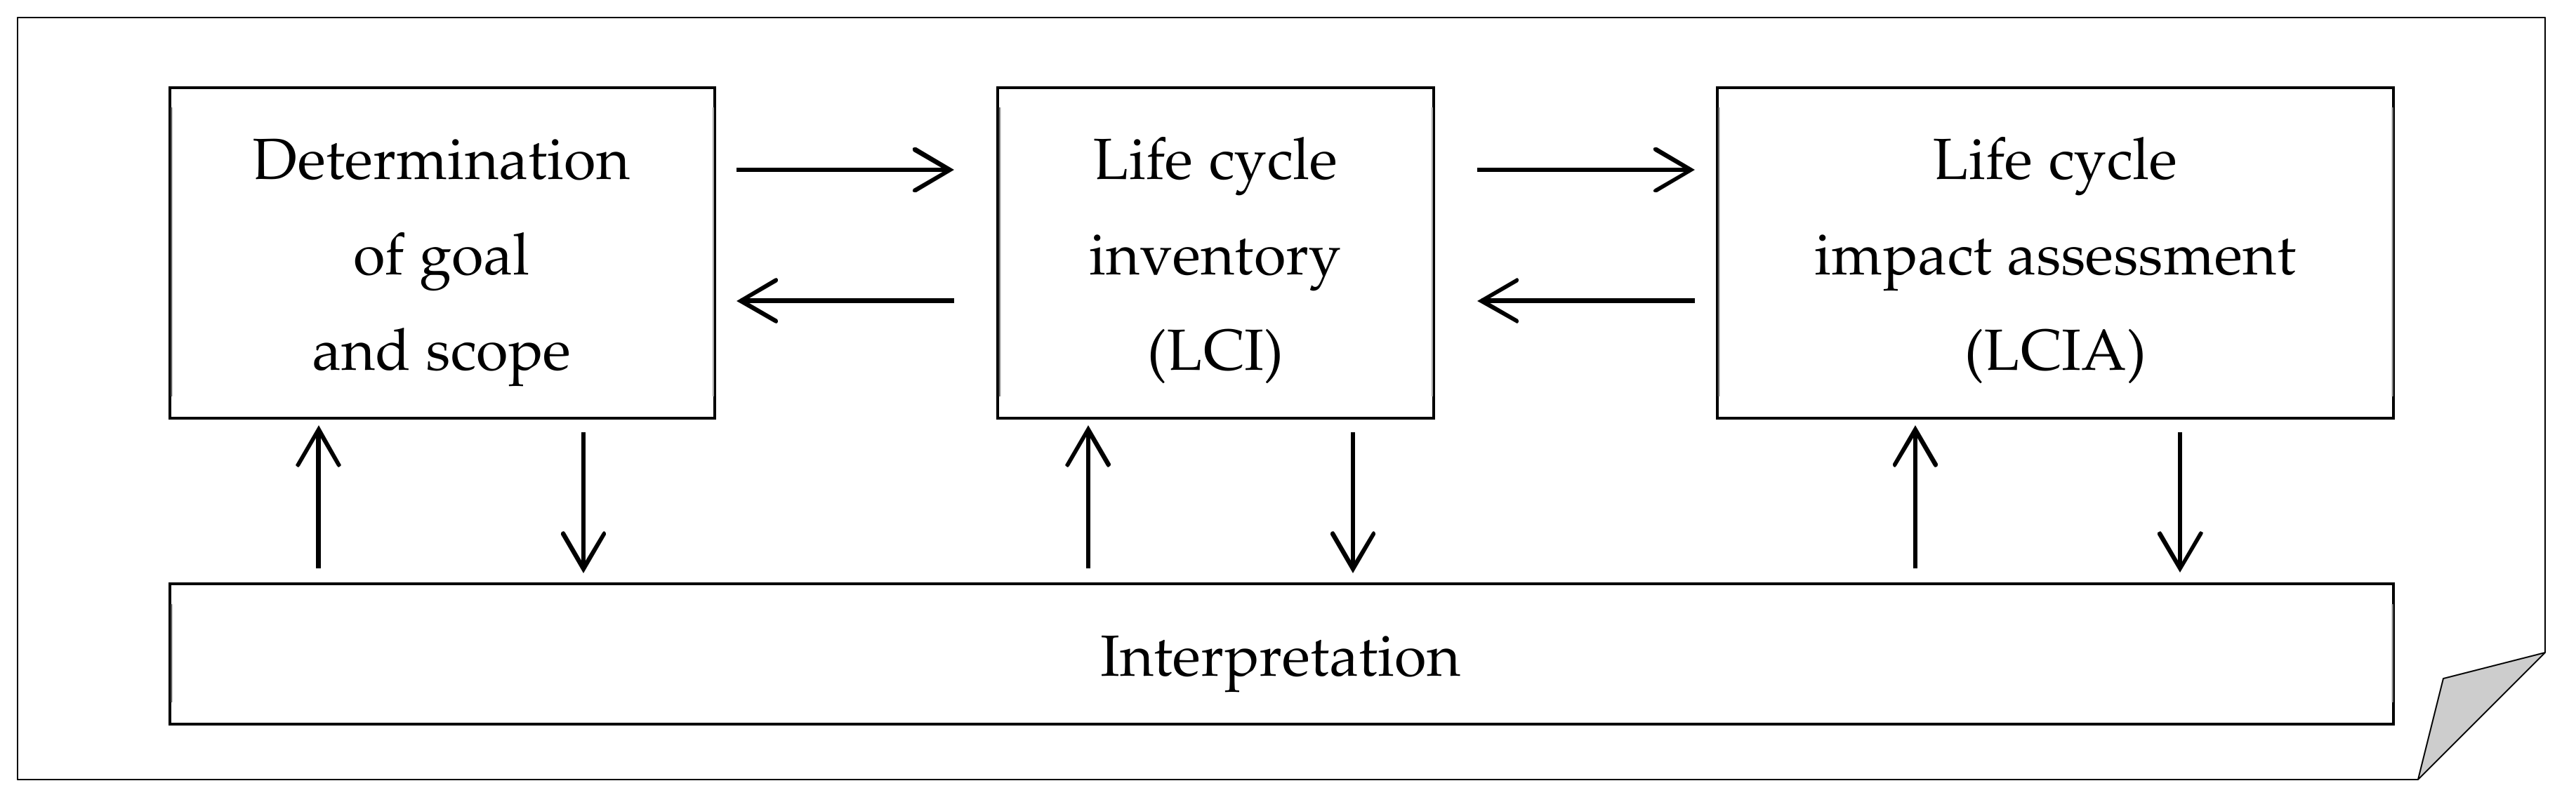
Figure 2.
The material life cycle of photovoltaic power plants.
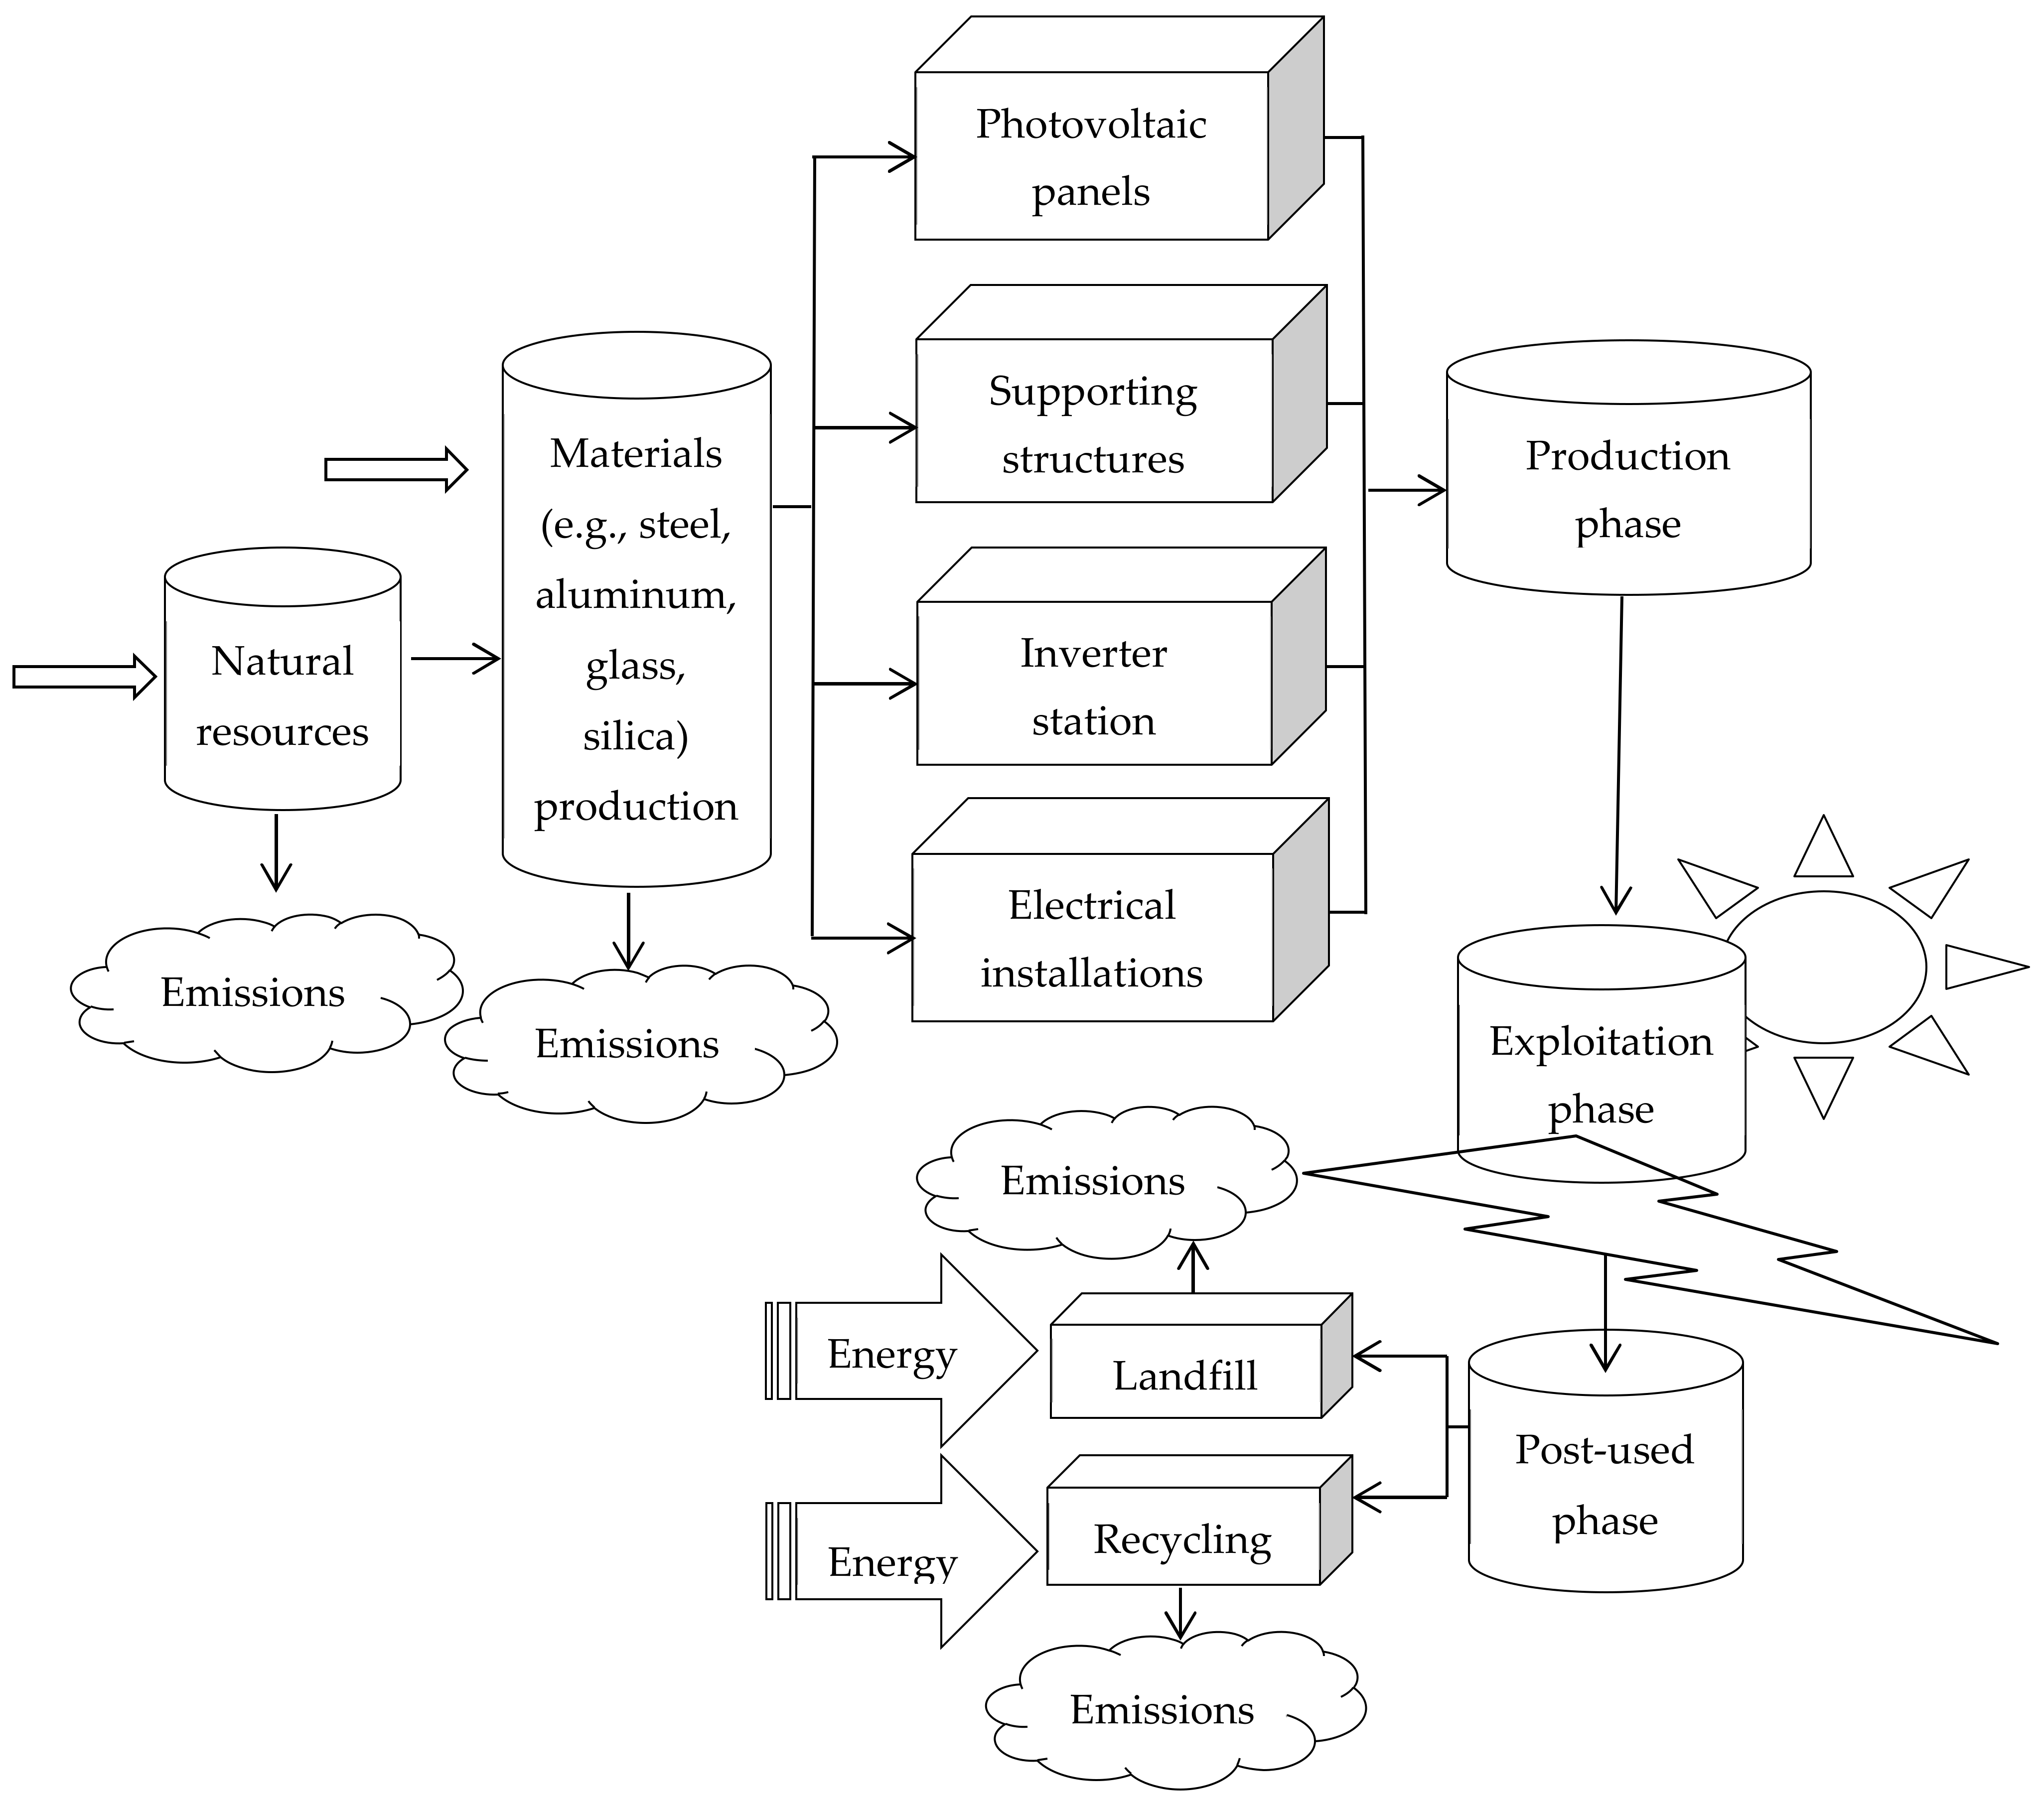
Figure 3.
Structure of LCA impact category groupings, Eco-indicator 99 method.
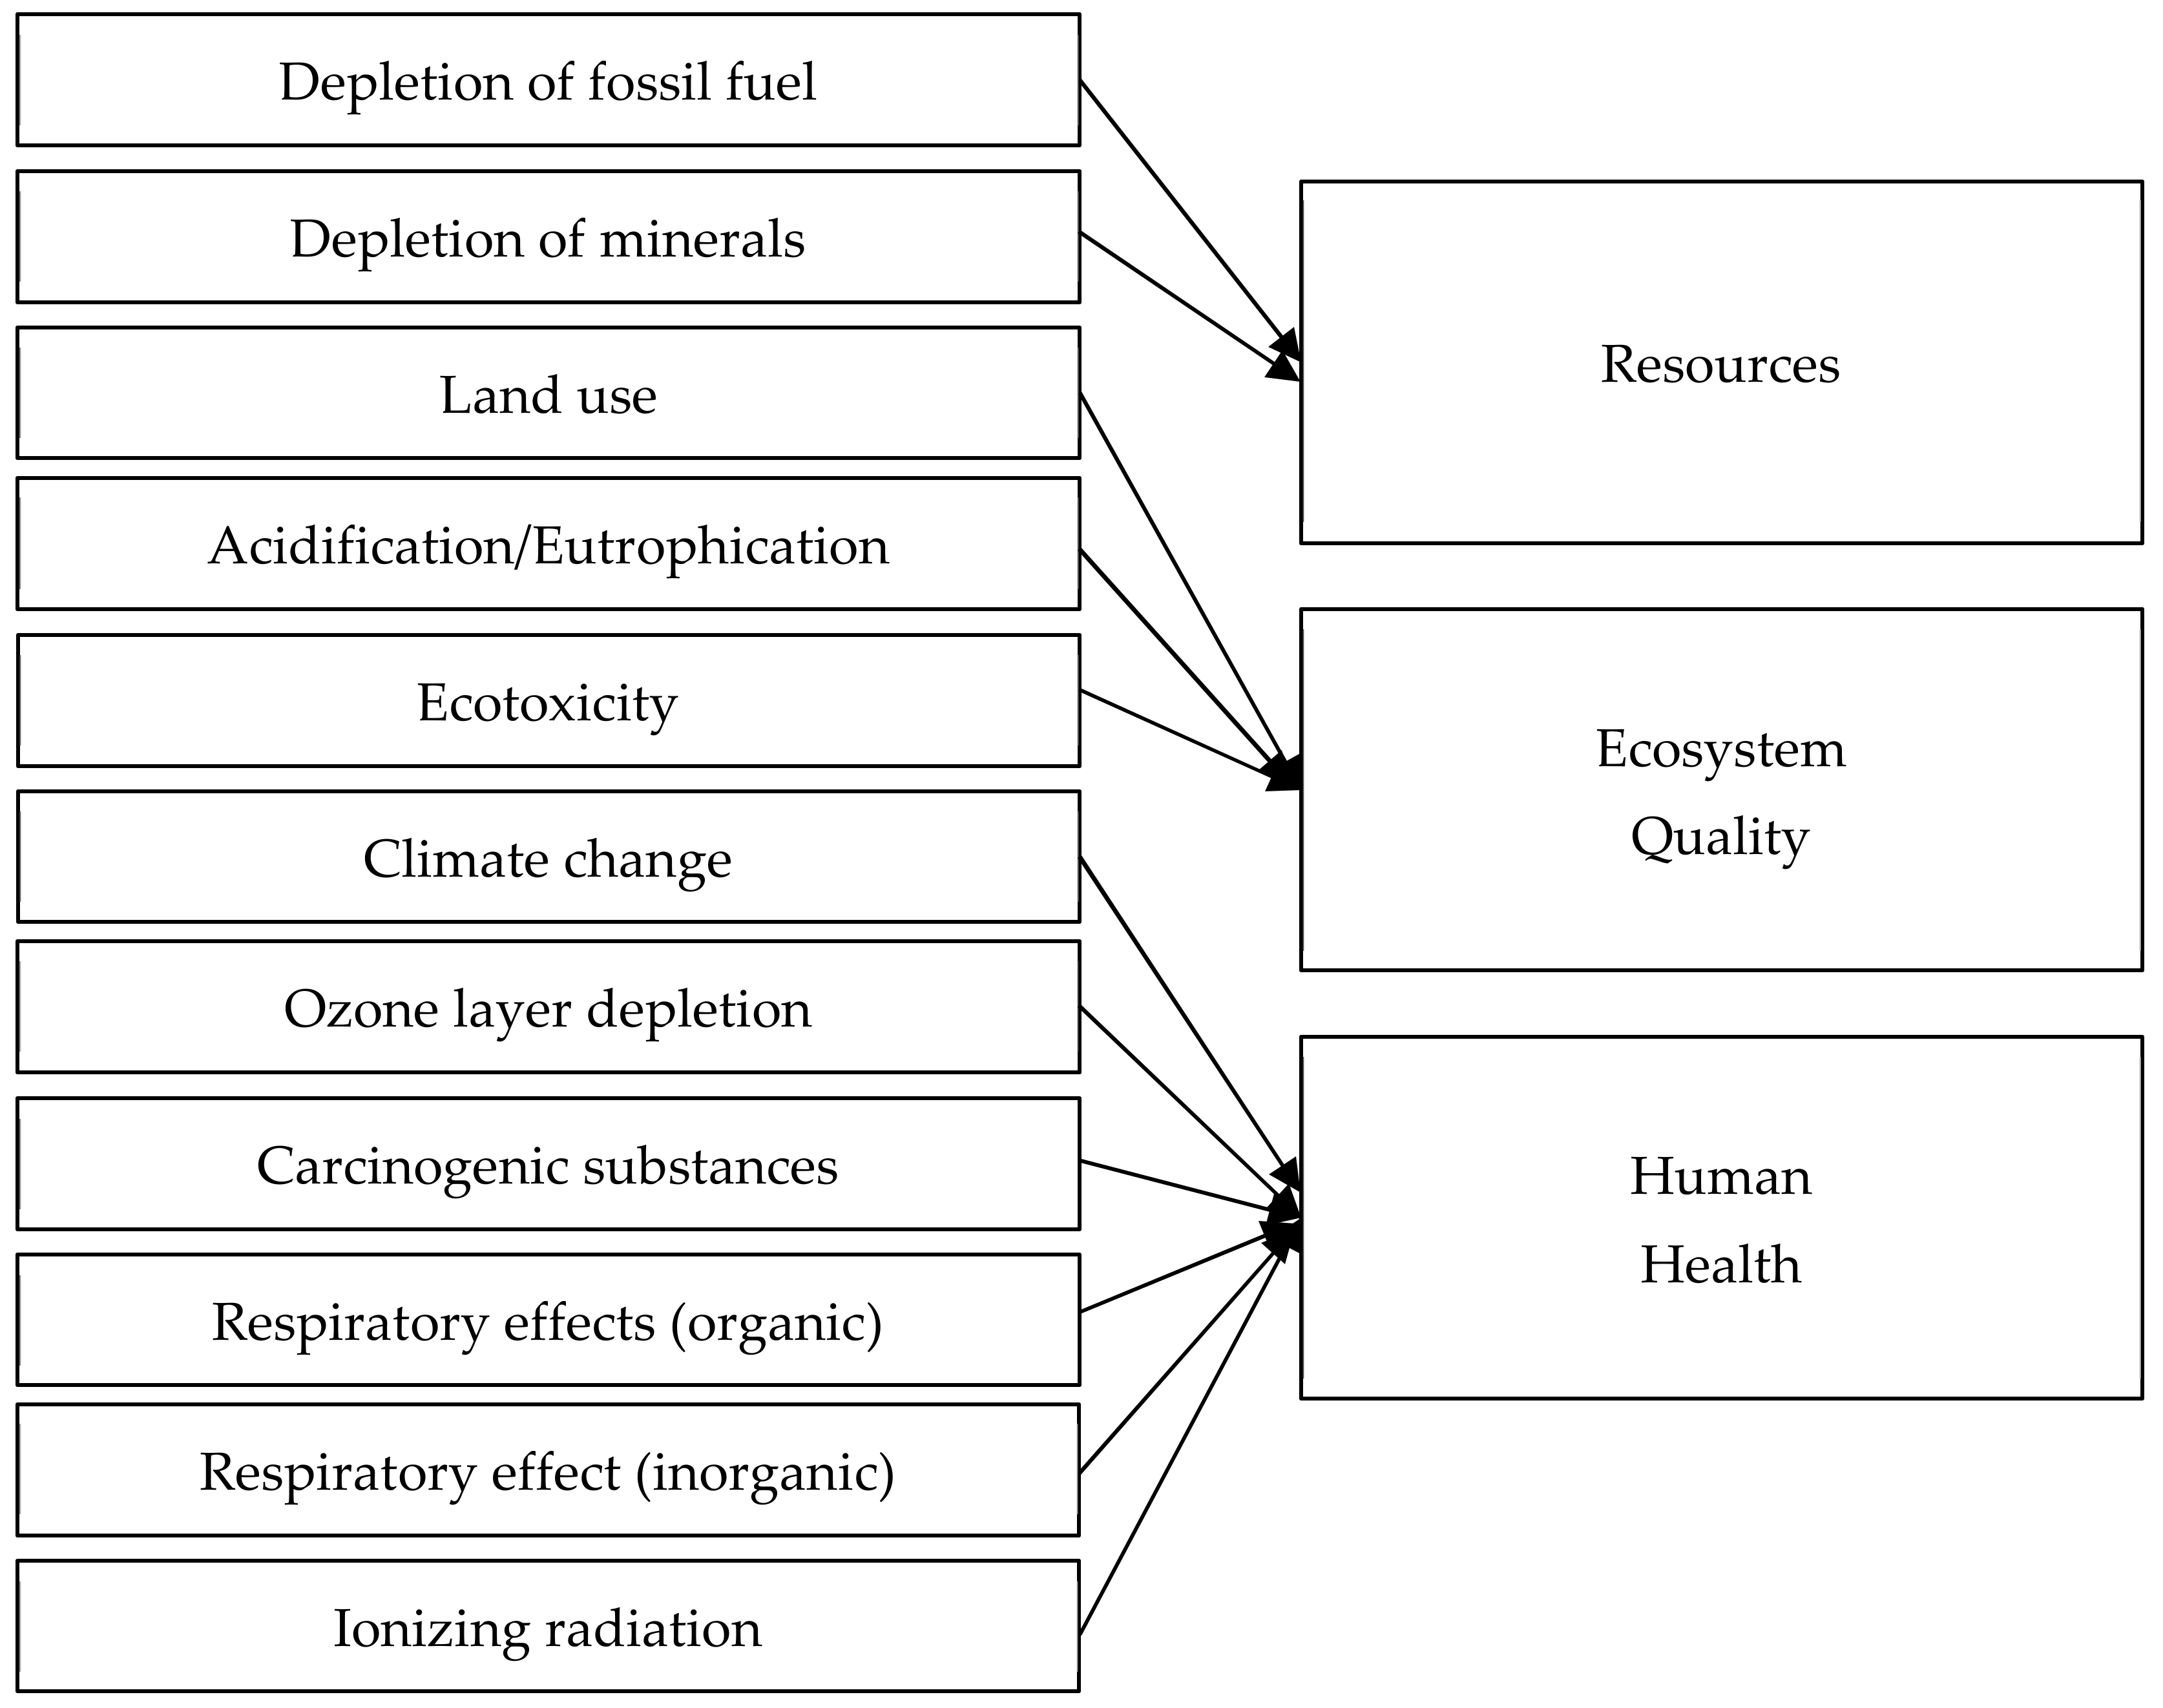
Figure 4.
Results of grouping and weighting of environmental impacts occurring during the material life cycle of selected groups of 1 megawatt photovoltaic power plant for all categories of influence [unit: Pt].
Figure 4.
Results of grouping and weighting of environmental impacts occurring during the material life cycle of selected groups of 1 megawatt photovoltaic power plant for all categories of influence [unit: Pt].
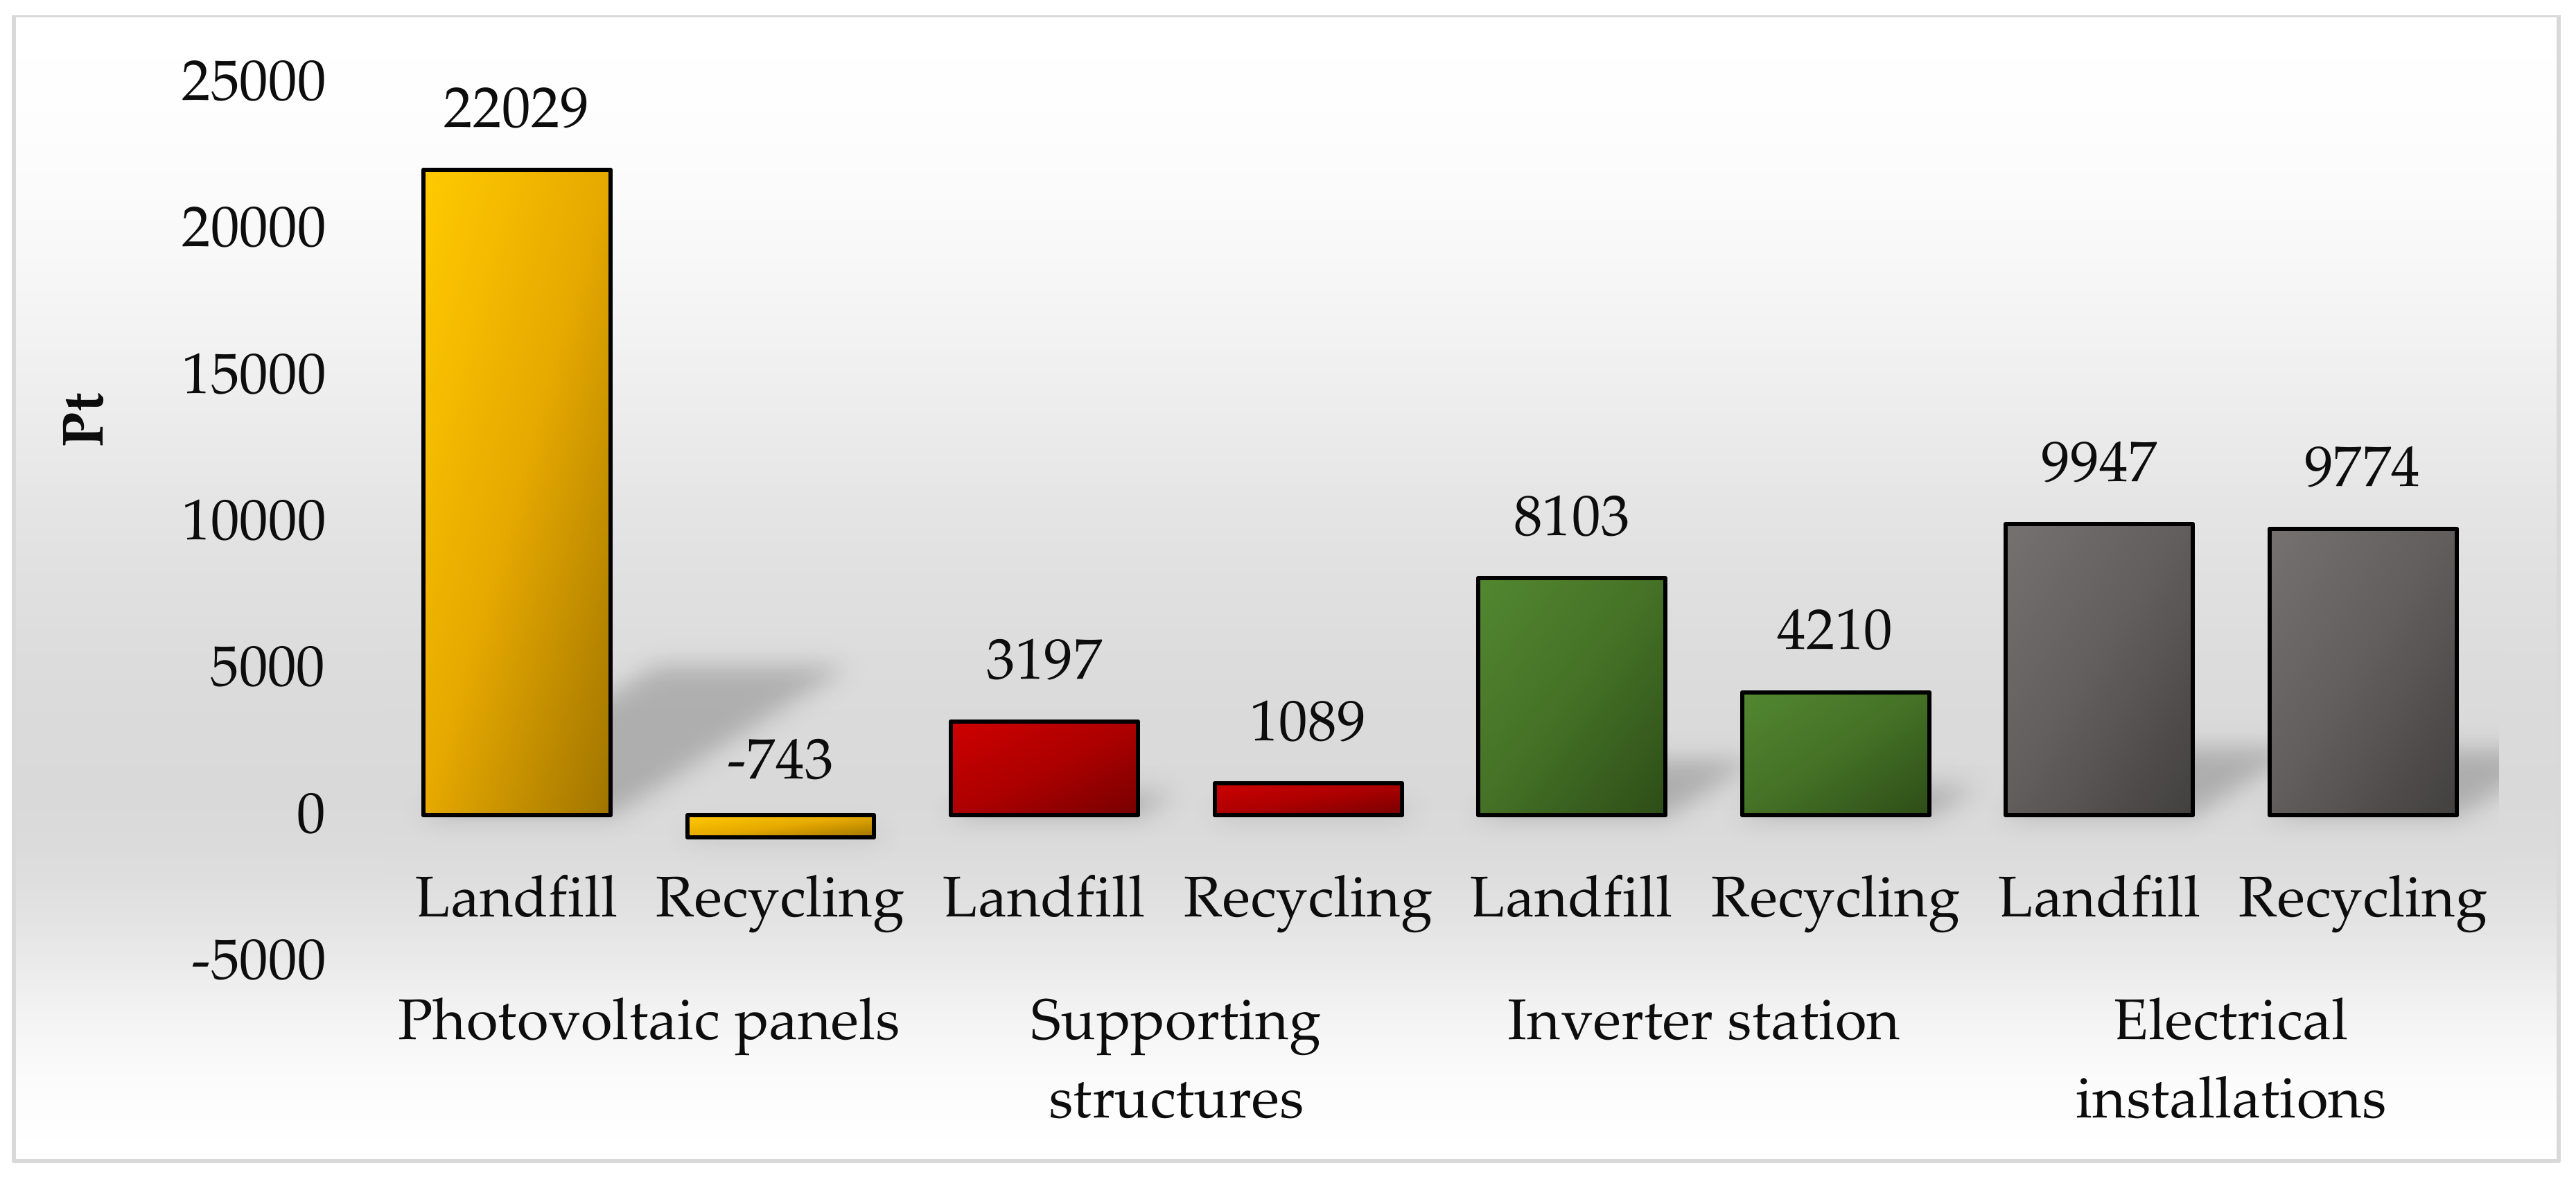
Figure 5.
Grouping and weighting results of environmental impacts occurring in the material life cycle stages of a 1 megawatt photovoltaic power plant [unit: Pt].
Figure 5.
Grouping and weighting results of environmental impacts occurring in the material life cycle stages of a 1 megawatt photovoltaic power plant [unit: Pt].
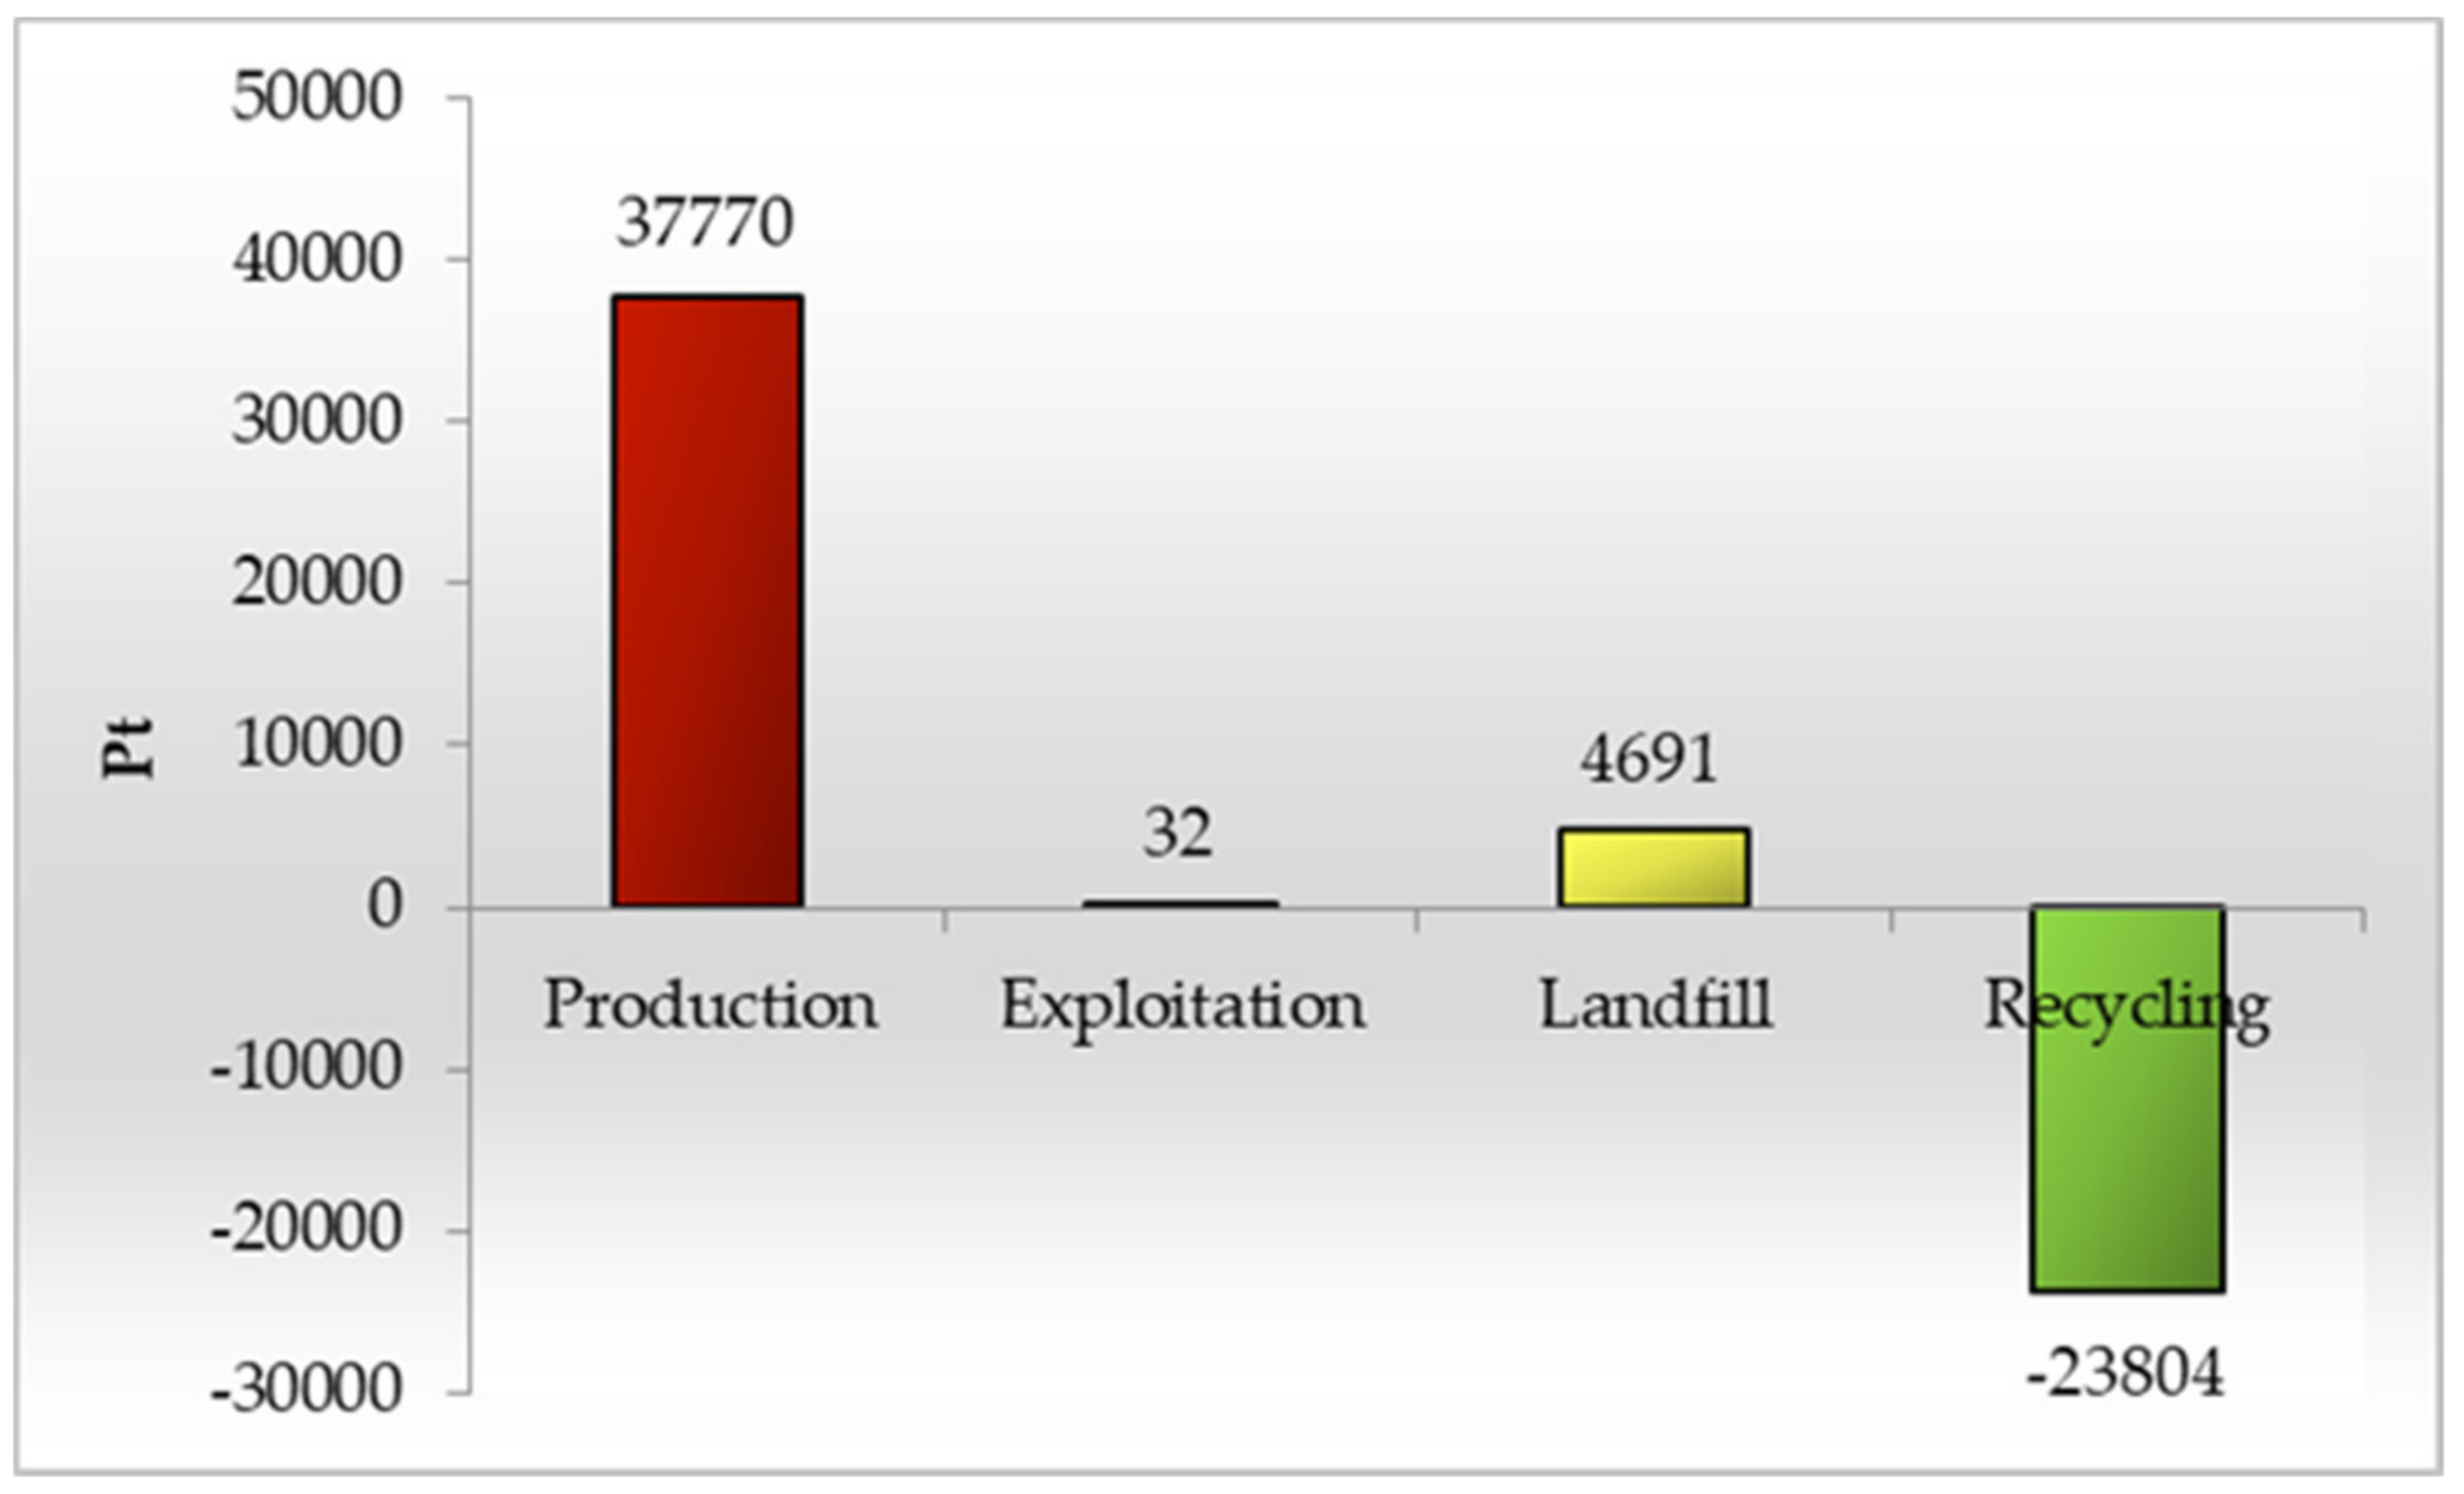
Figure 6.
Results of the characterization of environmental consequences for cumulative greenhouse gas (GHG) emissions occurring in the cycle of existence of selected groups of 1 megawatt photovoltaic power plant [unit: kg CO2 eq].
Figure 6.
Results of the characterization of environmental consequences for cumulative greenhouse gas (GHG) emissions occurring in the cycle of existence of selected groups of 1 megawatt photovoltaic power plant [unit: kg CO2 eq].
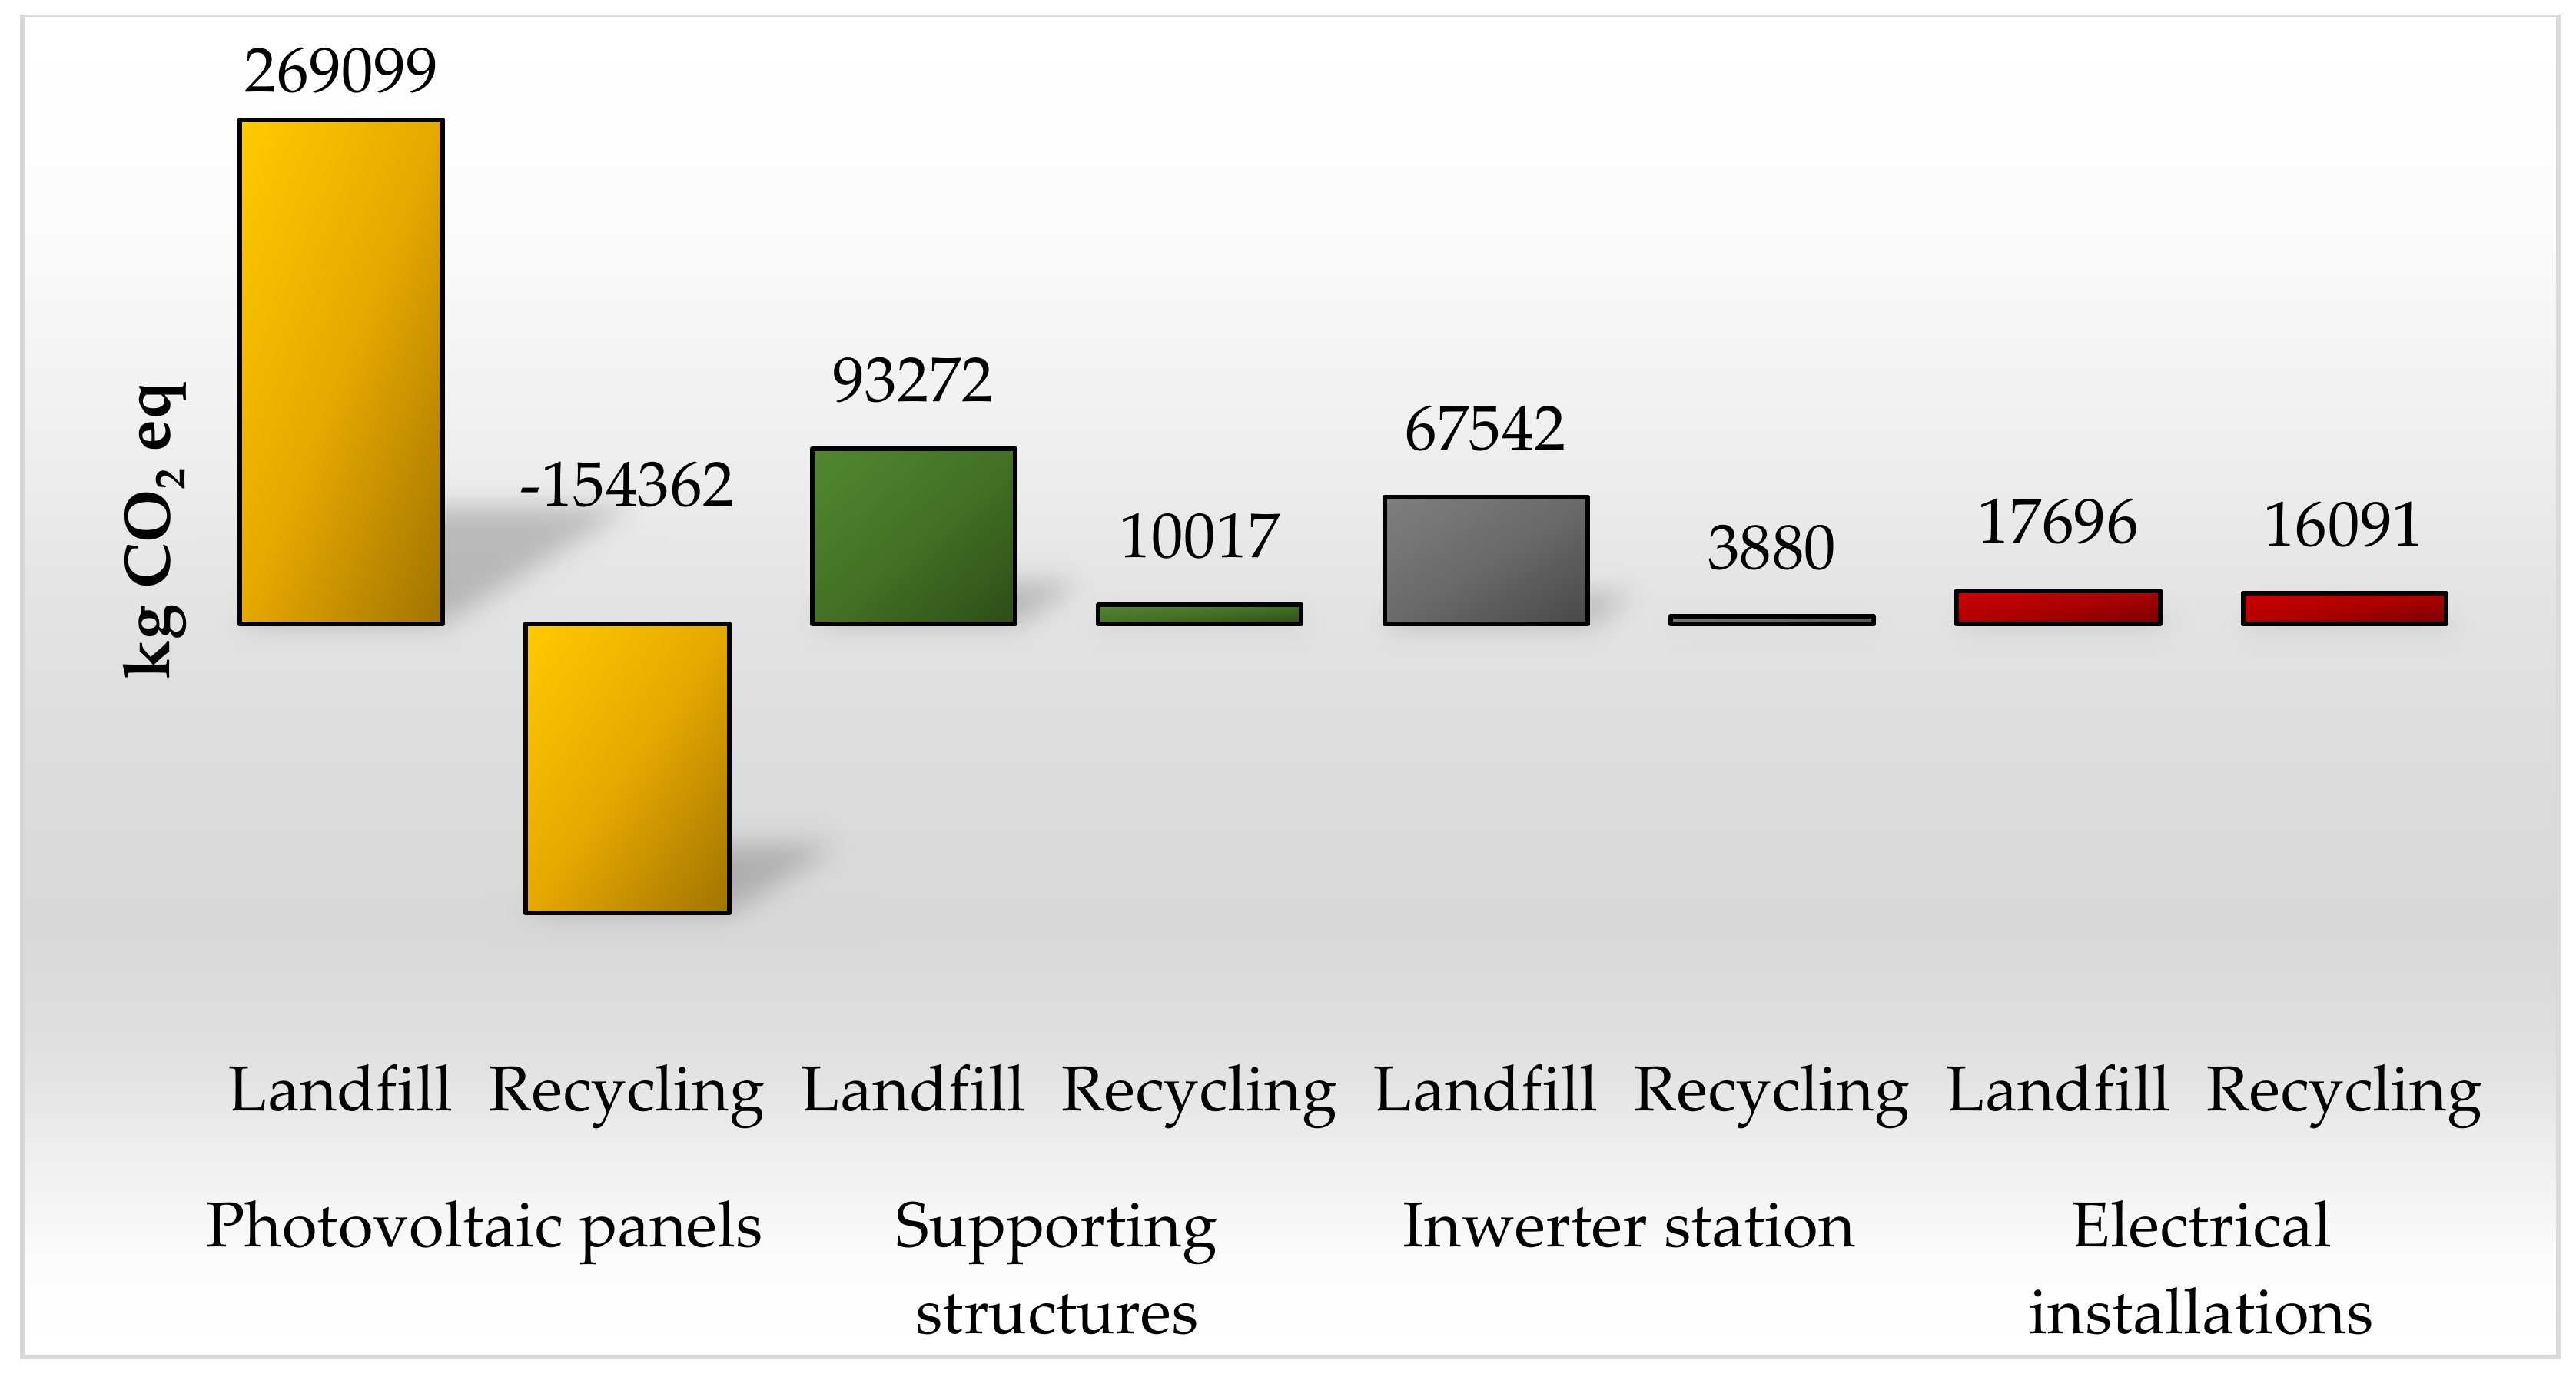
Figure 7.
Results of the characterization of environmental consequences, in relation to cumulative energy demand (in MWh), occurring in the cycle of existence of selected groups of 1 megawatt photovoltaic power plant [unit: MJ].
Figure 7.
Results of the characterization of environmental consequences, in relation to cumulative energy demand (in MWh), occurring in the cycle of existence of selected groups of 1 megawatt photovoltaic power plant [unit: MJ].
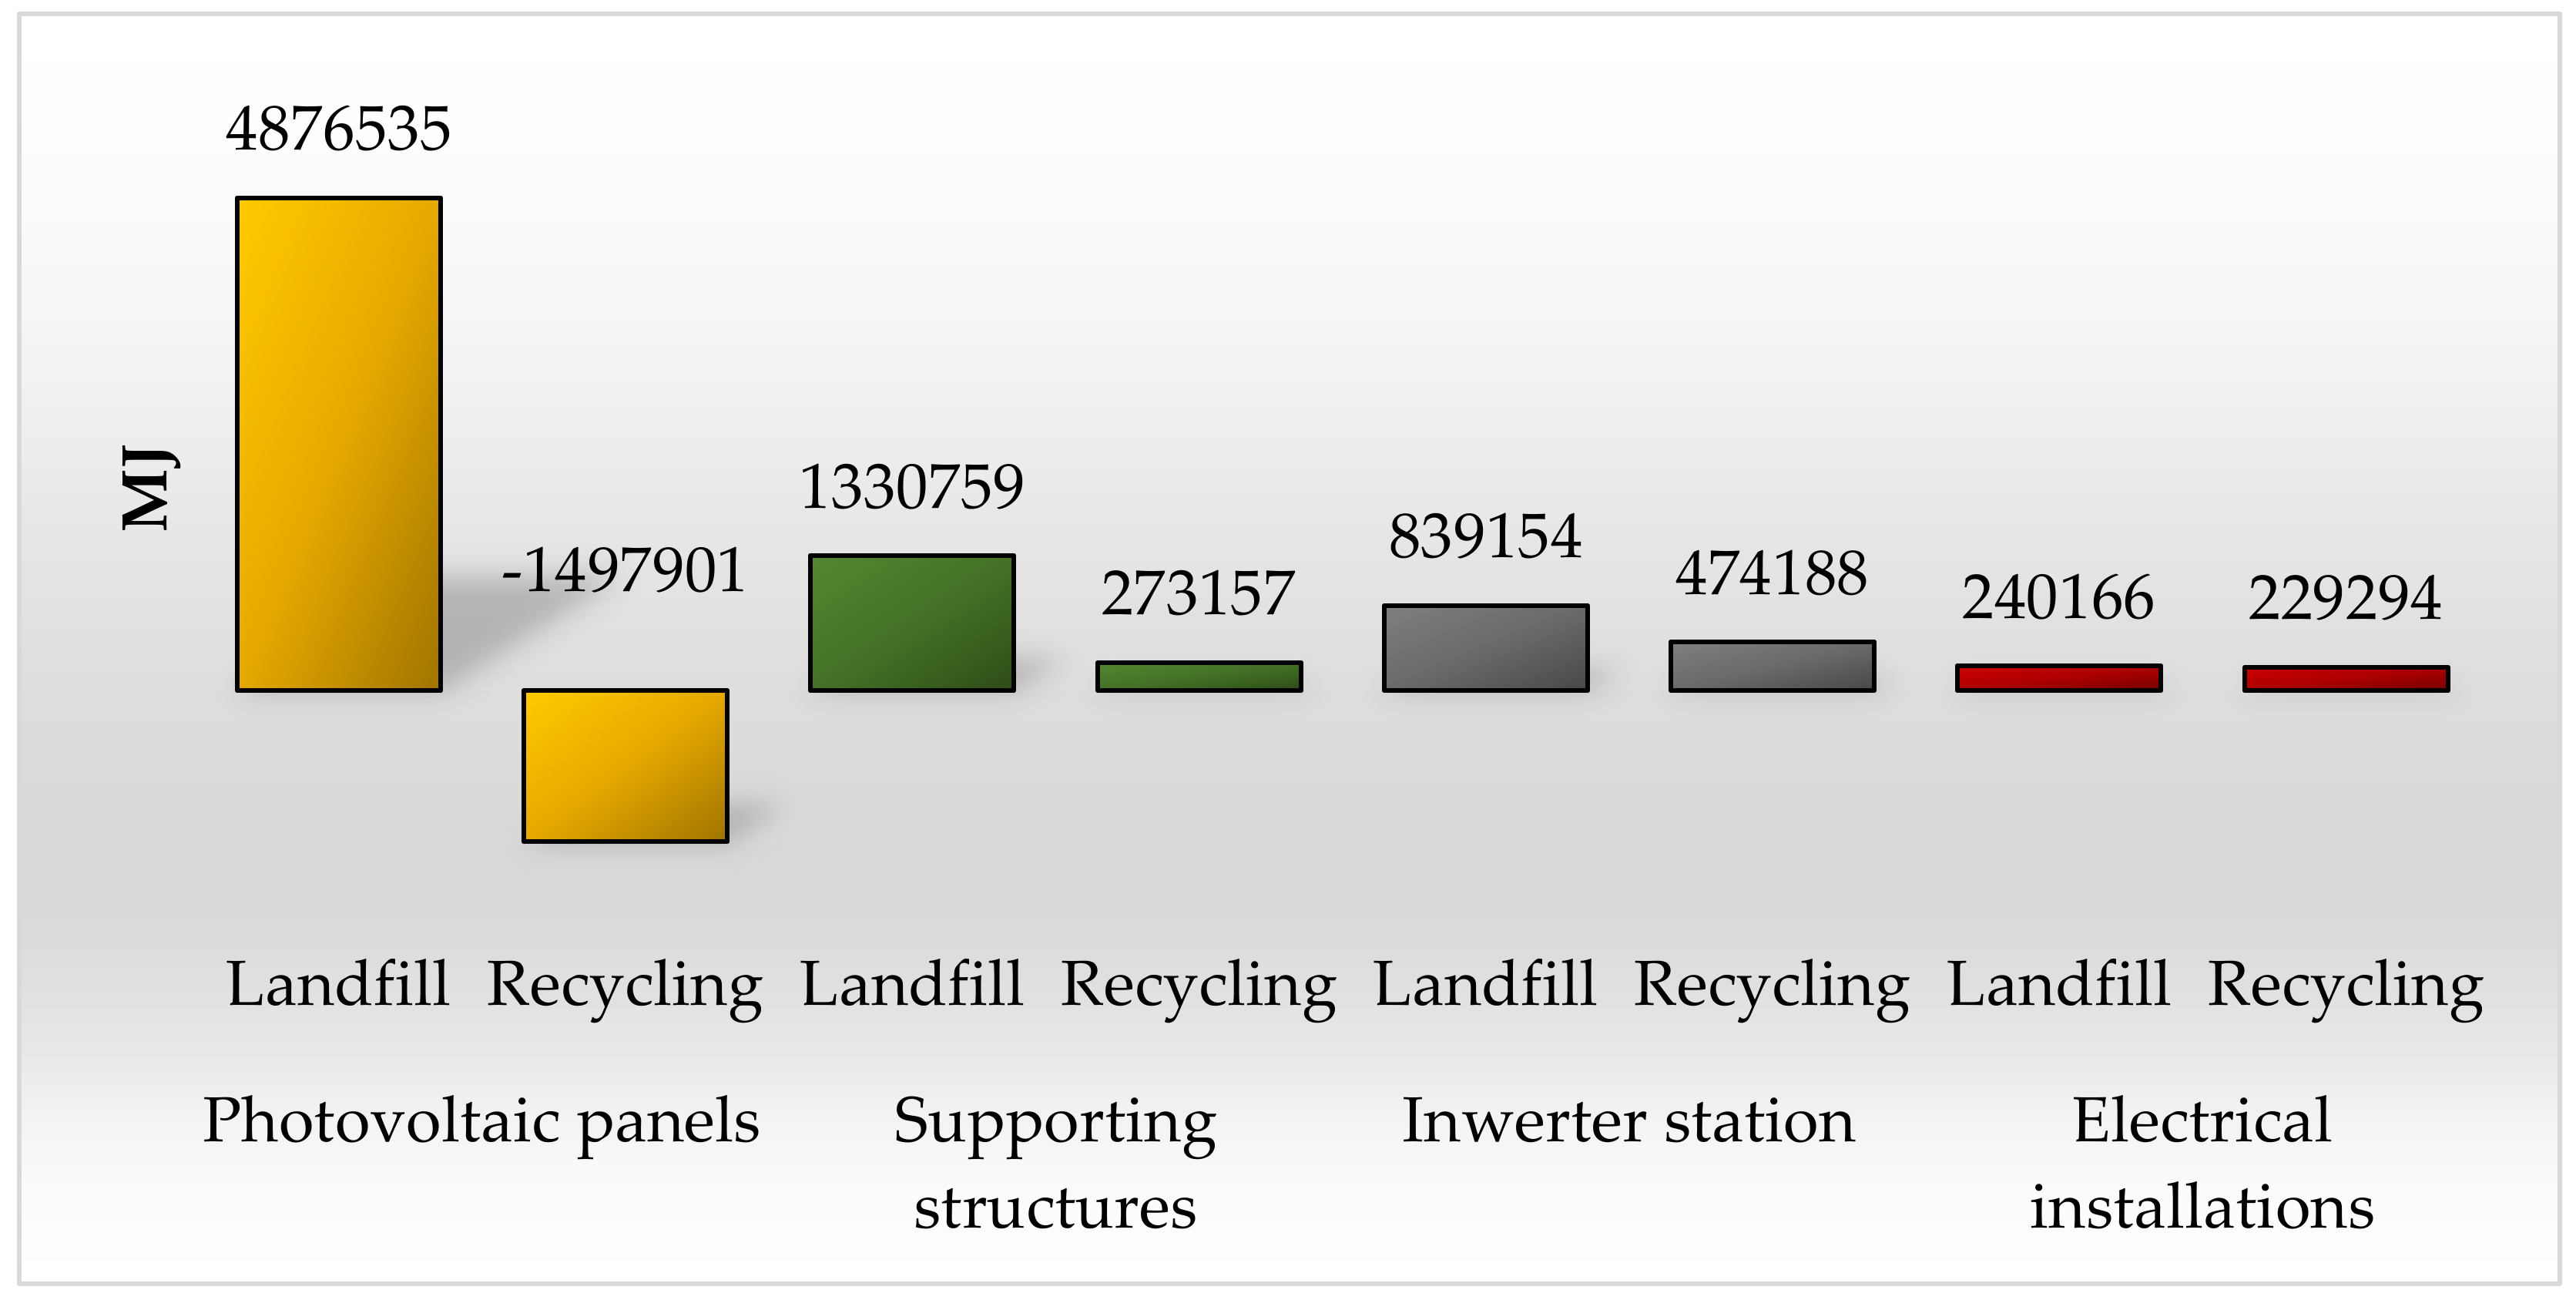
Figure 8.
Results of grouping and weighting the environmental consequences of 1,000 kg of selected plastics and materials included in photovoltaic elements for all categories of influence [unit: Pt].
Figure 8.
Results of grouping and weighting the environmental consequences of 1,000 kg of selected plastics and materials included in photovoltaic elements for all categories of influence [unit: Pt].
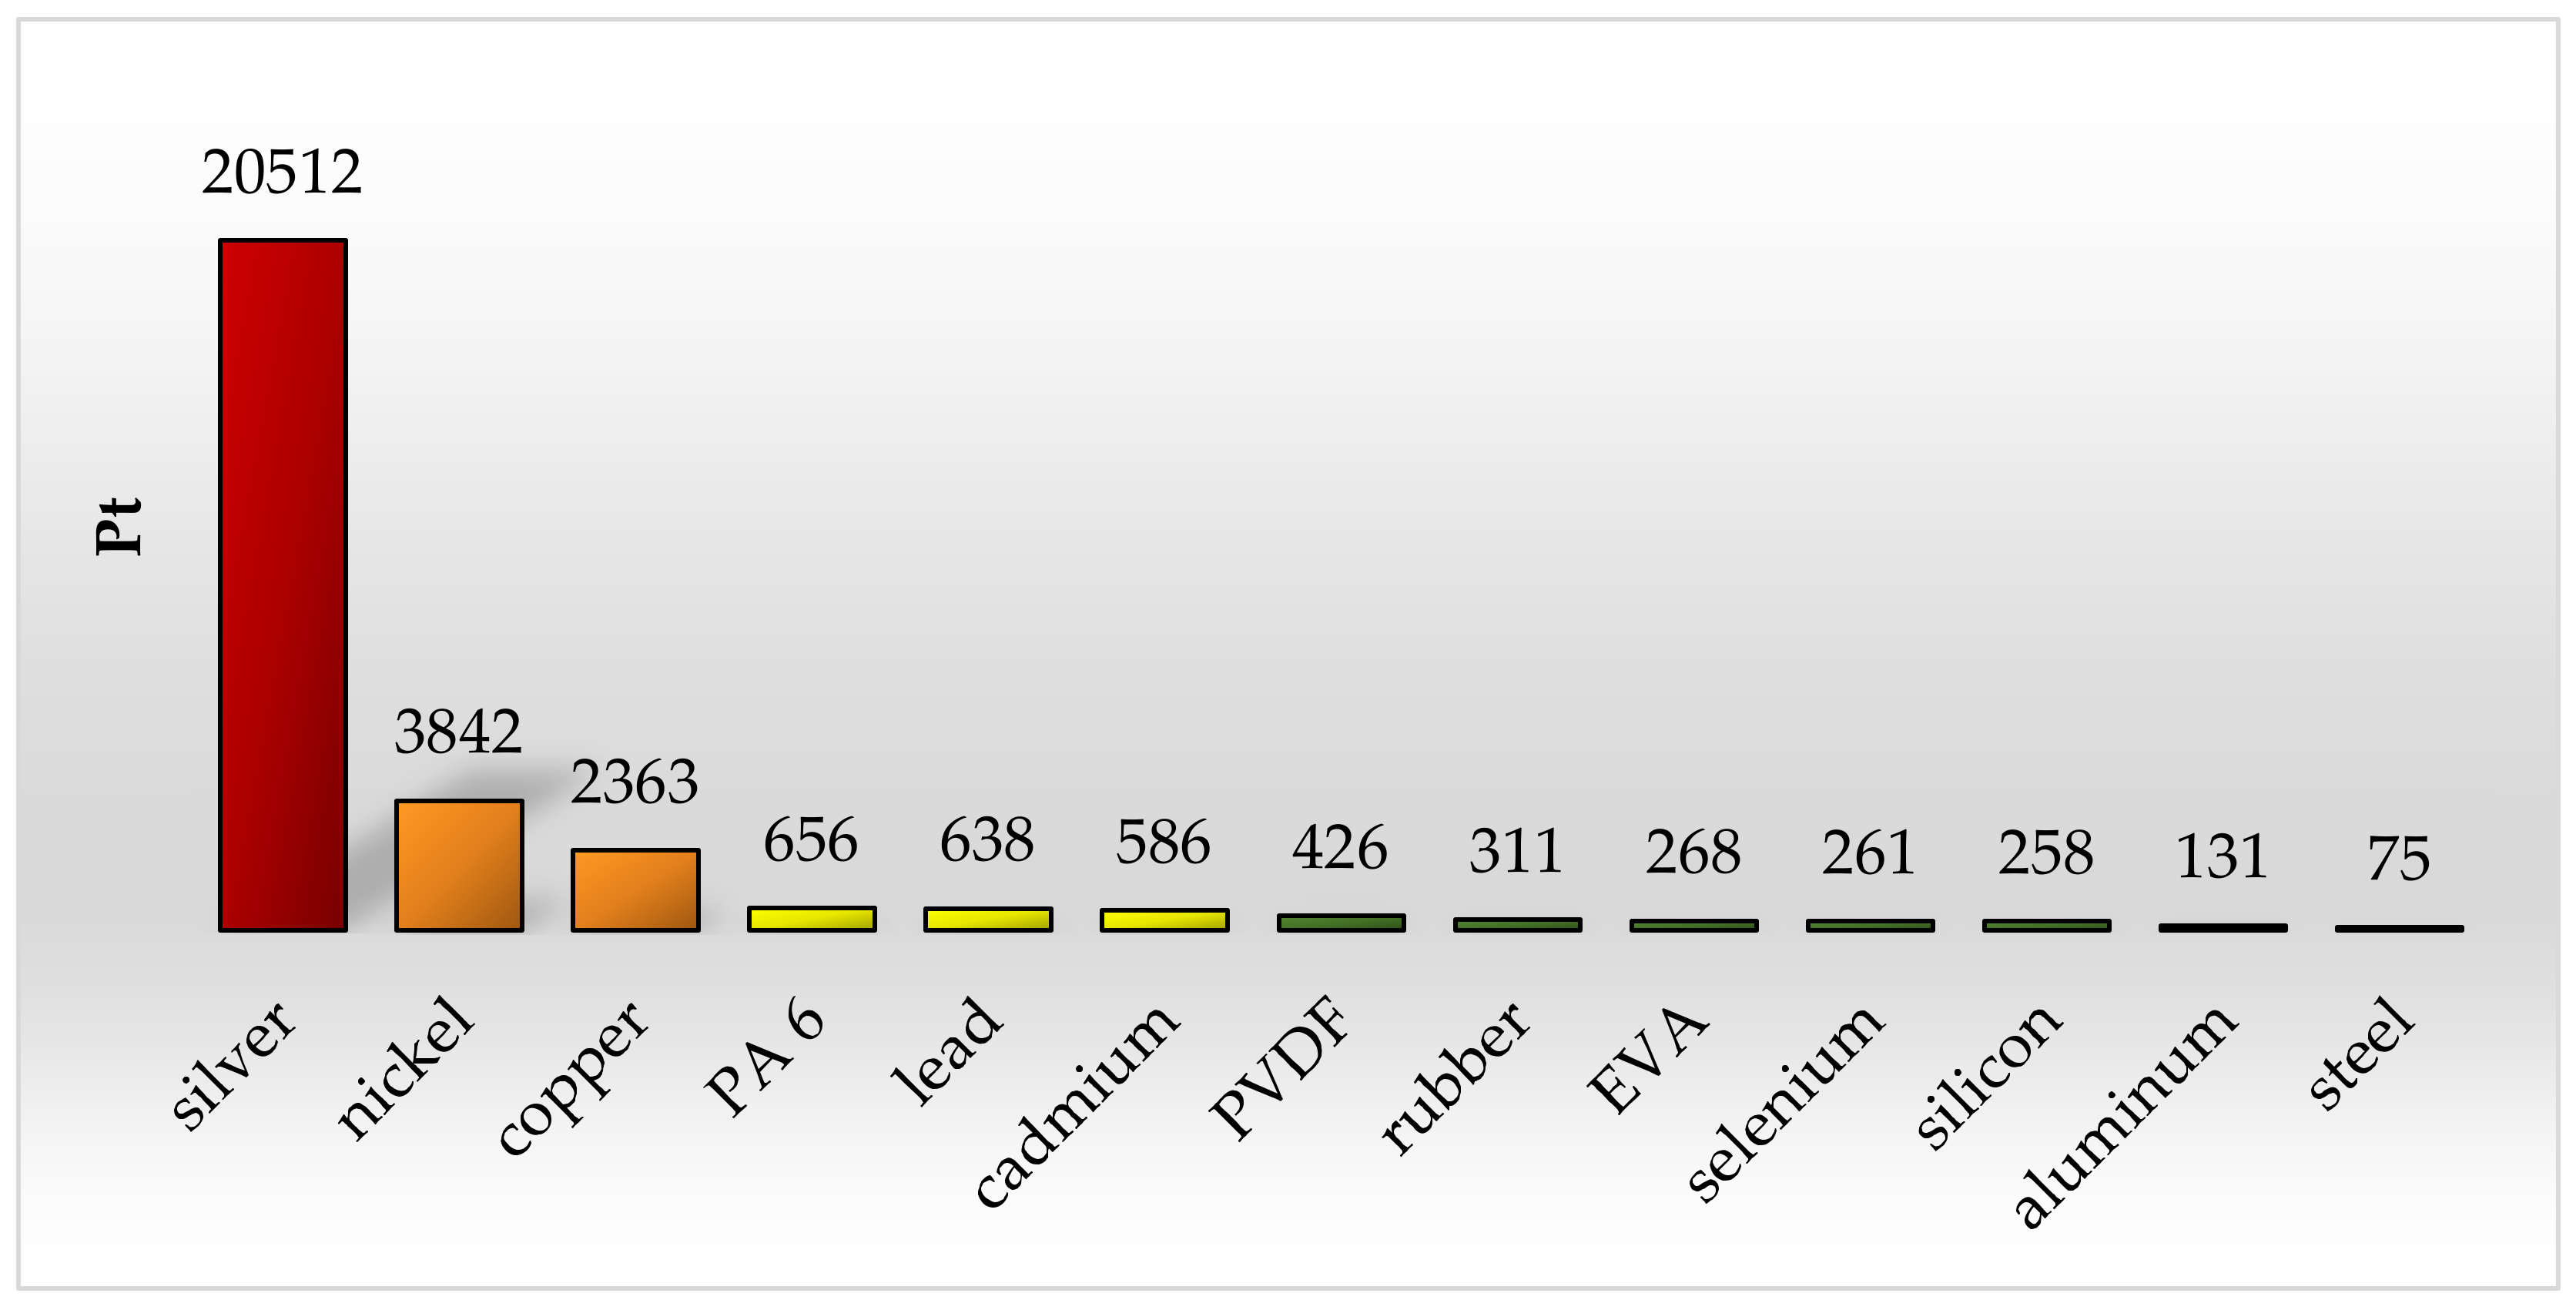
Figure 9.
Results of grouping and weighting environmental consequences arising as a result of generating 20,000 MWh of electricity from selected energy sources [unit: Pt].
Figure 9.
Results of grouping and weighting environmental consequences arising as a result of generating 20,000 MWh of electricity from selected energy sources [unit: Pt].
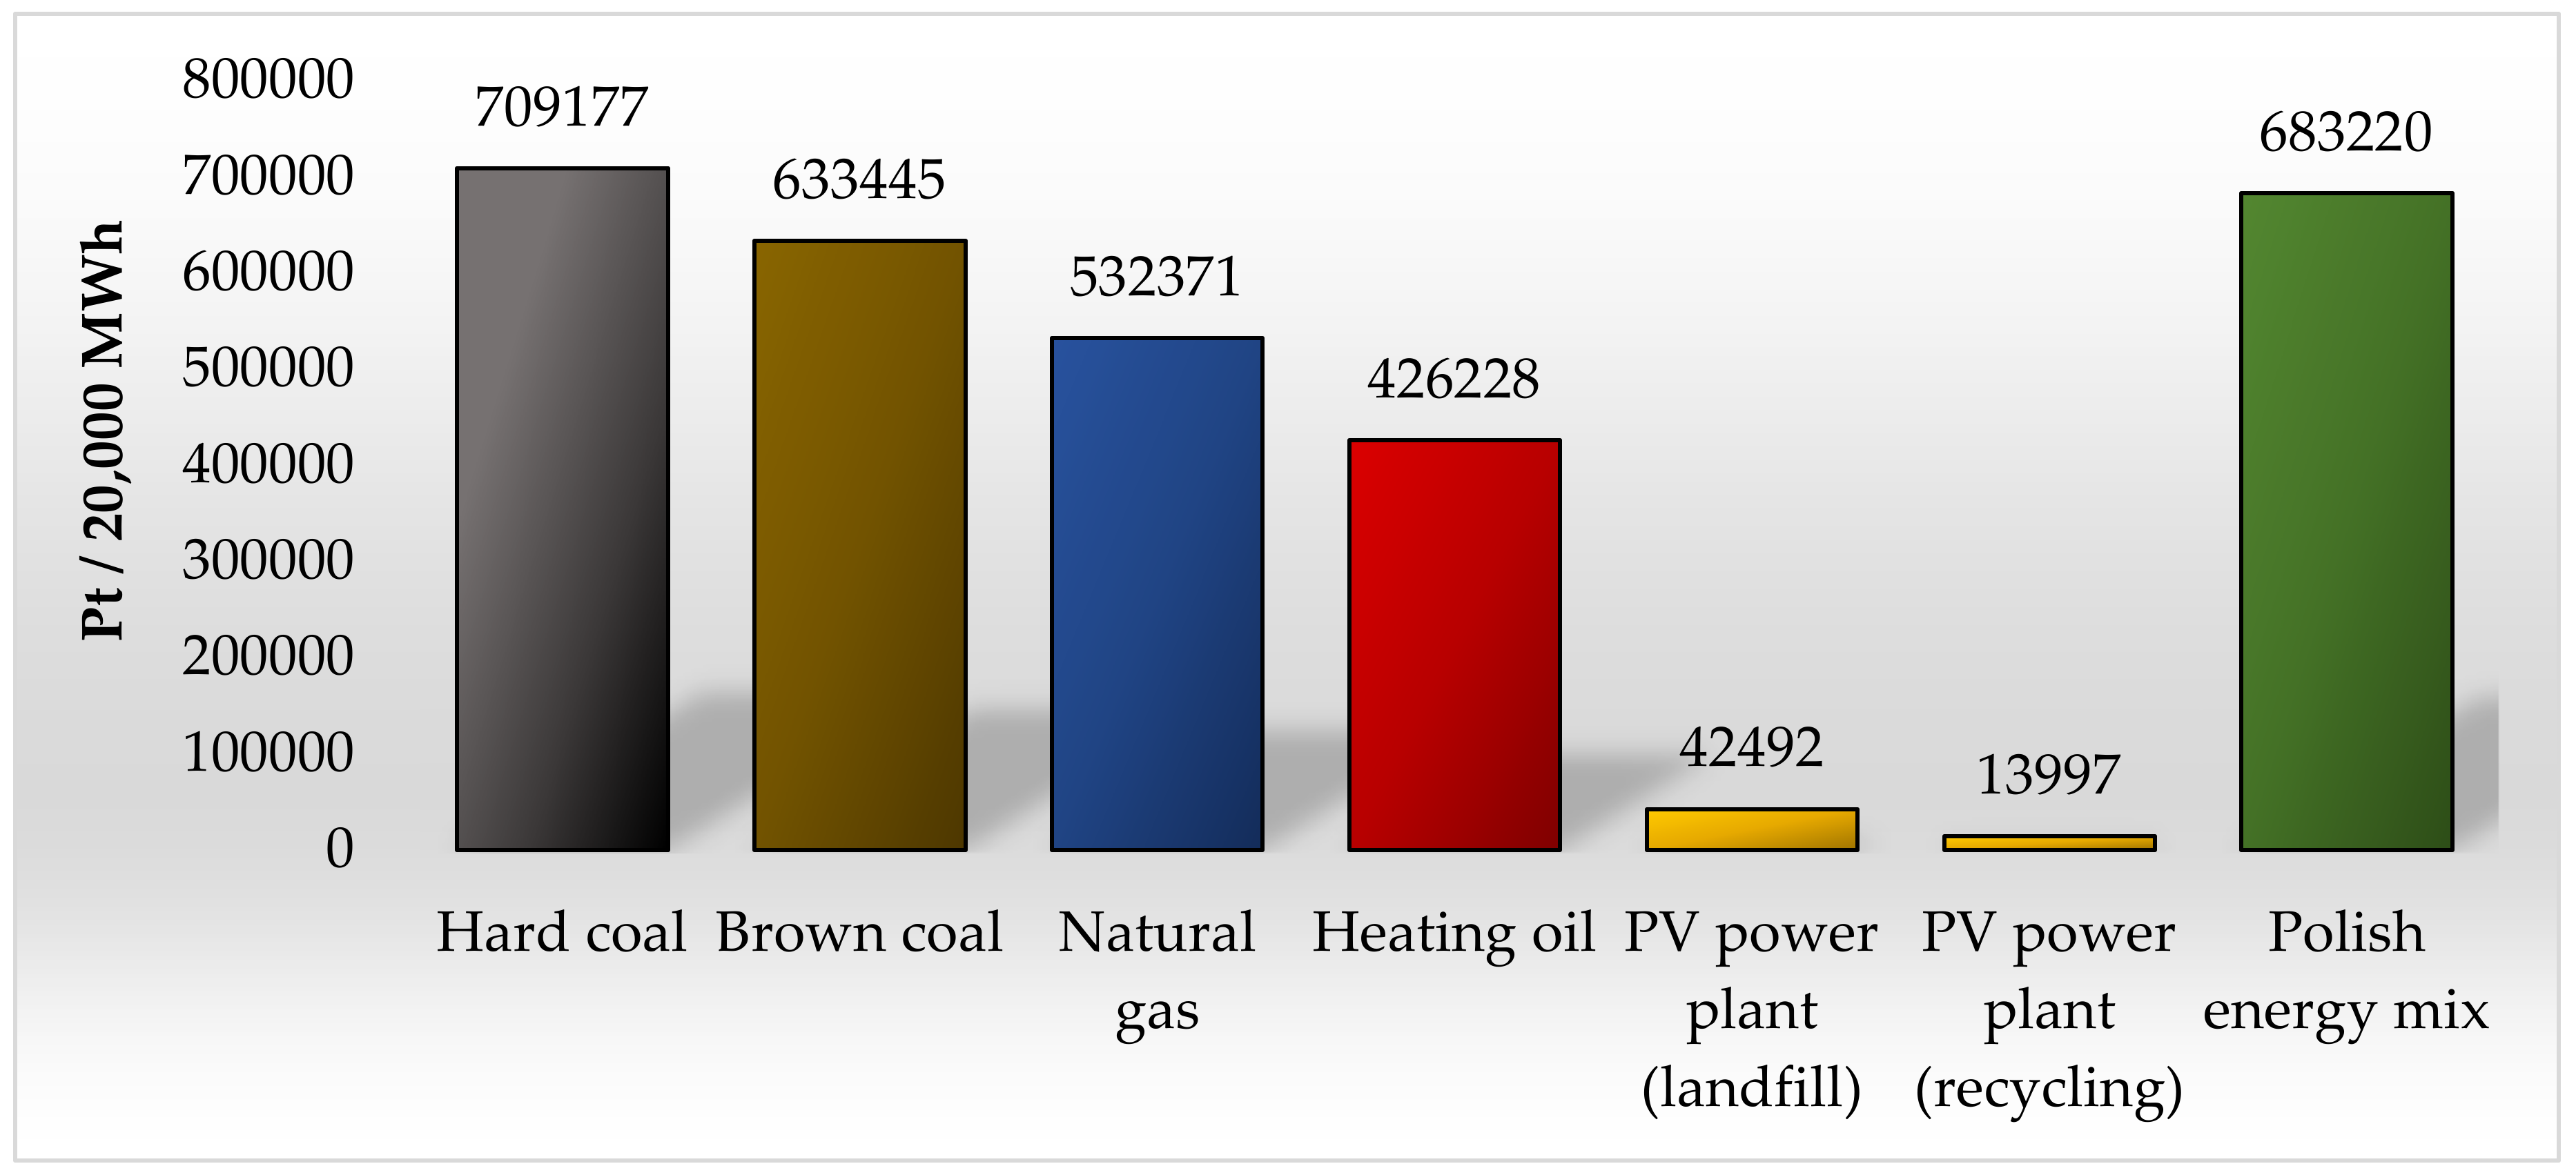
Figure 10.
The results of the characterization of the environmental after-effects in relation to cumulated greenhouse gas (GHG) emissions arising from the production of 20,000 MWh of electricity from selected energy sources [unit: Pt].
Figure 10.
The results of the characterization of the environmental after-effects in relation to cumulated greenhouse gas (GHG) emissions arising from the production of 20,000 MWh of electricity from selected energy sources [unit: Pt].

Table 1.
Energy consumption over the centuries per person per day [7].
Table 1.
Energy consumption over the centuries per person per day [7].
| Key Event | Historical Period | Approximate Amount of Energy Consumed by One Person [MJ/day] |
|---|---|---|
| Prehistoric man (food energy) | Up to 5000 years B.C. | 9–10 |
| Man after controlling the fire | Approximately 5000 years B.C. | 20 |
| Man after using animals for work | About 3000 years B.C. | 50 |
| Man after a technical revolution | End of the 17th century | 200 |
| Modern man | XXI century | 300–1000 |
Table 2.
Results of characterization of environmental consequences, occurring in the life cycle of selected groups of 1 megawatt photovoltaic power plant.
Table 2.
Results of characterization of environmental consequences, occurring in the life cycle of selected groups of 1 megawatt photovoltaic power plant.
| Impact Category | Photovoltaic Panels | Supporting Structures | Inverter Station | Electrical Installations | Unit | ||||
|---|---|---|---|---|---|---|---|---|---|
| Landfill | Recycling | Landfill | Recycling | Landfill | Recycling | Landfill | Recycling | ||
| Carcinogens | 0.07 | -0.01 | 0.03 | 0.00 | 0.02 | 0.00 | 0.00 | 0.00 | DALY |
| Resp. organics | 0.00 | 0.00 | 0.00 | 0.00 | 0.00 | 0.00 | 0.00 | 0.00 | DALY |
| Resp. inorganics | 0.22 | -0.03 | 0.02 | 0.01 | 0.14 | 0.10 | 0.05 | 0.05 | DALY |
| Climate change | 0.05 | -0.03 | 0.01 | 0.00 | 0.02 | 0.00 | 0.00 | 0.00 | DALY |
| Radiation | 0.00 | 0.00 | 0.00 | 0.00 | 0.00 | 0.00 | 0.00 | 0.00 | DALY |
| Ozone layer | 0.00 | 0.00 | 0.00 | 0.00 | 0.00 | 0.00 | 0.00 | 0.00 | DALY |
| Ecotoxicity | 137,741 | -5015 | 106,619 | 48,706 | 60,968 | 21,959 | 4326 | 309 | PAF·m2/a |
| Acidification/ eutrophication | 6650 | 1234 | 546 | 236 | 4412 | 3517 | 1179 | 1138 | PDF·m2/a |
| Land use | 3605 | 3458 | 657 | 610 | 4521 | 4485 | 1189 | 1185 | PDF·m2/a |
| Minerals | 68,116 | -573 | 1692 | 8 | 10,203 | -645 | 322,646 | 322,644 | MJ |
| Fossil fuels | 400,584 | 32,805 | 25,454 | 13,088 | 79,294 | 24,498 | 24,074 | 22,009 | MJ |
Table 3.
Results of grouping and weighting environmental consequences, occurring in the cycle of existence of selected groups of 1 megawatt photovoltaic power plant [unit: Pt].
Table 3.
Results of grouping and weighting environmental consequences, occurring in the cycle of existence of selected groups of 1 megawatt photovoltaic power plant [unit: Pt].
| Impact Category | Photovoltaic Panels | Supporting Structures | Inverter Station | Electrical Installations | |||||||
|---|---|---|---|---|---|---|---|---|---|---|---|
| Landfill | Recycling | Landfill | Recycling | Landfill | Recycling | Landfill | Recycling | ||||
| Carcinogens | 1822 | -359 | 827 | 79 | 557 | 68 | 53 | 1 | |||
| Resp. organics | 7 | -8 | 1 | 1 | 4 | 2 | 0 | 0 | |||
| Resp. inorganics | 5729 | -667 | 431 | 219 | 3725 | 2703 | 1327 | 1299 | |||
| Climate change | 1431 | -810 | 358 | 25 | 502 | 63 | 96 | 88 | |||
| Radiation | 10 | 9 | 8 | 8 | 12 | 12 | 0 | 0 | |||
| Ozone layer | 1 | -2 | 0 | 0 | 0 | 0 | 0 | 0 | |||
| Ecotoxicity | 1074 | -39 | 832 | 380 | 476 | 171 | 34 | 2 | |||
| Acidification/ eutrophication | 519 | 96 | 43 | 18 | 344 | 274 | 92 | 89 | |||
| Land use | 281 | 270 | 51 | 48 | 353 | 350 | 93 | 92 | |||
| Minerals | 1621 | -14 | 40 | 0 | 243 | -15 | 7679 | 7678 | |||
| Fossil fuels | 9534 | 781 | 606 | 311 | 1887 | 583 | 573 | 524 | |||
| Total | 22029 | -743 | 3197 | 1089 | 8103 | 4210 | 9947 | 9774 | |||
Table 4.
Results of grouping and weighting environmental after-effects for carcinogenic compounds present in the 1 megawatt photovoltaic power plant [unit: Pt].
Table 4.
Results of grouping and weighting environmental after-effects for carcinogenic compounds present in the 1 megawatt photovoltaic power plant [unit: Pt].
| Carcinogens | Production | Exploitation | Landfill | Recycling |
|---|---|---|---|---|
| Cadmium, ion | 22.98 | 0.21 | 2547.83 | -19.67 |
| Arsenic, ion | 363.28 | 2.44 | 104.07 | -514.43 |
| Cadmium | 68.65 | 0.31 | 0.87 | -48.94 |
| Metals, unspecified | 43.84 | 0.00 | 0.00 | -147.56 |
| PAH, polycyclic aromatic hydrocarbons | 10.27 | 0.00 | 0.00 | -57.76 |
| Particulates, < 2.5 µm | 13.06 | 0.03 | 0.32 | 0.00 |
| Metallic ions, unspecified | 6.58 | 0.00 | 0.00 | -36.10 |
| Arsenic | 9.48 | 0.03 | 0.16 | 0.00 |
| Total | 538.14 | 3.02 | 2653.26 | -824.46 |
Table 5.
Results of grouping and weighting of environmental after-effects for organic compounds causing respiratory diseases, occurring in the 1 megawatt photovoltaic power plant [unit: Pt].
Table 5.
Results of grouping and weighting of environmental after-effects for organic compounds causing respiratory diseases, occurring in the 1 megawatt photovoltaic power plant [unit: Pt].
| Resp. Organics | Production | Exploitation | Landfill | Recycling |
|---|---|---|---|---|
| NMVOC, non-methane volatile organic compounds | 10.08 | 0.00 | 0.11 | -16.69 |
| Methane, biogenic | 0.01 | 0.00 | 0.59 | 0.00 |
| Hydrocarbons, unspecified | 0.32 | 0.00 | 0.00 | 0.00 |
| Methane, fossil | 0.20 | 0.00 | 0.03 | 0.00 |
| Methane | 0.16 | 0.00 | 0.00 | -0.31 |
| Ethane | 0.20 | 0.00 | 0.00 | 0.00 |
| Hydrocarbons, aromatic | 0.03 | 0.00 | 0.00 | -0.11 |
| Pentane | 0.03 | 0.00 | 0.00 | 0.00 |
| Propane | 0.02 | 0.00 | 0.00 | 0.00 |
| PAH, polycyclic aromatic hydrocarbons | 0.02 | 0.00 | 0.00 | -0.09 |
| Total | 11.10 | 0.00 | 0.73 | -17.21 |
Table 6.
Results of grouping and weighting of environmental after-effects for inorganic compounds causing respiratory diseases, occurring in the 1 megawatt photovoltaic power plant [unit: Pt].
Table 6.
Results of grouping and weighting of environmental after-effects for inorganic compounds causing respiratory diseases, occurring in the 1 megawatt photovoltaic power plant [unit: Pt].
| Resp. Inorganics | Production | Exploitation | Landfill | Recycling |
|---|---|---|---|---|
| Sulfur dioxide | 3193.91 | 3.42 | 7.30 | 0.00 |
| Nitrogen oxides | 3090.90 | 2.35 | 37.28 | -1627.29 |
| Sulfur oxides | 1453.19 | 2.01 | 0.00 | -3273.87 |
| Particulates, > 2.5 µm, and < 10 µm | 1214.04 | 0.21 | 3.14 | 0.00 |
| Particulates | 531.42 | 0.03 | 0.00 | -2520.56 |
| Particulates, < 2.5 µm | 1023.94 | 2.53 | 23.95 | 0.00 |
| Ammonia | 196.78 | 0.00 | 0.39 | -1.18 |
| Particulates, < 10 µm (stationary) | 82.79 | 0.06 | 0.00 | 0.00 |
| Nitrogen dioxide | 27.70 | 0.00 | 0.00 | 0.00 |
| Particulates, < 10 µm (mobile) | 22.70 | 0.00 | 0.00 | 0.00 |
| Total | 10837.39 | 10.61 | 72.07 | -7422.90 |
Table 7.
Results of grouping and weighting of environmental after-effects for compounds causing climate change, occurring in the 1 megawatt photovoltaic power plant [unit: Pt].
Table 7.
Results of grouping and weighting of environmental after-effects for compounds causing climate change, occurring in the 1 megawatt photovoltaic power plant [unit: Pt].
| Climate Change | Production | Exploitation | Landfill | Recycling |
|---|---|---|---|---|
| Carbon dioxide | 890.86 | 0.30 | 0.00 | -1946.84 |
| Carbon dioxide, fossil | 878.77 | 2.89 | 13.97 | 0.00 |
| Methane, biogenic | 2.03 | 0.00 | 201.40 | 0.00 |
| Tetrafluoromethane, CFC-14 | 122.12 | 0.00 | 0.00 | -606.04 |
| Methane, tetrafluoro-, CFC-14 | 40.81 | 0.03 | 65.20 | 0.00 |
| Carbon dioxide, biogenic | 67.46 | 0.15 | 10.73 | 0.00 |
| Methane, fossil | 54.93 | 0.01 | 0.00 | -107.33 |
| Methane | 22.61 | 0.00 | 0.67 | 0.00 |
| Carbon monoxide | 13.47 | 0.00 | 0.00 | -25.05 |
| Carbon dioxide, in air | -44.27 | -0.04 | -0.08 | 0.00 |
| Total | 2048.80 | 3.35 | 291.90 | -2685.26 |
Table 8.
Results of grouping and weighting of environmental after-effects for radioactive compounds, occurring in the 1 megawatt photovoltaic power plant [unit: Pt].
Table 8.
Results of grouping and weighting of environmental after-effects for radioactive compounds, occurring in the 1 megawatt photovoltaic power plant [unit: Pt].
| Radiation | Production | Exploitation | Landfill | Recycling |
|---|---|---|---|---|
| 222 Radon | 20.95 | 0.02 | 0.42 | 0.00 |
| 14 Carbon | 6.52 | 0.00 | 0.22 | 0.00 |
| 137 Cesium | 0.56 | 0.00 | 0.00 | 0.00 |
| 60 Cobalt | 0.07 | 0.00 | 0.00 | 0.00 |
| 134 Cesium | 0.05 | 0.00 | 0.00 | 0.00 |
| 85 Krypton | 0.04 | 0.00 | 0.00 | 0.00 |
| Total | 28.19 | 0.02 | 0.64 | 0.00 |
Table 9.
Results of grouping and weighting of environmental after-effects for ozone-increasing compounds, occurring in the 1 megawatt photovoltaic power plant [unit: Pt].
Table 9.
Results of grouping and weighting of environmental after-effects for ozone-increasing compounds, occurring in the 1 megawatt photovoltaic power plant [unit: Pt].
| Ozone Layer | Production | Exploitation | Landfill | Recycling |
|---|---|---|---|---|
| Methane, bromotrifluoro-, Halon 1301 | 1.48 | 0.00 | 0.01 | -1.17 |
| Methane, bromochlorodifluoro-, Halon 1211 | 0.30 | 0.00 | 0.00 | 0.00 |
| Methane, tetrachloro-, CFC-10 | 0.15 | 0.00 | 0.00 | 0.00 |
| Ethane, 1,2-dichloro-1,1,2,2-tetrafluoro-, CFC-114 | 0.06 | 0.00 | 0.00 | 0.00 |
| Methane, chlorodifluoro-, HCFC-22 | 0.03 | 0.00 | 0.00 | 0.00 |
| Total | 2.03 | 0.00 | 0.01 | -4.17 |
Table 10.
Results of grouping and weighting of environmental after-effects for ecotoxic compounds, occurring in the 1 megawatt photovoltaic power plant [unit: Pt].
Table 10.
Results of grouping and weighting of environmental after-effects for ecotoxic compounds, occurring in the 1 megawatt photovoltaic power plant [unit: Pt].
| Ecotoxicity | Production | Exploitation | Landfill | Recycling |
|---|---|---|---|---|
| Copper, ion | 7.91 | 0.05 | 1199.53 | -8.44 |
| Zinc | 263.02 | 0.36 | 1.04 | -20.11 |
| Nickel | 280.00 | 0.04 | 0.51 | -211.57 |
| Zinc, ion | 0.40 | 0.00 | 120.31 | 0.00 |
| Nickel, ion | 16.93 | 0.05 | 102.76 | -8.33 |
| Chromium | 128.99 | 0.02 | 1.37 | -7.28 |
| Lead | 61.60 | 0.04 | 26.34 | 30.08 |
| Cadmium, ion | 0.10 | 0.00 | 51.01 | 0.00 |
| Metals, unspecified | 40.87 | 0.00 | 0.00 | -161.86 |
| Copper | 20.32 | 0.03 | 0.17 | 1.21 |
| Cadmium | 12.54 | 0.07 | 0.00 | -10.48 |
| Total | 836.87 | 0.67 | 1503.04 | -396.76 |
Table 11.
Results of grouping and weighting of environmental after-effects for acidifying/ eutrophication compounds, occurring in the life cycle of 1 megawatt photovoltaic power plant [unit: Pt].
Table 11.
Results of grouping and weighting of environmental after-effects for acidifying/ eutrophication compounds, occurring in the life cycle of 1 megawatt photovoltaic power plant [unit: Pt].
| Acidification/Eutrophication | Production | Exploitation | Landfill | Recycling |
|---|---|---|---|---|
| Nitrogen oxide | 596.32 | 0.45 | 7.19 | -313.95 |
| Sulfur dioxide | 182.40 | 0.20 | 0.42 | 0.00 |
| Ammonia | 107.97 | 0.00 | 0.22 | -0.65 |
| Sulfur oxides | 82.99 | 0.11 | 0.00 | -186.97 |
| Nitrogen dioxide | 5.34 | 0.00 | 0.00 | 0.00 |
| Total | 975.03 | 0.77 | 7.83 | -501.57 |
Table 12.
Results of grouping and weighting of after-effects of environmental land use processes, occurring in the 1 megawatt photovoltaic power plant [unit: Pt].
Table 12.
Results of grouping and weighting of after-effects of environmental land use processes, occurring in the 1 megawatt photovoltaic power plant [unit: Pt].
| Land Use | Production | Exploitation | Landfill | Recycling |
|---|---|---|---|---|
| Transformation, to mineral extraction site | 338.36 | 0.04 | 13.77 | 0.00 |
| Occupation, dump site | 275.99 | 0.07 | 13.15 | 0.00 |
| Transformation, to arable, non-irrigated | 221.31 | 0.02 | 0.45 | 0.00 |
| Transformation, to unknown | 142.92 | -0.09 | 0.01 | 0.00 |
| Transformation, to urban, continuously built | 118.14 | 0.00 | 0.00 | 0.00 |
| Occupation, mineral extraction site | 111.45 | 0.02 | 4.14 | 0.00 |
| Transformation, to dump site | 63.54 | 0.02 | 0.03 | 0.00 |
| Transformation, to industrial area | 59.30 | 0.03 | 0.02 | 0.00 |
| Transformation, to water bodies, artificial | 47.46 | 0.01 | 3.16 | 0.00 |
| Land use II-III | 47.27 | 0.09 | 0.00 | 0.00 |
| Occupation, forest, intensive, normal | 41.16 | 0.10 | 0.10 | 0.00 |
| Total | 1550.96 | 0.37 | 64.41 | 0.00 |
Table 13.
Results of grouping and weighting of after-effects of environmental processes related to mineral extraction, occurring in the 1 megawatt photovoltaic power plant [unit: Pt].
Table 13.
Results of grouping and weighting of after-effects of environmental processes related to mineral extraction, occurring in the 1 megawatt photovoltaic power plant [unit: Pt].
| Minerals | Production | Exploitation | Landfill | Recycling |
|---|---|---|---|---|
| Tin, in ground | 6609.87 | 0.00 | 0.00 | 0.00 |
| Copper, in ground | 2230.23 | 8.73 | 0.00 | 0.00 |
| Bauxite, in ground | 367.14 | 0.00 | 0.00 | -1834.86 |
| Nickel, in ground | 70.80 | 0.00 | 0.00 | 0.00 |
| Nickel, 1.13% in sulfide, Ni 0.76% and Cu 0.76% in crude ore, in ground | 68.90 | 0.00 | 0.00 | 0.00 |
| Iron, in ground | 50.70 | 0.00 | 0.00 | -53.67 |
| Nickel, 1.98% in silicates, 1.04% in crude ore, in ground | 18.46 | 0.00 | 1.13 | 0.00 |
| Total | 9452.86 | 8.73 | 1.15 | -1888.53 |
Table 14.
Results of grouping and weighting of after-effects of environmental processes related to the extraction of fossil fuels, occurring in the 1 megawatt photovoltaic power plant [unit: Pt].
Table 14.
Results of grouping and weighting of after-effects of environmental processes related to the extraction of fossil fuels, occurring in the 1 megawatt photovoltaic power plant [unit: Pt].
| Fossil Fuels | Production | Exploitation | Landfill | Recycling |
|---|---|---|---|---|
| Gas, natural, in ground | 5508.88 | 0.64 | 21.28 | 0.00 |
| Oil, crude, in ground | 2365.64 | 0.62 | 114.85 | 0.00 |
| Oil, crude, 42.6 MJ per kg, in ground | 2166.59 | 0.96 | 0.00 | -7794.46 |
| Gas, natural, 36.6 MJ per m3, in ground | 822.65 | 0.00 | 0.00 | -1476.15 |
| Oil, crude, 42.7 MJ per kg, in ground | 660.69 | 0.09 | 0.00 | 0.00 |
| Coal, 18 MJ per kg, in ground | 204.68 | 0.03 | 0.00 | -346.74 |
| Gas, natural, 30.3 MJ per kg, in ground | 170.19 | 0.07 | 0.00 | 0.00 |
| Gas, natural, 35 MJ per m3, in ground | 140.89 | 0.72 | 0.00 | -244.92 |
| Oil, crude, 41 MJ per kg, in ground | 65.70 | 0.00 | 0.00 | -232.32 |
| Total | 12158.95 | 3.88 | 136.56 | -10094.60 |
Table 15.
Results of the characterization of environmental consequences arising as a result of the generation of 20,000 MWh of electricity from selected energy sources.
Table 15.
Results of the characterization of environmental consequences arising as a result of the generation of 20,000 MWh of electricity from selected energy sources.
| Impact Category | PV Power Plant (Recycling) | PV Power Plant (Landfill) | Hard Coal | Brown Coal | Natural Gas | Heating Oil | Polish Energy Mix | Unit |
|---|---|---|---|---|---|---|---|---|
| Carcinogens | 0 | 0 | 5 | 4 | 0 | 0 | 4 | DALY |
| Resp. organics | 0 | 0 | 0 | 0 | 0 | 0 | 0 | DALY |
| Resp. inorganics | 0 | 0 | 13 | 14 | 11 | 5 | 12 | DALY |
| Climate change | 0 | 0 | 5 | 5 | 6 | 1 | 5 | DALY |
| Radiation | 0 | 0 | 0 | 0 | 0 | 0 | 0 | DALY |
| Ozone layer | 0 | 0 | 0 | 0 | 0 | 0 | 0 | DALY |
| Ecotoxicity | 58,446 | 303,071 | 717,677 | 2671,933 | 218,750 | 0 | 1463,288 | PAF·m2/a |
| Acidification/Eutrophication | 6092 | 12,623 | 335,746 | 284,690 | 174,296 | 163,673 | 300,669 | PDF·m2/a |
| Land use | 8751 | 8984 | 192,997 | 32,729 | 90,967 | 0 | 128,362 | PDF·m2/a |
| Minerals | 319,481 | 398,914 | 33,221 | 18,763 | 19,079 | 0 | 28,350 | MJ |
| Fossil fuels | 92,339 | 520,697 | 3634,140 | 307,570 | 2097,723 | 10360,976 | 3844,863 | MJ |
Table 16.
Results of grouping and weighting of environmental consequences arising as a result of generating 20,000 MWh of electricity from selected energy sources [unit: Pt].
Table 16.
Results of grouping and weighting of environmental consequences arising as a result of generating 20,000 MWh of electricity from selected energy sources [unit: Pt].
| Impact Category | PV Power Plant (Recycling) | PV Power Plant (Landfill) | Hard Coal | Brown Coal | Natural Gas | Heating Oil | Polish Energy Mix |
|---|---|---|---|---|---|---|---|
| Carcinogens | −249 | 3230 | 123768 | 102,354 | 8331 | 0 | 104,557 |
| Resp. organics | −6 | 12 | 62 | 24 | 1265 | 406 | 69 |
| Resp. inorganics | 3437 | 10,932 | 327,703 | 356,043 | 286,288 | 130,653 | 321,832 |
| Climate change | −627 | 2351 | 123,308 | 121,536 | 163,556 | 35,811 | 119,398 |
| Radiation | 28 | 29 | 210 | 121 | 142 | 0 | 297 |
| Ozone layer | −2 | 2 | 2 | 1 | 13 | 0 | 5 |
| Ecotoxicity | 456 | 2364 | 5598 | 20,841 | 1706 | 0 | 11,414 |
| Acidification/ eutrophication | 475 | 985 | 26,188 | 22,206 | 13,595 | 12,766 | 23,452 |
| Land use | 683 | 701 | 15,054 | 2553 | 7095 | 0 | 10,012 |
| Minerals | 7604 | 9494 | 791 | 447 | 454 | 0 | 675 |
| Fossil fuels | 2198 | 12,393 | 86,493 | 7320 | 49,926 | 246,591 | 91,508 |
| Total | 13,997 | 42,492 | 709,177 | 633,445 | 532,371 | 426,228 | 683,220 |
© 2020 by the authors. Licensee MDPI, Basel, Switzerland. This article is an open access article distributed under the terms and conditions of the Creative Commons Attribution (CC BY) license (http://creativecommons.org/licenses/by/4.0/).
Share and Cite
MDPI and ACS Style
Piasecka, I.; Bałdowska-Witos, P.; Piotrowska, K.; Tomporowski, A. Eco-Energetical Life Cycle Assessment of Materials and Components of Photovoltaic Power Plant. Energies 2020, 13, 1385. https://doi.org/10.3390/en13061385
AMA Style
Piasecka I, Bałdowska-Witos P, Piotrowska K, Tomporowski A. Eco-Energetical Life Cycle Assessment of Materials and Components of Photovoltaic Power Plant. Energies. 2020; 13(6):1385. https://doi.org/10.3390/en13061385
Chicago/Turabian StylePiasecka, Izabela, Patrycja Bałdowska-Witos, Katarzyna Piotrowska, and Andrzej Tomporowski. 2020. "Eco-Energetical Life Cycle Assessment of Materials and Components of Photovoltaic Power Plant" Energies 13, no. 6: 1385. https://doi.org/10.3390/en13061385
Note that from the first issue of 2016, this journal uses article numbers instead of page numbers. See further details here.