Article

Impurity Effects on the Mechanical Properties and Permeability Characteristics of Salt Rock

1
College of Water Resource and Hydropower, Sichuan University, Chengdu 610065, China
2
Institute of Rock and Soil Mechanics, Chinese Academy of Sciences, State Key Experiments in Geotechnical Mechanics and Engineering, Wuhan 430071, China
3
Sichuan Water Resources and Hydroelectric Investigation and Design Institute of the Ministry, Chengdu 610072, China
*
Author to whom correspondence should be addressed.
Energies 2020, 13(6), 1366; https://doi.org/10.3390/en13061366
Submission received: 24 February 2020 / Revised: 10 March 2020 / Accepted: 12 March 2020 / Published: 15 March 2020

Abstract

:
Impure salt rock strata are extensively distributed in China, giving them great significance in the study of the physical properties of impure salt rock for the construction of underground gas storage in salt mines. To investigate the confining pressure and impurity effects on the mechanical properties and gas permeability characteristics of salt rock, permeability tests under hydrostatic confining pressure and conventional triaxial compression (CTC), on salt rock samples with different impurity contents, were carried out. The results demonstrate that the confining pressure effects cause an increase in triaxial compression strength, but a decrease in permeability. However, impurity enhances the bearing capacity and permeability of the salt rock; both rock strength and permeability increase with an increase in impurity content. Moreover, the broken salt rock specimens were analyzed after the CTC test using Computed Tomography (CT) equipment. To understand the relationships between pore volume and permeability, considering the confining pressure and impurity effects, the cracks were divided into four groups according to different crack diameter ranges: ~0.05 mm, 0.05–1 mm, 1–10 mm and ~10 mm. The CT analysis results show that while the pore volume of smaller cracks shows an “increasing–decreasing” trend by increasing confining pressure, the pore volume of large cracks gradually decreases, indicating that the rock permeability is highly related to macro-cracks. However, impurity has more complicated implications on rock permeability and cracks, and needs further investigation.

Graphical Abstract

1. Introduction

Due to its excellent self-healing ability, low permeability and good long-term creep behavior, salt rock has been recognized as an ideal medium for underground energy storage and nuclear waste disposal [1,2,3]. While the main composition of pure salt rock is sodium chloride, the composition of impure salt rock is more complicated. For instance, common impurities like anhydrite, glauberite and clay. Salt is deposited as bedded salt, which can transform into domal structures over geological time scales, due to gravity differences between the salt and the overburden. Since various sedimentary cycles usually exist underground, different impure salt layers are formed, ranging from carbonate to high-soluble potash salt. The thickness of the various layers can vary from several meters to hundreds of meters, corresponding to the position in the basin. In some basins, e.g., in North America, the Gulf of Mexico and the Central European basin, huge salt rock domes, or relatively homogeneous bedded salt rock layers with high purity, are widely distributed underground, making it easier to obtain reliable parameters for the salt rock, such as compressive strength, tensile strength, elastic modulus, etc. [4,5,6,7,8].
Many experiments have been conducted to investigate the short-term mechanical properties, long-term creep behavior and gas sealing capacity of pure salt rock, indicating that salt rock is a typical type of soft rock with low strength and permeability [9,10,11,12,13,14]. Underground energy storage in pure salt rock has been proven to be highly feasible, according to extensive experimental results and existing salt cavern construction, which is of great importance for the large demands of the national energy reserves for China. However, the internal structure and chemical composition of impure salt rock are more complicated, problematizing the assessment of using impure salt caverns for energy storage. In the Palo Duro Basin, Texas, the impure salt rock is composed of halite, mudstone, clay and anhydrite [15,16] Hansen et al. [16] found that while anhydrite causes a significant decrease in the steady-state strain rate and the amount of total axial strain, halite and clay have little influence on the long-term creep behavior, which is noticeably different from that of pure salt rock. Bruno [17] conducted a comprehensive study on the geological structures and mechanical properties of bedded salt rock in some basins of America. According to the field observations, salt evaporates and transforms in sedimentary basins, forming salt layers; the thinnest layer observed in those basins was only 50 m thick. Further, a series of experiments was conducted to investigate the mechanical properties of impure salt rock. These experiments determined that the mechanical parameters of these interlayers are somewhat different. The uniaxial compression strength (UCS) ranged from 11.2 MPa (clay) to 148.1 MPa (anhydrite), and the tensile strength ranged from 2.4 MPa (clay) to 15 MPa (dolomite). However, as the composition and distribution of salt rock are more complicated in China, the research results obtained in the aforementioned studies are not appropriate for underground gas storage construction in China.
China’s initiatives in recent years have sought to increase Underground Gas Storage capacity (e.g., by constructing gas caverns at appropriate geological sites). Chinese researchers have launched large-scale investigations into some locations where salt rock layers may potentially exist, such as the Huai’an salt mine in Jiangsu province, the Anning salt mine in Yunnan Province and the Qianjiang salt mine in Hubei province [18,19,20]. In-situ surveying results revealed that the salt rock in China is mainly composed of bedded salt rock with a high content of impurities, thin layers and interlayers. Therefore, more attention should be paid to the impurity effects on the mechanical properties and permeability of salt rock. Previous studies have revealed that the engineering properties of salt rocks are different, featuring different impurity compositions, impurity contents, interlayer thicknesses and interlayer distributions [21,22,23,24]. Moreover, systematic investigations on the uniaxial strength of impure salt rock from different locations in China were conducted by Zong [25], who proposed that impurity content is a vital factor that influences the mechanical properties of impure salt rock. Since pure salt caverns are mainly utilized for compressed air energy storage, inhomogeneities in the salt anhydrite and clay layers may result in increased permeability. However, little research has been conducted on the permeability characteristics of salt rock with different impurity contents [26,27,28]. Therefore, a larger and more detailed study must be conducted to fully understand the impurity effects on the mechanical properties and permeability characteristics of salt rock in potential salt mines.
In summary, current studies mainly focus on the effects of impurities on the mechanical properties of salt rock, but few studies have been conducted on impurity’s effects on the permeability of salt rock. This paper aims to investigate the confining pressure and effects of impurities on the mechanical properties and permeability of salt rock under different conditions. A comprehensive study was conducted, including a permeability test on the natural salt rock under hydrostatic pressure, a permeability test under the triaxial loading process and the CT scanning of broken salt rock. Impurity effects on the mechanical properties and permeability of salt rock were studied, and the relationship between rock permeability and pore volume was discussed.

2. Experimental Setup

2.1. Sample Preparation

The tested salt rock samples with different impurity contents were cored from the same boreholes at different depths (1000–1200 m) in the Huai’an salt mine. However, pure salt rock is not found in this salt mine. In order to make the research results clearer, we introduced some pure salt rock from Pakistan with a purity > 95% (Figure 1a). The salt rock was processed into cylindrical specimens following the standard testing method for engineering rock mass [29], with a height of 76 mm and a diameter of 38 mm.
In order to distinguish the salt rock specimens with different impurity contents, solubility tests were conducted on all samples to determine the accurate water-insoluble content results of impurities like anhydrite, glauberite and clay. Based on solubility test results, salt rock specimens were divided into four groups by different impurity contents, according to the classification method in Table 1. Salt rock specimens with different impurity contents are different in appearance (Figure 1). While the pure salt rock specimens are homogeneous and light gray, the salt rock specimens with low impurity contents contain black anhydrite interlayers, while the gray section is mainly halite. Further, salt rock specimens with medium impurity contents seem to be relatively homogeneous and appear gray, while salt bearing sedimentary rock samples are more dark, with light gray interlayers.
The mineral powders of salt rock specimens from different groups were tested using an X-ray diffractometer. Figure 2 shows the X-ray diffraction (XRD) analysis results of salt rock specimens with increasing impurity content. The mineral composition of the pure salt rock was 97% halite and 3% anhydrite, while the mineral composition of salt rock with a low impurity content was 87% halite and 13% anhydrite. The mineral composition is more complicated for salt rock with medium and high impurity content, which contains impurity compositions like muscovite, glauberite, calcite, quartz and siderite, but the main impurity is anhydrite.
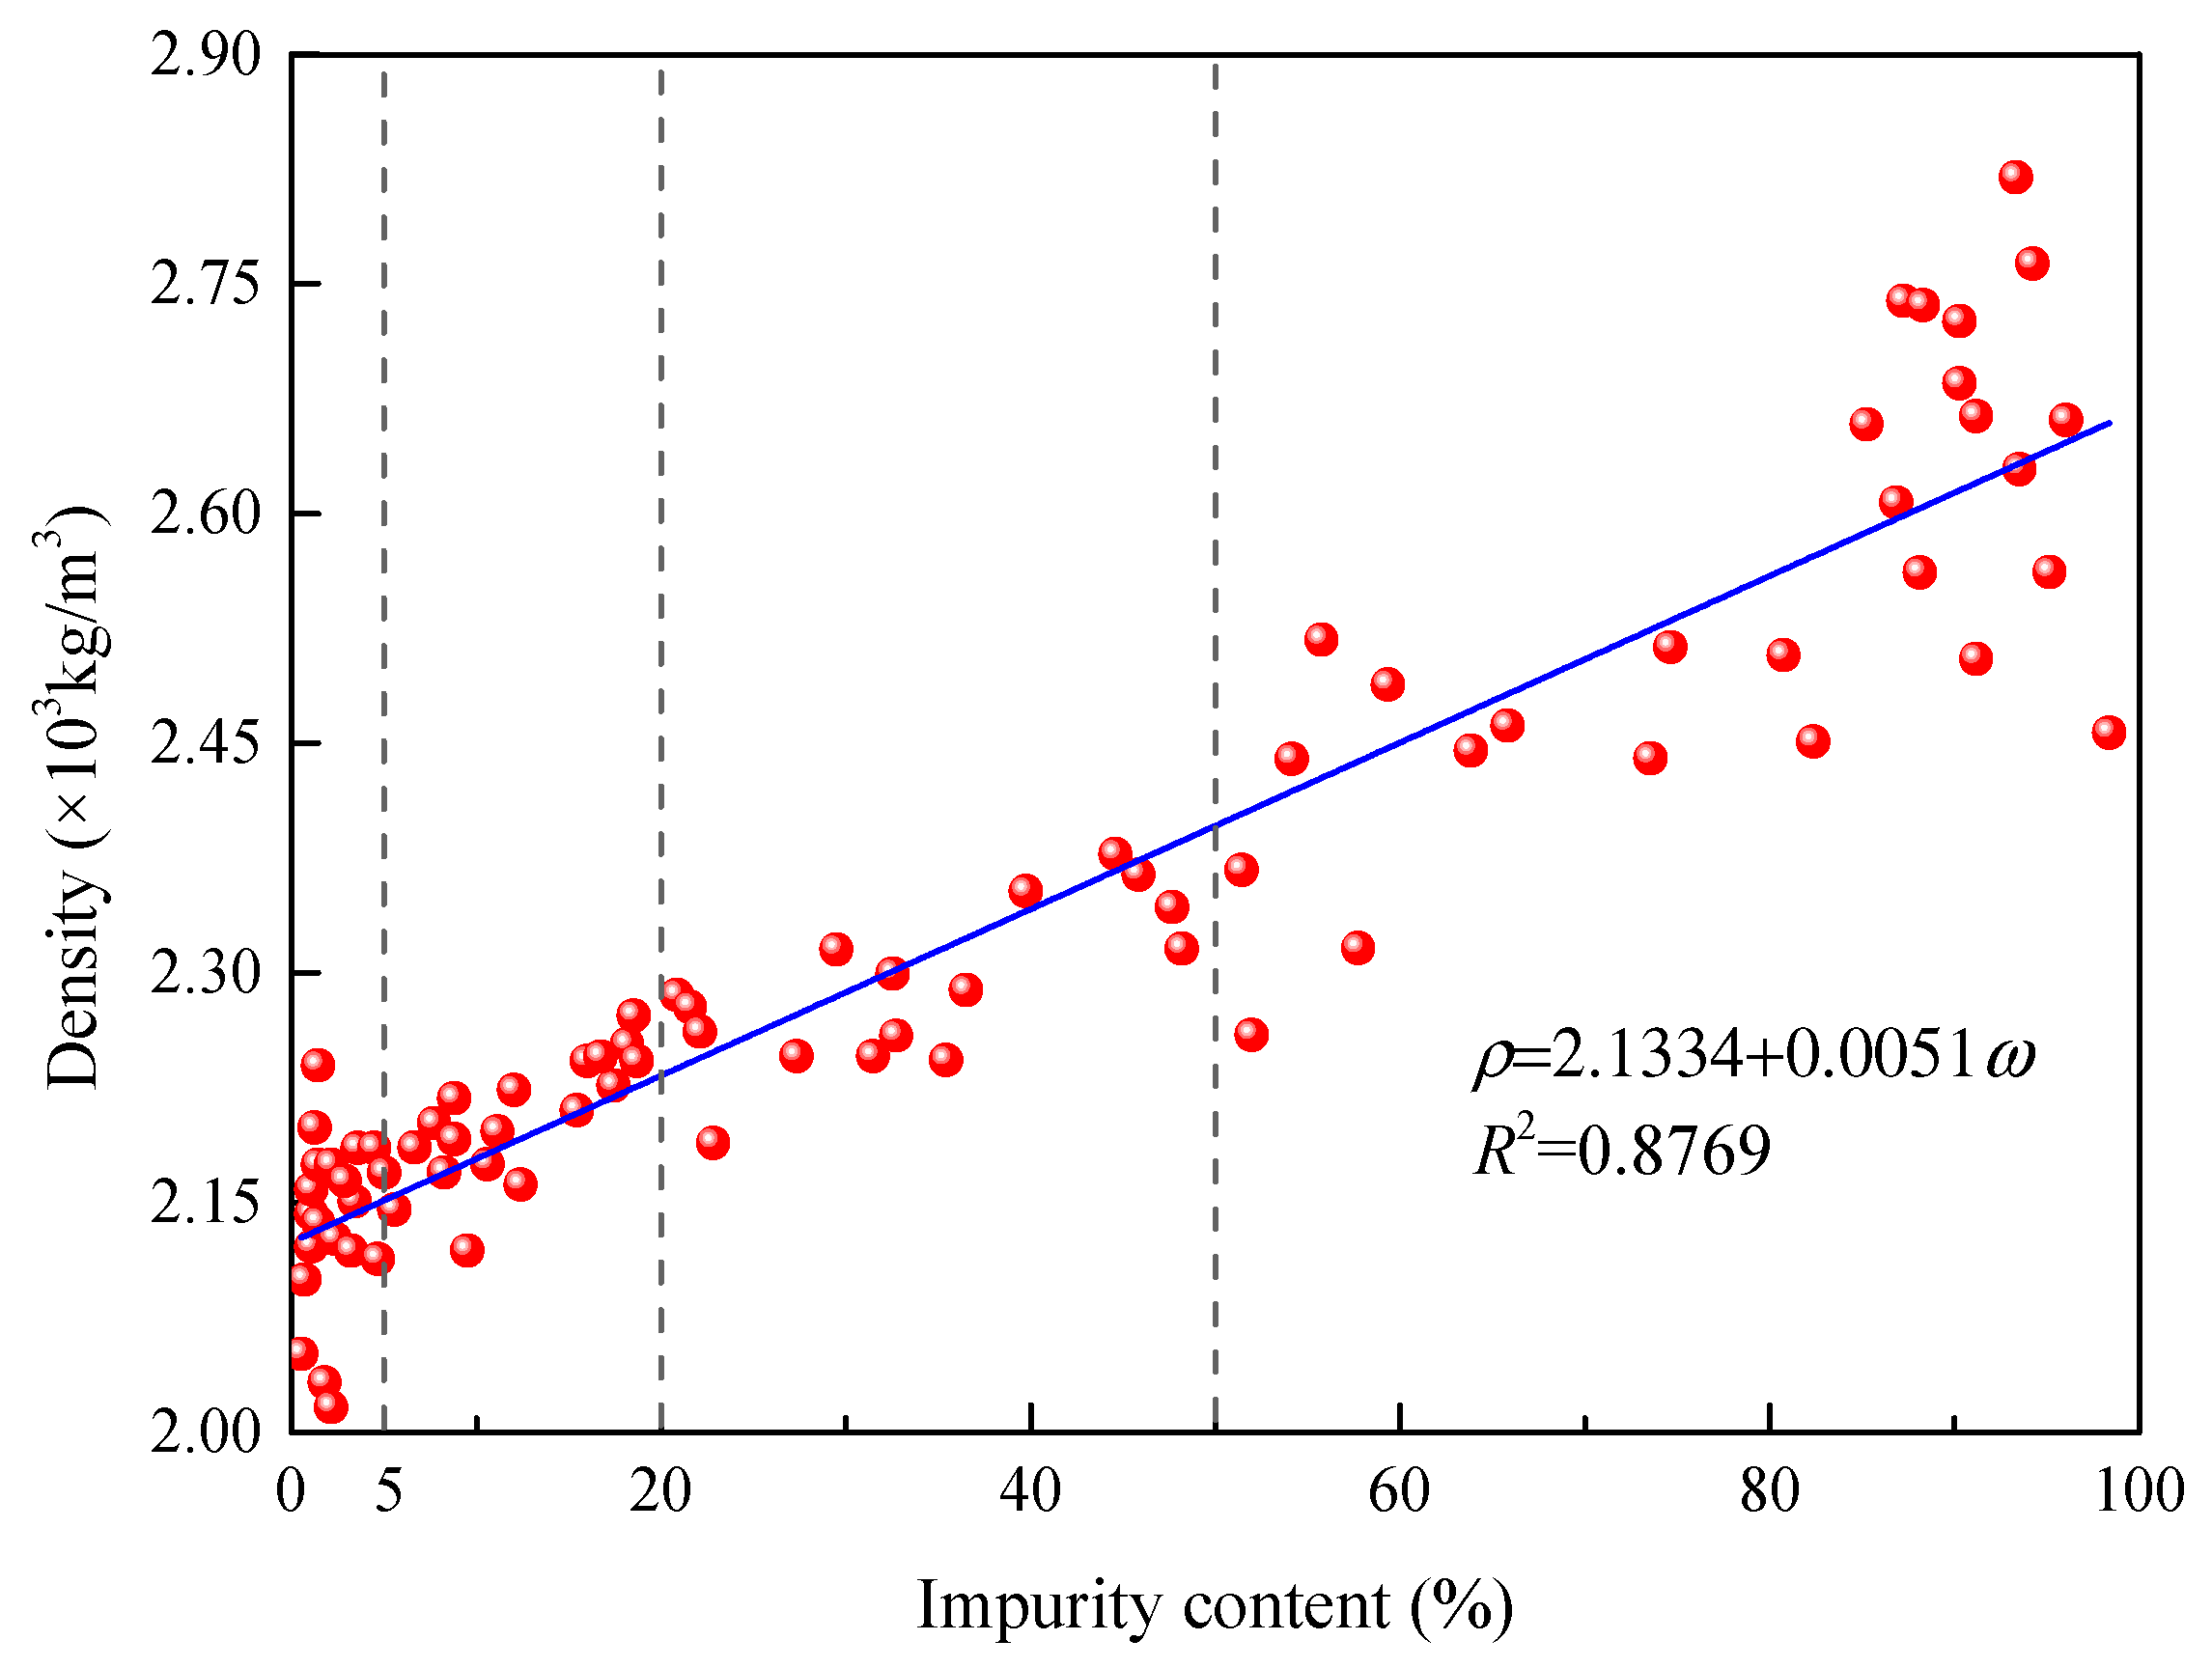
The basic physical parameters of the tested specimens are listed in Table 2. While the impurity contents of SR-1, SR-2, SR-3 and SR-4 are all below 5%, the impurity contents of SR-5, SR-6 and SR-7 are 13.07%, 39.16% and 60.02%, respectively. Figure 3 shows that there is a strong correlation between salt rock density and impurity content for the tested samples. Overall, the density of salt rock increases with an increase in impurity content. The salt rock samples were processed by a lathe using the dry cutting method. We dried the powder at a temperature of 105–110 °C using an oven to determine the water content of the salt rock, as shown in Table 2.

2.2. Testing Apparatus and Methods

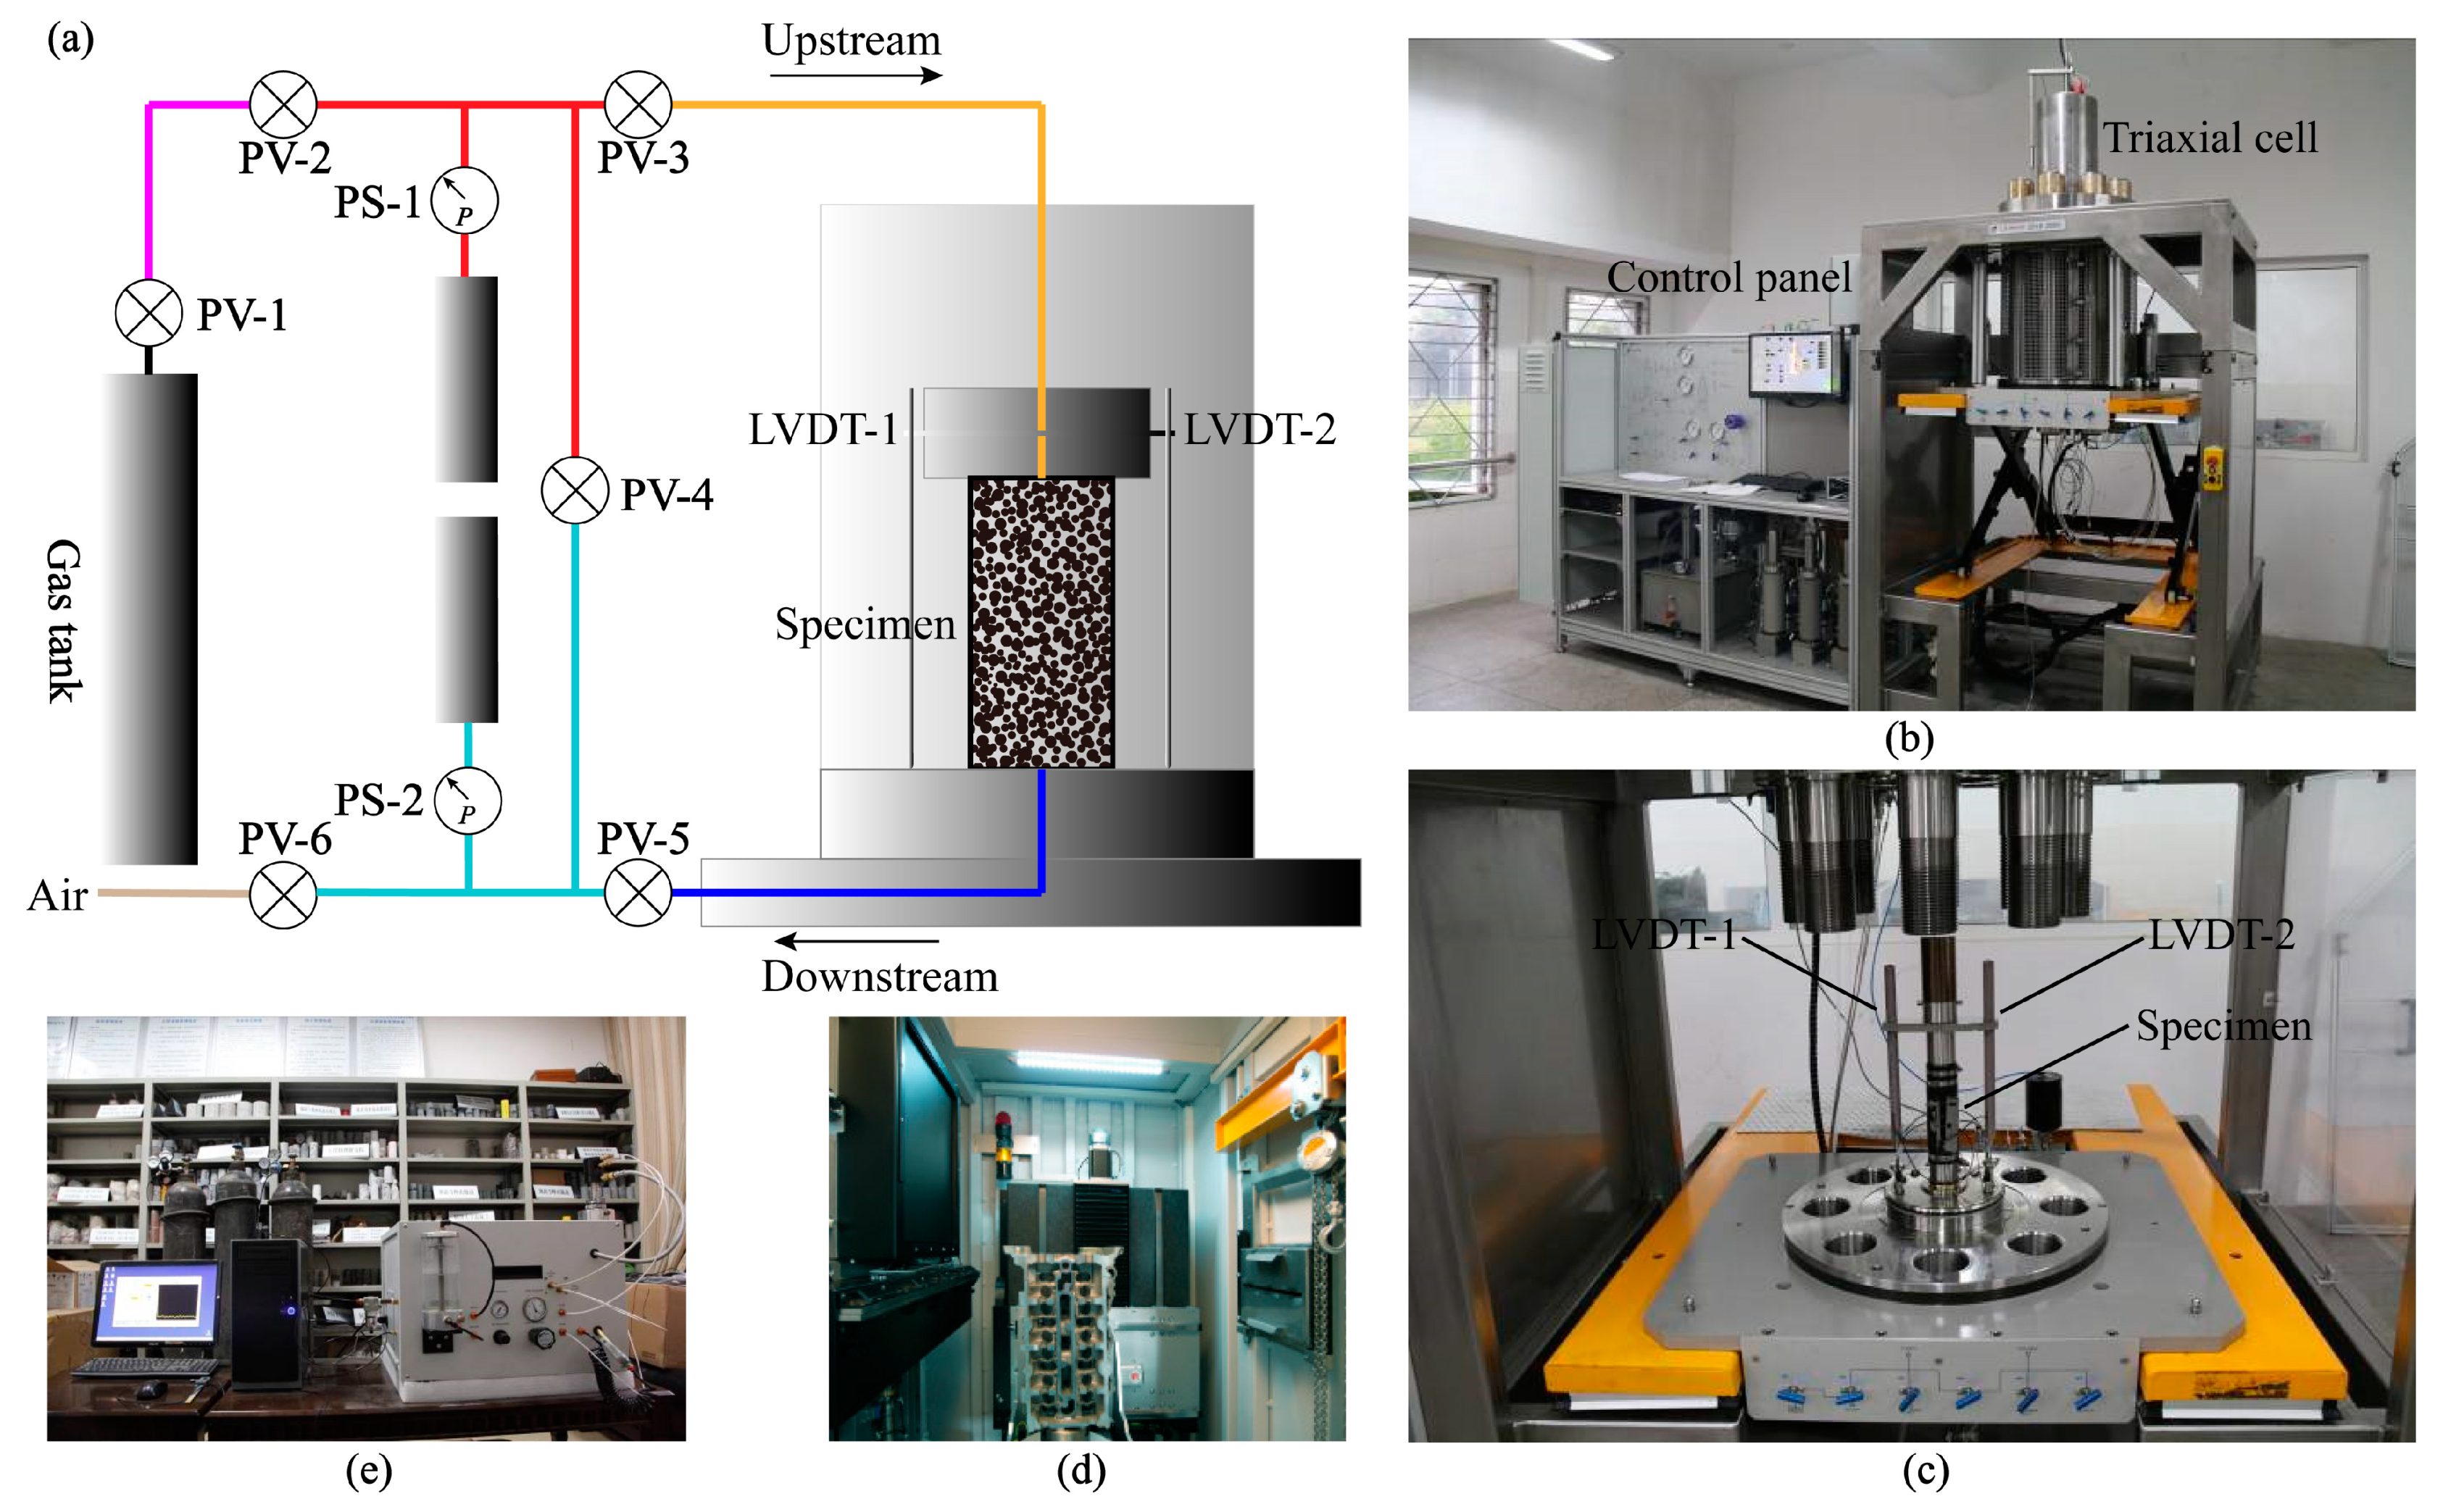
In order to obtain a comprehensive understanding of the mechanical properties and permeability characteristics of the salt rock under different conditions, three different tests in our laboratory were conducted. The first test was conducted using an AP-608 automated permeameter-porosimeter to investigate the porosity and gas permeability of natural salt rock with different impurity contents (Figure 4e). The AP-608 automated permeameter–porosimeter is capable of loading hydrostatic pressure up to 65.50 MPa. The measurement range of permeability was between 10−19 m2 and 10−11 m2, and the minimum porosity was measured at 0.1%. The penetration medium of this machine is nitrogen, and the testing method is the transient pulse method. Important parameters, such as the gas permeability, porosity and grain size of the rock samples, can be obtained from the device.
The second part of the test was carried out using a comprehensive rock mechanics testing platform with a gas permeability test system (Figure 4b). Here, a triaxial cell is used as the permeameter alongside a loading device with auxiliary gas volumes and pressure gauges. According to our previous studies, initial damage to the salt rock was mostly healed after 4 hours at a confining pressure of 30 MPa [30]. To eliminate the influence of the initial damage caused by sampling, transporting and processing, the tested specimens were confined in a triaxial cell at a confining pressure of 40 MPa for 24 hours before the loading process. The maximum axial load of the equipment was 2000 kN, and the machine is capable of loading with a confining pressure up to 100 MPa. The pore fluid pressure difference was determined by a disjunctive gas cylinder with a gas pressure valve and a pressure gauge. The permeability measurement range of this testing platform is above 10−24m2. Axial displacement was measured by two symmetrical axial extensometers with a measurement range of −25 to +25 mm (Figure 4c). Moreover, nitrogen was the penetration medium of this machine. The control precision of all devices mentioned above is within 0.5%. The primary procedures in this part of the study are summarized as follows:
(1) We installed the parcelled salt rock specimen and related facilities on the testing machine, and then sealed the triaxial cell and started to fill the oil. We loaded the confining pressure to 40 MPa and confined the rock specimen for 24 hours.
(2) We unloaded the confining pressure to a pre-set value (5 MPa, 10 MPa, 15 MPa, or 20 MPa) at a rate of 3 MPa/min after the pre-compaction process. We axially loaded the rock specimen at a strain rate of 0.0053/min, controlled by an axial extensometer during the whole loading process.
(3) Seven permeability test points were set for the whole loading process, with four in the pre-failure stage, one near the peak stress, and two in the residual stage. In a single permeability test, the gas pressure difference between upstream and downstream was set at 3 MPa, and the transient pulse method was adopted to test the rock permeability.
(4) The deformation process ended if the post-failure state reached an axial strain of 25% or greater.
The last part of the analysis was performed using a powerful versatile X-ray microfocus CT system for the 3D analysis of pore space to investigate the crack characteristics of salt rock after failure (Figure 4d). This equipment is capable of offering a detailed analysis of rock within 1 μm downward, and the maximum voxel size and spatial resolution scanning range of the 3D CT system is 300 mm in diameter and 400 mm in height.
The transient pulse method has been widely adopted by researchers to test and calculate the permeability of rocks like sandstone, granite and salt rock [31,32,33,34,35,36]. In a single permeability test process, by adjusting the two pressure valves (PV-2 and PV-6), we set the gas pressure difference at 3 MPa between the upstream gas tank and the downstream gas tank at the beginning. The permeability test ended while the gas pressure difference approached zero. The rock permeability was obtained according to Equation (1) [37]. All tests were conducted at room temperature.
k = μ g c H A V u V d V u + V d ln ( Δ P 0 / Δ P t ) t
where μg is the dynamic viscosity coefficient of nitrogen (μg = 1.80 × 10⁻⁵ Pa s), c is the compressibility of nitrogen (c = 6.67 × 10⁻⁷ Pa−1), H is the height of the rock specimen (m), A is the cross sectional area of the rock specimen (m2), Vu is the gas volume of the upstream pipes and tanks (m3), Vd is the gas volume of the downstream pipes and tanks (m3), ΔP0 indicates the upstream and downstream gas pressure differences at the beginning, ΔPt indicates the upstream and downstream gas pressure differences at time t (MPa), and t is the duration of the permeability test (s).

3. Mechanical Test Results

3.1. Confining Pressure Effects on Mechanical Properties

Figure 5 shows the stress–strain curves of salt rock under different confining pressures. The stress–strain curves of pure salt rock reveal that the internal structure of salt rock is weak, as the stress–strain curves quickly enter the yield stage with a rather short elastic stage, which agrees with the conclusions proposed by Liu et al. [5]. Further, the axial strains of all salt rock samples approached 25% before failure, indicating that pure salt rock has large deformation characteristics [10,21,22].
Axial stress drops sharply after failure at a confining pressure of 5 MPa; however, this stress drop vanishes at confining pressures of 10 MPa, 15 MPa and 20 MPa. Particularly, the obvious brittle–ductile transition characteristics of rock deformation are observed at a confining pressure of 10 MPa, indicating that a confining pressure of 10 MPa is the critical value of pure salt rock. The peak strength is 57.32 MPa at a confining pressure of 5 MPa, and pure salt rock is still capable of bearing an axial stress of approximately 37.29 MPa in the residual stage. However, salt rocks keep hardening at confining pressures of 10 MPa, 15 MPa and 20 MPa.
At a confining pressure of 5 MPa, both shear cracks and lateral bulging deformation occur on the pure salt specimen after failure, indicating that the failure mode of pure salt rock is a combination of tensile failure and shear failure (Figure 6a). However, with an increase in confining pressure, lateral stress restrains the deformation ability of pure salt rock. The remaining pure salt rock specimens experience bulging deformation, as clear crystal slip lines are widely distributed on the rock specimens (Figure 6). Apparently, affected by the end effects, lateral deformation mainly occurs in the axially middle part of pure salt rocks, indicating that the friction on the contact area restrained the lateral deformation of the rock specimens.

3.2. Impurity Effects on Mechanical Properties

The stress–strain curves of salt rocks with different impurity contents are plotted in Figure 7. At a confining pressure of 5 MPa, the peak strengths of pure salt rocks with increasing amounts of impurities are 57.00 MPa, 58.82 MPa, 61.60 MPa and 69.09 MPa, indicating that the bearing capacity of the salt rock progressively increases with an increase in impurity content. Similar trends are observed in the secant modulus, but there is a sharp increase in the secant modulus at a confining pressure of 20 MPa. The impurity content enhances the bearing capacity, but weakens the deformation ability of the salt rock. As the secant moduli are 1.44 GPa, 1.49 GPa and 1.77 GPa, the secant modulus of the salt bearing sedimentary rock is 5.86 times than that of the rock with medium impurity content. However, the deformation ability decreases with an increase in impurity content. Further, a sharp decrease in the secant modulus of more than one order of magnitude occurs at a confining pressure of 20 MPa compared to 15 MPa. There is, moreover, little difference in the peak strength, deformation ability and secant modulus for the salt rock, whose impurity content is below 50%, but there is a remarkable increase for the SR-7, whose impurity is over 50%, which is in agreement with the experimental results presented by Zong [25].
Based upon the stress–strain curves in Figure 7, the relationships between the peak strength, axial strain at peak stress and secant modulus versus impurity content, are analyzed, and the fitting results are also plotted in Figure 8. While the relationship between peak strength and impurity content is positively linear, the relationship between the axial strain at peak stress and impurity content is negatively linear. Moreover, the relationship between the secant modulus and impurity content is positive and exponential. These results indicate that impurities enhance the strength and stiffness of salt rock, which is important in salt cavern construction.
Impurity effects were also observed in the failure characteristics of the salt rock specimens with different impurity contents (Figure 9). Tensile–shear cracks are easily observed in the pure salt rock and the salt rock with low impurity. However, with an increase in impurity, the lateral deformation progressively weakens. Only a macroscopic shear crack with inapparent lateral swelling can be observed in the salt bearing sedimentary rock.

4. Permeability Test Results

4.1. Porosity and Permeability under Hydrostatic Pressure

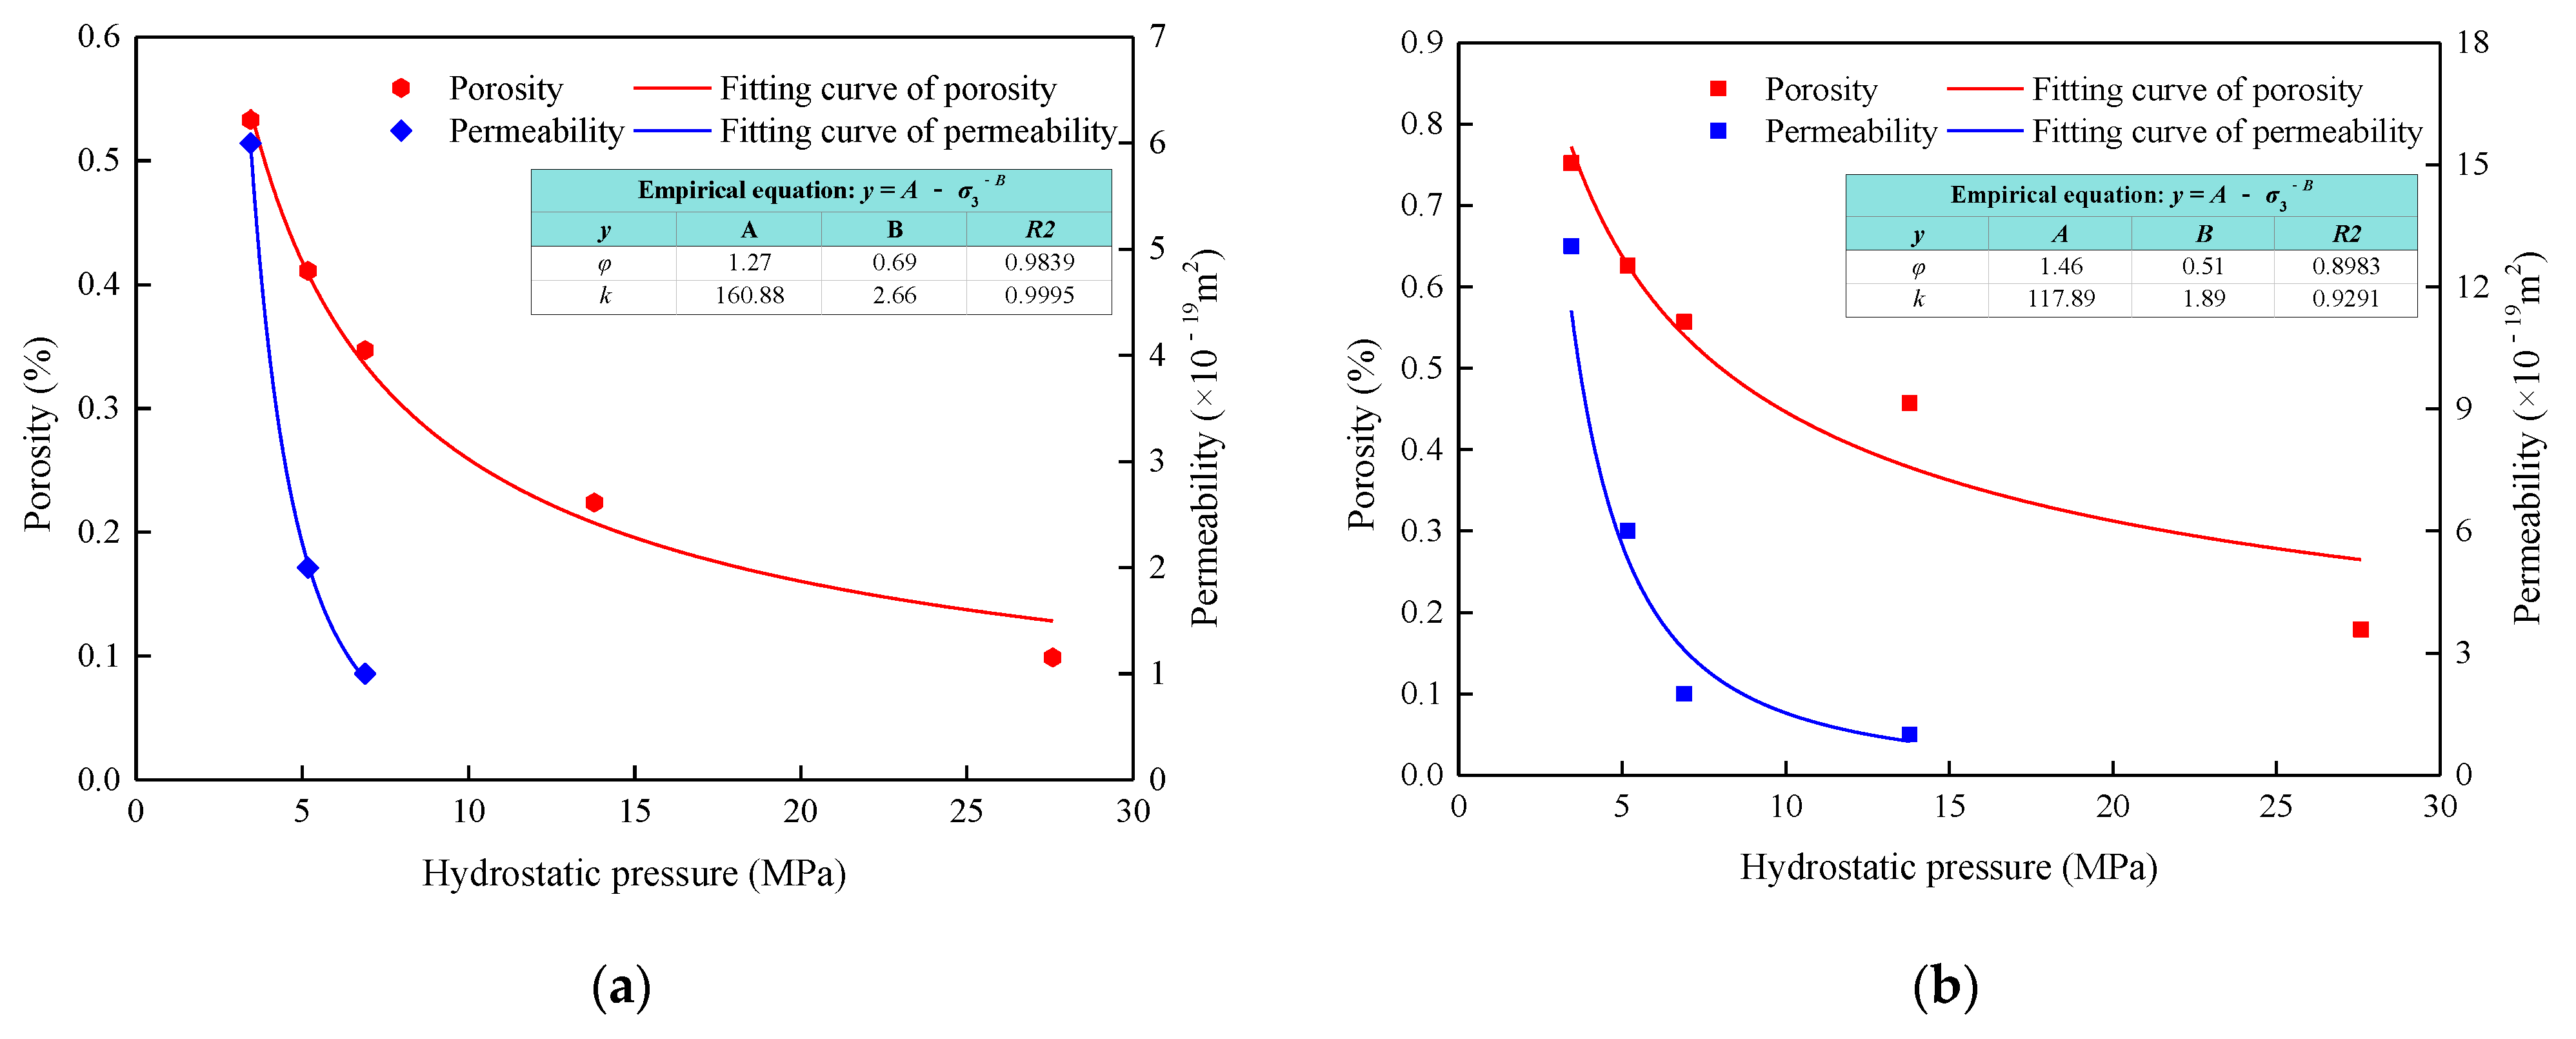
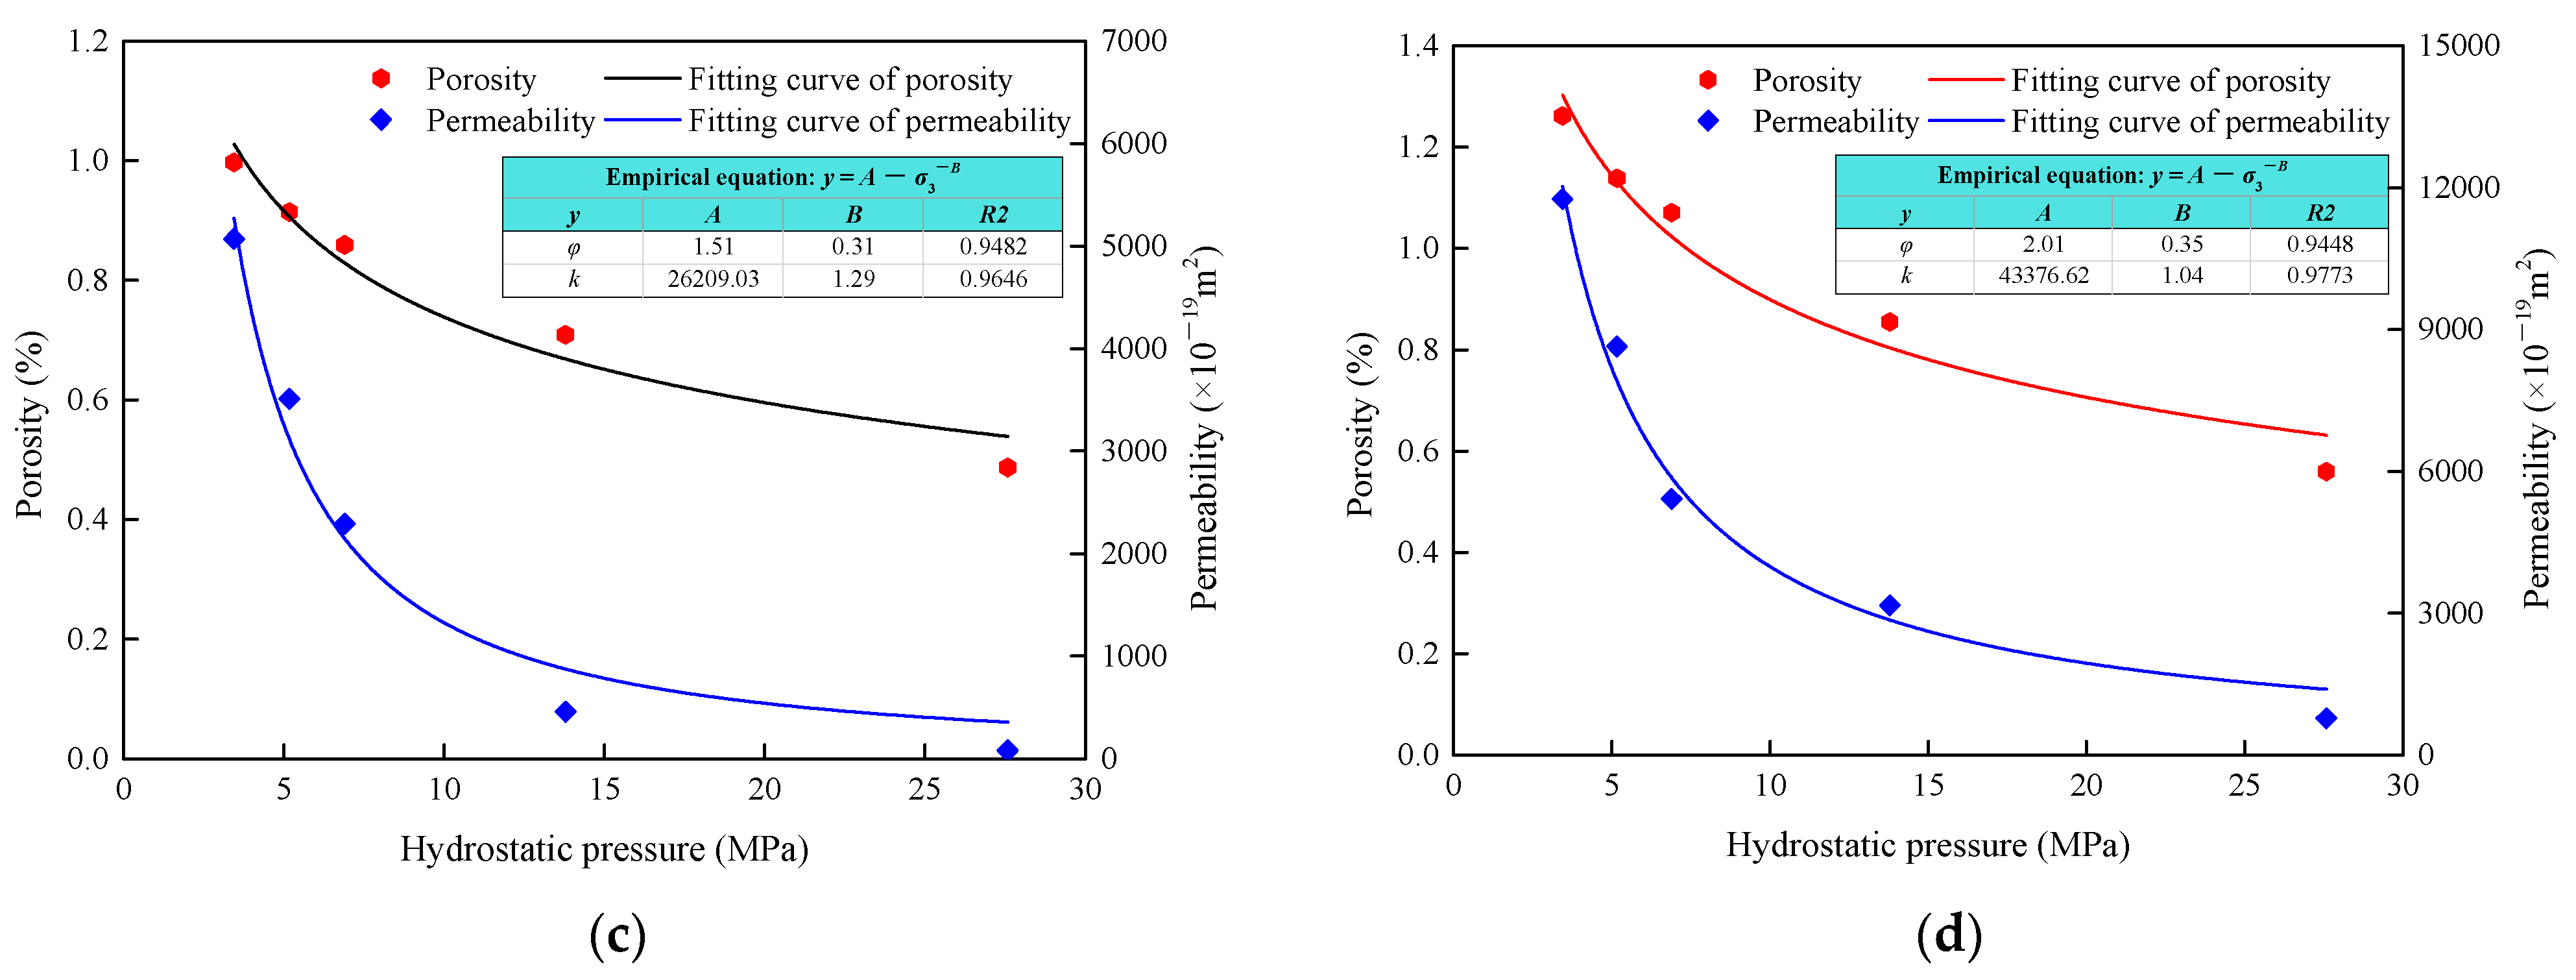
Figure 10 shows the permeability testing results of the natural salt rock specimens under hydrostatic pressure. Under the action of lateral stress, natural voids in the pure salt specimens are gradually compacted. Consequently, the rock porosity and permeability decrease with an increase in hydrostatic pressure. Taking pure salt rock as example, at different confining pressures of 3.45 MPa, 5.17 MPa, 6.89 MPa, 13.79 Mpa and 27.58 MPa, the porosity values are 0.533%, 0.411%, 0.347%, 0.224% and 0.099%, respectively. Further, the permeability values are 6.00 × 10⁻¹⁹ m2, 2.00 × 10⁻¹⁹ m2 and 1.00 × 10⁻¹⁹ m2 at hydrostatic pressures of 3.45 MPa, 5.17 MPa and 6.89 MPa.
Since there is a large number of pores and cracks at the layered interface between different impurity components, both porosity and permeability increase with an increase in the impurity content of the salt rock. Further, using the confining pressure of 5.17 MPa as an example, the porosity is 0.411%, 0.626%, 0.914% and 1.139%, the permeability is 2.00 × 10⁻¹⁹ m2, 6.00 × 10⁻¹⁹ m2, 3.51 × 10⁻¹⁶ m2 and 8.64 × 10⁻¹⁶ m2, respectively, for the four salt rock specimens with increasing impurity content. The relationships between porosity, permeability and hydrostatic pressure are analyzed by the fitting curves in Figure 10, which are both negative power functions with σ3 as a base. The basic equation can be expressed as
y = A σ 3 B
where y is the fitting objective, i.e., the porosity φ and k; and σ3 is hydrostatic pressure (MPa).
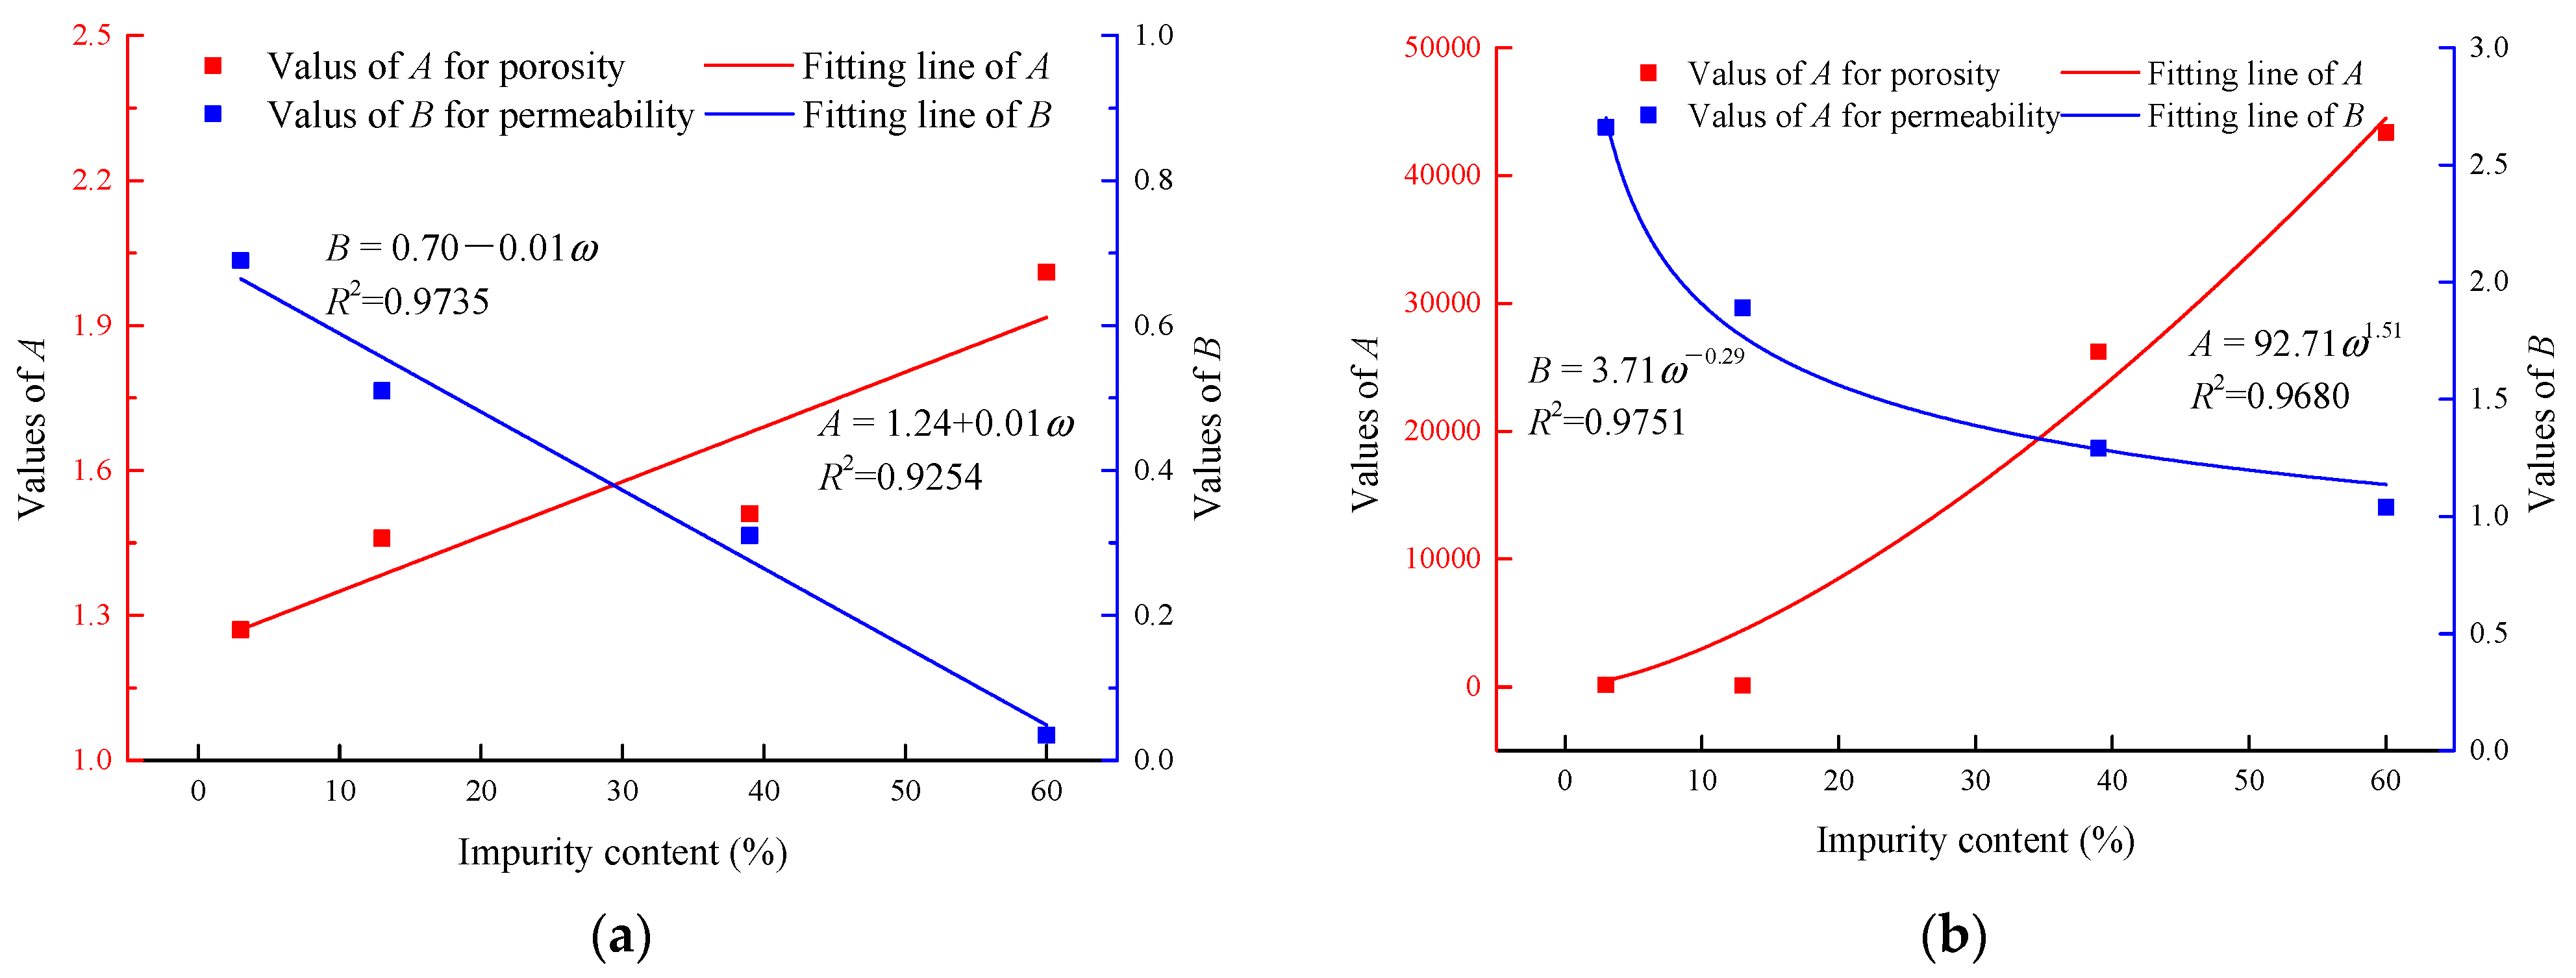
In Figure 11, we can see that with an increase in salt rock impurity content, the values of A for both porosity and permeability gradually increase, while the values of B show a decreasing trend. However, there is a significant difference in the fitting results between porosity and permeability. While the values of A and B for porosity show linear relationships with the impurity content, the relationships are power functions of permeability.

4.2. Confining Pressure Effects on Permeability under CTC

The stress–strain and permeability–strain curves of pure salt rock under different confining pressures show that some permeability testing results have been missed, because they reached the minimum value (Figure 12). A considerable decrease in rock permeability occurs in the initial stage, indicating that the salt rock is compacted as the axial load increases. However, with a continuous increase in the axial load under a constant confining pressure, there is a slight decrease in rock permeability in the yield stage of the pure salt rock. Basically, all permeability–strain curves demonstrate a “decreasing–increasing” trend, and the confining pressure effects cause a significant and progressive decrease in rock permeability during the whole process [38,39,40,41,42]. It should be noted that some rock permeability testing results are not available, since the permeability is lower than 10−24 m2, which is the minimum permeability value that the device can detect.

4.3. Impurity Effects on Permeability under CTC

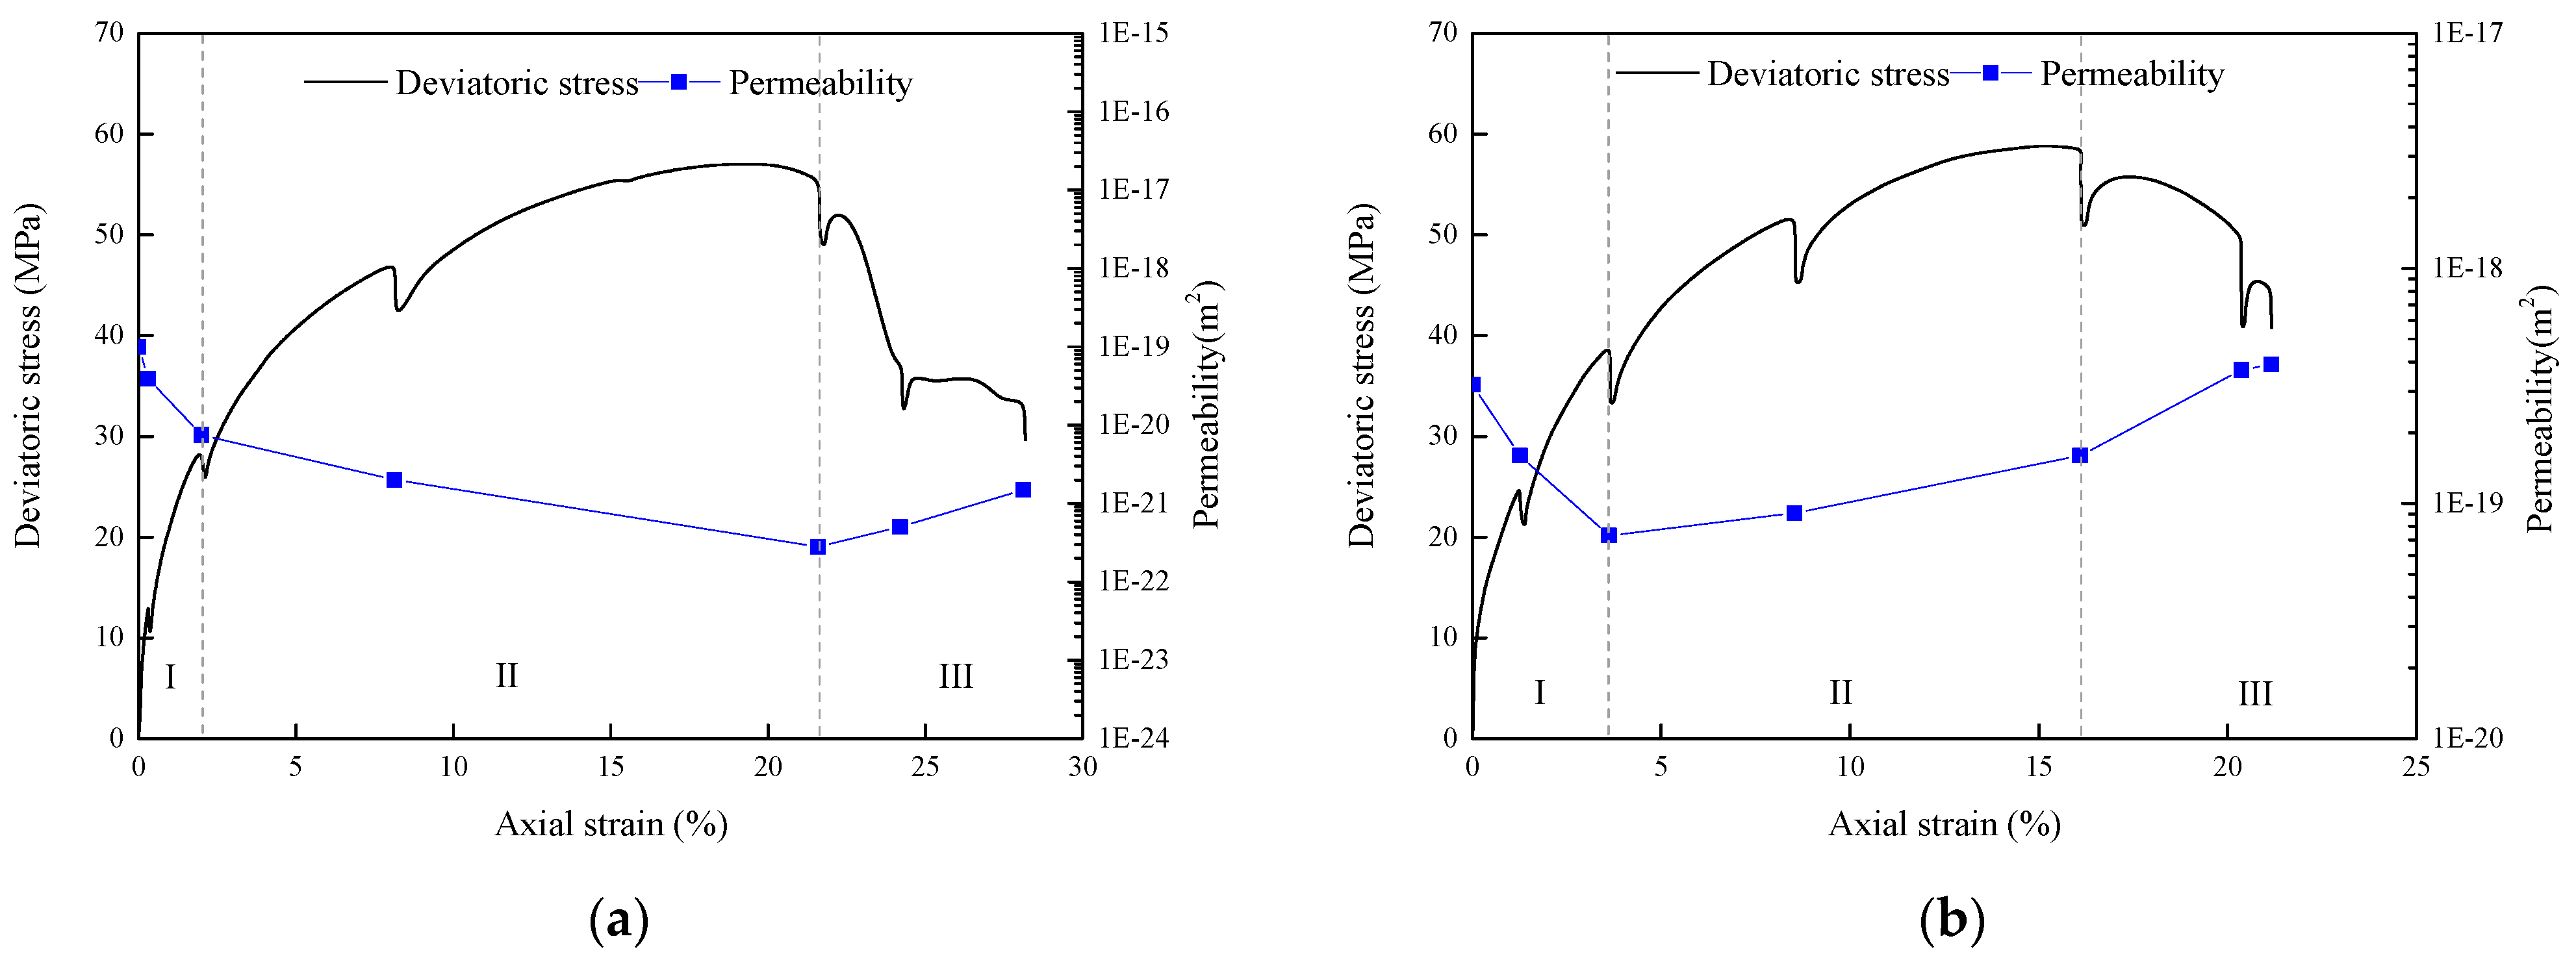
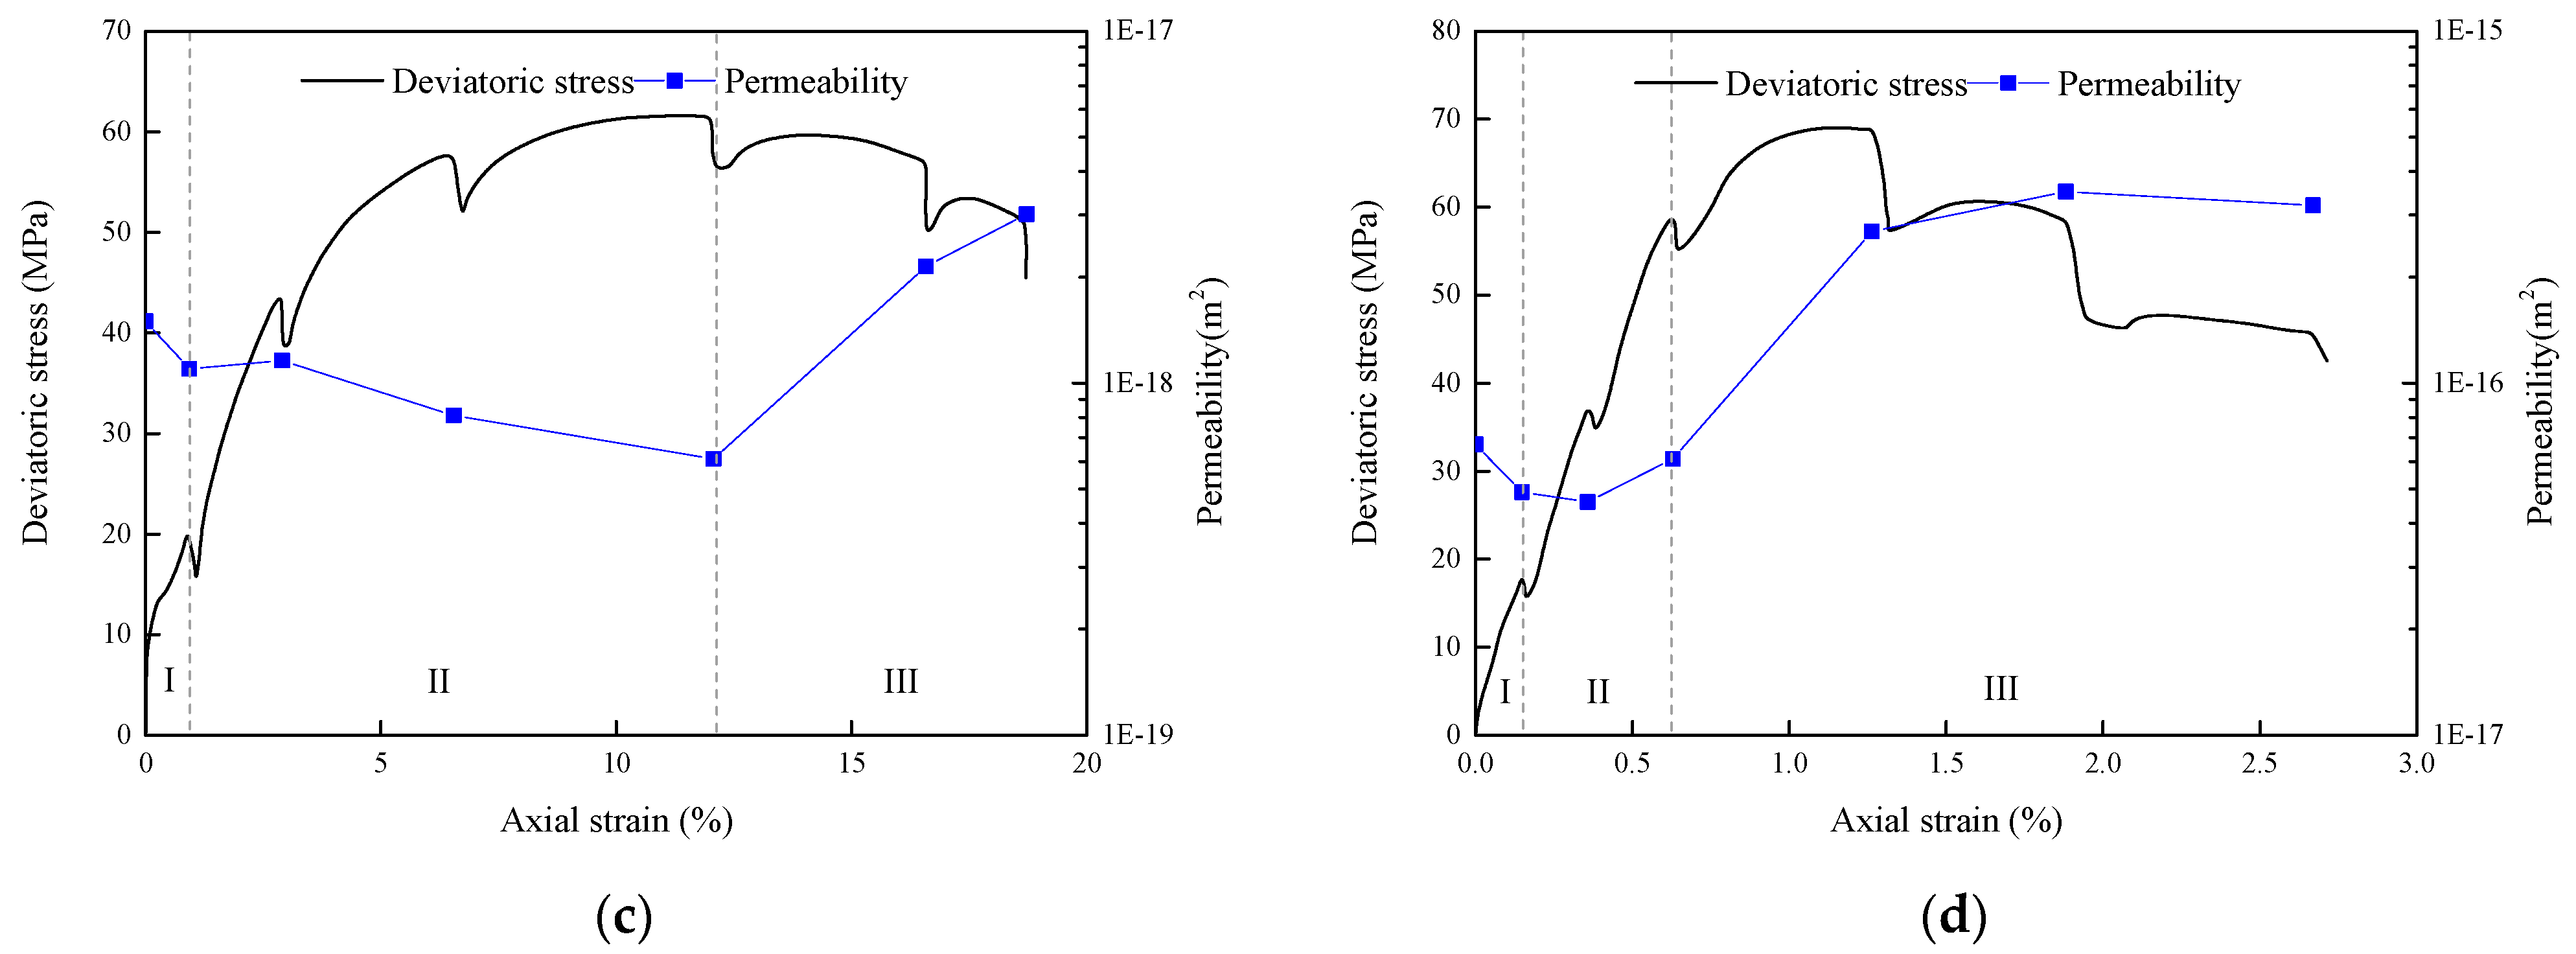
The stress–strain and permeability–strain curves of the salt rocks with different impurity contents are plotted in Figure 13. Considering the characteristics of the stress–strain curves and permeability–strain curves of every salt rock specimen, the permeability–strain curves of the salt rocks at a confining pressure of 5 MPa are divided into three stages: a decreasing stage, a steady stage and a increasing stage.
  • Stage I: The decreasing stage, in which remaining cracks after the pre-compaction process are compacted in the first stage under the action of both confining pressure and axial stress. Consequently, the permeable channels in the rock gradually reduce, causing a considerable decrease in rock permeability.
  • Stage II: The steady stage, in which the initiation and closure of the cracks are in a relatively dynamic equilibrium state. Here, permeability remains in a relatively steady with a slight increase or decrease.
  • Stage III: The increasing stage in which the initiation rate of cracks exceeds the closure of cracks, and micro-cracks are progressively connected, with an increase in axial loading. Consequently, macroscopic cracks are formed, and a sharp increase in rock permeability occurs. Affected by the impurity content, the axial strain at the percolation threshold progressively decreases and reaches 22.01%, 16.13%, 12.04% and 0.63%.
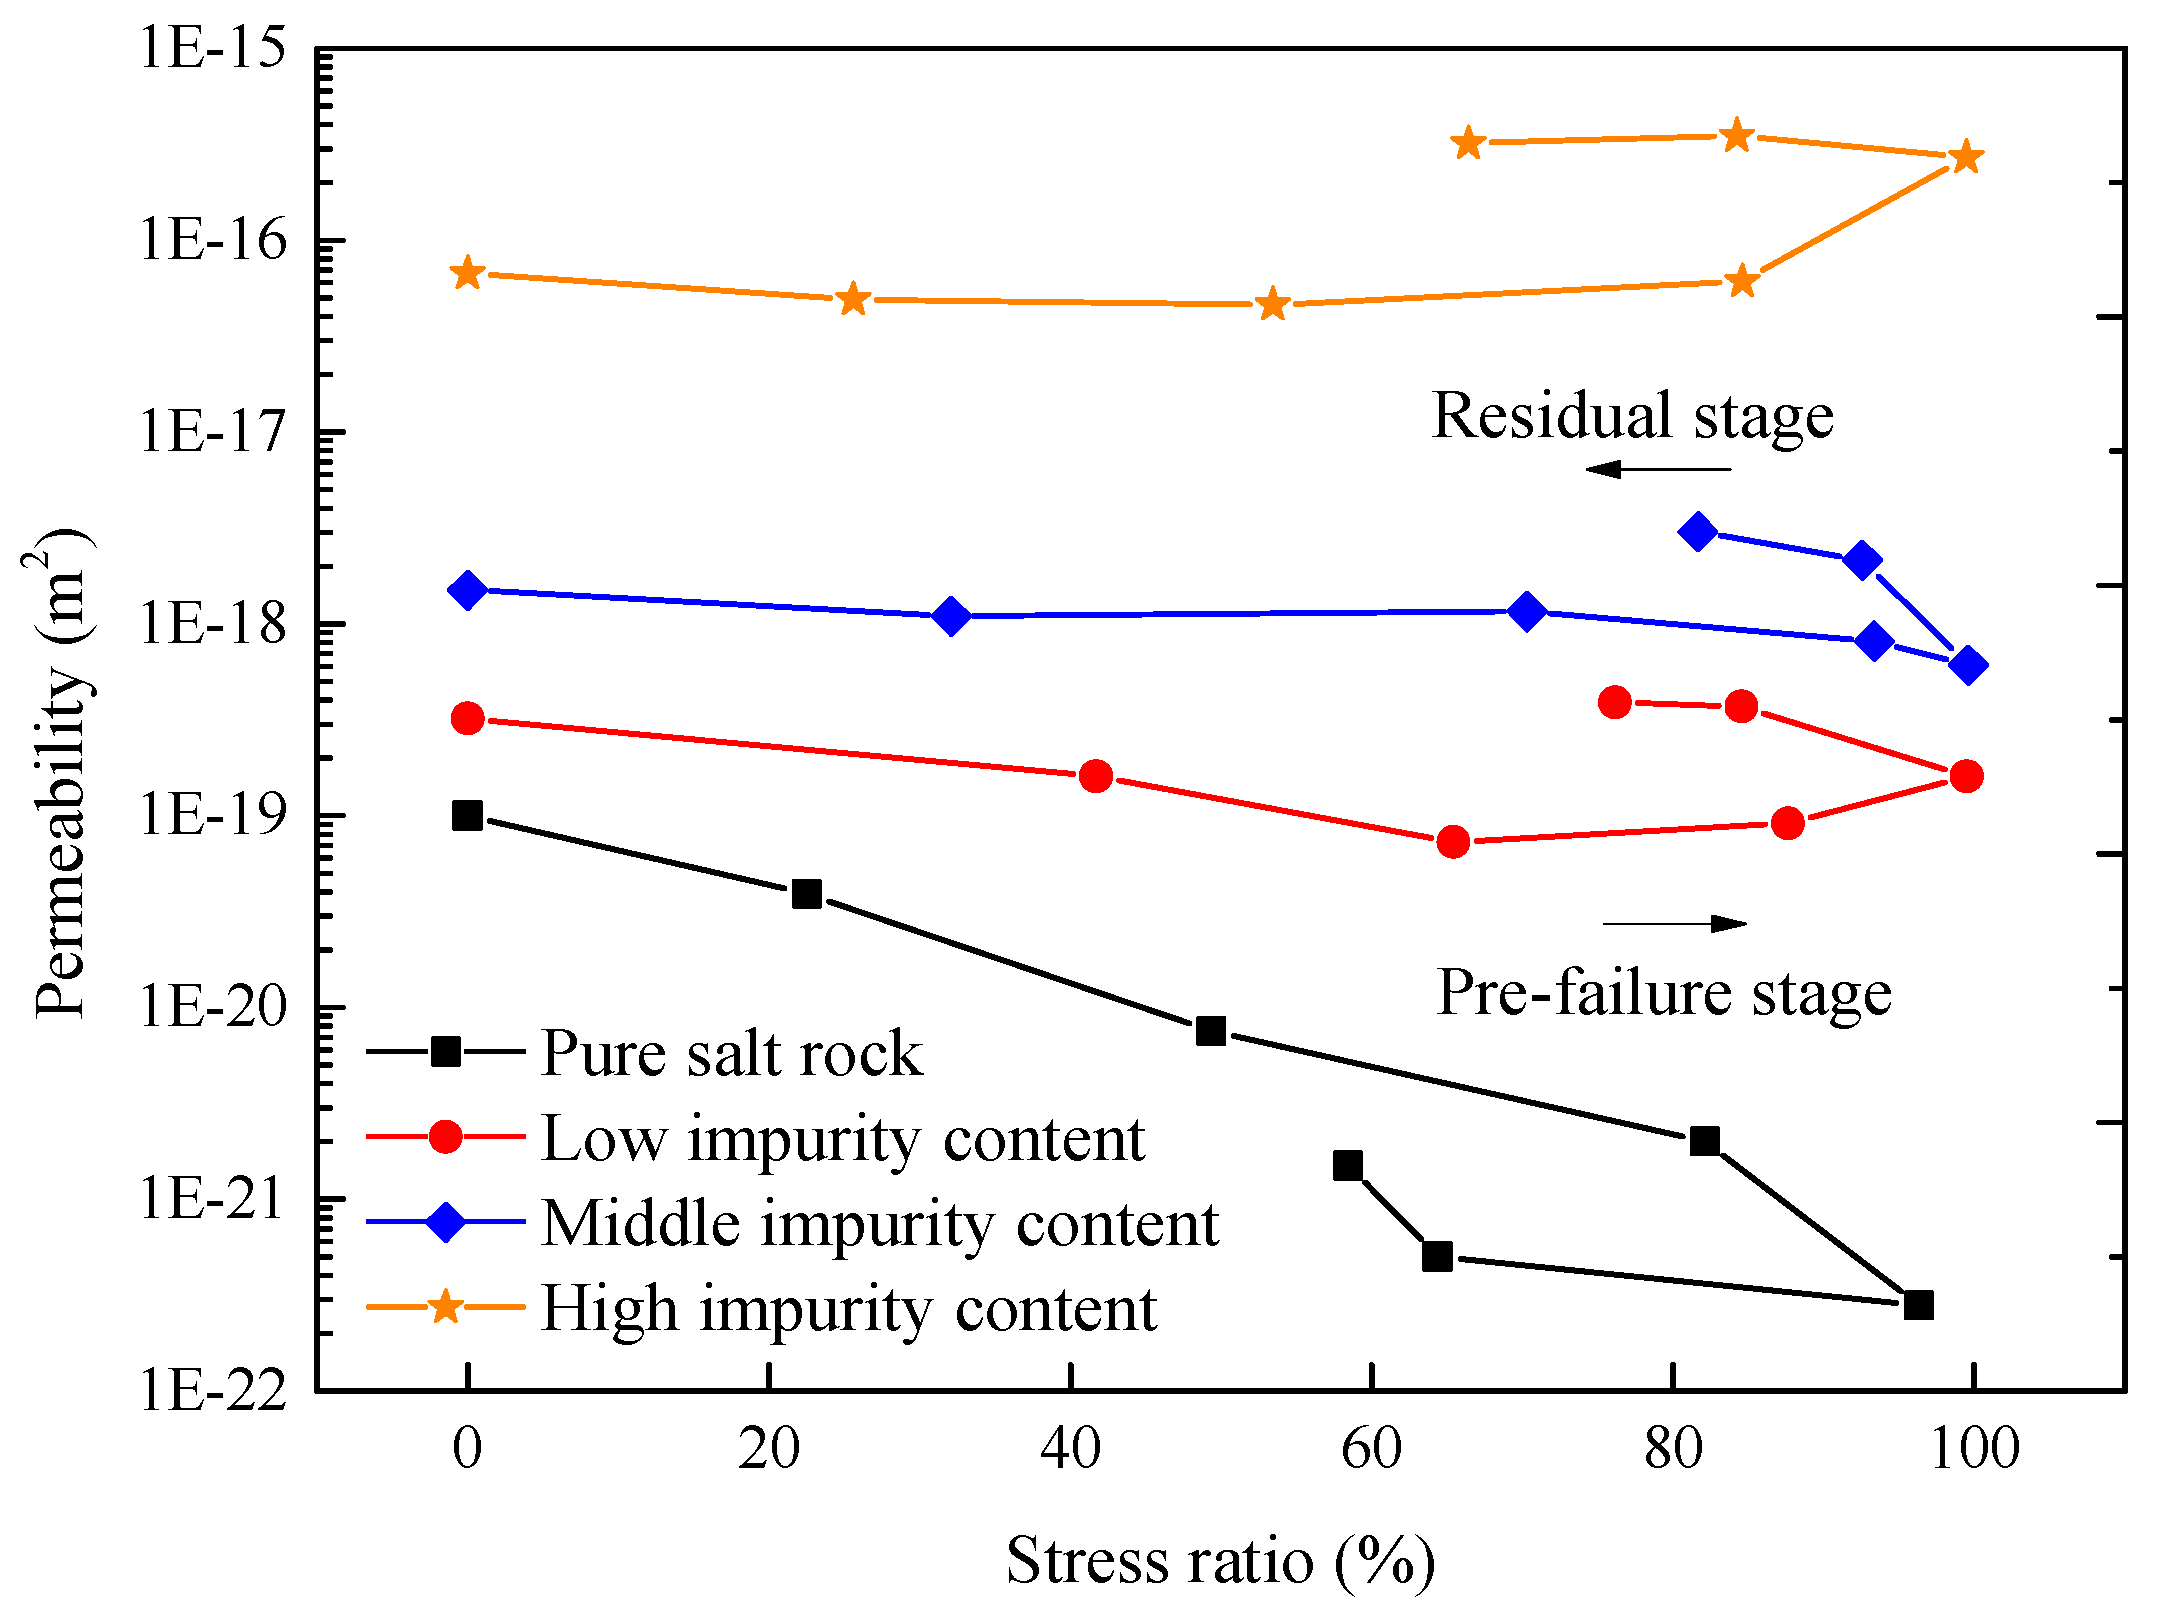
The differences in the permeability and permeability–stress ratio (i.e., σ / σc) curves of the four salt rock specimens are illustrated in Figure 14. The permeability of salt rocks increases with an increase in impurity content at the same stress ratio. Moreover, we can see that while the permeability of the broken salt rocks containing impurities exceeds the initial permeability, the permeability shows an opposite trend for pure salt rock. From Figure 9, we can see that the failure modes of the salt rock specimens with different impurity contents are different. The macroscopic shear fractures of the pure salt rock are largely compacted again in the residual stage, making it more difficult for the gas flow to penetrate the permeate channels, thereby causing a decrease in permeability after failure. However, as the impurity content increases the brittleness of salt rock, the salt rock specimens with higher impurity content are fragmented after failure, which greatly increases the connectivity of the gas flow channels.

5. Discussion

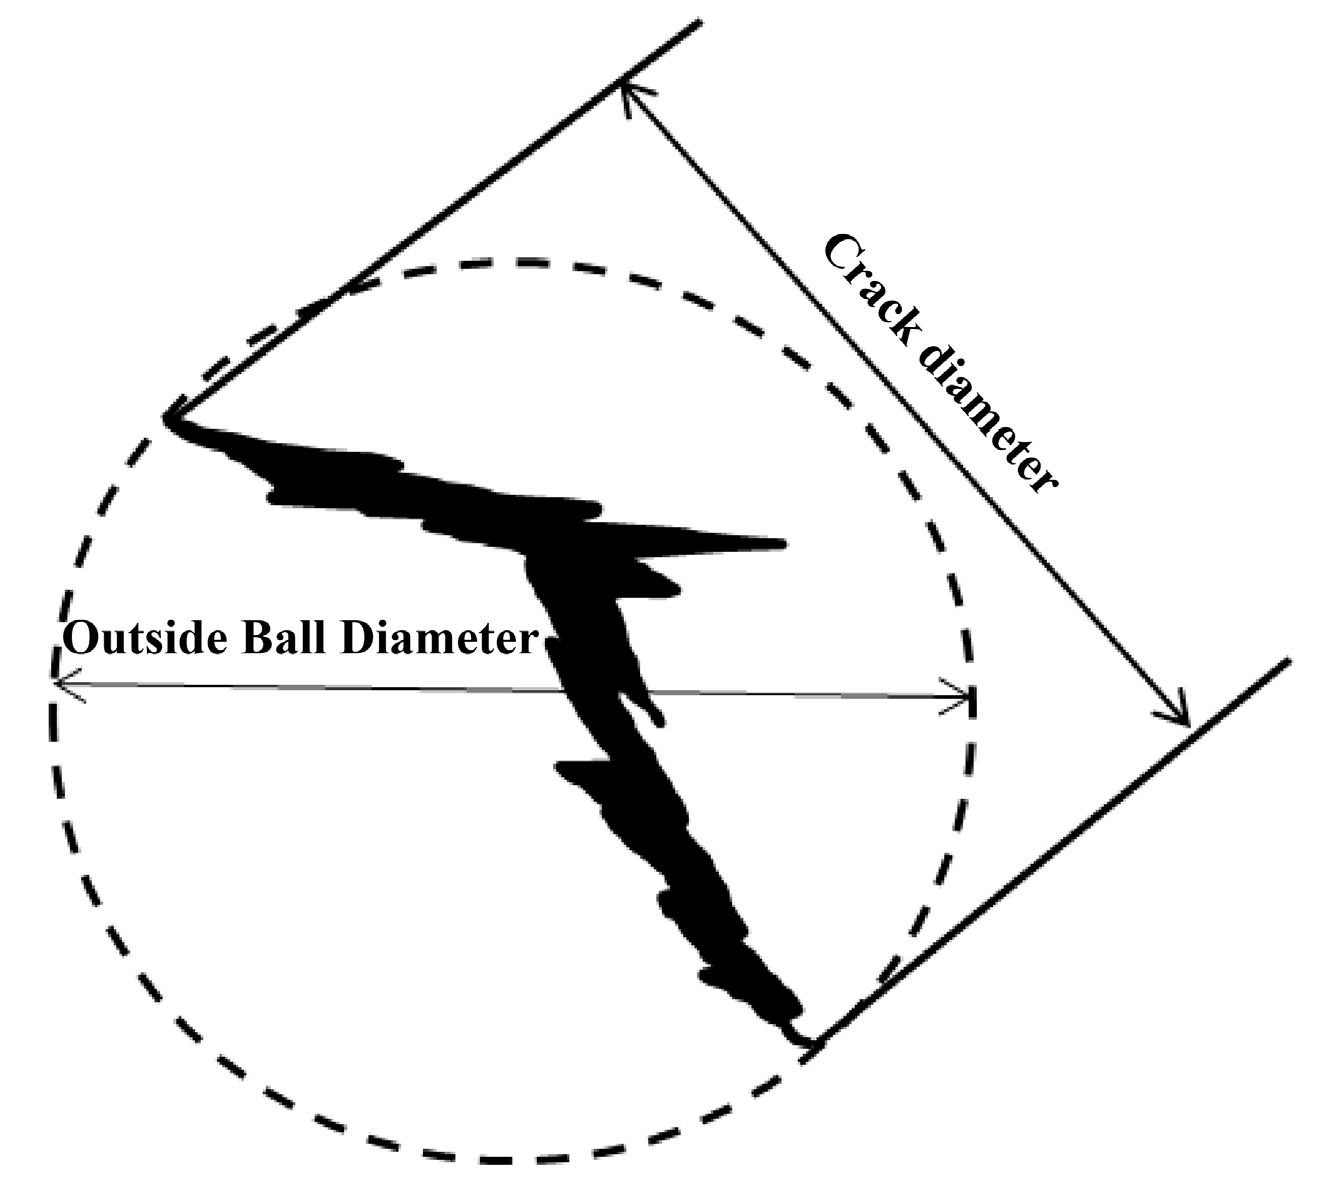
To investigate the relationship between the cracks and rock permeability, the cracks are divided into four groups (I~IV) according to their different crack diameter ranges (the maximum diameter of the crack, as shown in Figure 15), i.e., ~0.05 mm for group I, 0.05–1 mm for group II, 1–10 mm for group III and ~10 mm for group IV. Based on the 3D space analyzing function of the CT system, the pore volume of the cracks of these four groups were calculated.

5.1. Confining Pressure Effects

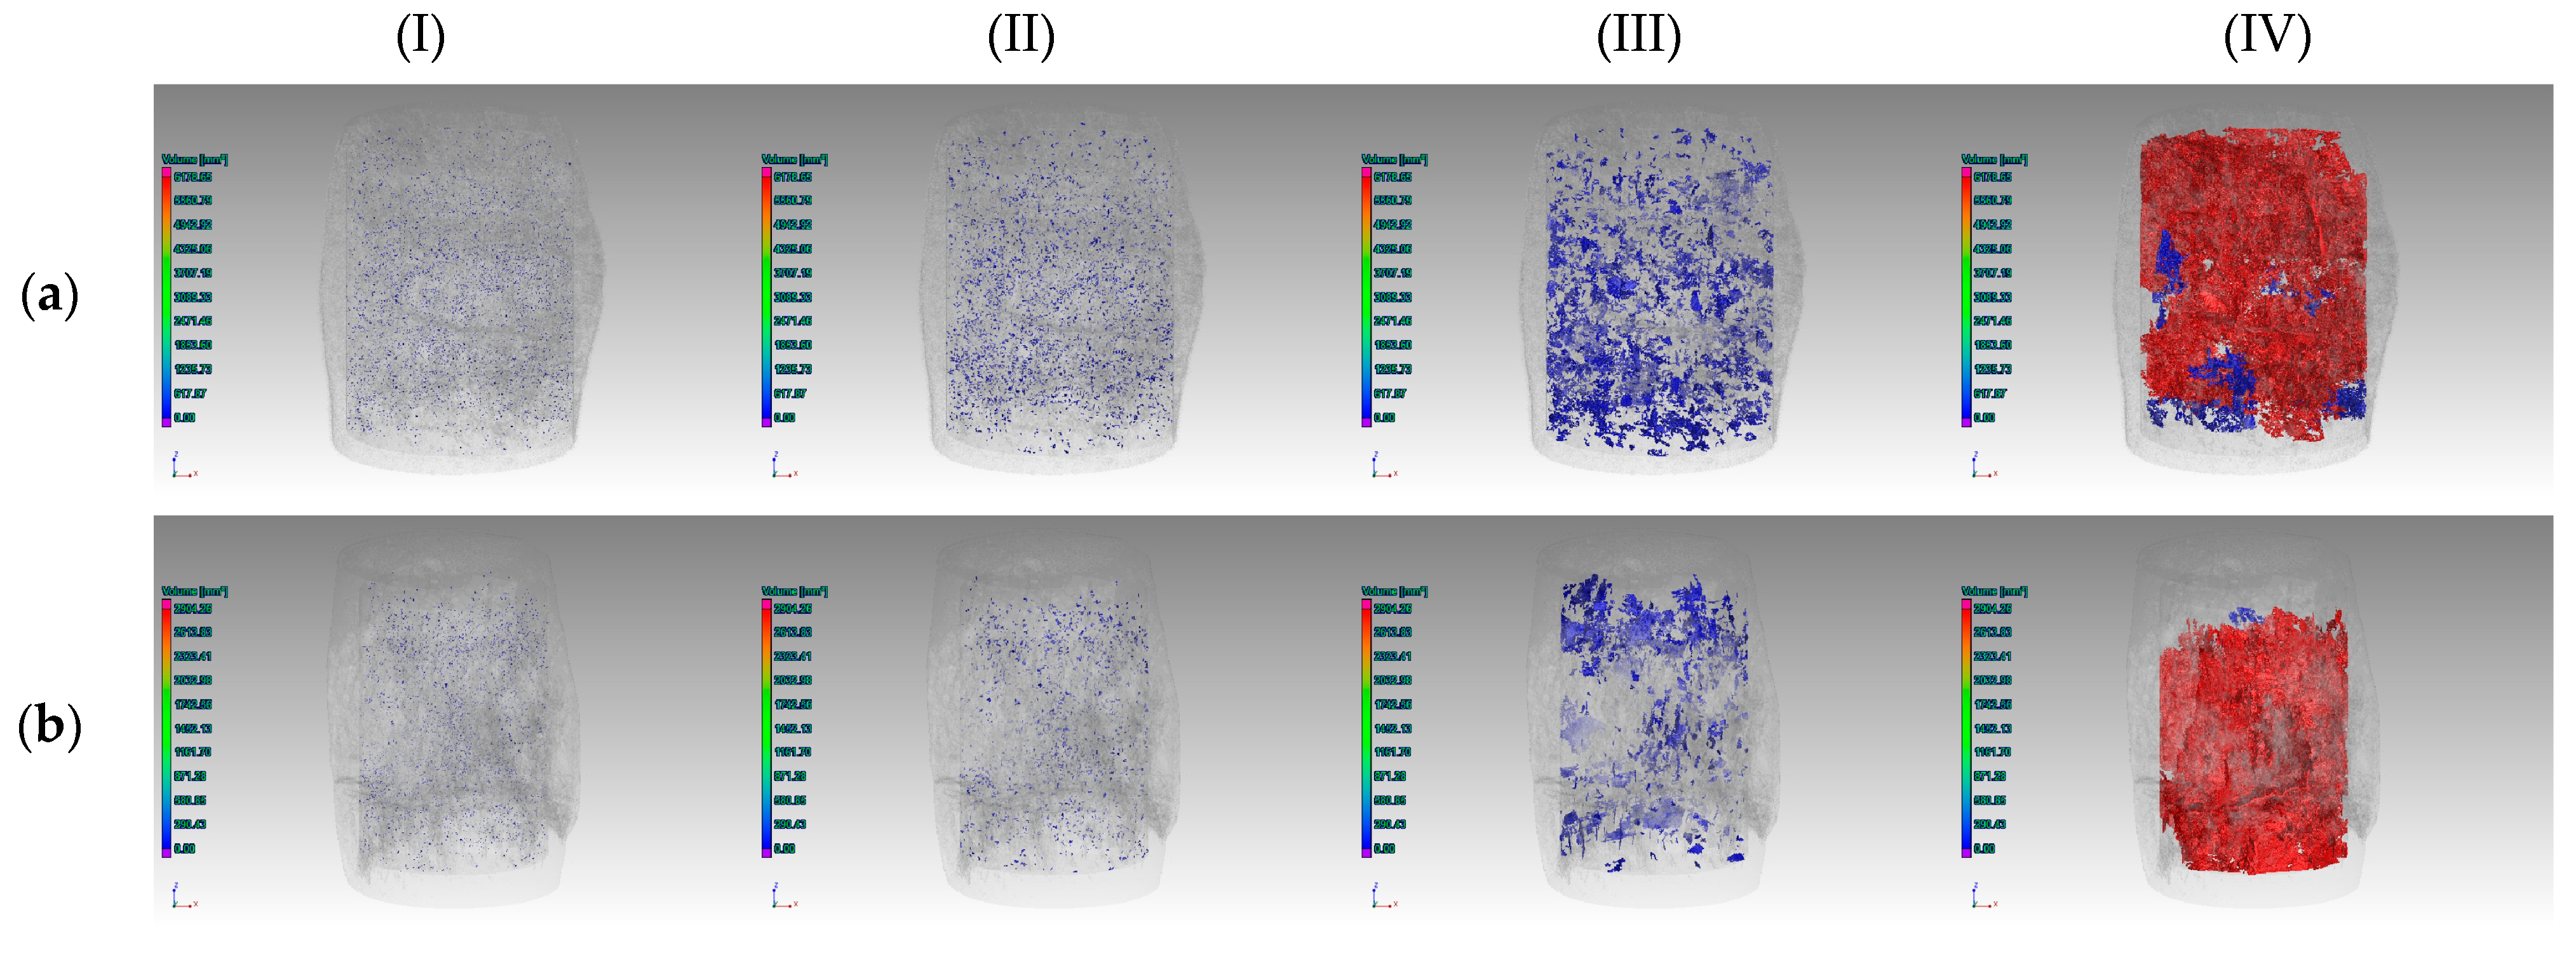
The three-dimensional spatial distributions of the cracks in the broken salt rock specimens under different confining pressures are analyzed (Figure 16). Notably, the pore volume approaches zero, and the crack voxels become invisible for some groups. Basically, the pore volume progressively decreases with an increase in the confining pressure. However, there are some remarkable differences between the cracks of different diameter ranges. Compared with the value of 5 MPa, the pore volume of group (IV) decreases largely at a confining pressure of 10 Mpa, and becomes invisible at confining pressures of 15 MPa and 20 MPa. However, this trend is different between group (I), group (II) and group (IV), as it becomes an “increasing–decreasing” trend with an increase in confining pressure.
Figure 17 shows the relationship between the pore volume and confining pressure for groups of different crack diameter ranges. For macro-cracks whose crack diameters exceed 10 mm, while the pore volume is 6307.01 mm3 at a confining pressure of 5 MPa, this volume decreases by 94.34% at a confining pressure of 10 MPa. However, the pore volumes are relatively close at confining pressures of 10 MPa, 15 MPa and 20 MPa, indicating that 10 MPa might be the critical confining pressure for pure salt rock, which is in agreement with the conclusions summarized from the aforementioned stress–strain curves. For minor crack range groups, i.e., group I, group II and group III, we can see that with an increase in the crack diameter, the pore volume increases at a confining pressure of 5 Mpa, but decreases at a confining pressure of 20 MPa.
As shown in Figure 15, there is a strong correlation between the total pore volume and the permeability of the broken salt rock. The total pore volume decreases with an increase in confining pressure, consequently decreasing the permeability. The trend for the cracks of group (IV) shows a similar evolutionary pattern between the total pore volume and rock permeability, while group (I), group (II) and group (III) are very different, indicating that that particular rock permeability is strongly related to macro-cracks, but weakly related to micro-cracks. The bigger the pore volume of the large cracks is, the higher the rock permeability will be.

5.2. Impurity Effects

The CT scanning results shown in Figure 18 offer a more straightforward and elaborate view of the deformation characteristics and internal rock cracks in fractured salt rock specimens. Corresponding to the aforementioned failure characteristics of salt rock, the lateral swelling progressively fades with increasing impurity content, and a macroscopic shear failure surface is observed on the salt-bearing sedimentary rock. While the pore volume in group I, group II and group III is relatively smaller, and seems irrelevant to the impurity content, the pore volume of group IV is much larger.
While the relationships between pore volume and impurity shows an “increasing–decreasing” trend in group I, group II and group IV, a continuously decreasing trend is observed in group III (Figure 19). The aforementioned experimental results revealed that the pore volume of large cracks is the dominant factor for rock permeability, which is also observed in the salt rock with a lower impurity content (SR-5 and SR-6). However, as the permeability of salt-bearing sedimentary rock is the highest, its pore volume for large cracks is the smallest, indicating an interesting relationship between pore volume and rock permeability. In combination with the rock failure characteristics in Figure 9, we can see that the salt bearing sedimentary rock specimen is fully fractured, while the other three are not. Therefore, it can be inferred that the connectivity of the cracks of salt rock with higher impurity content might be much higher than that of the other specimens, causing the gas to flow more smoothly in the rock. Although this viewpoint is in agreement with the Kozeny–Carman theory [43,44], it still requires further investigation and verification, for instance, determining the aperture of the pores and constants in the K–C equation.

5.3. End Effects

As mentioned above, the volume of large cracks is a dominant factor for rock permeability. However, for soft rocks, the end effect causes a considerable lateral swelling in the middle section of salt rocks and a small lateral deformation at both ends [45,46]. This indicates that there may be no damage or a small damage zone at both ends of the salt rock, where only a small number of micro-fissures exist, which prevents the gas from flowing upstream to downstream. The CT images and the sector area addressed by the red dashed lines in Figure 20 evidence the existence of a block zone at the ends of the pure salt samples. In the presence of the block zone, the apparent recorded permeability cannot represent the real permeability of broken salt rocks.

6. Conclusions

Based on the overburden osmometer and hydromechanical testing platform, a comprehensive investigation of the mechanical properties and permeability characteristics of salt rocks was conducted, considering the effects of both confining pressure and impurity content. Further, the pore volume of the four different groups was divided according to the crack diameter range, and was analyzed using CT equipment. The primary conclusions are summarized as follows:
(1) The triaxial compression strength of salt rock progressively increases with an increase in impurity content. The failure mode transforms from tensile–shear failure to ductile failure with an increase in confining pressure. However, impurity significantly increases the brittleness of salt rock, as the failure mode gradually changes to shear failure with a single shear crack.
(2) Rock porosity and permeability decrease with an increase in confining pressure, and decrease in impurity content. Similar results were obtained from the permeability test in the triaxial compression test, as the permeability during the whole compression process increased, with a decrease in the confining pressure and an increase in impurity content. Those results indicate that both the burying depth and impurity content of salt mines are important factors when selecting strata as potential site for a salt cavern in China.
(3) A power function formula can be established to express the relationships between porosity, permeability and confining pressure. Accordingly, variables A and B of the formula, i.e., Equation (2), were analyzed while considering the impurity content. The values of A for both porosity and permeability gradually increased, while the values of B showed a decreasing trend.
(4) Based upon the CT images and analysis, the cracks are divided into four groups according to crack diameter. The relationships between the permeability and pore volume of different groups were analyzed, indicating that the rock permeability is strongly related to the volume of macro-cracks. The pore volume of the broken pure salt rock decreases with an increase in confining pressure, indicating that the confining pressure restrains the initiation and propagation of cracks. Consequently, the permeability of pure salt rock decreases with an increase in confining pressure.

Author Contributions

All the authors have contributed a lot of efforts to this article. Conceptualization, Q.Z. and J.L.; methodology, H.Z. and Q.Z.; validation, Q.Z., L.W. and H.X.; investigation, Q.Z.; data curation, H.L.; writing—original draft preparation, Q.Z.; writing—review and editing, M.L.; supervision, J.L.; project administration, J.L.; funding acquisition, J.L. All authors have read and agreed to the published version of the manuscript.

Funding

This research was financially supported by the National Natural Science Foundation of China (Grant No.51874202) and the Sichuan Youth Fund (Grant No. 2017JQ0003). The authors would also like to express our deep appreciation for the support from the Ten Thousands Plan Youth Top Project proposed by the Organization Department of the Central Committee of the CPC, and the help from the State Key Laboratory of Hydraulics and Mountain River Engineering.

Conflicts of Interest

The authors declare no conflicts of interest in this paper.

References

  1. Hesser, J.; Kaiser, D.; Schmitz, H.; Spies, T. Measurements of Acoustic Emission and Deformation in a Repository of Nuclear Waste in Salt Rock. Eng. Geol. 2015, 6, 551–554. [Google Scholar] [CrossRef]
  2. Paul, B.; Shao, H.; Hesser, J.; Lege, C. In Situ Quantification of Hydrocarbon in an Underground Facility in Tight Salt Rock. Eng. Geol. 2015, 6, 893–896. [Google Scholar] [CrossRef]
  3. Mahmoudi, E.; Khaledi, K.; Miro, S.; König, D.; Schanz, T. Probabilistic Analysis of a Rock Salt Cavern with Application to Energy Storage Systems. Rock. Mech. Rock. Eng. 2017, 50, 139–157. [Google Scholar] [CrossRef] [Green Version]
  4. Hou, Z.; Lux, K.H. A new coupling concept for the hydro-Mechanical interaction of clay stone and rock salt in underground waste repositories. Int. J. Rock Mech. Min. 2004, 41, 708–713. [Google Scholar] [CrossRef]
  5. Liu, J.; Xie, H.; Hou, Z.; Yang, C.; Chen, L. Damage evolution of rock salt under cyclic loading in uniaxial tests. Acta Geotech. 2014, 9, 153–160. [Google Scholar] [CrossRef]
  6. Bérest, P.; Brouard, B.; Djakeun-Djizanne, H.; Hévin, G. Thermomechanical effects of a rapid depressurization in a gas cavern. Acta Geotech. 2014, 9, 181–186. [Google Scholar] [CrossRef]
  7. Lux, K.H. Design of salt caverns for the storage of natural gas, crude oil and compressed air: Geo-Mechanical aspects of construction, operation and abandonment. Geol. Soc. Lond. Spec. Publ. 2019, 313, 93–128. [Google Scholar] [CrossRef]
  8. Chan, K.S.; Bodner, S.R.; Fossum, A.F.; Munson, D.E. A constitutive model for inelastic flow and damage evolution in solids under triaxial compression. Mech. Mater. 1992, 14, 1–14. [Google Scholar] [CrossRef]
  9. Zhou, H.W.; Wang, C.P.; Mishnaevsky, L.; Duan, Z.Q.; Ding, J.Y. A fractional derivative approach to full creep regions in salt rock. Mech. Time-Depend. Mat. 2013, 17, 413–425. [Google Scholar] [CrossRef]
  10. Mansouri, H.; Ajalloeian, R. Mechanical behavior of salt rock under uniaxial compression and creep tests. Int. J. Rock Mech. Min. 2018, 110, 19–27. [Google Scholar] [CrossRef]
  11. Mikhailov, D.; Zhvick, V.; Ryzhikov, N.; Shako, V. Modeling of Rock Permeability Damage and Repairing Dynamics Due to Invasion and Removal of Particulate from Drilling Fluids. Transp. Porous Med. 2018, 121, 37–67. [Google Scholar] [CrossRef]
  12. Rahimi, S.; Hossein, M. Laboratory studies of creep behavior on thick-Walled hollow cylindrical salt rock specimens. Arab. J. Geosci. 2015, 8, 5949–5957. [Google Scholar] [CrossRef]
  13. Roberts, L.A.; Buchholz, S.A.; Mellegard, K.D.; Düsterloh, U. Cyclic Loading Effects on the Creep and Dilation of Salt Rock. Rock Mech. Rock Eng. 2015, 48, 2581–2590. [Google Scholar] [CrossRef]
  14. Düsterloh, U.; Lerche, S.; Lux, K.-H. Damage and Healing Properties of Rock Salt: Long-Term Cyclic Loading Tests and Numerical Back Analysis. Clean Energy Systems in the Subsurface: Production, Storage and Conversion. In Springer Series in Geomechanics and Geoengineering; Hou, M., Xie, H., Eds.; Springer: Berlin, German, 2013; pp. 341–362. [Google Scholar] [CrossRef]
  15. Fisher, R.S.; Hovorka, S.D. Relations between bromide content and depositional processes in bedded halite, Permian San Andres Formation, Palo Duro Basin, Texas. Carbonate Evaporite 1987, 2, 67. [Google Scholar] [CrossRef]
  16. Hansen, F.D.; Senseny, P.; Pfeifle, T.; Vogt, T. Influence of impurities on the creep of salt from the Palo Duro Basin. In the 29th US Symposium on Rock Mechanics (USRMS); A.A. Balkema Plubishers: Rotterdam, The Netherlands, 1987; pp. 199–206. [Google Scholar]
  17. Bruno, M.S. Geomechanical analysis and design considerations for thin-bedded salt caverns. In Office of Scientific and Technical Information Technical Reports; U.S. Department of Energy Office of Scientific and Technical Information: Oak Ridge, TN, USA, 2005. [Google Scholar] [CrossRef] [Green Version]
  18. Xing, W.; Zhao, J.; Düsterloh, U.; Hou, Z.M.; Xie, H.P.; Liu, J.F. Experimental study of mechanical and hydraulic properties of bedded rock salt from the Jintan location. Acta Geotech. 2014, 9, 145–151. [Google Scholar] [CrossRef]
  19. Zhang, G.; Li, Y.; Yang, C.; Daemen, J. Stability and tightness evaluation of bedded rock salt formations for underground gas/oil storage. Acta Geotech. 2014, 9, 161–179. [Google Scholar] [CrossRef]
  20. Wang, G.; Xing, W.; Hou, Z.; Were, P. Influence of water-Insoluble content on the short-Term strength of bedded rock salt from three locations in China. Environ. Earth Sci. 2015, 73, 6951–6963. [Google Scholar] [CrossRef]
  21. Liang, W.; Yang, C.; Zhao, Y.; Desseault, M.B.; Liu, J. Experimental investigation of mechanical properties of bedded salt rock. Int. J. Rock Mech. Min. 2007, 44, 400–411. [Google Scholar] [CrossRef]
  22. Li, Y.; Liu, W.; Yang, C.; Daemen, J.J.K. Experimental investigation of mechanical behavior of bedded rock salt containing inclined interlayer. Int. J. Rock Mech. Min. 2014, 69, 39–49. [Google Scholar] [CrossRef]
  23. Wang, L.; Liu, J.; Xu, H.; Xu, Y. Research on Confining Pressure Effect on Mesoscopic Damage of Rock Salt Based on CT Scanning. In Proceedings of the Geo-Shanghai 2018 International Conference: Rock Mechanics and Rock Engineering, Singapore, 27–30 May 2018; pp. 254–262. [Google Scholar] [CrossRef]
  24. Liang, W.G.; Xu, S.; Zhao, Y. Experimental Study of Temperature Effects on Physical and Mechanical Characteristics of Salt Rock. Rock Mech. Rock Eng. 2006, 39, 469–482. [Google Scholar] [CrossRef]
  25. Zong, X.L. Effect of Impurities on Engineering Mechanical Properties of Salt Rock. Ph.D. Thesis, Institute of Rock and Soil Mechanics, Wuhan, China, 2013. (In Chinese). [Google Scholar]
  26. Sun, H.X.; Wang, G.; Hou, Z.; Liu, J. Experimental study on the permeability characteristics of impure rock salt. Chin. J. Rock Mech. Eng. 2017, 36, 2424–2430. (In Chinese) [Google Scholar] [CrossRef]
  27. Xu, Y.M.D.; Liu, J.; Xu, H.; Zou, H.; Hu, C.; Li, J. Experimental study of permeability of salt rock with impurities in whole process of loading. Rock Soil Mech. 2017, 38, 402–408. (In Chinese) [Google Scholar] [CrossRef]
  28. Zeng, Y. Study on penetration characteristics and mesoscopic features of impurity salt rock during loading process. Adv. Eng. Sci. 2019, 51, 85–91. (In Chinese) [Google Scholar] [CrossRef]
  29. Kovari, K. Suggested methods for determining the strength of rock materials in triaxial compression: Revised version. Int. J. Rock Mech. Min. Geomech. Abstr. 1983, 20, 285–290. [Google Scholar] [CrossRef]
  30. Xiang, G.; Liu, J.; Zou, H.; Xu, Y.; Deng, C.; Wu, C. Study of damage recovery of salt rock under confining pressures. Adv. Eng. Sci. 2017, 49, 135–140. (In Chinese) [Google Scholar] [CrossRef]
  31. Liu, Q.; Zhang, K.; Zhou, H.; Cheng, Y.; Zhang, H.; Wang, L. Experimental investigation into the damage-Induced permeability and deformation relationship of tectonically deformed coal from Huainan coalfield, China. J. Nat. Gas. Sci. Eng. 2018, 60, 202–213. [Google Scholar] [CrossRef]
  32. Fedor, F.; Hámos, G.; Jobbik, A.; Máthé, Z.; Somodi, G.; Szűcs, I. Laboratory pressure pulse decay permeability measurement of Boda Claystone, Mecsek Mts., SW Hungary. Phys. Chem. Earth. 2008, 33, 45–53. [Google Scholar] [CrossRef]
  33. Ghabezloo, S.; Sulem, J.; Saint-Marc, J. Evaluation of a permeability–Porosity relationship in a low-Permeability creeping material using a single transient test. Int. J. Rock. Mech. Min. 2009, 46, 761–768. [Google Scholar] [CrossRef] [Green Version]
  34. Metwally, Y.M.; Sondergeld, C.H. Measuring low permeabilities of gas-Sands and shales using a pressure transmission technique. Int. J. Rock Mech. Min. 2011, 48, 1135–1144. [Google Scholar] [CrossRef]
  35. Mokhtari, M.; Tutuncu, A.N. Characterization of anisotropy in the permeability of organic-rich shales. J. Petro. Sci. Eng. 2015, 133, 496–506. [Google Scholar] [CrossRef]
  36. Zhao, Y.; Zhang, L.; Wang, W. Transient pulse test and morphological analysis of single rock fractures. Int. J. Rock Mech. Min. 2017, 91, 139–154. [Google Scholar] [CrossRef]
  37. Brace, W.F.; Walsh, J.B.; Frangos, W.T. Permeability of granite under high pressure. J. Geophys. Res. 1968, 73, 2225–2236. [Google Scholar] [CrossRef]
  38. Wang, H.; Xu, W.; Shao, J.; Skoczylas, F. The gas permeability properties of low-Permeability rock in the process of triaxial compression test. Mater. Lett. 2014, 116, 386–388. [Google Scholar] [CrossRef]
  39. Patsoules, M.G.; Cripps, J.C. An Investigation of the Permeability of Yorkshire Chalk under Differing Pore Water and Confining Pressure Conditions. Energ. Sources 1982, 6, 321–334. [Google Scholar] [CrossRef]
  40. Guo, X.; Zou, G.; Wang, Y.; Wang, Y.; Gao, T. Investigation of the temperature effect on rock permeability sensitivity. J. Petrol. Sci. Eng. 2017, 156, 616–622. [Google Scholar] [CrossRef]
  41. Wang, H.; Xu, W.; Zou, J. Compact rock material gas permeability properties. Phys. B Condens. Matter. 2014, 449, 10–18. [Google Scholar] [CrossRef]
  42. Popp, T.; Kern, H.; Schulze, O. The evolution of dilatancy and permeability in rock salt during hydrostatic compaction and triaxial deformation. J. Geophys. Res. 2001, 106, 4061–4078. [Google Scholar] [CrossRef]
  43. Kozeny, J. Uber kapillare Leitung des Wassers in Boden, Sitzungsber Akad. Wiss. Wien. 1927, 136, 271–306. [Google Scholar]
  44. Carman, P.C. Permeability of saturated sands, soils and clays. J. Agr. Sci.-Camb. 1939, 29, 263–273. [Google Scholar] [CrossRef]
  45. Mogi, K. Experimental Rock Mechanics; Taylor and Francis: London, UK, 2007. [Google Scholar]
  46. Feng, X.T.; Zhang, X.; Yang, C.; Kong, R.; Liu, X.; Peng, S. Evaluation and reduction of the end friction effect in true triaxial tests on hard rocks. Int. J. Rock Mech. Min. 2017, 97, 144–148. [Google Scholar] [CrossRef]
Figure 1. Salt rock specimens with different impurity contents. (a) Pure salt rock; (b) Salt rock with low impurity content; (c) Salt rock with medium impurity content; (d) Salt bearing sedimentary rock samples.
Energies 13 01366 g001
Figure 2. X-ray diffraction (XRD) analysis results of the salt rock specimens with different impurity contents. (a) Pure salt rock; (b) Salt rock with low impurity content; (c) Salt rock with medium impurity content; (d) Salt bearing sedimentary rock samples.
Energies 13 01366 g002
Figure 3. Density of the salt rock specimens versus impurity content.
Energies 13 01366 g003
Figure 4. Experimental testing equipment. (a) Schematic diagram of the testing system. (b) Hydromechanical coupling testing machine. (c) Rock specimen installation. (d) X-ray microfocus Computed Tomography (CT) system. (e) Overburden permeameter.
Energies 13 01366 g004
Figure 5. Stress–strain curves of salt rock under different confining pressures.
Energies 13 01366 g005
Figure 6. Pure salt rock after failure. (a) σ3 = 5 MPa (SR-1); (b) σ3 = 10 MPa (SR-5); (c) σ3 = 15 MPa (SR-6); (d) σ3 = 20 MPa (SR-7).
Energies 13 01366 g006
Figure 7. Stress–strain curves and peak stress points of salt rock with different impurity contents (σ3 = 5 MPa).
Energies 13 01366 g007
Figure 8. Mechanical parameters versus impurity content. (a) σc: Peak strength; (b) ε1c: Axial strain at peak stress; (c) Ec: Secant modulus.
Energies 13 01366 g008
Figure 9. Salt rock specimens after failure. (a) ω = 3.00% (SR-1); (b) ω = 13.07% (SR-2); (c) ω = 39.16% (SR-3); (d) ω = 60.02% (SR-4).
Energies 13 01366 g009
Figure 10. Permeability and porosity versus hydrostatic pressure. (a) ω = 3.00% (SR-1); (b) ω = 13.07% (SR-2); (c) ω = 39.16% (SR-3); (d) ω = 60.02% (SR-4).
Energies 13 01366 g010aEnergies 13 01366 g010b
Figure 11. The values of A and B for porosity and permeability versus impurity content. (a) values for porosity; (b) values for permeability.
Energies 13 01366 g011
Figure 12. Permeability evolution of the pure salt rock under a different confining pressure.
Energies 13 01366 g012
Figure 13. Stress and permeability versus axial strain. (a) ω = 3.00% (SR-1); (b) ω = 13.07% (SR-2); (c) ω = 39.16% (SR-3); (d) ω = 60.02% (SR-4).
Energies 13 01366 g013aEnergies 13 01366 g013b
Figure 14. The permeability–stress ratio curves of the salt rocks with different impurity contents.
Energies 13 01366 g014
Figure 15. Definition of crack diameters in the CT analysis.
Energies 13 01366 g015
Figure 16. Crack analysis of pure salt after failure under different confining pressures. (a) σ3 = 5 MPa (SR-1); (b) σ3 = 10 MPa (SR-5); (c) σ3 = 15 MPa (SR-6); (d) σ3 = 20 MPa (SR-7).
Energies 13 01366 g016
Figure 17. Crack analysis of pure salt after failure under different confining pressures. (a) dc < 0.05 mm, 0.05 ≤ dc < 1 mm, and 1 ≤ dc < 10 mm; (b) dc ≥ 10 mm; (c) Permeability and total pore volume versus confining pressure.
Energies 13 01366 g017
Figure 18. Crack analysis of pure salt after failure under different impurity contents. (a) ω = 3.00% (SR-1); (b) ω = 13.07% (SR-2); (c) ω = 39.16% (SR-3); (d) ω = 60.02% (SR-4).
Energies 13 01366 g018aEnergies 13 01366 g018b
Figure 19. A crack analysis of pure salt after failure with different impurity contents. (a) dc < 0.05 mm, 0.05 ≤ dc < 1 mm, and 1 ≤ dc < 10 mm; (b) dc ≥ 10 mm; (c) Permeability and total pore volume versus confining pressure.
Energies 13 01366 g019
Figure 20. CT images of broken pure salt rock specimens. (a) σ3 = 5 MPa; (b) σ3 = 10 MPa; (c) σ3 = 15 MPa; (d) σ3 = 20 MPa.
Energies 13 01366 g020
Table 1. Classification of salt rock with different impurity contents.
ClassificationPure Salt RockLow-Impure Salt Rock Middle-Impure Salt RockSalt Bearing Sedimentary Rock
Impurity content~5%5%–20%20%–50%50%–100%
Table 2. Salt rock specimens in this experiment.
Specimenσ3 (MPa)ωr (%)H (mm)D (mm)ρ (g/cm3)ωw (%)
SR-153.0075.3637.652.190.25
SR-2102.7576.0338.022.160.31
SR-3151.9876.1238.042.170.13
SR-4204.0275.7737.912.230.39
SR-5513.0775.8938.112.221.25
SR-6539.1676.1937.872.490.54
SR-8560.0275.9238.002.671.02
Note: ωr is the impurity content of salt rock, and ωw is the water content of the salt rock.