Abstract
Predicting the electrical breakdown of polymers is critical for certifying the endurance and lifetime of high voltage power equipment. Since various factors contribute nonlinearly to the breakdown phenomena of polymer insulators, it is difficult to assess the impact of each factor independently. In this study, we numerically analyzed the breakdown phenomenon because of the ramp rate of the DC voltage applied to a polymer insulator, low-density polyethylene (LDPE), using the finite element method (FEM). To predict the breakdown initiation, we analyzed the relaxation time of the conduction current through the insulator as a significant indicator. The bipolar charge transport (BCT) model was used to analyze the charge behavior within the LDPE, and the breakdown voltage was predicted by incorporating the molecular displacement model. This analysis was conducted for a wide range of ramp rates from 10 to 1500 V/s. The current density was calculated using two different methods, namely the energy and average methods, and the results were compared with each other. The results of the numerical model were further verified by comparing with those from experiments reported in the literature.
Keywords:
bipolar charge transport (BCT); breakdown; FEM; insulator; LDPE; molecular displacement; ramp rate 1. Introduction
In high voltage industry, insulators play an essential role in ensuring durability and extending the life of the electrical equipment [1,2,3]. The mechanisms of electrical failure of insulators are considerably different between DC and AC power systems [4]. Therefore, the breakdown is hard to predict owing to various factors such as morphology of the insulator [5], the amount of injected charge in the insulator and electrode interface characteristics, local electric field distortion due to accumulated space charge in the insulator, temperature gradient [6,7,8], thickness of the insulator [9,10,11], operating time, and waveform of the applied voltage [12]. These factors are nonlinearly involved in the breakdown phenomenon. Because of such complications, a statistical approach is required to predict the degradation performance and lifetime of the insulator before breakdown. Therefore, large quantities of experimental data need to be accumulated, and it is difficult to independently assess the effects of each variable related to the electrical breakdown.
As an alternative to the experimental approach, we proposed a numerical analysis model based on the finite element method (FEM) to predict the breakdown of a polymer insulator, low-density polyethylene (LDPE), and to analyze the effect of the ramp rate of the applied DC voltage. Using this numerical model, the electrical breakdown was systematically analyzed by combining the bipolar charge transport (BCT) model [13,14,15,16] with the molecular displacement model [9,17]. The BCT model describes the behaviors of charge carriers such as holes and electrons inside the insulator, and the molecular displacement model describes the displacement of the molecular chain caused by the trapped charges.
Here, we analyzed the breakdown strength of the LDPE for various ramp rates from 10 to 1500 V/s. This numerical model shows that the breakdown phenomenon diverges with the ramp rate when an electric field is applied to the micrometer-sized thin-film polymer insulator. Additionally, the current through the insulator was calculated using two different methods, namely the average and energy methods. Finally, we suggested a prediction method for the electrical breakdown of LDPE by analyzing the relationship between the relaxation time of the conduction current and the breakdown strength using the proposed numerical model. The numerical results were subsequently verified by comparing with experimental results from previously reported studies [18,19].
2. Numerical Analysis and Governing Equations
2.1. Charge Transport Model
The BCT model includes physical mechanisms such as injection, transportation, generation, and loss of the charge to analyze the discharge phenomenon in a solid insulator [20,21,22]. Equation (1) is the continuity equation for charge and current, including the generation and loss of charge carriers such as electrons and holes. Equation (2) describes the transportation of the charge by the applied electric field, and Equation (3) is the Poisson equation for electric potential and space charge density. Equation (4) represents the spatial integration of the electric field for calculating the electric potential.
where qfree and qtot are the free mobile charge density and total space charge density in the insulator, receptively, S(x,t) is the reaction term that includes the variance of the charge density due to the generation and recombination processes, jc is the conduction current density, μ0 is the mobility of free charge, E(x,t) is the electric field intensity, φ is the electric potential, ε0 is the permittivity of vacuum, and εr is the relative permittivity of the insulator. The total charge density is the sum of four kinds of charge carriers: mobile electrons, trapped electrons, mobile holes, and trapped holes. The permittivity of the LDPE insulator was set to 2.35. When a strong electric field is applied to an insulator, the charge is injected from the electrode into the insulator at room temperature (20–25 °C) via the Schottky thermionic emission or Fowler-Nordheim tunnel injection. However, the latter effect is only valid with an exceedingly strong electric field of about 109 V/m [23]. In our numerical model, the Schottky thermionic emission model was adopted for charge injection from the electrode into the insulator. This emission model can be explained with the effective barrier height ΦB between the electrode and the insulator, and the electric field strength at the electrode as:
where the subscripts (e) and (h) denote the electron and hole, respectively, jin(e) and jin(h) are the current densities due to the injected charge from the electrode by Schottky’s thermionic emission, ΦB(e) and ΦB(h) are the effective barrier heights between the electrode and the insulator at the anode and cathode, respectively. The injected charge should overcome this energy barrier in order to achieve a successful injection from the electrode into the insulator. A is the Richardson constant, with 1.20 × 10⁶ A/m2․K2, KB is the Boltzmann constant, T is the temperature, e is the unit charge, 1.6 × 10⁻¹⁹ C, and L is the total length of the insulator in the x-direction. E(0,t) is the electric field strength at the cathode where x = 0 and E(L,t) is the electric field strength at the anode where x = L.
Charges can transit within the insulator owing to the electric field, and they are trapped or can escape from the deep traps. These charges are subjected to diverse processes such as the injection, migration, trapping, and detrapping which are caused by the physical and chemical defects in the insulator as shown in Figure 1. Moreover, the recombination process is achieved by the union of electrons and holes, which have opposite polarities. In the BCT model discussed in this work, we assumed that the deep traps have a single energy level.
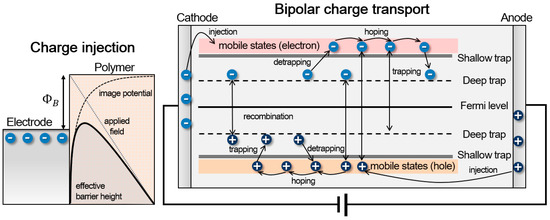
Figure 1.
Schematic of charge injection and transportation within the insulator.
The trapping probability, PT, is the probability that the charges are trapped in deep traps and represents how often the charges are captured in one second as
which is proportional to the mobility of the charge carriers and the distribution density of the traps, NT. Further, it is inversely proportional to the relative permittivity of the insulator εr. The probability of detrapping affects the trapped charge drifting back into the conduction band as
where νATE is the escape frequency expressed as kBT/h and ET is deep trap energy. After the detrapping process, the charges move in the direction of the electric field or vice versa to cause a drift current.
The recombination probability of free mobile charges is proportional to the sum of the mobilities of the electrons and holes. The Langevin-type recombination can express this electron-hole recombination process [24,25], and the recombination coefficients are a function of the mobilities of the charge carriers based on the Shockley-Read-Hall recombination model as:
where the subscript (μ) and (t) denote the mobile charges and trapped charges, respectively. Rμeμh is the recombination probability of free electrons and free holes. Rμeth and Rteμh represent the probabilities of the combination of free charges and trapped charges. These values are proportional to the mobility, density of trapped charge qtrap, and density of free charge qfree. The reaction terms can be expressed as:
where Sμe, Ste, Sμh, and Sth represent the reaction terms for the mobile electrons, trapped electrons, mobile holes, and trapped holes, respectively. To analyze the behaviors of the charges in the insulator using the BCT model, we used the coefficient values as summarized in Table 1. The coefficients can be categorized into four types and describe the injection barrier height that the charge should overcome before injection, mobility of the charge, deep trap energy of the charge carrier, and density of the deep trap [21].

Table 1.
Coefficients applied to the bipolar charge transport (BCT) model.
2.2. Molecular Displacement Model
Breakdown initiation in polymer-based insulators is embodied by the displacement of the molecular chain caused by the trapped charges in the amorphous region [9,27,29]. If the mobile charges are trapped in the defect of the molecular chains, the molecular chains are stretched in the direction of the electric field or vice versa. The displacement of the molecular chain can be described as [27]:
where λ is the displacement of the molecular chain, μmol is the mobility, and τmol is the relaxation time of the molecular chain. The threshold length is a critical distance that can cause electrical breakdown and is about 23 nm for LDPE. If the molecular displacement exceeds 23 nm, the electrical breakdown is triggered owing to electromechanical stress on the insulator. We analyzed the breakdown characteristics of LDPE at 296 K based on Equation (10). In our computation, we used 1.15 × 10⁶ s at 296 K for τmol and 1.65 × 10⁻¹⁸ m2/V·s for μmol.
2.3. Numerical Solving Procedure
This numerical analysis consists of two steps. The first step is calculating the electric field distribution within the insulator by taking into account the charge dynamics. Equations (1) and (2) demonstrate the behaviors of charges considering the injection, generation, recombination, and neutralization of the charges expressed by Equations (5)–(9) combined with Equations (3) and (4). In the second step, the electric field distribution is coupled with Equation (10) in the first step. Using these two steps, we analyze whether λ is stretched to the threshold length. Simultaneously, we analyzed the electric field strength and the charge distribution at that moment. In this study, the commercial program COMSOL Multiphysics 5.4 was used as it is based on the FEM.
3. Numerical Analysis Results
3.1. Charge Transport in Polymers
In this numerical model, the thickness of LDPE was set to 200 μm. The DC voltage was applied to the insulator until the voltage attained a maximum of 52 kV for a wide range of ramp rates of 10–1500 V/s. It took 5200 s with 10 V/s and 3.5 s with 1500 V/s to reach 52 kV. When the voltage reached 52 kV, it stopped increasing and remained constant at 52 kV. During the voltage is applied to the insulator, the charge carriers move away from one side of the electrode and exit toward the opposite electrode. The extraction barrier is not considered in this numerical model.
Figure 2 shows the distribution of the electric field strength with time when the ramp rate is 400 V/s. During the voltage is applied, charges with the same polarity as the electrodes are stacked on the edge of the insulator, and these charges lower the electric field. These homocharges accumulated near the electrodes play a positive role in increasing the breakdown voltage. As shown in Figure 3, the distribution of the electric field is depicted for various ramp rates: 100, 300, 500, and 700 V/s. The distribution of the electric field has a convex shape within the insulator. Figure 3a shows the electric field distribution according to the ramp rate after 100 s of applying the voltage. The maximum electric field Emax and the maximum electric field gradient (dE/dx)max also depend on the ramp rate. Figure 3b–d show the changes in a physical quantity related to the electric field when the applied voltage reaches 52 kV.
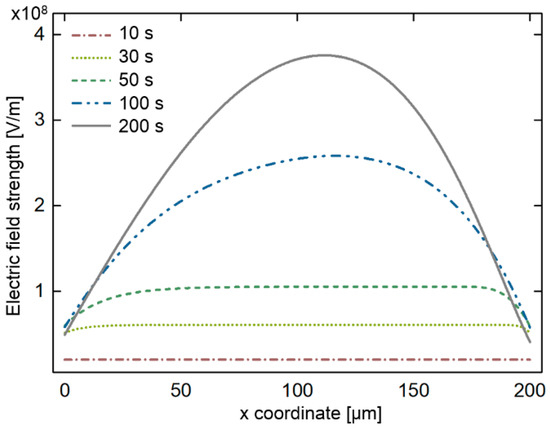
Figure 2.
Electric field distribution with ramp rate of 400 V/s.
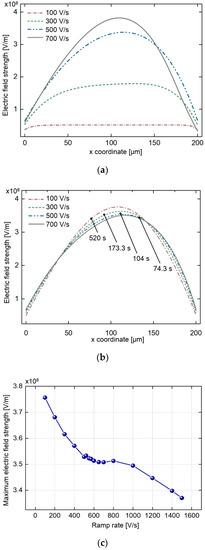
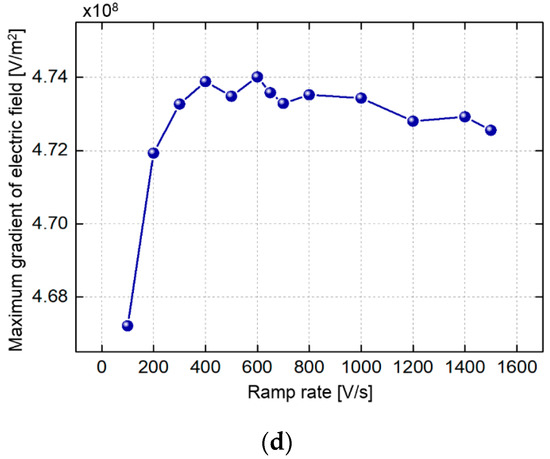
Figure 3.
Electric field distribution according to the ramp rate (100, 300, 500, and 700 V/s): (a) at t = 100 s; (b) when the applied voltage reaches 52 kV; (c) maximum electric field strength Emax versus ramp rate at 52 kV; (d) maximum electric field gradient (dE/dx)max versus ramp rate at 52 kV.
Figure 3b shows the electric field distribution according to the ramp rate. As depicted in Figure 3c, the higher the ramp rate, the lower is the Emax obtained. The relationship between the ramp rate and Emax includes an inflection point near 600 V/s. Figure 3d shows the (dE/dx)max with ramp rate. The region where the electric field has the maximum value is located near the electrode at x = 120 μm. Around this point, a large number of charges are easily trapped, and dE/dx alters dramatically. The (dE/dx)max increases with the ramp rate and then saturates after 600 V/s.
Figure 4 shows the space charge distributions for ramp rates of 100 and 700 V/s. The space charge distribution with time is depicted for 1, 5, 10, 20, and 30 min intervals. Depending on the ramp rate, there are differences in the time and amount of charge injected into the insulator. After 1 min of polarization time, the electrons are injected from the anode, and the holes are injected from the cathode at the applied voltage of 500 V, as shown in Figure 4a. In particular, as the polarization time progresses, the electrons are transported at a rate ten times faster than holes. Charges are captured in the deep trap while traveling inside the insulator. Further, the stacked charge decreases the effective barrier height at the electrode simultaneously. The applied voltage continuously increases and the number of holes injected from the anode continuously increases with time, before saturation time at 20 min. Electrons are continuously injected from the cathode, and the recombination occurs actively in the central region of the insulator. The trapping process for charges is active near the anode, where positive charges are mainly stacked. After 30 min, a large number of electrons are still injected from the cathode, and these charges are trapped near the cathode. The holes thus dominantly determine the distribution of the electric field. Hence, the space charge distribution near the cathode is stabilized quicker than that near the anode. The electric field and space charge distribution become more stable after 30 min.
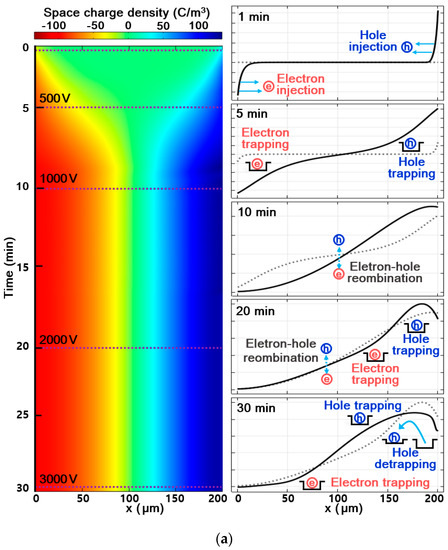
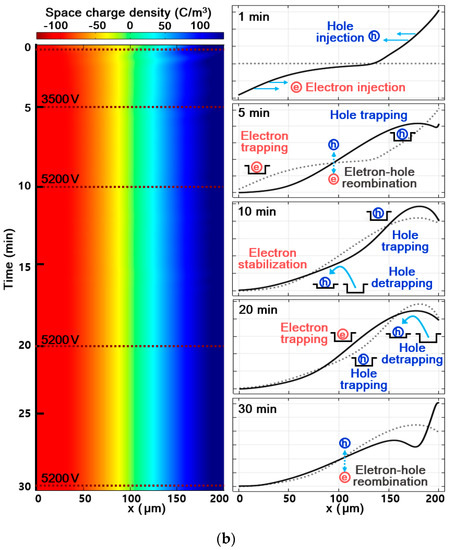
Figure 4.
Space charge distributions and transport mechanisms according to ramp rate: (a) 100 V/s; (b) 700 V/s.
Figure 4b shows the space charge distribution with time when the ramp rate is 700 V/s. The injection and transport processes are accelerated compared to those at 100 V/s, so large quantities of electrons and holes move across the insulator at high speed. Thus, electrons and holes are encountered faster and more often. As the polarization time progresses, a large number of holes are transported across the insulator and the recombination process occurs more often compared to that at the lower ramp rate. As the ramp rate is 700 V/s, the charge distribution near the cathode is stabilized in a shorter time than that for 100 V/s, i.e., 10 min. Moreover, recombination occurs actively biased near the anode rather than at the center of the insulator. The ramp rate plays a critical role in accelerating the injection and transport mechanism. The distribution of holes is more susceptible to the ramp rate than for electrons because most electrons pass through the insulator quickly rather than alter the electric field distribution. At higher ramp rate, more charges are injected into the insulator, and the charges quickly pass through the insulator. Hence, the charges reach a stable state in a shorter time. At lower ramp rate, the electric field is applied slowly and with sufficient time, and the accumulated space charge increases inside the insulator. Moreover, the charges are trapped rather than passing through the insulator. Consequently, different ramp rates change the behavior and distribution of the space charge.
3.2. Current Density Calculation
The current density through the insulator reflects the appearance of the charge distribution in real-time. Moreover, it is the most empirical physical quantity that can be compared with the actual experimental results. The current density can be calculated in this numerical model using two methods. The first method is the average method expressed as Equation (11), which is calculated by integrating the current density over the entire region of the insulator. The second method is the energy method expressed as Equation (14), which is derived from the Poynting theory. In this study, both current calculation methods were used for analyzing the terminal current density through the insulator for various ramp rates.
3.2.1. Average Method
The total current density is the sum of the conduction current density and displacement current density as [6,21,24,30,31,32]:
where Jcond is the total conduction current density, Jh is the conduction current density produced by the movement of free holes, and Je is the conduction current density produced by the movement of free electrons. The conduction current density is the product of free charge density, mobility, and electric field. Jdis is the displacement current density. In the average method, the total current density can be calculated by integrating over the entire insulator area in the x-direction.
3.2.2. Energy Method
In the energy method, the terminal current is derived from Poynting theory and calculated by the volume integration of the power and energy densities over the entire space with the quasi-static field approximation as [33,34,35]
where μ is the magnetic permeability and H is the magnetic field intensity. The power loss is calculated as the inner product of the electric field and the conduction current density. As shown in Equation (13), the calculated terminal current is the total current passing through the insulator.
3.2.3. Comparison between Average Method and Energy Method
Figure 5 shows the current density obtained using the two approaches with various ramp rates: 100, 300, 500, and 700 V/s. These two current densities have similar profiles such as maximum value and variation over time. When the ramp rate is 100 V/s, the total current gradually approaches the maximum value at around 500 s. After 500 s, the electrons and holes are trapped and undergo the recombination process, where the current density decreases drastically and reaches the steady-state value. At that moment, only the conduction current component remains. It takes about 8 s for the electrons to pass through the insulator and about 80 s for the holes. The charge migration rate, which represents the conductivity of the insulator, is about 5 × 10⁻¹⁴ S/m.
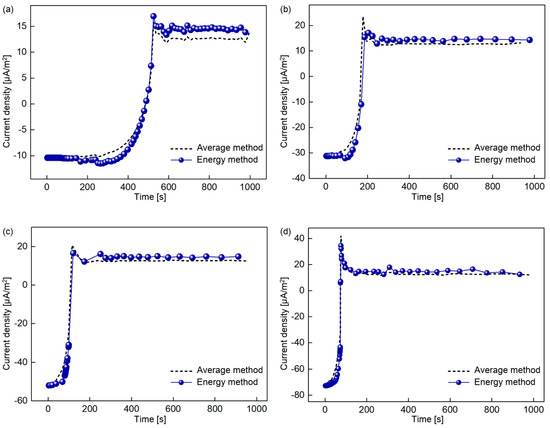
Figure 5.
Comparison of average and energy methods according to ramp rate: (a) 100 V/s; (b) 300 V/s; (c) 500 V/s; (d) 700 V/s.
Figure 6 shows that the maximum current density according to the ramp rate. The maximum current density increases approximately linearly with the ramp rate. The higher ramp rate causes a large current density peak because large amounts of charge pass through simultaneously the cross-section of the insulator at high-speed. At a low ramp rate, the charges move slowly, and charges are trapped in the deep traps with a higher probability. Thus, sufficient time is required to reach a stable space charge distribution at a low ramp rate. Whereas, with the higher the ramp rate, the conduction current saturates faster as depicted in Figure 5. As mentioned above, the conduction current density is a significant physical quantity that describes the behavior of the mobile charge. Therefore, we analyzed the conduction current density as a physical indicator for predicting the breakdown.
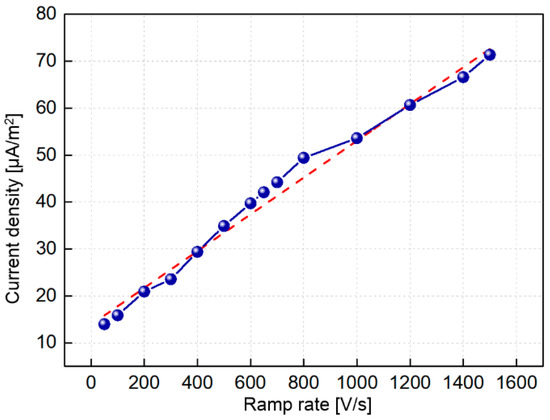
Figure 6.
Maximum current density according to the ramp rate (10–1500 V/s).
Figure 7 shows the conduction current density in the log scale with time according to the ramp rate for 100–400 V/s with the trend function, y = y0 + A1 e−x/t1. The change of the variables, y0, A1, and t1 according to the ramp rate is shown in Figure 8. A1 is in the range −4.60821 to 8.16229 and y0 is in the range of 0.5 to 1.3 as shown in Figure 8a. t1 changes noticeably depending on the ramp rate as shown in Figure 8b. Further, t1 exponentially decreases as the ramp rate increases. In the trend function, t1 is related to the relaxation time for the conduction current.
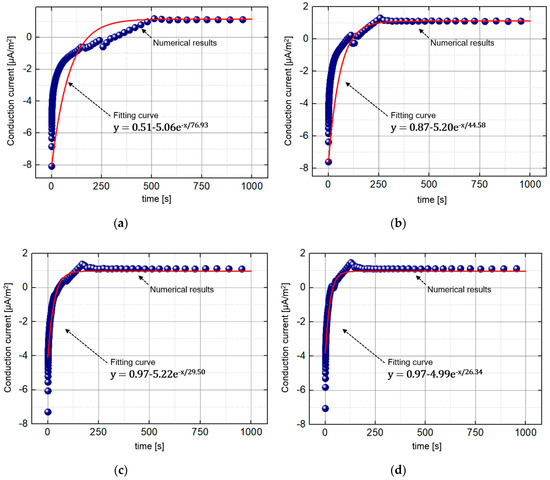
Figure 7.
Trends of the conduction current density according to ramp rate: (a) 100 V/s; (b) 200 V/s; (c) 300 V/s; (d) 400 V/s.
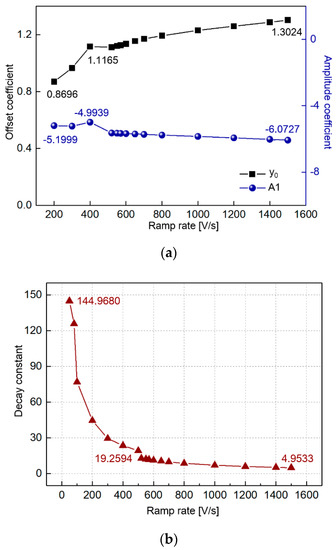
Figure 8.
Change of coefficients of the trend functions according to the ramp rate: (a) y0, A1; (b) t1.
3.3. Breakdown Prediction with Molecular Displacement
Figure 9 shows the displacement of the molecular chain when the ramp rate is 400 V/s. The speed of the molecular chain is proportional to the local electric field strength expressed in Equation (10). By comparing Figure 3 and Figure 9, the largest λ is observed to locate where the electric field is the strongest. This region locates near the center of the insulator, and x is around 120 μm. In this region, the polarity of the space charge distribution is reversed, and the free mobile charges pass rapidly because of the strong electric field. Moreover, the recombination process occurs actively in this region.
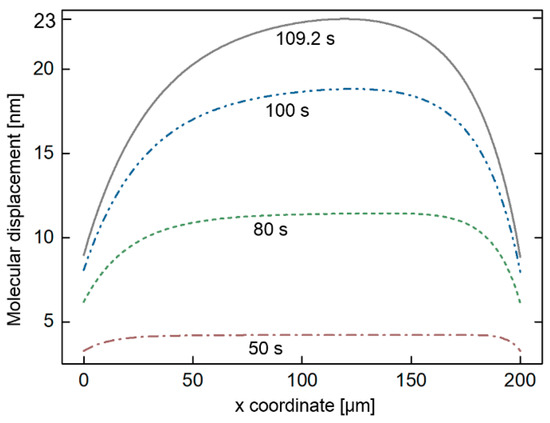
Figure 9.
Displacement (nm) of the molecular chain for 400 V/s with time.
When the ramp rate is 400 V/s, as shown in Table 2, λ reaches 23 nm at 109.25 s. The length of 23 nm is the critical threshold for LDPE. If λ is stretched more than 23 nm, the molecular chain starts to crack which can lead to the breakdown due to electromechanical stress. Therefore, λ can be utilized to decide the breakdown voltage and breakdown strength. Depending on the ramp rate, the breakdown voltage and breakdown strength are numerically calculated as shown in Table 2. In Figure 10, the inflection point appears where the ramp rate is 600 V/s. As the ramp rate increases, both the breakdown voltage and the breakdown strength increase, and that are similar to the experimental results reported in the literature [18,19,36].
Table 2.
Breakdown strength and breakdown time according to ramp rate.
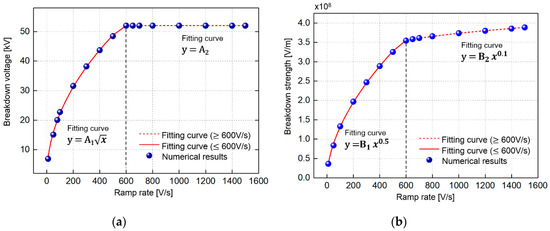
Figure 10.
Breakdown tendency according to ramp rate: (a) Breakdown voltage (kV); (b) breakdown strength (V/m).
Figure 10a shows the breakdown voltage according to the ramp rate. When the electrical breakdown starts before the applied voltage reaches 52 kV, the inclination of the breakdown voltage follows the power-law trend. Before the inflection point, the breakdown voltage increases with the ramp rate. When the ramp rate exceeds 600 V/s, the breakdown voltage remains at 52 kV and only the breakdown initiation time changes. As shown in Table 2, with the higher the ramp rate, the earlier breakdown is occurred. When the ramp rate is higher than 600 V/s, a different situation is observed compared to that at lower ramp rates. Figure 10b shows the breakdown strength according to the ramp rate. Similar to Figure 10a, breakdown strength increases gradually by following the power-law with different two multipliers. These multipliers changes at the 600 V/s that is the criterion. When the ramp rate is lower than 600 V/s, both the breakdown voltage and breakdown strength increase moderately according to the square root law of the ramp rate. When the ramp rate is higher than 600 V/s, the breakdown strength increases slower than the lower ramp rate cases. Moreover, the multiplier decreases from 0.5 to 0.1. The coefficients for the trend functions, A1, A2, B1, and B2 depicted in Figure 10, are 2352, 5200, 9.68 × 10⁶, and 1.91 × 10⁸, respectively.
Figure 11 shows the relationship between the breakdown strength and the inverse of the decay coefficient 1/t1 for the trend of the conduction current density. With a higher ramp rate, the polymer insulator can endure more severe breakdown strength as shown in Figure 10b. A similar relationship is observed between the relaxation time and the ramp rate as shown in Figure 8. The high ramp rate induces an increase in the amount of charge injected into the insulator. However, at the same time, the charge can pass through the insulator quickly owing to the strong electric field, so that the relaxation time for the conduction current, t1, reduces. Furthermore, the shorter the relaxation time for the conduction current, the higher electric field should be applied to trigger the breakdown phenomenon. With the higher ramp rate, the conduction current reaches steady-state earlier, and the polymer insulator can withstand breakdown at the strong electric field.
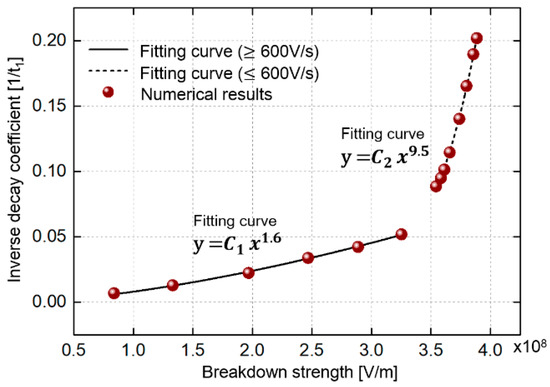
Figure 11.
Relationship between breakdown strength and inverse decay coefficient.
The breakdown starts at the point that has the maximum electric field strength. When the applied electric field rapidly increases across the insulator, the space charge gradient inside the insulator significantly decreases compared with the lower ramp rate. Furthermore, the slopes of the local electric field quickly decrease owing to the accumulation of the space charge. The relationship between the breakdown strength and the inverse of the decay coefficient t1 related to relaxation time can be described by the power-law as shown in Figure 11. The coefficients of the trend functions, C1 and C2 depicted in Figure 11, are 0.008 and 6.6330 × 10⁻⁷, respectively.
4. Discussion
As mentioned above, the lower ramp rate leads to lower breakdown strength. The breakdown strength varies depending on the ramp rate, even if the same electric field is applied to the insulator. To demonstrate this, we used the impact-momentum relationship, which has a similar physical phenomenon. When the electric force with the same peak acts on the molecular chain, the impact is different depending on the ramp rate. It means that the lower ramp rate causes a larger impact value. The impact can be calculated by integrating the force with time. Moreover, the impact would change the momentum of the molecular chain. At the lower ramp rate, a noticeable change of momentum causes the enormous electromechanical stress on the molecular chain over a long time, and it makes breakdown strength lowered.
Furthermore, we suggest relaxation time of the current density as a significant quantity to predict the breakdown strength of LDPE. The relaxation time is the specific time required to reach the steady-state of the conduction current, and it is inversely proportional to the ramp rate. For high ramp rates, the slopes of the local electric field and space charge distribution were weakened in a short time. As steady-state was attained quickly, the insulator could withstand the strong electric field. In particular, breakdown strength increases with the inverse of relaxation time following the power-law. Based on this relationship, the relaxation time of the conduction current was shown to be a significant indicator of the breakdown strength of the insulator.
5. Conclusions
In this study, we analyzed the charge dynamics in an LDPE insulator for voltage ramp rates from 10 to 1500 V/s. The trends of the breakdown phenomena were numerically analyzed using the BCT model and molecular displacement based on the FEM. The numerical results were compared and verified with those from experiments reported in literature. The breakdown phenomena drastically changed around the inflection point of 600 V/s. When the ramp rate was below 600 V/s, the breakdown voltage was inversely proportional to the ramp rate with root-squared. Breakdown strength increases following the ramp rate with multiplier 0.5. However, when the ramp rate exceeded 600 V/s, the breakdown voltage remained constant at the maximum applied voltage of 52 kV. Once the breakdown voltage reached 52 kV, the breakdown strength gradually increased according to the power-law with the multiplier of 0.1.
Furthermore, the conduction current was calculated using two different methods: the average and energy methods. Although the basis of these two methods differ, the calculation results were quite similar at the maximum value and for the profiles of the conduction current density with time. Moreover, the relationship between the breakdown strength and relaxation time of the conduction current was analyzed according to the ramp rate. The breakdown strength and relaxation time are inversely proportional, and the multiplier of the power-law changes at around 600 V/s. By expanding this study in the future, it is expected that the breakdown strength can be predicted by measuring the relaxation time of the conduction current density of the polymer-based insulator such as LDPE in real experimental situations.
Author Contributions
M.K. and S.-H.K. implemented the conceptualization and formal analysis. S.-H.L. provided the supporting and review. All authors have read and agreed to the published version of the manuscript.
Funding
This research was supported by Korea Electric Power Corporation (Grant number: R17XA05-3).
Conflicts of Interest
The authors declare no conflict of interest.
References
- Ushakov, V.Y. Insulation of High-Voltage Equipment, 1st ed.; Springer: Berlin/Heidelberg, Germany, 2004; Volume 1, pp. 13–14. [Google Scholar]
- Cho, Y.S.; Lee, H.K.; Shim, M.J.; Kim, S.W. Characteristics of polymer insulator materials: Voltage-lifetime characteristics of DGEBA/MDA/SN system. Mater. Chem. Phys. 2000, 66, 70–76. [Google Scholar] [CrossRef]
- Hanley, T.L.; Burford, R.P.; Fleming, R.J.; Barber, K.W. A general review of polymeric insulation for use in HVDC cables. IEEE Electr. Insul. Mag. 2003, 19, 13–24. [Google Scholar] [CrossRef]
- Grzybowski, S.; McMellon, R.L. Electrical breakdown strength of XLPE cables under combined AC-DC voltage. In Proceedings of the IEEE Southeastcon’95, Raleigh, NC, USA, 26–29 March 1995; pp. 63–66. [Google Scholar]
- Okashita, M.; Ymaguchi, M.; Fujita, M.; Shintate, H.; Wang, S.; Shiono, T. Relationship between impulse breakdown and morphology of polyethylene. In Proceedings of the International Symposium on Electrical Insulating Materials, Toyohashi, Japan, 30 September 1998; pp. 549–552. [Google Scholar]
- Hoang, A.T.; Serdyuk, Y.V.; Gubanski, S.M. Charge transport in LDPE nanocomposites part II-computational approach. Polymers 2016, 8, 103. [Google Scholar] [CrossRef] [PubMed]
- Raju, G.; Katebian, A.; Jafri, S.Z. Breakdown voltages of polymers in the temperature range 23°–250 °C. IEEE Trans. Dielectr. Electr. Insul. 2003, 10, 117–127. [Google Scholar] [CrossRef]
- Diaham, S.; Zelmat, S.; Locatelli, M.L.; Dinculescu, S.; Decup, M.; Lebey, T. Dielectric breakdown of polyimide films: Area, thickness and temperature dependence. IEEE Trans. Dielectr. Electr. Insul. 2010, 17, 18–27. [Google Scholar] [CrossRef]
- Min, D.; Li, Y.; Yan, C.; Xie, D.; Li, S.; Wu, Q.; Xing, Z. Thickness-Dependent DC Electrical Breakdown of Polyimide Modulated by Charge Transport and Molecular Displacement. Polymers 2018, 10, 1012. [Google Scholar] [CrossRef] [PubMed]
- Zhao, L.; Liu, G.Z.; Su, J.C.; Pan, Y.F.; Zhang, X.B. Investigation of thickness effect on electric breakdown strength of polymers under nanosecond pulses. IEEE Trans. Plasma Sci. 2011, 39, 1613–1618. [Google Scholar] [CrossRef]
- Chen, G.; Zhao, J.; Li, S.; Zhong, L. Origin of thickness dependent dc electrical breakdown in dielectrics. Appl. Phys. Lett. 2012, 100, 222904. [Google Scholar] [CrossRef]
- Yin, W.; Schweickart, D. Dielectric breakdown of polymeric insulation films under AC, DC and pulsed voltages. In Proceedings of the 2009 IEEE Electrical Insulation Conference, Montreal, QC, Canada, 31 May–3 June 2009; pp. 292–296. [Google Scholar]
- Alison, J.M.; Hill, R.M. A model for bipolar charge transport, trapping and recombination in degassed crosslinked polyethene. J. Phys. D Appl. Phys. 1994, 27, 1291–1299. [Google Scholar] [CrossRef]
- Zhao, J.; Xu, Z.; Chen, G.; Lewin, P. Numerical modeling of space charge in polyethylene under AC fields. In Proceedings of the 2010 10th IEEE International Conference on Solid Dielectrics, Potsdam, Germany, 4–9 July 2010. [Google Scholar]
- Lewis, T.J. Charge transport, charge injection and breakdown in polymeric insulators. J. Phys. D Appl. Phys. 1990, 23, 1469–1478. [Google Scholar] [CrossRef]
- Kaneko, K.; Mizutani, T.; Suzuoki, Y. Computer simulation on formation of space charge packets in XLPE films. IEEE Trans. Dielectr. Electr. Insul. 1999, 6, 152–158. [Google Scholar] [CrossRef]
- Min, D.; Yan, C.; Mi, R.; Ma, C.; Huang, Y.; Li, S.; Wu, Q.; Xing, Z. Carrier Transport and Molecular Displacement Modulated dc Electrical Breakdown of Polypropylene Nanocomposites. Polymers 2018, 10, 1207. [Google Scholar] [CrossRef] [PubMed]
- Andersen, A.; Moser, K.; Dennison, J. Dependence of Electrostatic Field Strength on Voltage Ramp Rate for Spacecraft Materials. IEEE Trans. Plasma Sci. 2017, 45, 2036–2039. [Google Scholar]
- Thomas, A. The Effect of Voltage Ramp Rate on Dielectric Breakdown of Thin Film Polymers; Senior Theses and Projects, Utah State University Utah State University: Logan, UT, USA, 2007. [Google Scholar]
- Li, S.; Min, D.; Wang, W.; Chen, G. Modelling of dielectric breakdown through charge dynamics for polymer nanocomposites. IEEE Trans. Dielectr. Electr. Insul. 2016, 23, 3476–3485. [Google Scholar] [CrossRef]
- Min, D.; Wang, W.; Li, S. Numerical analysis of space charge accumulation and conduction properties in LDPE nanodielectrics. IEEE Trans. Dielectr. Electr. Insul. 2015, 22, 1483–1491. [Google Scholar] [CrossRef]
- Min, D.; Li, S. Simulation on the influence of bipolar charge injection and trapping on surface potential decay of polyethylene. IEEE Trans. Dielectr. Electr. Insul. 2014, 21, 1627–1636. [Google Scholar] [CrossRef]
- Dissado, L.A.; Fothergill, J.C. Electrical Degradation and Breakdown in Polymers; The Institution of Engineering and Technology: Stevenage, UK, 1992; Volume 1, pp. 223–224. [Google Scholar]
- Chandra Kusumasembada, A.; Teyssedre, G.; Le Roy, S.; Boudou, L.; Sinisuka, N.I. Assessment of a Charge Transport Model for LDPE through Conduction Current Measurement. Adv. Technol. Innov. 2017, 2. [Google Scholar]
- Le Roy, S.; Teyssèdre, G.; Laurent, C. Modelling space charge in a cable geometry. IEEE Trans. Dielectr. Electr. Insul. 2016, 23, 2361–2367. [Google Scholar] [CrossRef]
- Toomer, R.; Lewis, T.J. Charge trapping in corona-charge polyethylene films. J. Phys. D Appl. Phys. 1980, 13, 1343–1356. [Google Scholar] [CrossRef]
- Min, D.; Li, S.; Ohki, Y. Numerical simulation on molecular displacement and DC breakdown of LDPE. IEEE Trans. Dielectr. Electr. Insul. 2016, 23, 507–516. [Google Scholar] [CrossRef]
- Li, G.; Li, S.; Min, D.; Zhao, N.; Zhu, Y. Influence of trap depths on space charge formation and accumulation characteristics in low density polyethylene. In Proceedings of the IEEE International Conference on Solid Dielectrics (ICSD), Bologna, Italy, 30 June–4 July 2013; pp. 698–701. [Google Scholar]
- Li, Y.; Yan, C.; Min, D.; Li, S.; Xing, Z.; Zhang, L.; Zhang, C. Numerical Simulation on DC Breakdown of Polyimide Based on Charge Transport and Molecular Chain Displacement. In Proceedings of the 21st International Symposium on High Voltage Engineering; Springer: Berlin/Heidelberg, Germany, 2020; Volume 598, pp. 108–117. [Google Scholar]
- Le Roy, S.; Segur, P.; Teyssedre, G.; Laurent, C. Description of bipolar charge transport in polyethylene using a fluid model with a constant mobility: Model prediction. J. Phys. D Appl. Phys. 2004, 37, 298–305. [Google Scholar] [CrossRef]
- Hamed, B.; Fatiha, R. Numerical modeling of charge transport in polymer materials under DC continuous electrical stress. Trans. Electr. Electron. Mater. 2015, 16, 107–111. [Google Scholar] [CrossRef][Green Version]
- Boufayed, F.; Teyssèdre, G.; Laurent, C.; Le Roy, S.; Dissado, L.A.; Śgur, P.; Montanari, G.C. Models of bipolar charge transport in polyethylene. J. Appl. Phys. 2006, 100, 104105. [Google Scholar] [CrossRef]
- Lee, S.H.; Lee, S.Y.; Park, I.H. Finite element analysis of corona discharge onset in air with artificial diffusion scheme and under fowler-nordheim electron emission condition. In Proceedings of the 12th Biennial IEEE Conference on Electromagnetic Field Computation, Miami, Fl, USA, 30 April–3 May 2006; 2006; p. 283. [Google Scholar]
- Lee, H.Y.; Jung, J.S.; Kim, H.K.; Park, I.H.; Lee, S.H. Numerical and experimental validation of discharge current with generalized energy method and integral ohm’s law in transformer oil. IEEE Trans. Magn. 2014, 50, 257–260. [Google Scholar] [CrossRef]
- Hwang, J.-W.G. Elucidating the Mechanisms behind Pre-Breakdown Phenomena in Transformer Oil Systems. Ph.D. Thesis, Massachusetts Institute of Technology, Cambridge, MA, USA, 2010. [Google Scholar]
- Li, S.; Wang, W.; Yu, S.; Sun, H. Influence of hydrostatic pressure on dielectric properties of polyethylene/aluminum oxide nanocomposites. IEEE Trans. Dielectr. Electr. Insul. 2014, 21, 519–528. [Google Scholar] [CrossRef]


© 2020 by the authors. Licensee MDPI, Basel, Switzerland. This article is an open access article distributed under the terms and conditions of the Creative Commons Attribution (CC BY) license (http://creativecommons.org/licenses/by/4.0/).