Abstract
Microcracks caused by perforating operations in a cement sheath body and interface have the potential to further expand or even cause crossflow during hydraulic fracturing. Currently, there are few quantitative studies on the propagation of initial cement-body microcracks. In this paper, a three-dimensional finite element model for the propagation of initial microcracks of the cement sheath body along the axial and circumferential directions during hydraulic fracturing was proposed based on the combination of coupling method of fluid–solid in porous media and the Cohesive Zone Method. The influence of reservoir geological conditions, the mechanical properties of a casing-cement sheath-formation system, and fracturing constructions in the propagation of initial axial microcracks of a cement sheath body was quantitatively analyzed. It can be concluded that the axial extension length of microcracks increased with the increase of elastic modulus of the cement sheath and formation, the flow rate of fracturing fluid, and casing internal pressure, and decreased with the increase of the cement sheath tensile strength and ground stress. The elastic modulus of the cement sheath had a greater influence on the expansion of axial cracks than the formation elastic modulus and casing internal pressure. The effect of fracturing fluid viscosity on the crack expansion was negligible. In order to effectively slow the expansion of the cement sheath body crack, the elastic modulus of the cement sheath can be appropriately reduced to enhance its toughness under the premise of ensuring sufficient strength of the cement sheath.
1. Introduction
In the perforating operation during well completion, the metal jet and explosive impact will cause different degrees of damage to the rock near the hole, and the cement sheath is more susceptible to be damaged because it is a brittle material in the “casing-cement sheath-formation” system [1,2,3]. During subsequent hydraulic fracturing operations, these damages have the potential to further expand or even cause crossflow due to dramatic changes of temperature and pressure within the wellbore [4]. Through previous experiments and field studies [3,4,5,6,7,8], we have learned that there are two main types of damages: one is the initial microcrack near the hole in the cement sheath body; and the other is the initial micro-annulus in the first or the second interface caused by the perforation impact. At present, most of the research papers are focused on the propagation of the initial micro-annulus in the first and the second interfaces and plane cracks in the formation rock, and prove that the initial micro-annulus has the phenomenon of expansion through experimental and numerical simulation methods [9,10,11,12,13,14,15,16,17,18,19]. Hou [20] et al. studied the hydraulic fracture propagation of shale horizontal well by using a large-scale true triaxial physical simulation test. Also, there are some research papers focused on the influence of perforation damage on formation permeability and porosity, and the cementing interface [21,22,23]. However, there are few studies on the propagation of initial microcracks near the hole (caused by perforating operation) in the cement sheath body. Currently, the relevant research is focused on experimental observations [7,13]. It is necessary to conduct numerical simulation studies on the propagation of body microcracks in the cement sheath, so as to quantitatively analyze the influence law of various factors on the microcrack propagation, and to find out the difference of the expansion law between micro-annulus and cement sheath body microcracks in the hydraulic fracturing process. This has positive implications for revealing the failure mechanism of wellbore integrity during hydraulic fracturing.
2. Materials and Methods
2.1. Physical Model for the Propagation of Body Crack in the Cement Sheath
According to previous experimental research [7,8,12,13,20,22,24,25], the perforating operation could cause radial body microcracks close to the perforation hole, and their directions were uncertain, as shown in Figure 1a.
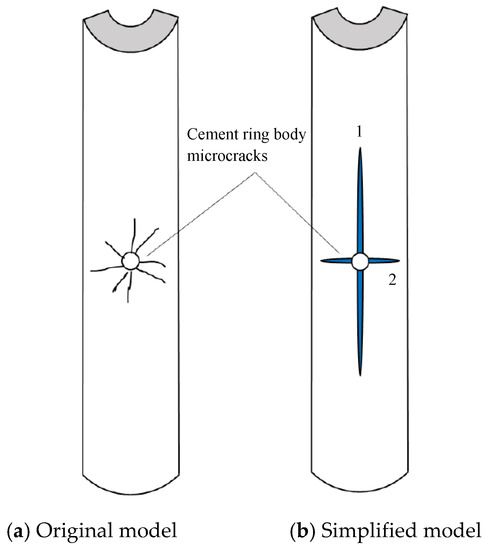
Figure 1.
Schematic diagram of cracks close to the perforation hole in cement sheath.
In order to facilitate the quantitative study of the expansion law of microcracks in the cement sheath, the radial cracks were simplified into axial and circumferential cracks, as shown in Figure 1b. There are also some assumptions for the simplification and model convergence.
- The formation rock and cement sheath are isotropic porous media materials.
- The fluid in the rock and cement sheath is completely saturated and incompressible. The saturation of cement and rock is about 0.4–0.6, but in order to simplify the calculation and increase the convergence of the model, they are set to be fully saturated.
- The fluid is incompressible Newtonian fluid. Generally, the fracturing fluid is non-Newtonian fluid, but the lower the viscosity is, the closer its performance is to Newtonian fluid. The research object of this paper is the low-viscosity fracturing fluid system, so considering its performance and model convergence, it is simplified as Newtonian fluid.
- The temperature is not considered to affect the initiation fracture and expansion of cracks.
- The migration process of proppant is not considered. The schematic diagram of fluid flow in crack micro-element is shown in Figure 2.
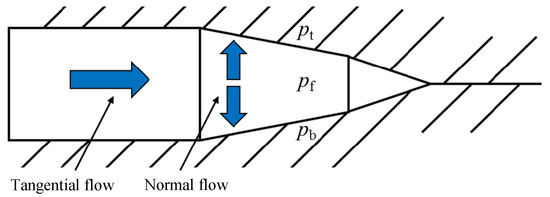 Figure 2. Schematic diagram of fluid flow in crack micro-element.
2.2. Numerical Simulation Methods
According to the previous research [1,8,9,11,12,13,21,22,26,27], the combination of the coupling method of fluid–solid in porous media [19] and the Cohesive Zone Method [12,13,24] has succeeded in simulating the expansion law of plane/interface cracks during hydraulic fracturing. Since the physical processes such as fluid–solid coupling, fluid mechanics, seepage, and rock deformation involved in the expansion of plane/interface cracks and body microcracks are basically the same, this method can also be used to simulate the extension law of body microcracks in the cement sheath.
2.2.1. Coupling Model for Stress-Seepage of Porous Media
The deformation of porous media such as cement sheath and formation rock can be described by the mechanical theory of elastic porous media proposed by Biot [28,29,30,31]. In a porous medium with saturated fluid, the relationship between effective stress and total stress is as follows:
where is effective stress matrix; is total stress matrix; is unit tensor; is Biot coefficient; is formation pore pressure, MPa.
The stress balance equation of the porous media rock skeleton at any time is as follows:
where is the virtual strain rate matrix; is the surface force matrix; is the virtual velocity matrix; is the physical force matrix; S is the surface area, m2; V is the control volume, m3.
The formula (2) can be discretized by the Lagrangian method to obtain finite element meshes of the porous medium. At the same time, percolation is allowed to flow through these finite-element meshes, and the seepage fluid satisfies the fluid continuity equation:
where is the fluid density, kg/m3; is the porosity, dimensionless; is the outer normal direction vector of the surface S; is the fluid percolation velocity, m/s.
Fluid flow in porous media obeys Darcy’s law:
where g is the gravitational acceleration, m/s2; is the permeability vector of the porous medium; x is the space coordinate vector.
Equations (1)–(4) are the governing equations of stress-seepage of porous media, which can be numerically solved by the finite element discrete method.
2.2.2. Cohesive Zone Method
In this paper, the second nominal stress criterion [31] was used as the judgment of whether fracture initiation occurs in the cement sheath. When the quadratic sum of the ratios of nominal stress to critical stress in each direction of the material tip is 1, the fracture initiation is considered to have occurred.
where is normal stress, MPa; and are tangential stress, MPa; is the tensile strength of rock, MPa; and are the threshold stress of tangential damage, MPa; the symbol < > represents that the cohesive unit is only tensile and not resistant to pressure.
The scalar damage value D was used to describe the degree of damage to the material in the damage evolution. Once the damage is generated, D begins to monotonically increase from the initial value of 0 to 1. The general expression is:
where t is the nominal stress tensor at the tip of the crack; is the nominal stress tensor when the material is not damaged.
The damage value D is calculated as:
where is the displacement when the unit is completely damaged, m; is the displacement when the unit starts to be damaged, m; is the maximum displacement amplitude that the unit can reach during loading, m.
The damage evolution of the cohesive unit follows the energy criterion. This paper applies the B-K fracture criterion, and the expression is as follows:
where is the release rate of the normal critical strain energy of the crack, J/m2; and respectively represent the release rate of the tangential critical strain energy of the crack, J/m2; , , and are the normal and tangential strain energy of the crack, respectively, J/m2; β is the material parameter.
As shown in Figure 2, the flow of fluid within a hydraulic fracture can be divided into tangential flow and normal filtration. This paper assumes that the fracturing fluid was an incompressible Newtonian fluid. Since the aspect ratio of the crack is very small, the tangential flow of fluid in the crack can be simplified as a flow in a narrow gap between two parallel sheets, and the flow equation is [30]:
where is the flow rate of the fracturing fluid, m3/s; w is the crack width, m; is the viscosity of the fracturing fluid, Pa·s; is the pressure of the fluid in the crack, MPa.
The fluid-loss flow along the normal direction of the fracture surface can be calculated by the following formula:
where and are the volume flow rate of the fracturing fluid on the upper and lower surfaces of the crack, m3/s; and are the fluid loss coefficients of the upper and lower surfaces of the crack; and are the formation pore pressure outside the upper and lower surfaces of the crack, respectively, MPa.
2.2.3. Numerical Model Establishment
The models for the propagation of axial and circumferential cracks in the cement sheath body were established based on the ABAQUS software platform [11,12]. Both models had an overall size of 10 × 10 × 50 m, and they were large enough to ignore the boundary effects. The models consisted of casing, cement sheath, and formation, and their structural dimensions are shown in Table 1. The relevant mechanical, physical, and geostress parameters were obtained through experiment and field data, as shown in Table 2.

Table 1.
The dimensions of each parts in the models.
Table 2.
Material parameters of each parts in the models.
As shown in Figure 3 and Figure 4, they are propagation models of circumferential and axial cracks in the cement sheath body established in ABAQUS, respectively.
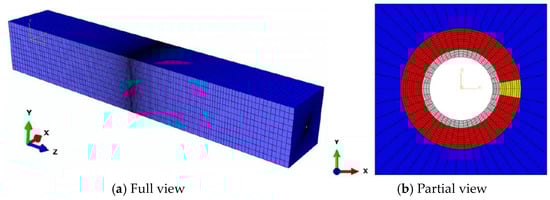
Figure 3.
Circumferential crack propagation model of cement sheath body.
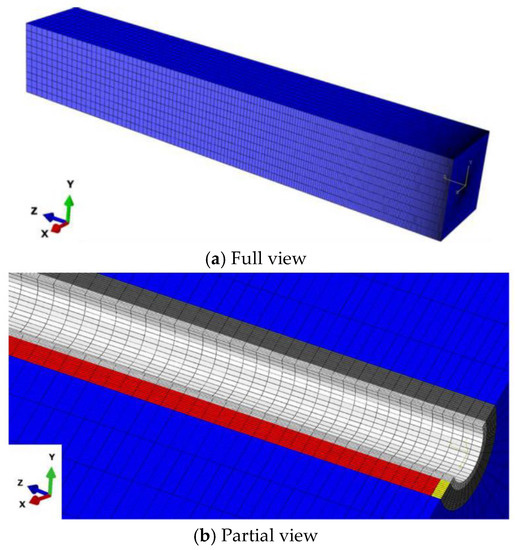
Figure 4.
Axial crack propagation model of cement sheath body.
The specific approach of the simulation is as follows, and the solving steps are as shown in Figure 5.
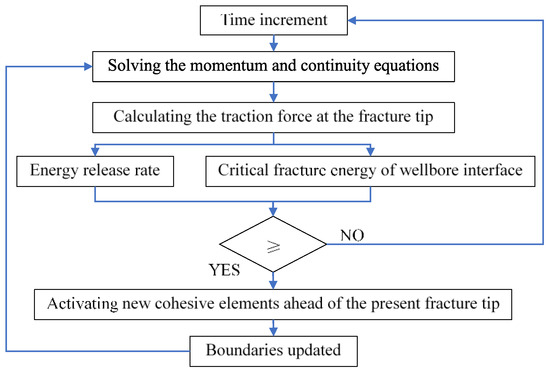
Figure 5.
The solving steps of the numerical model.
The two models set the cement sheath and formation rock in an elastoplastic porous medium, and disintegrated the cement sheath and formation rock into hexahedral pore pressure unit C3D8P, thus simulating the skeleton deformation and fluid seepage process of the cement sheath and formation rock. The casing was discretized using a hexahedral stress unit C3D8S.
As shown in Figure 3b, the circumferential crack propagation model of the cement sheath body pre-set the initial damage unit shown in the yellow area at the perforation hole to simulate the initial circumferential microcracks generated by the perforating operation, and a layer of zero-thickness pore pressure-cohesion unit COHD8P was embedded in the extended path of the circumferential crack to simulate the initiation fracture and expansion process of the circumferential crack. As shown in Figure 4b, the axial crack propagation model of the cement sheath body pre-set the initial damage unit shown in the yellow area at the perforation hole to simulate the initial axial microcracks generated by the perforating operation, and a layer of zero-thickness pore pressure-cohesion unit COHD8P was embedded in the expansion path of the axial crack to simulate the initiation fracture and expansion process of the axial crack.
The displacements in the X, Y, and Z directions on the X, Y, and Z boundaries were prohibited, and a constant formation pore pressure was applied to the X and Y boundaries. The initial pore pressure, initial porosity, and initial saturation, etc., were applied to the entire units of cement sheath and formation. Liquid pressure was applied to the inner wall of the casing, and the maximum horizontal stress, minimum horizontal stress, and overburden pressure were applied in the X, Y, and Z directions, respectively. The values of each load are as shown in Table 3. The liquid was injected into the pre-set initial damage area to simulate the process of the fracturing fluid entering the initial cracks of the cement sheath body under actual working conditions.
Table 3.
The load data.
The solution process of the models is mainly divided into the following three steps: first, the initial ground stress, initial pore pressure, and constant pore pressure boundary conditions were applied to the formation assembly, and the initial stress balance was performed; second, the drilling and cementing process was simulated, and a certain value of liquid pressure was applied on the inner wall of the casing; third: the fracturing fluid was injected into the pre-set initial damage unit at a constant flow rate Q0, simulating the initiation fracture and expansion process of the initial axial and circumferential microcracks under the pressure-driven liquid.
3. Results and Discussions
3.1. Model Verification
To verify the accuracy of the model built in Section 2, the Brice experiment [31] was used to compare the results of the model calculations. The main parameters of the Brice experiment are as shown in Table 4, and numerical simulation was conducted by using the model established in Section 2.
Table 4.
Main parameters of the Brice experiment.
In the Brice experiment, the casing was cemented into a borehole in a PMMA (Polymethyl methacrylate) block and an epoxy system was used to simulate the cement. An initial notch of 3 mm was added in the cement/rock interface for the fracture to initiate. The debonding fracture propagation at the cement/rock interface was recorded by video cameras during the test. As shown in Figure 6, the simulation results had a high degree of coincidence with the crack trajectory obtained by the Brice experiment. This indicates that the model established in this paper can accurately describe the nonlinear fluid–solid coupling problem in the crack propagation process in the cement sheath.
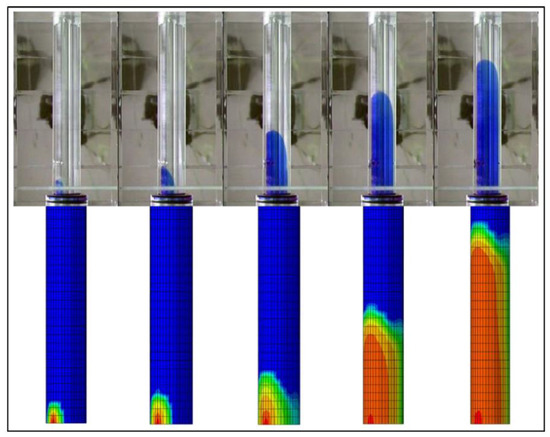
Figure 6.
The comparation of numerical simulation and the Brice experiment.
3.2. Preliminary Analysis of Numerical Simulation Results
(1) The propagation of initial axial cracks in the cement sheath body
The relationship between the pressure at the injection point and the injection time is shown in Figure 7. The distribution of fluid pressure along the axial crack of cement sheath after 600 s of injection is shown in Figure 8.
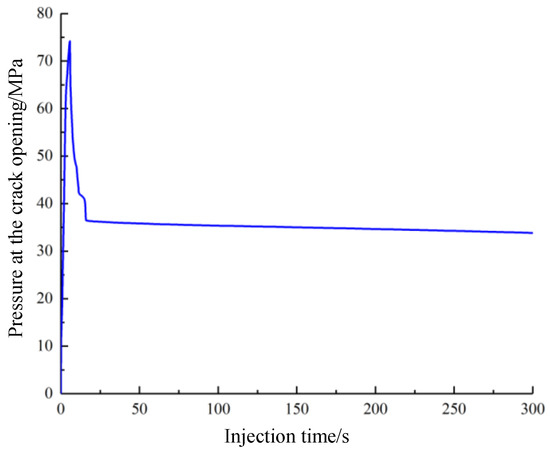
Figure 7.
The relationship between the pressure at the injection point and the injection time.
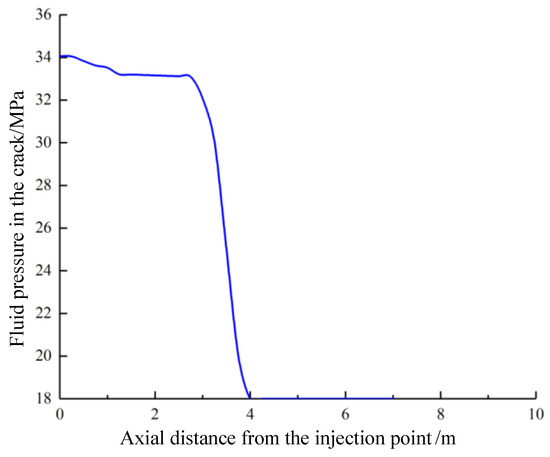
Figure 8.
The distribution of fluid pressure along the axial crack of the cement sheath.
As shown in Figure 7, fracture initiation has not occurred in the initial stage of injection, and the fluid pressure increased dramatically from 0 MPa to 74.1 MPa in several seconds. With the continuous injection of liquid, when the pressure of the crack tip was greater than the tensile strength of the cement sheath (generally 3–6 MPa), the microcrack of the cement sheath body began cracking, and the pressure at the crack opening was released rapidly. The crack propagated along the axial direction of the wellbore and the pressure at the injection point gradually stabilized at around 34.3 MPa.
It can be seen from Figure 8 that due to the large fluid friction in the crack of the cement sheath body, the fluid pressure in the crack gradually decreased from the crack opening to the tip.
The relationship between the distribution of the damage value along the axial expansion path and the distance from the injection point at different times were calculated, as shown in Figure 9.
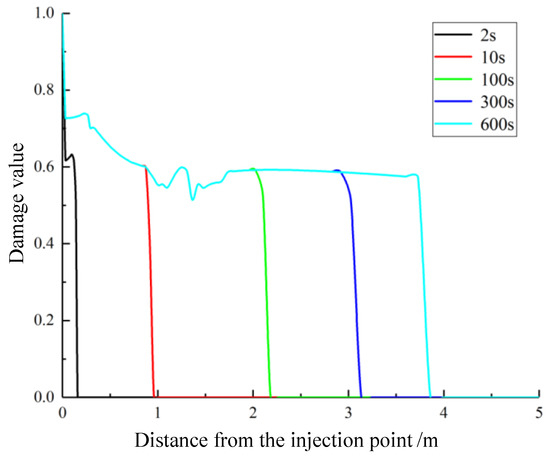
Figure 9.
The distribution of damage value along the axial extension path with the distance from the injection point at different times.
It can be seen from Figure 9 that there was a slight fluctuation in the damage value of the crack along the path, and the damage value decreased slowly from the crack opening to the tip, which indicates that the closer to the injection point, the more serious the damage to the cement sheath in the axial expansion path of the crack.
The damage value cloud map was used to characterize the shape of the axial crack of the cement sheath body at different times. The damage value cloud maps at the injection time of 2 s, 5 s, and 10 s were simulated respectively, as shown in Figure 10.
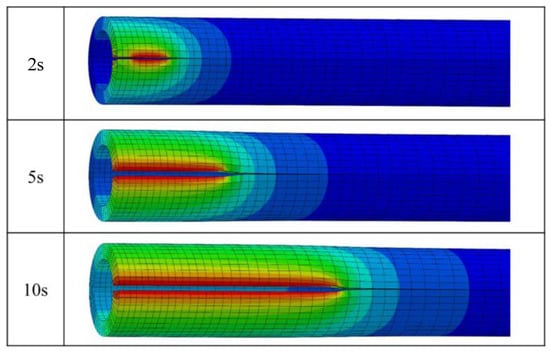
Figure 10.
The damage value cloud maps of axial crack at different injection times.
As shown in Figure 10, with the continuous injection of liquid, the initial body microcrack of the cement sheath generated by the perforating operation was continuously expanded in the axial direction of the wellbore, driven by the liquid pressure.
The relationship between the axial crack propagation length of the cement sheath body and the injection time under different injection rates is shown in Figure 11. As is shown in Figure 11, at the initial stage of liquid injection, the axial expansion length of the crack in the cement sheath body was faster; after the crack expanded for a period of time, the crack propagation speed gradually decreased, and the axial crack of the cement sheath body reached the limit length of 3.7 m at about 500 s. After that, it did not expand. The greater the injection rate was, the greater the crack propagation velocity was, and the longer the limit length was. When the injection rate was 5 × 10⁻⁵, 1 × 10⁻⁴ and 2 × 10⁻⁴ m3/s, the limit length of the crack was 2.8, 3.7, and 4.2 m respectively.
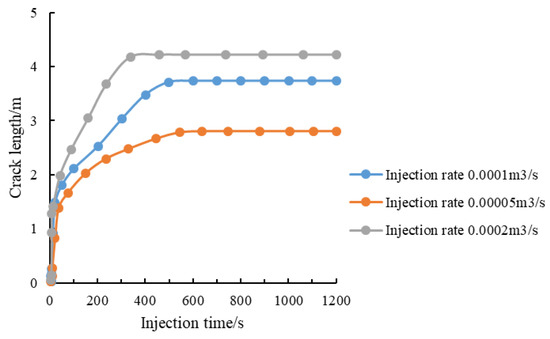
Figure 11.
The relationship between crack length and injection time under different injection rates.
(2) The propagation of initial circumferential cracks in the cement sheath body
Similar to the analysis of axial cracks, the damage value cloud maps of circumferential cracks at the injection times of 2 s, 5 s and 10 s were simulated respectively, as shown in Figure 12. With the continuous injection of liquid, the initial body microcrack of the cement sheath generated by the perforating operation was continuously expanded in the circumferential direction of the wellbore, driven by the liquid pressure.
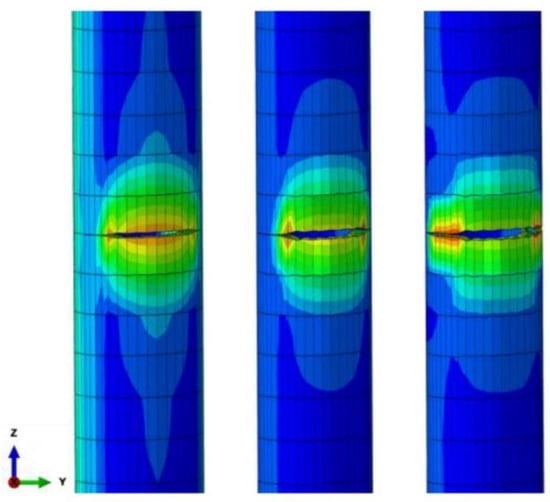
Figure 12.
The damage value cloud maps of circumferential crack at different injection times.
We decided to take half of the circumferential crack in the cement sheath body for research. The relationship between the circumferential crack width and azimuth angle at different injection times is as shown in Figure 13. It can be seen from Figure 13 that the circumferential crack width was gradually narrowed from the perforation hole to both sides, and the crack width was about 2 mm. The common proppant particle size is in the range of 0.2–1.2 mm [32]; in the actual fracturing condition, therefore, if the circumferential expansion of the body microcracks occurs, the proppant will enter the cracks with the fracturing fluid and remain in them after the fracturing fluid returns. This will cause partial loss of the cement sheath, increasing the risk of the casing yielding deformation.
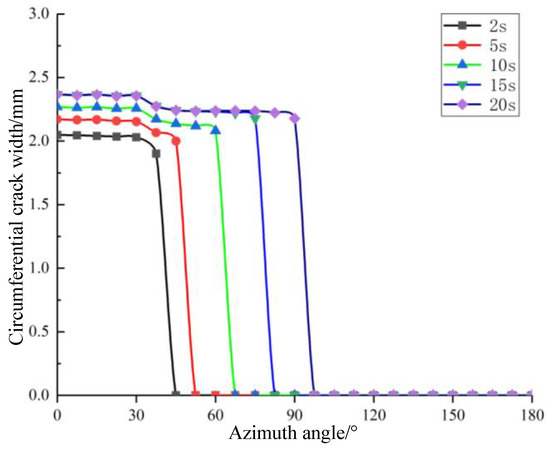
Figure 13.
The relationship between the circumferential crack width and azimuth angles at different injection times.
3.3. Analysis of Body Microcrack Propagation Law and its Influencing Factors
This section takes axial microcracks as an example to analyze the influence of different factors on the propagation law.
(1) The effect of the size of initial axial microcracks on the crack propagation
The thickness of the common cement sheath is in the range of several tens of millimeters. The strong impact force of the perforating operation causes the initial body microcracks to be generally penetrated in the radial direction. Therefore, this section does not consider the influence of the depth of initial body cracks. The effect of the length of initial axial microcracks on the crack propagation was studied.
The crack propagation under different conditions of initial axial microcrack length was simulated, and the expanded crack length corresponding to different injection times was obtained, as shown in Figure 14.
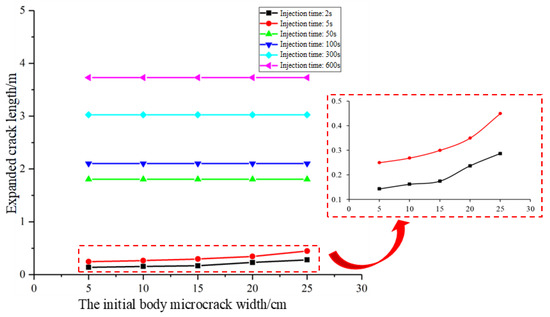
Figure 14.
The effect of the initial microcrack length on expanded crack length at different injection times.
As shown in Figure 14, When the injection time was short (2 s and 5 s), the expanded crack length increased slowly with the increase of initial microcrack length. As the injection time increased, the initial microcrack length had little effect on the expanded crack length.
(2) The effect of ground stress on the crack propagation
We kept the other parameters unchanged, and simulated the expansion of cracks after 200 s of injection under different ground stress conditions, as shown in Figure 15. It can be seen from Figure 15 that the expanded crack length after 200 s of injection decreased linearly with the increase of ground stress.
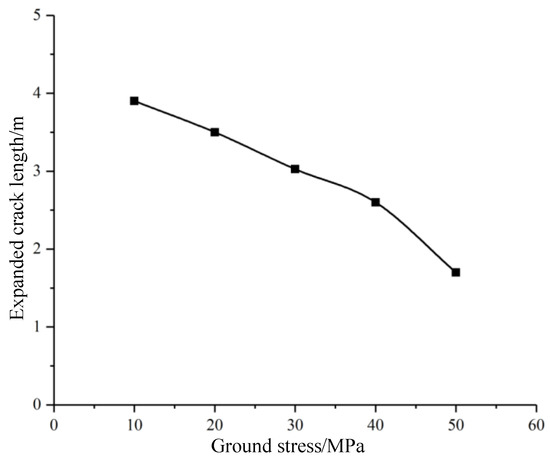
Figure 15.
The effect of ground stress on expanded crack length after 200 s of injection.
Meanwhile, the pressure of the crack opening after 200 s of injection under different ground stress conditions was calculated, as is shown in Figure 16. It can be seen from Figure 16 that the pressure of the crack opening increased significantly with the increase of ground stress. This is because, as the ground stress increases, the cement sheath body is subjected to greater compression, and the crack initiation and expansion of the axial microcrack needs to overcome more resistance.
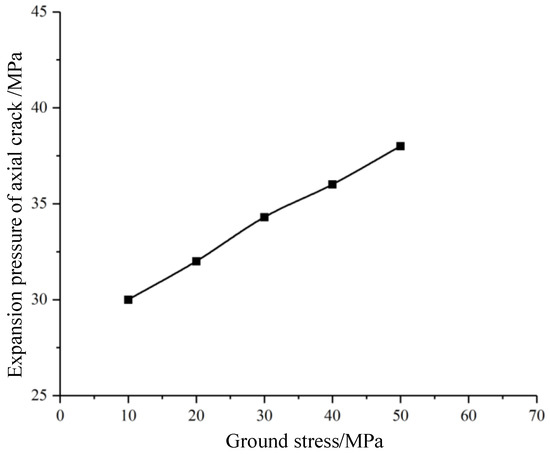
Figure 16.
The effect of ground stress on the pressure of crack opening after 200 s of injection.
(3) The effect of mechanical parameters of cement sheath on the crack propagation
We kept the other parameters unchanged, and simulated the expansion of cracks after 200 s of injection under different conditions of elastic modulus and tensile strength of cement sheath, as shown in Figure 17.
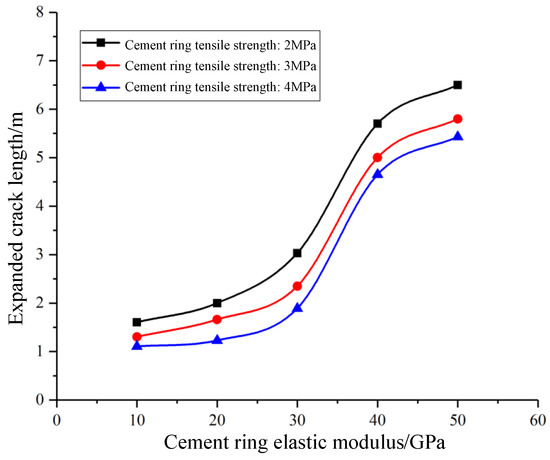
Figure 17.
The effect of mechanical parameters of cement sheath on the crack propagation.
As shown in Figure 16, when elastic modulus of the cement sheath was less than 40 GPa, the expanded crack length increased exponentially with the increase of the elastic modulus of the cement sheath. As the modulus of elasticity continues to increase, the growth rate of the expanded crack length slowed down. On the other hand, the expanded crack length increased with the increase of the tensile strength of cement sheath. It can be seen that the elastic modulus of the cement sheath had a greater influence on the expansion of axial crack of the cement sheath. Therefore, in the on-site construction, under the premise of maintaining the strength of the cement sheath, appropriately reducing the elastic modulus of the cement sheath can suppress the expansion of the axial crack of the cement sheath body.
(4) The effect of mechanical parameters of formation on the crack propagation
We kept the other parameters unchanged, and simulated the expansion of cracks after 200 s of injection under different conditions of elastic modulus of the formation, as shown in Figure 18.
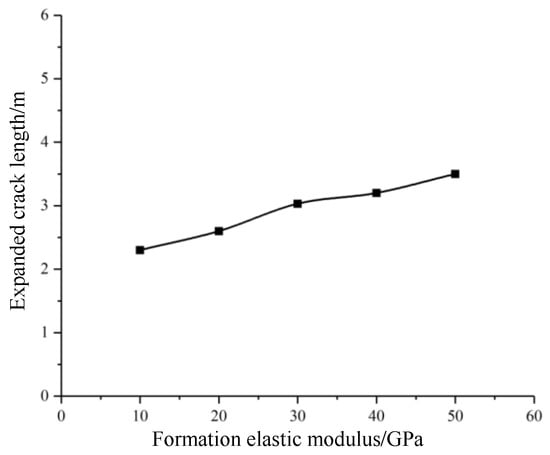
Figure 18.
The effect of mechanical parameters of formation on the crack propagation.
As shown in Figure 18, the expanded crack length increased linearly and slowly with the increase of the elastic modulus of the formation. The formation elastic modulus had a less influence on the expansion of axial crack of the cement sheath than the elastic modulus of cement sheath.
(5) The effect of casing internal pressure on the crack propagation
We kept the other parameters unchanged, and simulated the expansion of cracks after 200 s of injection under different conditions of casing internal pressure, as shown in Figure 19. The pressure of the crack opening after 200 s of injection under different casing internal pressure conditions was calculated, as is shown in Figure 20.
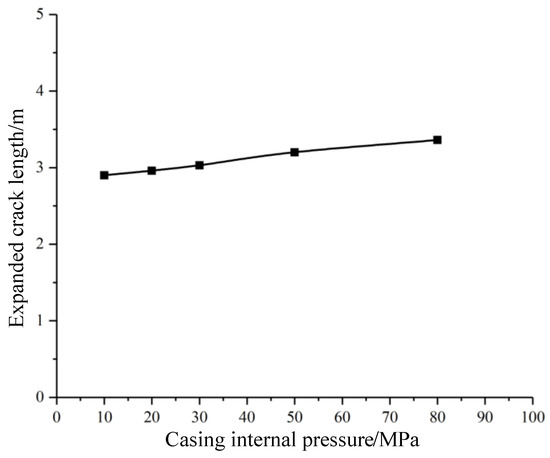
Figure 19.
The effect of casing internal pressure on the crack propagation.
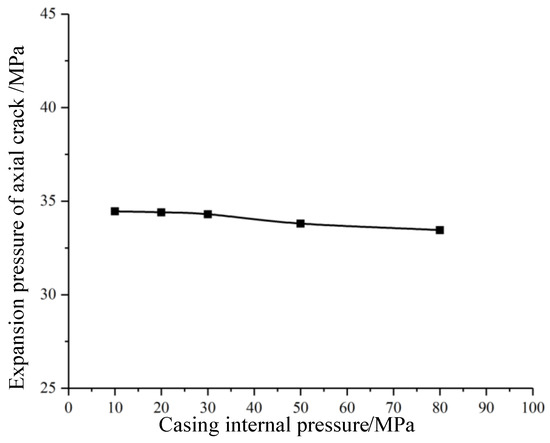
Figure 20.
The effect of casing internal pressure on the pressure of the crack opening.
As shown in Figure 19, the expanded crack length increased slowly and the expansion pressure of crack decreased slightly with the increase of the casing internal pressure. The casing internal pressure had slight influence on the expansion of axial crack of the cement sheath.
(6) The effect of fracturing construction parameters on the crack propagation
We kept the other parameters unchanged, and simulated the expansion of cracks under different conditions of fracture fluid viscosity, as shown in Figure 21.
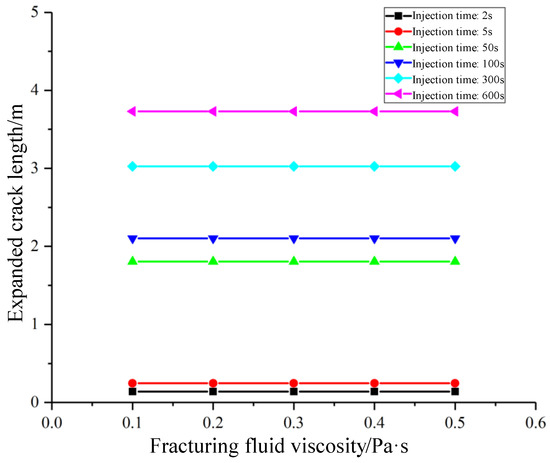
Figure 21.
The effect of fracturing fluid viscosity on the crack propagation.
In can be seen from Figure 21 that the effect of fracturing fluid viscosity on the crack expansion was negligible.
We kept the other parameters unchanged, and simulated the expansion of cracks after 200 s of injection under different conditions of injection rate of fracture fluid was simulated, as shown in Figure 22.
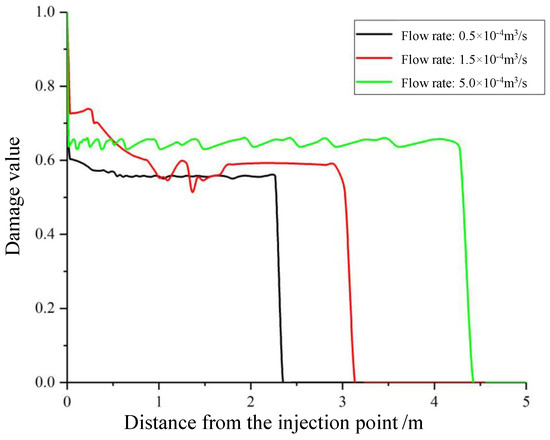
Figure 22.
The effect of flow rate of fracturing fluid on the crack propagation.
As shown in Figure 22, the expanded crack length increased with the increase of the flow rate of fracturing fluid. This is because, as the displacement increased, the volume of the fracturing fluid entering the crack per unit time increased, and the increase in the internal pressure of the fracturing fluid made the crack more likely to expand.
4. Conclusions
- (1)
- Based on the combination of the coupling method of fluid–solid in porous media and the Cohesive Zone Method, a three-dimensional finite element model for the propagation of cement sheath body initial microcracks along the axial and circumferential directions during the hydraulic fracturing process was established. The model was verified by the Brice experiment.
- (2)
- The influence of reservoir geological conditions, mechanical properties of the casing-cement sheath-formation system, and fracturing constructions on the propagation of initial axial microcracks of the cement sheath body were quantitatively analyzed.
- (3)
- The axial extension length of the microcracks increased from about 1.5 m to 6 m with the increase of the elastic modulus of the cement sheath (from 10 GPa to 50 GPa), and decreased for around 0.5 m–1 m with the increase of the tensile strength of the cement sheath (from 2 MPa to 4 MPa). Therefore, under the premise of ensuring sufficient strength of the cement sheath, some means for enhancing the toughness of the cement sheath can be used to appropriately reduce the elastic modulus, thereby effectively slowing the expansion of the crack of the cement sheath body.
- (4)
- The axial extension length of the microcracks increased from about 2.3 m to 3.5 m with the increase of elastic modulus of the formation (from 10 GPa to 50 GPa), and grew from about 2.3 m to 3.5 m with the increase of the flow rate of fracturing fluid (from 10 GPa to 50 GPa). It increased from about 2.8 m to 3.4 m with the rise of the casing internal pressure (from 10 MPa to 80 MPa), and decreased from about 4 m to 1.7 m with the growth of the ground stress (from 10 GPa to 50 GPa). The elastic modulus of cement sheath had a greater influence on the expansion of axial cracks than the formation elastic modulus and casing internal pressure. The effect of fracturing fluid viscosity on the crack expansion was negligible.
Author Contributions
Y.X. and Z.G. conceived and designed the study. Y.Y., S.X., and Y.X. performed the numerical simulation. Y.X., S.X., and Y.Y. wrote the paper. Y.X., Y.Y., S.X., and Z.G. reviewed and edited the manuscript. All authors have read and agreed to the published version of the manuscript.
Funding
This research was funded by [National Natural Science Foundation of China] grant numbers [51704320 and 51974353], [Fundamental Research Funds for the Central Universities] grant number [18CX02164A] and [Ministry of Education innovation team development plan rolling support project] grant number [IRT_14R58].
Acknowledgments
The authors would like to acknowledge the academic and technical supports of China University of Petroleum (East China) and Shandong Ultra-deep Drilling Process Control Tech RD Center.
Conflicts of Interest
The authors declare no conflict of interest.
References
- Teng, X.; Wierzbicki, T. Numerical study on crack propagation in high velocity perforation. Comput. Struct. 2005, 83, 989–1004. [Google Scholar] [CrossRef]
- Pucknell, J.K.; Behrmann, L.A. An Investigation of the Damaged Zone Created by Perforating. In Proceedings of the 66th Annual Technical Conference and Exhibition of the Society of Petroleum Engineers, Dallas, TX, USA, 6–9 October 1991. [Google Scholar]
- Yew, C.H.; Zhang, X. A Study of the Damage Zone Created by Shaped-Charge Perforating. In Proceedings of the SPE Rocky Mountain Regional/Low Permeability Reservoirs Symposium, Denver, CO, USA, 26–28 April 2010. [Google Scholar]
- Hossain, M.M.; Rahman, M.K.; Rahman, S.S. Hydraulic fracture initiation and propagation: Roles of wellbore trajectory, perforation and stress regimes. J. Pet. Sci. Eng. 2000, 27, 129–149. [Google Scholar] [CrossRef]
- Wu, K.; Olson, J.E. Mechanisms of Simultaneous Hydraulic-Fracture Propagation from Multiple Perforation Clusters in Horizontal Wells. SPE J. 2016, 21, 1000–1008. [Google Scholar] [CrossRef]
- Long, G.; Xu, G. The Effects of Perforation Erosion on Practical Hydraulic-Fracturing Applications. SPE J. 2017, 22, 645–659. [Google Scholar] [CrossRef]
- Soares, A.C.; Surmas, R.; Silva, L.A.P.; Ferreira, A.; Hardesty, J. Experimental Perforating Test and Damage Zone Characterization. In Proceedings of the Offshore Technology Conference, Rio de Janeiro, Brazil, 27–29 October 2015. [Google Scholar]
- Asadi, M.; Shirazi, M.K.; Ghalambor, A.; Pratt, D.W. Experimental and Simulation Analysis of Jet-Perforated Rock Damage. SPE Drill. Completion 2001, 16, 176–181. [Google Scholar]
- Xue, C.; Li, W.; Li, J.; Wang, K. Numerical investigation on interface crack initiation and propagation behaviour of self-healing cementitious materials. Cem. Concr. Res. 2019, 122, 1–16. [Google Scholar] [CrossRef]
- Fan, M.; Li, J.; Liu, G. Study on the sealing integrity of cement sheath during volume fracturing of shale gas of horizontal well. Clust. Comput. 2018, 22, 5009–5016. [Google Scholar] [CrossRef]
- Gao, Q.; Cheng, Y. Numerical investigation of fluid-driven debonding fracture propagation along wellbore interfaces during hydraulic fracturing. Energy Sources Part A Recovery Util. Environ. Eff. 2018, 40, 1215–1225. [Google Scholar] [CrossRef]
- Feng, Y.; Li, X.; Gray, K.E. Development of a 3D numerical model for quantifying fluid-driven interface debonding of an injector well. Int. J. Greenh. Gas Control 2017, 62, 76–90. [Google Scholar] [CrossRef]
- Martinez, R.E.; Kim, J.; Moridis, G.J. Numerical Investigation of Potential Cement Failure along the Wellbore and Gas Leak During Hydraulic Fracturing of Shale Gas Reservoirs. In Proceedings of the 50th US Rock Mechanics/Geomechanics Symposium, Houston, TX, USA, 26–29 June 2016. [Google Scholar]
- Wang, W.; Taleghani, A.D. Impact of hydraulic fracturing on cement sheath integrity; A modelling approach. J. Nat. Gas Sci. Eng. 2017, 44, 265–277. [Google Scholar] [CrossRef]
- Wilson, A. New Approach Tests Cement-Sheath Integrity during Thermal Cycling. J. Pet. Technol. 2016, 68, 89–90. [Google Scholar] [CrossRef]
- Fagbemi, S.; Tahmasebi, P.; Piri, M. Numerical modeling of strongly coupled microscale multiphase flow and solid deformation. Int. J. Numer. Anal. Methods Geomech. 2020, 44, 161–182. [Google Scholar] [CrossRef]
- Zhang, X.; Tahmasebi, P. Micromechanical evaluation of rock and fluid interactions. Int. J. Greenh. Gas Control 2018, 76, 266–277. [Google Scholar] [CrossRef]
- Zhang, X.; Tahmasebi, P. Effects of Grain Size on Deformation in Porous Media. Transp. Porous Media 2019, 129, 321–341. [Google Scholar] [CrossRef]
- Tahmasebi, P.; Kamrava, S. A pore-scale mathematical modeling of fluid-particle interactions: Thermo-hydro-mechanical coupling. Int. J. Greenh. Gas Control 2019, 83, 245–255. [Google Scholar] [CrossRef]
- Zhen-kun, H.O.; Chun-he, Y.A.; Lei, W.; Peng-jun, L.; Yin-tong, G.; Yuan-long, W.; Zhi, L. Hydraulic fracture propagation of shale horizontal well by large-scale true triaxial physical simulation test. Rock Soil Mech. 2016, 37, 407–414. [Google Scholar]
- Zhu, H.; Deng, J.; Jin, X.; Hu, L.; Luo, B. Hydraulic fracture initiation and propagation from wellbore with oriented perforation. Rock Mech. Rock Eng. 2015, 48, 585–601. [Google Scholar] [CrossRef]
- Yan, Y.; Guan, Z.; Xu, Y.; Yan, W.; Wang, H. Numerical investigation of perforation to cementing interface damage area. J. Pet. Sci. Eng. 2019, 179, 257–265. [Google Scholar] [CrossRef]
- Liu, C. Numerical Simulation of Horizontal Well Fracturing and Optimization of Construction Parameters. Ph.D. Thesis, University of Science and Technology of China, Hefei, China, 2017. [Google Scholar]
- Xia, Y.; Jin, Y.; Chen, M.; Chen, K.P. An Enriched Approach for Modeling Multiscale Discrete-Fracture/Matrix Interaction for Unconventional-Reservoir Simulations. SPE J. 2019, 24, 349–374. [Google Scholar] [CrossRef]
- Yan, C.; Ren, X.; Cheng, Y.; Song, B.; Li, Y.; Tian, W. Geomechanical issues in the exploitation of natural gas hydrate. Gondwana Res. 2020, 81, 403–422. [Google Scholar] [CrossRef]
- Lecampion, B.; Bunger, A.; Kear, J.; Quesada, D. Interface debonding driven by fluid injection in a cased and cemented wellbore: Modeling and experiments. Int. J. Greenh. Gas Control 2013, 18, 208–223. [Google Scholar] [CrossRef]
- Zhu, H.; Shen, J.; Zhou, H. Numerical simulation on propped fracture conductivity. Acta Pet. Sin. 2018, 39, 1410–1420. [Google Scholar]
- Wang, X.; Liu, C.; Wang, H.; Liu, H.; Wu, H. Comparison of consecutive and alternate hydraulic fracturing in horizontal wells using XFEM-based cohesive zone method. J. Pet. Sci. Eng. 2016, 143, 14–25. [Google Scholar] [CrossRef]
- Prévost, J.H. Mechanics of continuous porous media. Int. J. Eng. Sci. 1980, 18, 787–800. [Google Scholar] [CrossRef]
- Carcione, J.M.; Morency, C.; Santos, J.E. Computational poroelasticity—A review. Geophysics 2010, 75, 75A229–75A243. [Google Scholar] [CrossRef]
- Turon, A.; Camanho, P.; Costa, J.; Dávila, C. A damage model for the simulation of delamination in advanced composites under variable-mode loading. Mech. Mater. 2006, 38, 1072–1089. [Google Scholar] [CrossRef]
- Wang, H. Numerical modeling of non-planar hydraulic fracture propagation in brittle and ductile rocks using XFEM with cohesive zone method. J. Pet. Sci. Eng. 2015, 135, 127–140. [Google Scholar] [CrossRef]
© 2020 by the authors. Licensee MDPI, Basel, Switzerland. This article is an open access article distributed under the terms and conditions of the Creative Commons Attribution (CC BY) license (http://creativecommons.org/licenses/by/4.0/).