1. Introduction
A predictive maintenance apparatus monitors an electrical machine continuously to prevent a breakdown in the insulation system [
1,
2,
3,
4]. Electrical, mechanical and thermal stress sources systematically contribute to deteriorate motors. In the absence of a scheduled maintenance, this may bring about sudden breakdowns, with the consequent significant economic losses. Thus, predictive maintenance is replacing reactive maintenance, as the latter does not prevent motor failures and downtime costs. Predictive analytics relies on the ever-growing availability of reliable Internet-of-Thing (IoT) technologies, to drive the real-time scheduling of specific maintenance programs for the target machine. As a result, an effective predictive maintenance system should prompt alerts whenever the electrical machine needs fixing to ensure operation continuity.
In the case of powered electrical machines, partial discharges (PDs) are both the symptoms and the causes of defects in the insulation systems. According to IEC 60270 [
5], a partial discharge (PD) is a localized, electrical discharge that only partially bridges the insulation between conductors; it can (or cannot) occur adjacent to a conductor. PDs take place when the amplitude of the electric field locally exceeds the breakdown strength limit of the insulating material. At the beginning of the phenomenon, a local concentration of electrons induces a ionization and a consequent streamer, known as electron avalanche; the availability of free electrons eventually starts the discharge process. PDs belong to four main categories: those occurring at the surface of insulating material (namely surface discharge), PDs that take place within gas bubbles in liquid insulation, PDs occurring in vacuum within solid insulation (voids or delaminations), and those that affect an electrode in gas (corona activity). PD activity—if ignored—could damage the insulating system until a total breakdown, i.e., a complete short circuit between two conductors. Detecting PDs and recognizing the possible sources of defects is therefore crucial for (1) estimating the status of the insulation system and (2) scheduling a maintenance program that can prevent sudden breakdowns [
6,
7,
8].
In the literature, many works deal with the online monitoring of PDs. Non-invasive sensors (i.e., conducted or irradiated sensors) typically acquire the original, analog signals, which are sampled by an oscilloscope. The resulting time series, in a digital format, undergo a feature-extraction process and ultimately feed a classification system. The classifier identifies the various categories of defects that may affect the observed apparatus. Machine-learning techniques prove especially useful to classify the sources of PDs. In [
9], the authors first collected data with an ultra high frequency (UHF) antenna, then extracted a set of features from raw data. The application of the K-means algorithm in the feature space allowed to identify homogeneous clusters and to distinguish different kinds of defects. In [
10] a high-frequency current transformer (HFCT) captured the signals; after feature extraction, a neural network classified the defects. A HFCT sensor was used in [
11] to collect signals, whereas features resulted from wavelet decomposition; the DBSCAN clustering algorithm [
12] was applied to group the sources of defects. Recently, both antenna and HFCT sensors monitored a gas insulated substation (GIS) [
13], and clustering techniques again performed the PD sources categorization. In [
14] authors proposed a tensor-based algorithm, filtering noise, to classify different PD sources. These method relies on geometric information of PD pattern. In recent years, powerful Graphic Processing Units (GPUs) and the associate distributed-computing paradigms supported solutions based on deep neural networks (DNNs), capable of addressing very complex problems. Convolutional neural networks (CNNs), in particular, were employed in partial discharges recognition and classification. The approach presented in [
15] classified six different PD defects constructed in oil by using a deep neural network, which processed phase-resolved PD (PRPD) pattern as images. In [
16], the authors used a CNN to classify PD sources in a gas insulated system (GIS). That paper showed that the deep network improved on state-of-art algorithms. Several works adopted CNNs to classify PD sources in a variety of applications [
17,
18,
19,
20,
21,
22]. As a matter of fact, a drawback of deep learning techniques is that their deployment on low-resources devices is very challenging, as they require both a considerable computational capability and large memories. In addition, deep networks involve a lot of parameters, hence the training process calls for a huge amount of data, which might not be easily available in some applications.
Overall, the above-mentioned approaches all involve a data-driven classification systems, which in turn requires a training procedure. In addition, those methods do not provide either a run-time monitoring of the aging phenomena nor an estimation of the remaining life of a machine, a pair of essential requirements for a cost-effective maintenance scheduling.
Similar issues affected the methods proposed in [
23,
24]. In the former paper, an UHF antenna monitored a power transformer for 65 days, and yielded phase-resolved PD patterns. Those patterns were matched to three reference templates, by computing the associate correlation coefficients. Thus template matching allowed the system both to classify the PD sources and to monitor changes over time. This method, however, only applies if one knows in advance all possible defects (i.e., the PD pattern shapes) that may affect the observed device. In [
24] the authors introduced a histogram-similarity criterion to support a supervised classification approach. Histograms represented PD patterns, hence the various defects formed a database of histograms. At run time, a PD pattern is acquired and yields a histogram that is compared, according to a statistical hypothesis-test procedure, with each reference pattern included in the database. This approach also requires a large dataset of labeled histograms and cannot predict the remaining life time of the insulation system. Multi-defects PD patterns also represent an issue. A similar technique was proposed in [
25].
An empirical model enabling the assessment of the lifetime of a specimen was proposed in [
26]. By applying a pulse voltage waveform to a set of twisted pairs specimens, the authors induced the aging process, and showed that by collecting some PD patterns for a sufficient time, one could compute some quantities and model the lifetime of any twisted pairs specimen accordingly. Likewise, in [
27] a sinusoidal voltage at a 500 Hz frequency was applied to twisted pairs. Then, the same features adopted in [
26] characterized the PD patterns. The results proved that after an initial transient period, a linear relation existed between a specific feature and the degradation time of the specimens. Thus, these approaches both showed that one could collect data from a set of available specimens, build an according model, and predict the lifespan of a new, unseen specimen. The same technique was adopted recently in [
28] to predict the life span of medium-voltage XLPE cables.
In [
29] the authors proposed a continuous monitoring of PD phenomena in medium voltage grids. The system acquires and processed PD data automatically by rejecting noise [
30] and separating PD patterns according to the defects [
31]. Clustering methods allowed to attain that goal. On-line monitoring was implemented by tracking the evolution of the clusters as aging progressed, whereas a training phase supported the criteria to trigger automated warnings.
The IEEE 62.2 standard [
32] includes diagnostic methods that can provide information about the insulating system and materials. The most common approach relies on the electrical direct current (DC) resistance measurement. The involved quantities are: the value of the resistance
measured one minute after the application of the test voltage, and the polarization index
, which is the ratio of the resistance value measured after ten minutes to the resistance value detected after one minute. Low
and
values indicate possible issues due to conductive currents. Another widely adopted method involves the measurement of the power factor, usually denoted as
. This is an alternate current (AC) voltage-based technique, giving information about the active power absorbed by the insulation. High
values indicate the presence of electric conductive phenomena inside the insulating system. As far as PD measuring is concerned, those diagnostic methods give information about the conditions of the insulating system at run time, but can hardly yield some hint about the behavioral trend, even if the measurements repeat over time during degradation.
The research presented in this paper shows that a monitoring system only relying on an unsupervised approach can support predictive maintenance effectively. As a result, the monitoring process does not require any prior knowledge about the observed apparatus. The anomaly detection paradigm drives the surveillance of aging in the insulation system. The system periodically extracts features from PD patterns, and prompts an alert whenever the machine exhibits an anomalous behavior with respect to past history. By the resulting approach one can characterize the status of the insulation system in real time and schedule maintenance operations accordingly.
That monitoring approach presents some crucial features. First, it does not depends on either a knowledge base or some training process. Secondly, it is computationally light, since standard statistical tools (such as the Chi-Square test and the Kolmogorov-Smirnov test) carry out anomaly detection. In this regard, the paper focuses on the implementations of the overall approach in low-cost embedded systems. Third, the method can provide a basic module within a comprehensive IoT-based predictive maintenance apparatus. The signals acquired in real time by local monitoring apparatuses can all be collected by a remote warehouse. Advanced (and computationally heavy) data analysis by means of Artificial Intelligence tools may then apply to further improve the prediction ability of each local monitoring system. The paper illustrates an implementation of such strategy by applying the empirical model presented in [
27].
Contributions
The main novel contribution of the present work is a fully unsupervised strategy, that adopts an anomaly detection paradigm for the real-time monitoring of insulation systems. To the best of the authors’ knowledge, state-of-the-art approaches that assess the lifetime of insulation systems typically rely on either knowledge bases or Machine-Learning (ML) models, which should be supported by a training process. By contrast, the method described in this paper is specifically designed to detect aging phenomena by only using local information, collected from the monitored machine.
Furthermore, the paper tackles the hard problem of effective implementation on embedded, low-cost devices. Toward that end, the paper presents both an algorithm to support the deployment of that strategy on low-power, low-cost embedded devices, and the design of an IoT-based predictive maintenance system embedding the proposed strategy.
The rest of the paper is organized as follows.
Section 2 reviews the empirical model for the electrical aging assessment presented in [
27].
Section 3 shows how anomaly detection paradigms can drive the recognition of a change in status within an insulation system.
Section 4 introduces and analyzes the proposed on-line monitoring system.
Section 5 details an Iot-based predictive system based on the proposed strategy.
Section 6 discusses the outcomes of the experimental session. Finally,
Section 7 provides a few concluding remarks.
2. Background: An Empirical Model for Electrical Aging Assessment
Only a very few works in the proposed methodologies in the literature can support on-line monitoring of the aging of an insulation system. The method proposed in [
26] and further developed in [
27] provides a state-of-the-art approach for building an empirical model enabling the assessment of the lifespan of a specimen (in particular, twisted-pair specimens).
The process starts by recording the aging of a set of specimens until their breakdown. Aging is induced by applying a pulse voltage [
26] or a sinusoidal voltage [
27]. To monitor that progress, PD patterns are periodically extracted; in the following,
will denote the acquisition time for a single PD pattern, the index
i marks the PD pattern matrix.
For each specimen, the total average apparent charge per cycle
is computed for the generic PD pattern extracted at time
. For this purpose, the positive average current
and the negative average current
are first computed:
here,
is the total number of measured partial discharges with an amplitude corresponding to an apparent positive
or negative
charge. Eventually,
is obtained as follows:
where
f is the frequency of the power supply voltage applied to the specimen.
Each monitored specimen is then characterized by the linear transfer function
that is worked out by exploiting the empirical measurements
. As a result, one has
where
is the average current per cycle and
is the offset charge corresponding to the theoretical average charge per cycle in
, i.e., the charge measured in a cycle just after the inception of the PD activity. The coefficients
and
are determined via linear regression. Indeed, as reported in [
27], linear regression is computed only on the empirical measurements collected after the instant
, which correspond to the end of the transient zone that characterizes any specimen.
In [
26], the breakdown time
D of a twisted pair is expressed as a function of the two quantities
and
:
where
K,
and
are parameters to be tuned. Equation (
5) can be written in a linear form by switching to a logarithm representation:
the availability of a set of specimens with the corresponding triplets
allows one to estimate the value of
K,
and
in (
6) via linear regression.
Eventually, after setting
K,
and
, the expression (
5) makes it possible to infer the lifetime of a new, unseen specimen. The inference process requires first to monitor the specimen until its
and
can be reliably estimated. Then,
D can be assessed by using
and
as input in (
5).
3. Detecting Aging Phenomena via Anomaly Detection
The proposed framework assesses in real time the aging of the insulation system by adopting an unsupervised approach. The goal is to implement a monitoring system that does not rely on the availability of a knowledge base. This kind of characteristic demonstrates the main difference between this work and the research presented in [
26,
27,
29]. For this purpose, the strategy adopted is to check at any time,
t, whether the electrical machine presents some anomalous behavior with respect to the past.
In general, anomaly detection refers to the problem of finding patterns in data that do not conform to expected behavior [
33]. Network intrusion detection, health anomaly detection, spam detection, fraud detection, and industrial damage detection represent only a few examples of applications relying on the anomaly detection paradigm. Actually, anomaly detection can be implemented by exploiting statistical techniques or ML methods, such as clustering, random forest, SVM, and neural networks. In practice, one chooses among the available approaches by taking into account aspects such as the amount of data, the cost of data labeling, the data type (e.g., time series, images, timestamps, etc.), the hardware resources, and the real-time constraints.
The proposed strategy uses statistical methods to implement anomaly detection [
34,
35,
36,
37,
38]. The underlying rationale is to avoid methodologies that involve training processes. Statistical methods rely on the consideration that normal data instances occur in high probability regions of a stochastic model, while anomalies occur in the low probability regions of the stochastic model. Hence, hypothesis testing is exploited: a normal behavior is fit to the data and then a statistical inference test is applied to determine if new data belongs to the normal model or not.
Figure 1 schematizes the proposed framework. First a measurement system samples—at a given frequency—the amplitudes of the signals sensed by an HFCT sensor in a time window
. In the following,
will denote the vector of raw data extracted in a time window
starting at instant
t. Second, a
Processing Unit processes
to extract the signals that characterize aging phenomena. Then, an
Online Alert Unit uses anomaly detection to identify, in real-time, sudden changes in the status of the monitored insulation system.
The
Processing Unit (
Figure 2) receives as input
and works out a pair of vectors:
w and
x. Vector
w is computed by the same algorithm that characterizes a PD pattern, but phase information is discarded in this case. Toward that end, first a PD pattern is extracted from
; it is represented as a matrix, whose columns correspond to the power supply phases, and rows mark the maximum amplitudes of the discharges. Thus, each element in the matrix identifies an amplitude-phase pair; the contents of that cell give the occurrences of discharges at that amplitude-phase pair in the time window
. The resolution of the analog-to-digital converter (ADCs) actually determines the quantization levels in both the amplitude range and the phase range.
Figure 3 illustrates this mechanism in a toy example, where a 2-bit ADC is employed. As a result, the PD pattern has four levels of amplitudes (
,
,
,
) and as many levels of phases (
,
,
,
). In the example, only one discharge with a maximum amplitude
occurred at phase
, whereas two discharges with the same amplitude occurred at phase
phase.
Figure 3 gives the associate vector
w, which includes three elements with value
, since phase information is discarded. Likewise, vector
w includes two elements with value
, five elements with value
, and one element with value
. The resulting size of
w, in general, will depend on the non-zero occurrences of the PD pattern. The choice of not using phase information is related to the fact that such information is useful when the goal is to recognize the category of defect that generated the PD. However, the proposed strategy only focuses on the detection of aging phenomena.
Vector x holds the histogram of the amplitudes of raw data. In that histogram, each bin covers a range of amplitudes. Given the fullscale adopted to sample the signal, the bins are obtained by uniform quantization of such interval. The number of bins and are two input parameters.
Anomaly detection proceeds by applying statistical hypothesis testing to w and x. A pair of well-known statistical tests, namely Chi-Square (Chi2) and Kolmogorov–Smirnov (KS) support this task. Chi2 and KS have been selected as (1) they can support non-parametric tests (i.e., no assumptions on the specific probability distributions are involved) and (2) they allow a real-time implementation of hypothesis testing even on low-cost, low power and resource-constrained embedded devices. The null hypothesis is that the signal measured at time and any signal measured before come from the same population. In other words, an anomaly occurs when the measurement at time is not consistent with previous measurements. The underlying hypothesis is that aging phenomena lead progressively to significant changes in the distribution of PDs. Remarkably, such discontinuities can be detected even in the absence of trained classifiers or any knowledge base.
Hypothesis testing involves a pair of vectors: one carries the measurement at time
, the second one holds the reference, i.e., a representative sample of the population that characterizes the apparatus before time
. The latter vector should be updated whenever an anomaly (i.e., a major discontinuity in the observed status) is detected. The Chi2 test compares two discrete distributions that are expressed in the form of histograms, whereas the (non parametric) KS test carries out hypothesis testing by observing the empirical cumulative distribution functions (ECDF) of data. Thus, as per
Figure 2, Chi2 and KS support the detection of anomalies in
x and
w, respectively.
In the case of Chi2 test, let
be the number of bins in the two discrete distributions
x (measured at time
) and
(measured before time
). Then, let
be the value of the histogram of
for the
ith bin, whereas
is the value of the histogram of
in the
ith bin. Finally, the quantity
is worked out as
where
and
are scaling factors to make up for unbalanced samples. Given
and the degrees of freedom
, which corresponds to the number of non-empty bins, the p-value can be computed from the
distribution. The null hypothesis is accepted if
p-value <
α, where
α is the significance level set a-priori (usually
α = 0.05).
The KS test compares the empirical cumulative distributions (ECDF) of
and
. Given
N points
sorted in increasing order of values, the ECDF is defined as
where
is the number of elements smaller than
in
. Likewise, FE is the ECDF of
. As a result, the KS test statistic relies on
Given
D, the
p-value can be computed as in [
39]. Eventually, the null hypothesis is rejected if the significance level
α is lower than the
p-value.
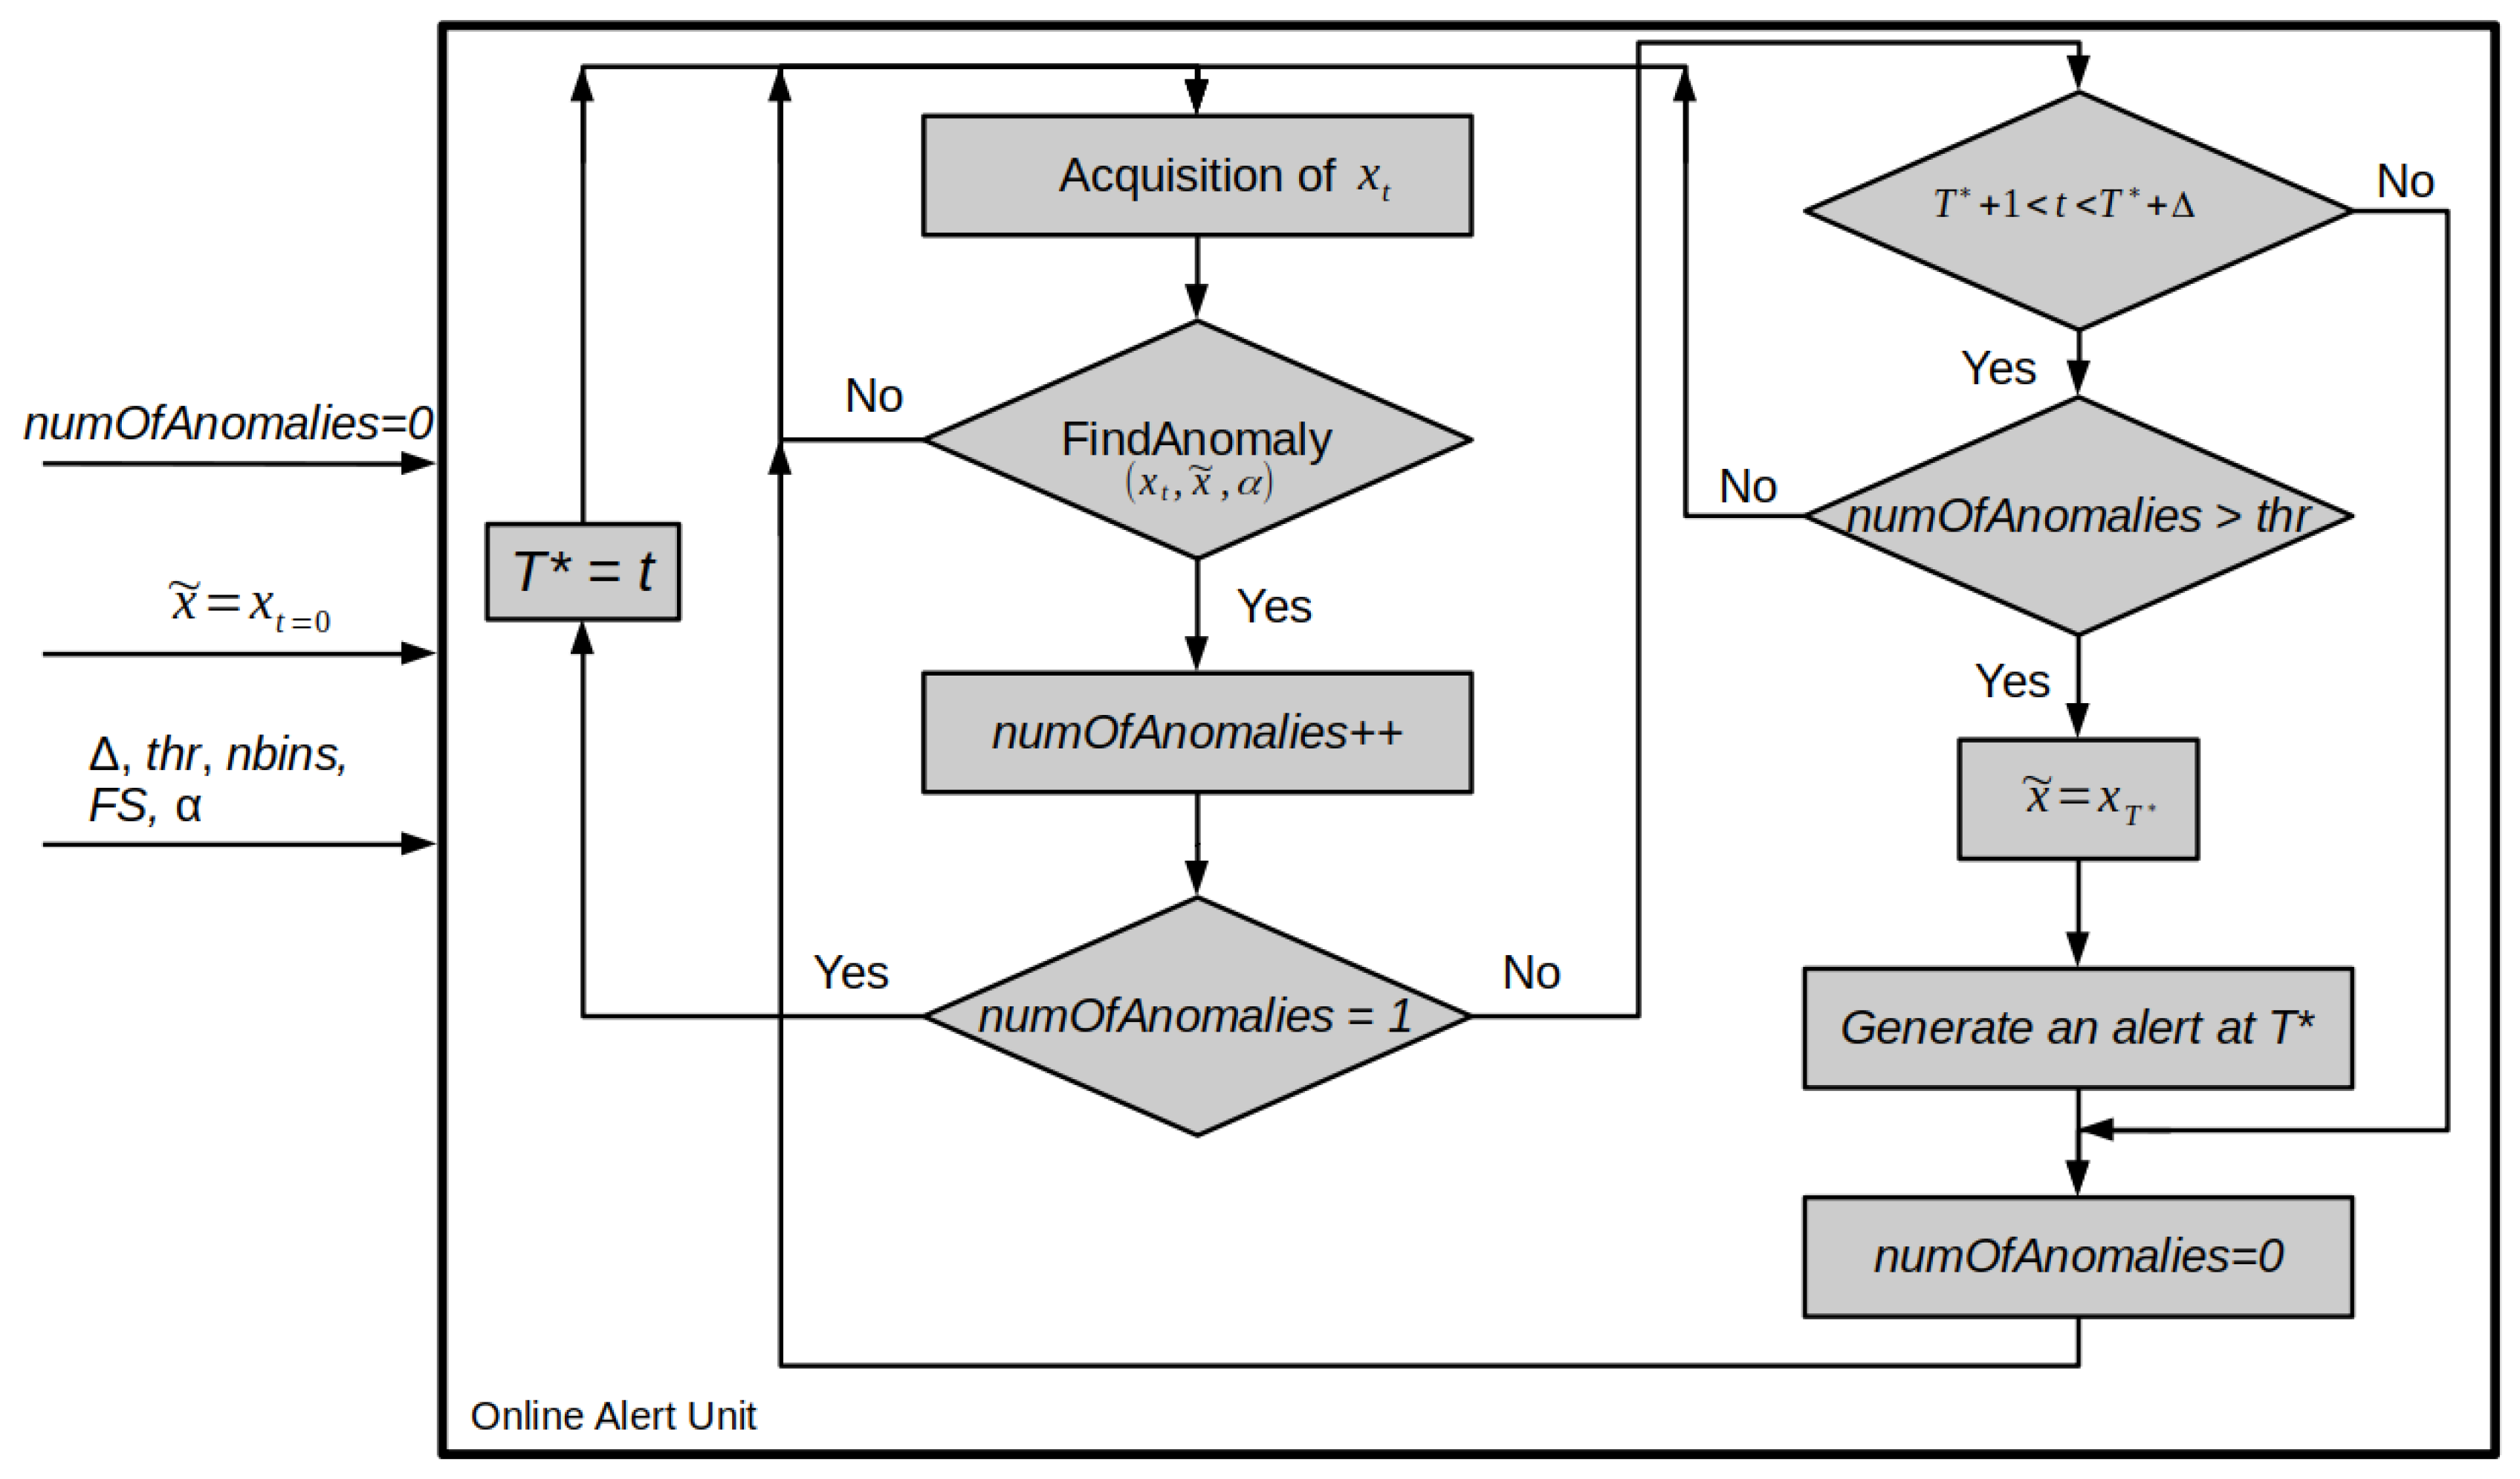
4. Online Monitoring for Predictive Maintenance
The online monitoring system identifies, at run time, abrupt discontinuities in the status of the electrical machine, which are reported as alerts. At time
the system is switched on, and the pair of vectors,
and
, are initialized as per
Section 3.
Figure 4 outlines the anomaly detection monitoring system; the flowchart illustrates the configuration for the Chi2 test. First, the reference vector
is set to
and the number of anomalies
is initialized to 0. The parameters
,
,
,
and
characterize the
Online Alert Unit.
In normal operation, the
Online Alert Unit continuously gets the vector
measured at time
t, and verifies the occurrence of an anomaly (as per
Section 3) by computing the function
. The latter algorithm may implement either the Chi2 test or the KS test, and returns 1 when the null hypothesis is rejected, and 0 otherwise. The detection of an anomaly triggers a second procedure, that verifies whether an alert should be actually prompted. Let
denote the time mark of the first anomaly detection. The procedure propagates an alert only if—in the time window between
and
—the anomaly (
) again shows up at least
times.
If the system generates an alert, the reference is updated and set to , i.e., to the vector acquired at the instant in which the system triggered the first anomaly. If instead the system does not detect the required number, , of anomalies within the time interval [,], the quantity is reset and a new acquisition starts.
In practice, the monitoring system only prompts an alert when it detects a sequence of consecutive anomalies. Thus, significant discontinuities in the status of the insulation system only generate an alert. The approach is fully unsupervised and does not require any previous knowledge about the apparatus. Moreover, the computational complexity of the whole monitoring procedure is negligible. This in turn means that the monitoring system can be deployed in low-cost, resource-limited embedded systems.
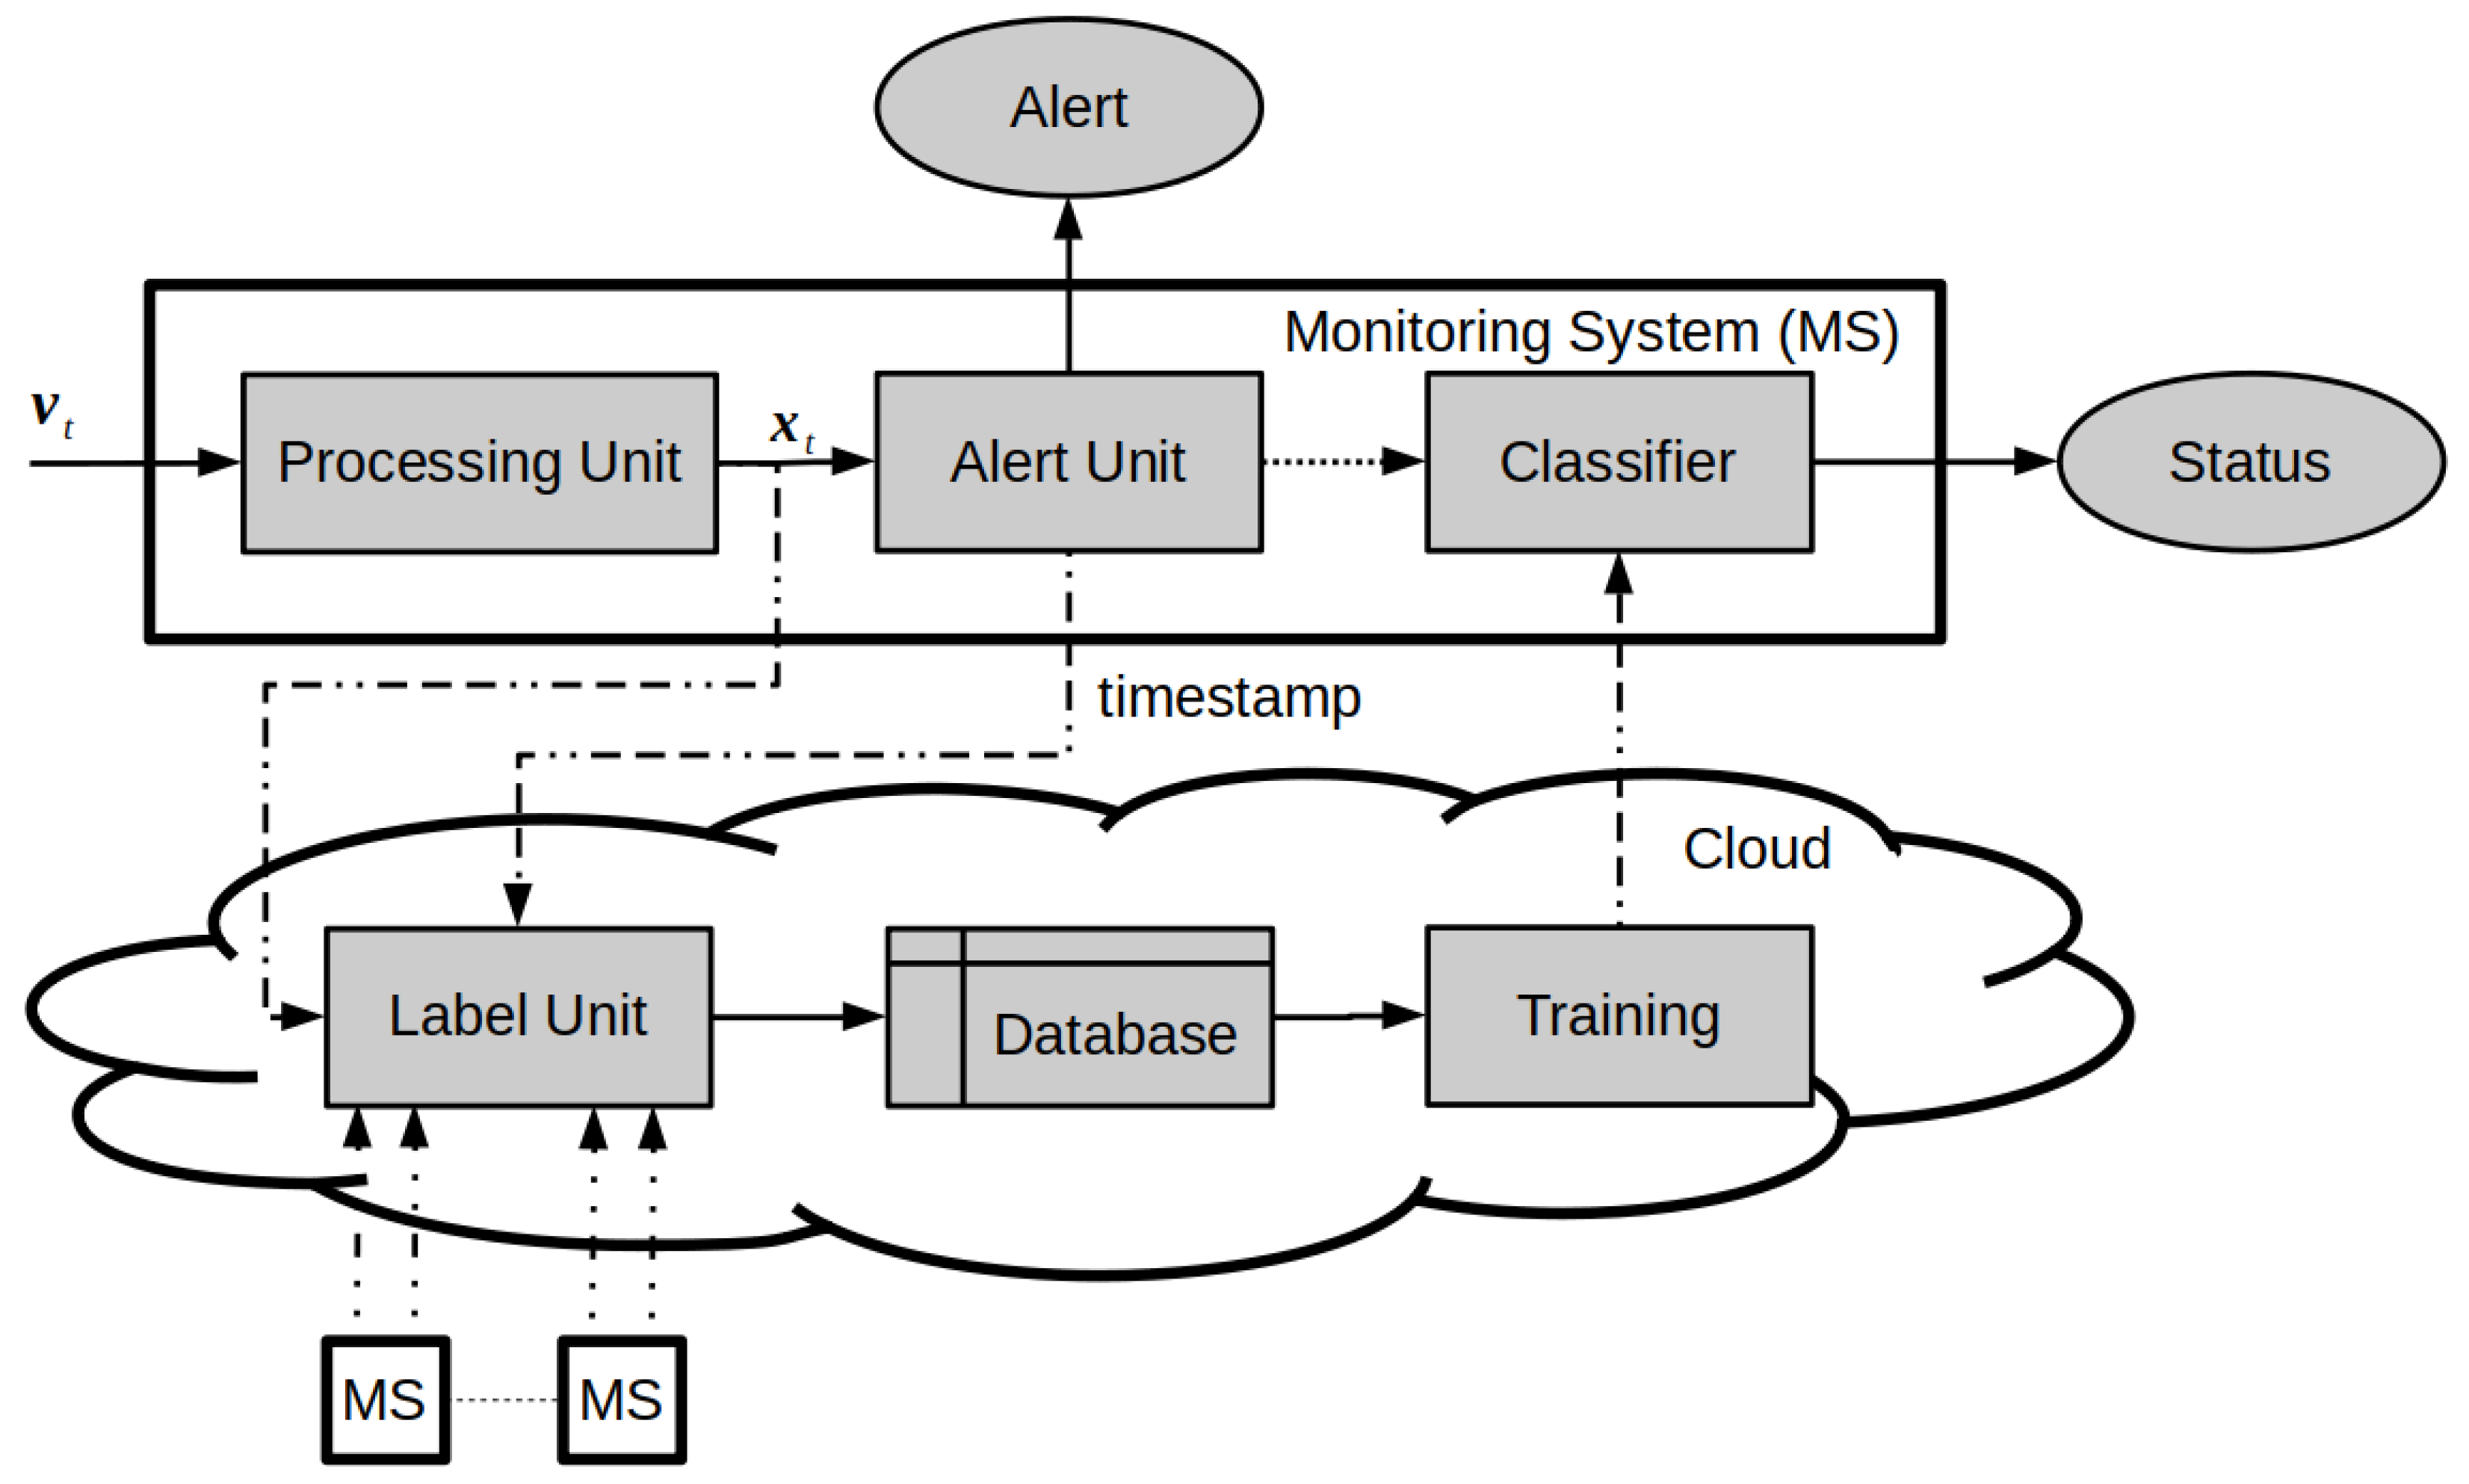
5. IoT-Based Predictive System
The monitoring system can be regarded as a module of a comprehensive IoT-based architecture for predictive maintenance, as per
Figure 5. The framework illustrated in
Figure 4 runs in an embedded system positioned in proximity of the monitored electrical machine, and provides alerts related to aging phenomena as described. Moreover, an additional, classifier module relying on Machine-Learning paradigms can be deployed to automatically predict the status of the machine at each time
t. This allows estimating the proper time for maintenance.
This scenario envisions a remote data-warehouse to analyze the data collected from a variety of maintenance apparatuses, and to adjust the inference functions to be supported by local classifiers. As a major result (1) the training set can progressively collect all the available information from the connected maintenance apparatuses; and (2) the time-consuming, computationally demanding training procedure can be carried out by a central computing unit. This in turn means that the local monitoring system can take advantage of an hardware-friendly inference function that is updated as long as the training set grows.
In practice, the remote database stores the data provided by all the monitored systems (MS in
Figure 5). The
Label Unit characterizes those data along with the timestamps of the alerts, thus building a labeled dataset. In other words, the timestamps, which stem from an unsupervised process, can be used to label the data provided by online measurements. The remote data-warehouse applies machine learning methodologies to that database and computes inferences about the status of the insulation systems under investigation, given a measure
(or
) for an apparatus. Within the paradigm of edge computing, the local embedded system just implements the inference function, which receives its parameters from the cloud. The literature provides some examples of hardware-friendly implementations of inference functions [
40,
41,
42] that could be integrated in our low resources system. Such works exploited the paradigm of random basis neural networks to implement an inference function supported by a single hidden-layer feedforward neural network. As a major result, the eventual classifier can achieve a satisfactory trade-off between generalization performance and computational complexity. This in turn enables the deployment of the classifier on resource-constrained devices.
6. Experimental Results
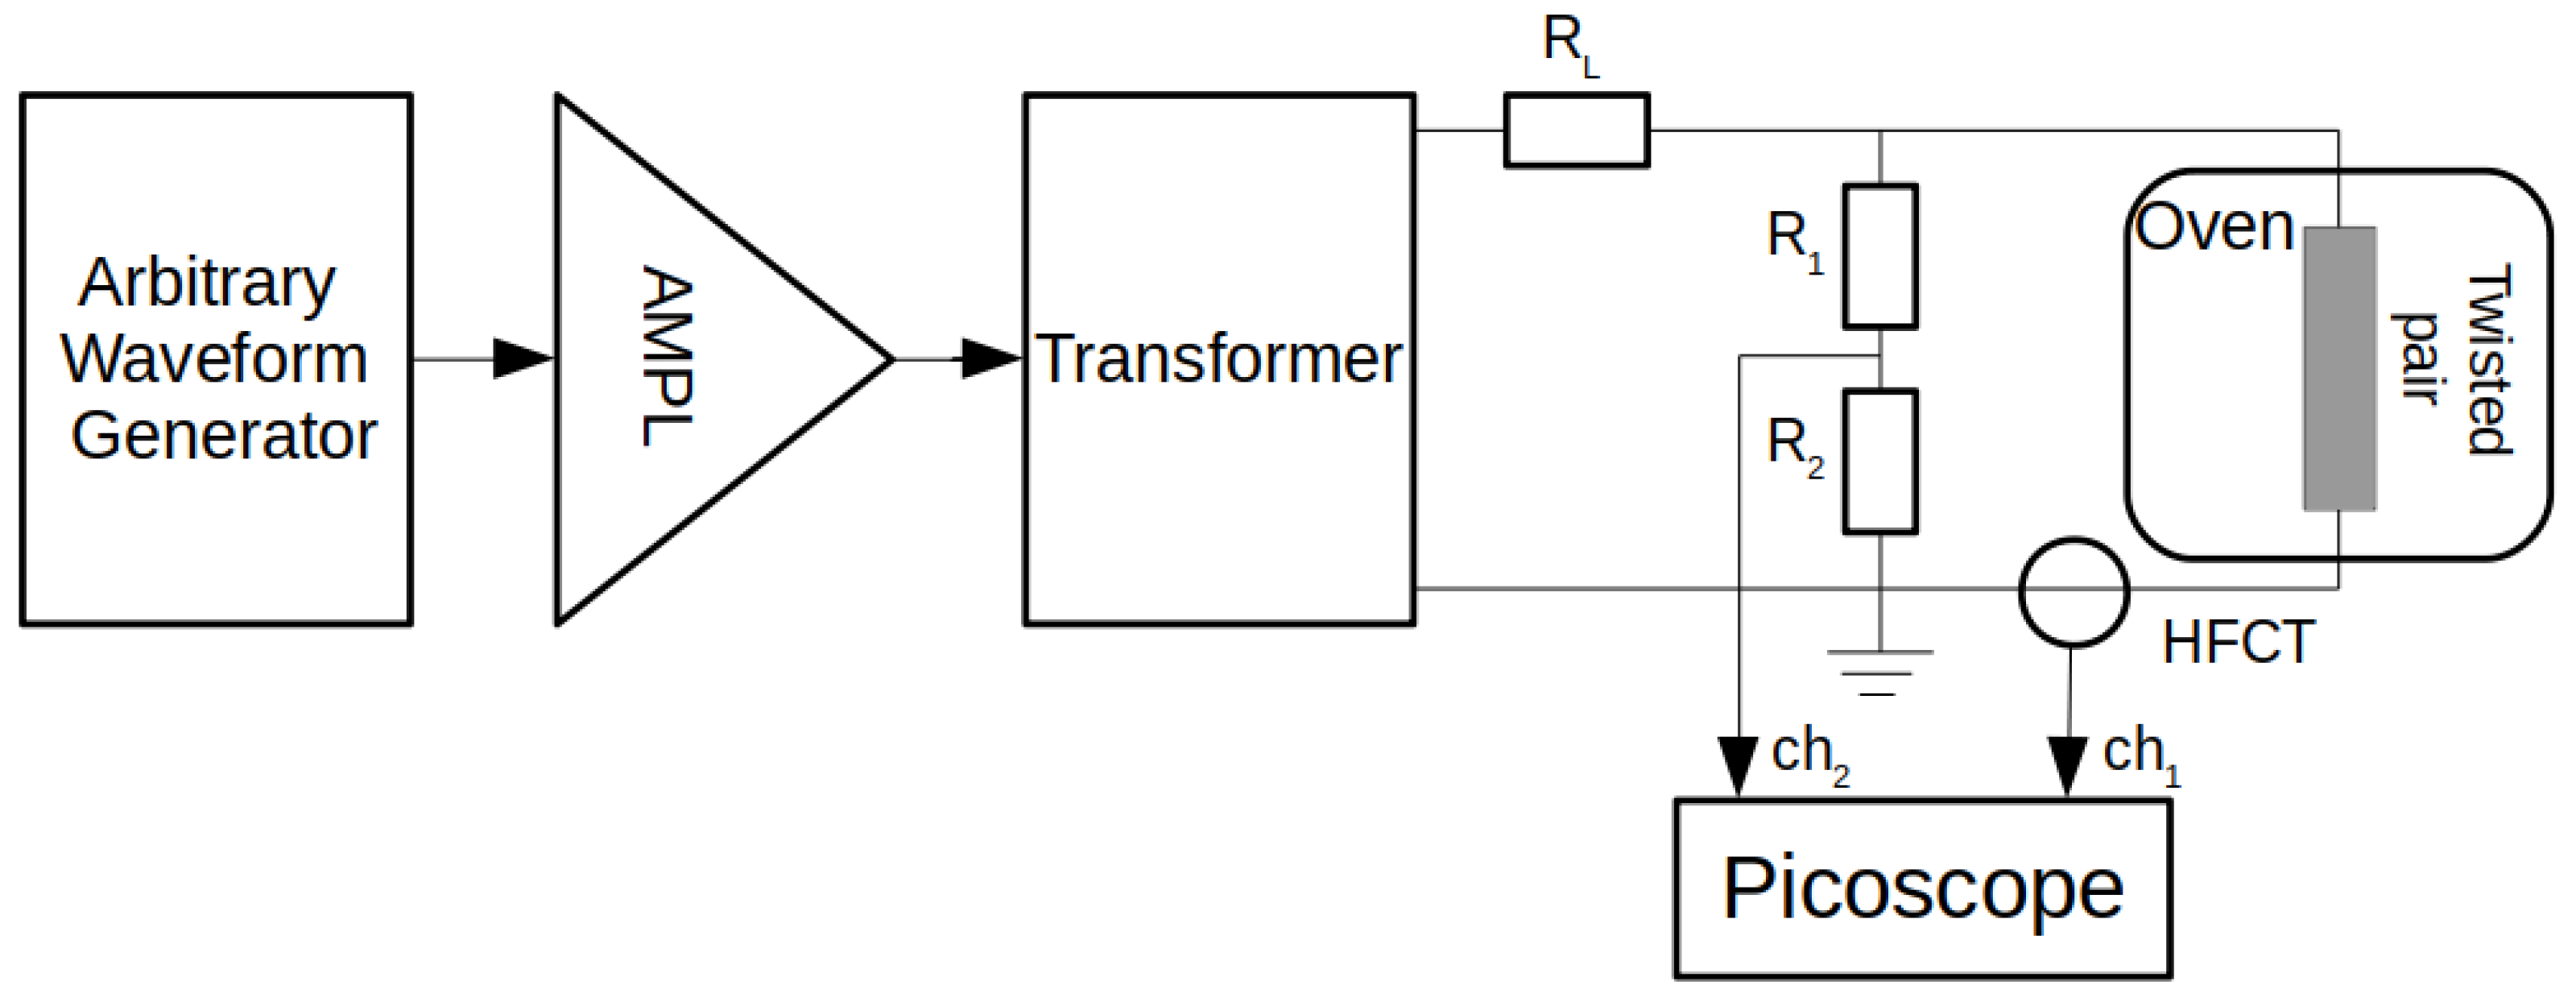
The experimental session involved a set of twisted pair specimens that underwent aging tests according to standard IEC 60851-5.
Figure 6 shows the measurement circuit. The sinusoidal power supply, having a frequency of 500 Hz, was provided by an arbitrary waveform generator and then amplified to reach a 3.74 KV peak to peak amplitude. A gained HFCT with a band-pass behavior in the range
MHz, placed around the ground cable, served as sensor. The signals were sampled by a Picoscope with a bandwidth in the range
MHz and a maximum sample frequency of 1 GSamples/s. The Picoscope collected both the signal from the twisted pair specimens and the signal from a resistive divider as phase reference. All the specimens were placed in an oven at 150 °C.
In the following,
Section 6.1 will presents the outcomes of a set of preliminary experiments, which were designed to properly adjust the resolution in the ADC.
Section 6.2 will discuss the outcomes of the experiments involving the proposed online monitoring system. Finally,
Section 6.3 will analyze the computational complexity of the monitoring system.
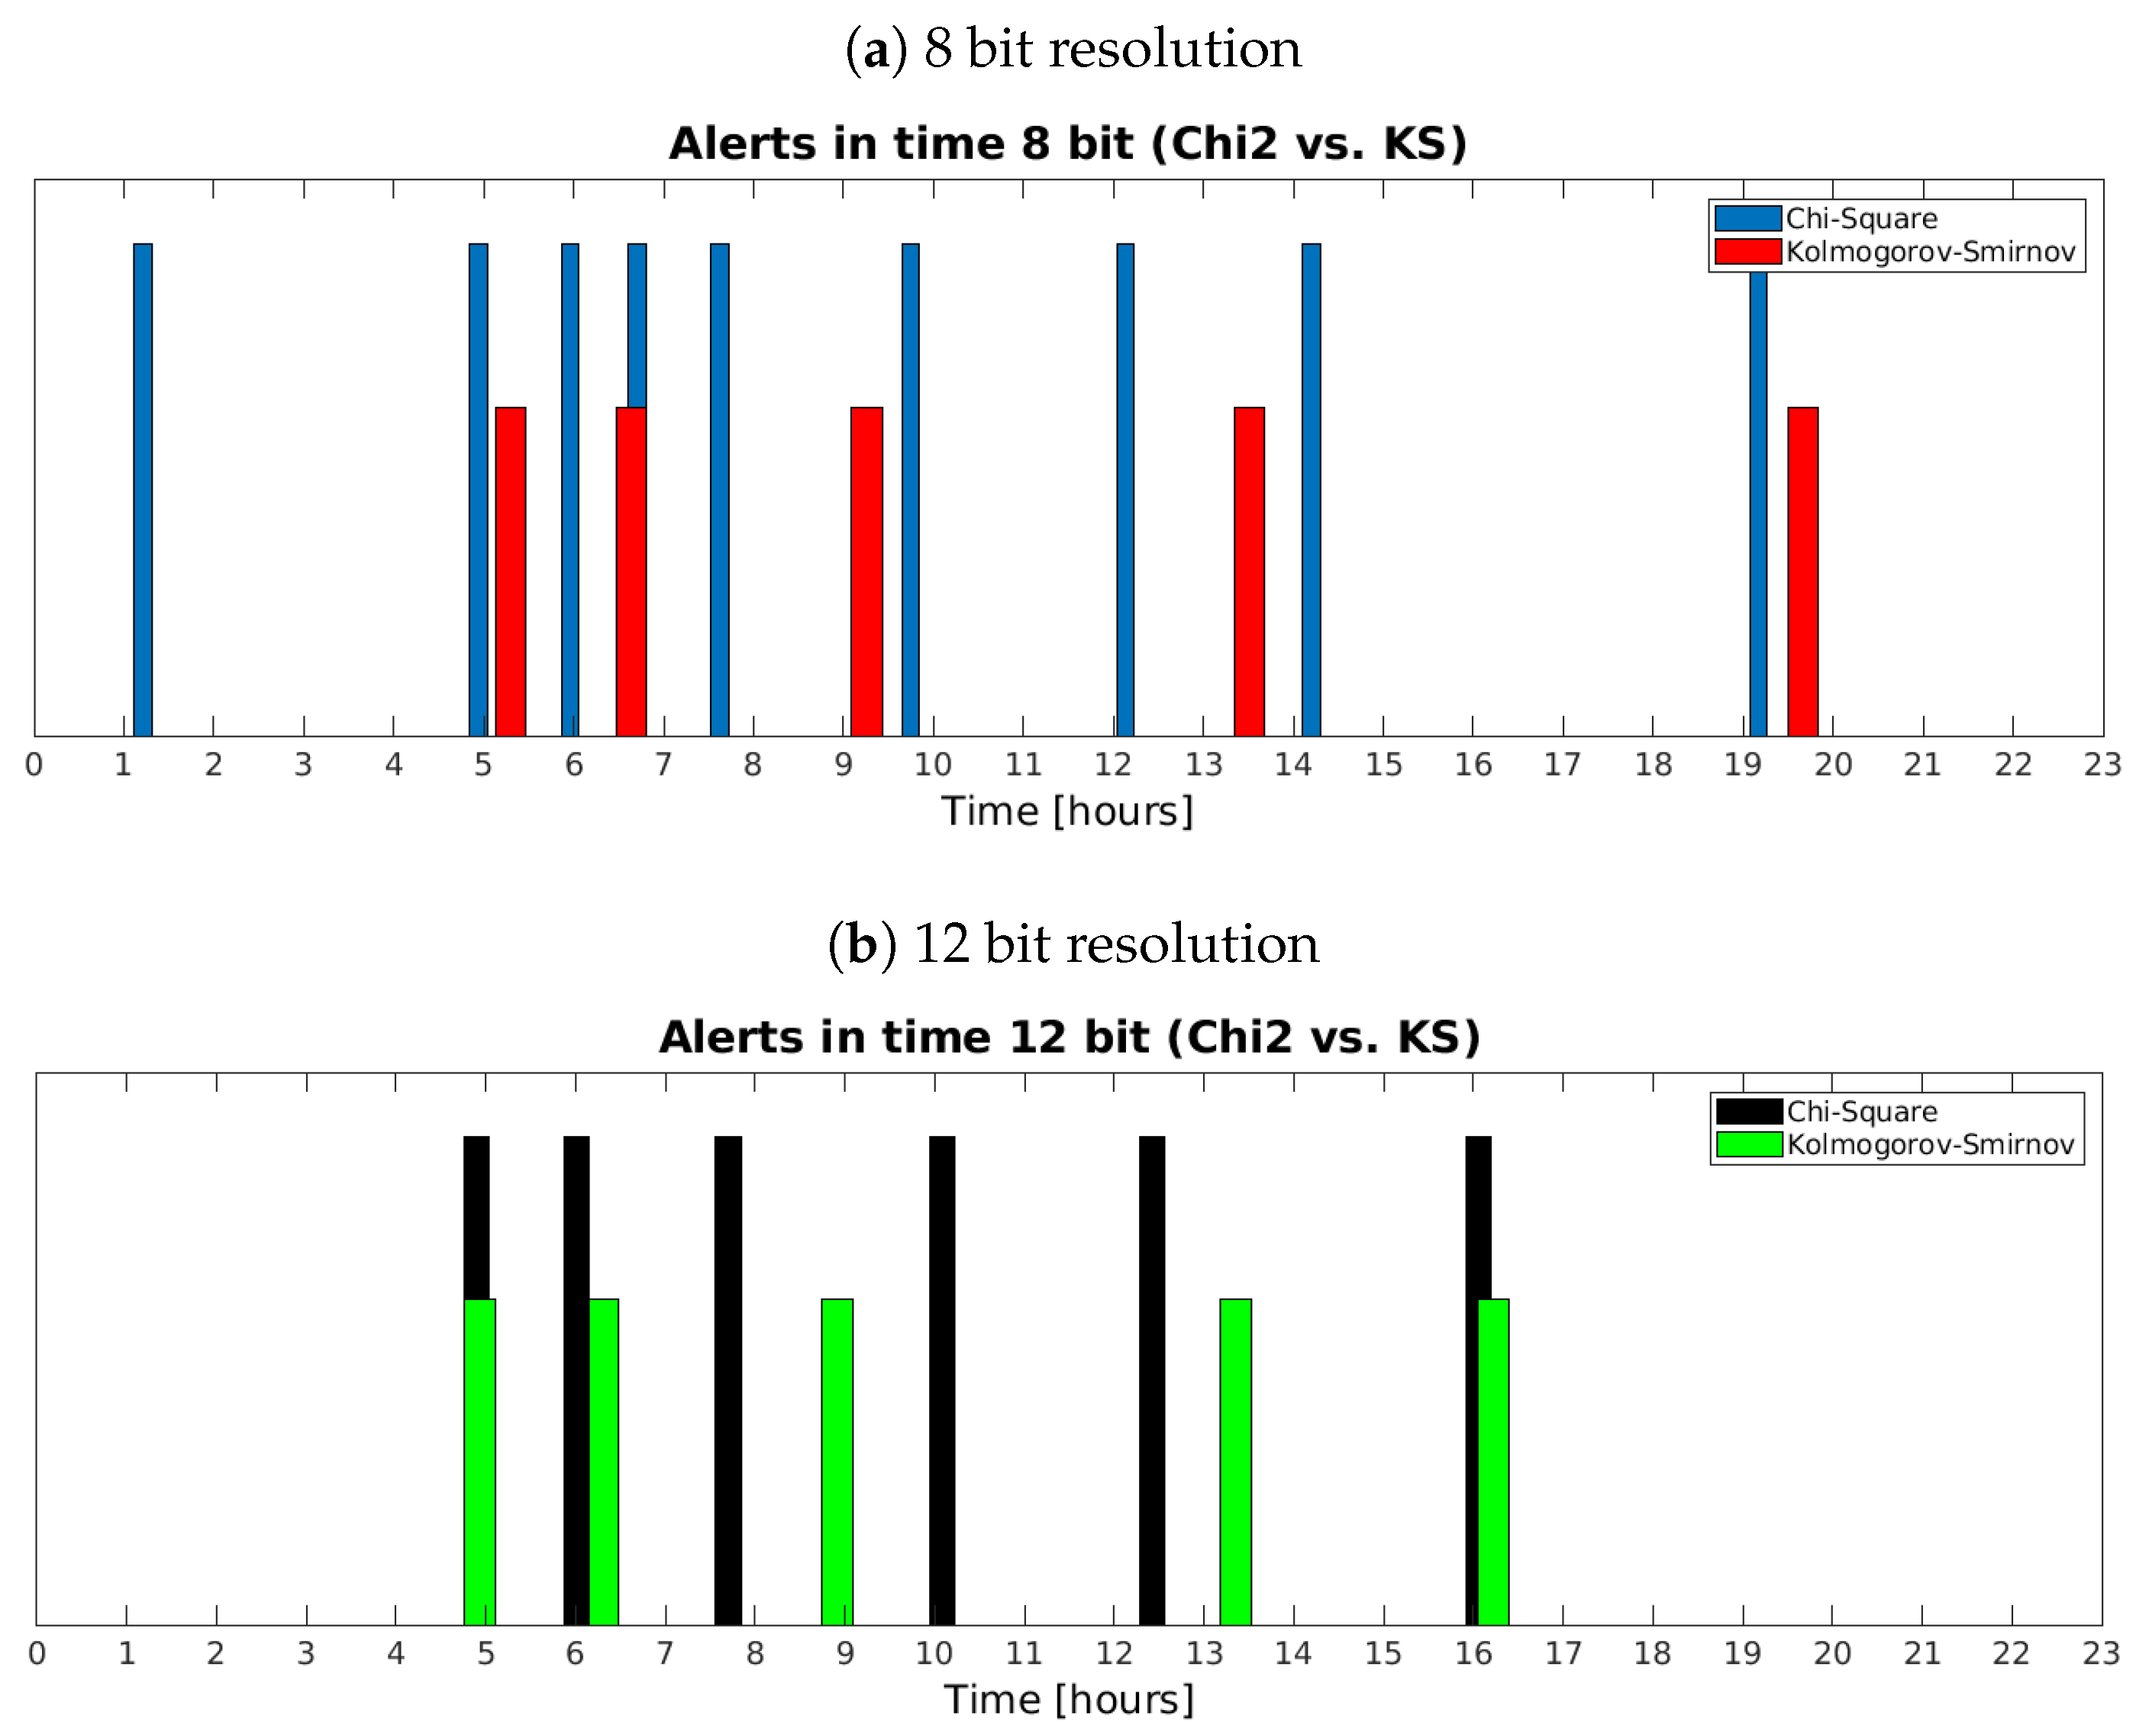
6.1. Preliminary Experiments: Setting the Resolution
The first experimental session aimed at evaluating the role played by the analog-to-digital conversion in the monitoring system. Thus, given a specimen under test, the signals were acquired in parallel by two Picoscope adopting a common fullscale (20 V) and different resolutions in the ADC: 8 bit and 12 bit, respectively. The 8-bit resolution actually corresponds to the most adopted configuration in the literature for sampling of PD signals. The 12-bit resolution has been included in the experiment to analyze the behavior of the anomaly detection strategy when higher sampling resolutions are available. The status of the specimen was monitored every two minutes, with a time window = 0.5 s.
Figure 7 shows—on a time scale—the alerts generated by the monitoring system for one of the specimens under test. In this case, the specimen breakdown occurred after 23 h.
Figure 7a refers to the monitoring system adopting a 8-bit resolution. The red bars tag the alerts generated by the KS test, while the blue bars tag the alerts generated by the Chi2 test. Analogously,
Figure 7b gives the alerts generated by the monitoring system adopting a 12-bit resolution. Here, the green bars correspond to KS test and the black bars correspond to the Chi2 test. In the 8-bit setup, the anomaly detection unit based on Chi2 test generated the first alert after one hour. The second alert occurred after 5 h; in the following three hours, the alerts occurred almost periodically. Then, the gap between successive alerts progressively increased as aging proceeded. The anomaly detection unit based on KS test produced fewer alerts. However, it is interesting to note that also in this case the gap between successive alerts progressively widened as the status of the specimen worsen. Possibly the higher sensitivity of the Chi2 test may depend on the setup of parameter
, which has been set empirically to
. In the 12-bit setup the sequence of alerts almost follows the same trend. Again, the Chi2 test provides more sensitivity.
In general, as expected, the experiments revealed that the 12-bit setup is more robust to the quantization noise. In this sense, the early alert generated by the Chi2 unit in the 8-bit setup of the experiment showed in
Figure 7b might be the effect of a coarser quantization. Indeed, KS test proved less sensitive to changes in resolution. Overall, one should also consider that the 8-bit setup represents a more cost effective solution. In the following, only the 8-bit setup will be considered.
6.2. Experimental Session
The second experimental session aimed to evaluate the ability of the proposed monitoring system to support a maintenance apparatus. The session involved a total of six specimens and the measurement setup schematized in
Figure 6. The PD signals have been sampled using a 8-bit resolution. The status of a specimen was monitored every minute, with a time window
s.
Figure 8 gives the results obtained in the experiments involving specimen #1. The figure compares the outcomes of the proposed monitoring system with those of the state-of-the-art method describe in
Section 2. The plot in
Figure 8a shows the alert generated by the proposed monitoring system by adopting the same format of
Figure 7a. The plot in
Figure 8b gives—on the same time scale of
Figure 8a—the average apparent charge per cycle
computed as per (
3); here, the values of
have been normalized in the range
. The plot in
Figure 8c provides—on the same time scale of
Figure 8a—the residuals referred to the linear regression computed on the data plotted in
Figure 8 as per (
4). As specified in
Section 2 the linear regression is computed after removing the data belonging to the transient zone.
Figure 8b proves that in this experiment the transient ended after about four hours and a half.
Figure 8 stimulates a few interesting observations. First, the sequence of periodical alerts in
Figure 8a starts exactly when the average apparent charge per cycle shows that the transient has ended (as per
Figure 8b). Second, the proposed monitoring system warns the observer of the incipient critical aging of the specimen well before the breakdown.
Figure 8a shows that the alerts lose the periodical pattern after the 10th hour. That is, the monitoring system indicates that the specimen has entered in a new phase, which in practice corresponds to the incipient critical aging. Actually, the same information is conveyed by the average apparent charge per cycle a few hours later.
Figure 8c shows that
deviates significantly from the linear trend only when the breakdown is very close. Overall, one may conclude that the proposed monitoring system seems able to effectively support a predictive maintenance procedure by adopting a fully unsupervised strategy.
Figure 9 shows the outcomes of the experiments involving the remaining five specimens. For each specimen, the results have been presented by adopting the same format of
Figure 8. In general, the observations made for specimen #1 still hold. The sequence of periodic alerts in the proposed monitoring system marks the end of the first part of the specimen’s lifetime. Indeed, the gap between subsequent alerts starts increasing when the third part of the specimen’s lifetime begins. It is easy to note that this event always anticipate the alarm conveyed by the trend of the average apparent charge per cycle, which departs from the expected linear progression when the breakdown is approaching.
It is worth noting that the sequence of alerts generated by the proposed monitoring system depends on the adopted anomaly detection criterion. Thus, one may get different outcomes when adopting KS test rather than Chi2 test. In general, the Chi2 test produces more alerts than the KS test. As discussed above, such behavior might be related to the setup of the parameter in the Chi2 test. However, all the experiments confirm that the monitoring system can reliably assess aging in the specimens. Such result is very interesting in that the proposed approach does not need to rely on any knowledge base.
The experimental session also inspires further developments. The proposed monitoring system based on alerts may act as an automated trigger for the monitoring system based on the average apparent charge per cycle proposed in [
26,
27]. In practice, as the sequence of periodical alerts corresponds to the end of the transient, one can automatically identify the instant
from which linearity is expected in
. Thus, an augmented monitoring system combining the two strategies could be able to start collecting
only when the transient has ended. Such data may be sent in real time to a central unit entitled to estimate the value of parameters
K,
and
in (
6) by exploiting the data acquired from different electrical machines.
6.3. Computational Cost
The proposed monitoring system has been deployed on a Raspberry Pi 3 Model B+ [
43] by using the Python programming language. The tests aimed at evaluating the computational cost of the two main blocks, i.e.,
Processing Unit and
Online Alert Unit. Thus, the execution times of the two blocks have been assessed by running the monitoring system on the Raspberry Pi, which represent a suitable example of low-cost embedded computing unit. In the adopted setup, the PD signals were sampled using a 8-bit resolution. The status of a specimen was monitored every minute, with a time window
s.
Table 1 gives the execution times for, respectively, the
Processing Unit, the
Online Alert Unit adopting the Chi2 test, and the
Online Alert Unit adopting the KS test. For each block the average execution time and the maximum execution time are showed. As expected, the KS test brings about a larger execution time than the Chi2 test. Actually, in the proposed system the KS test processes
, which in general is an high-dimensional vector; conversely, the Chi2 test processes
, which store the occurrences of an histogram with
.
Overall, the outcomes of this experiment proves that the monitoring system can achieve real-time performance on a low-cost embedded computer. In this sense, one should consider that in a real case the insulation systems aging is a very slow process. While in the proposed experiment the time interval between two acquisitions was set to one minute, in general one would set this time to a few hours. Accordingly, the execution times achieved on the Raspberry Pi can be considered insignificant on that time scale.

 ,
, 


