Energy and Exergy Analysis of a Flat-Plate Solar Air Heater Artificially Roughened and Coated with a Novel Solar Selective Coating


Abstract
1. Introduction
2. Materials and Methods
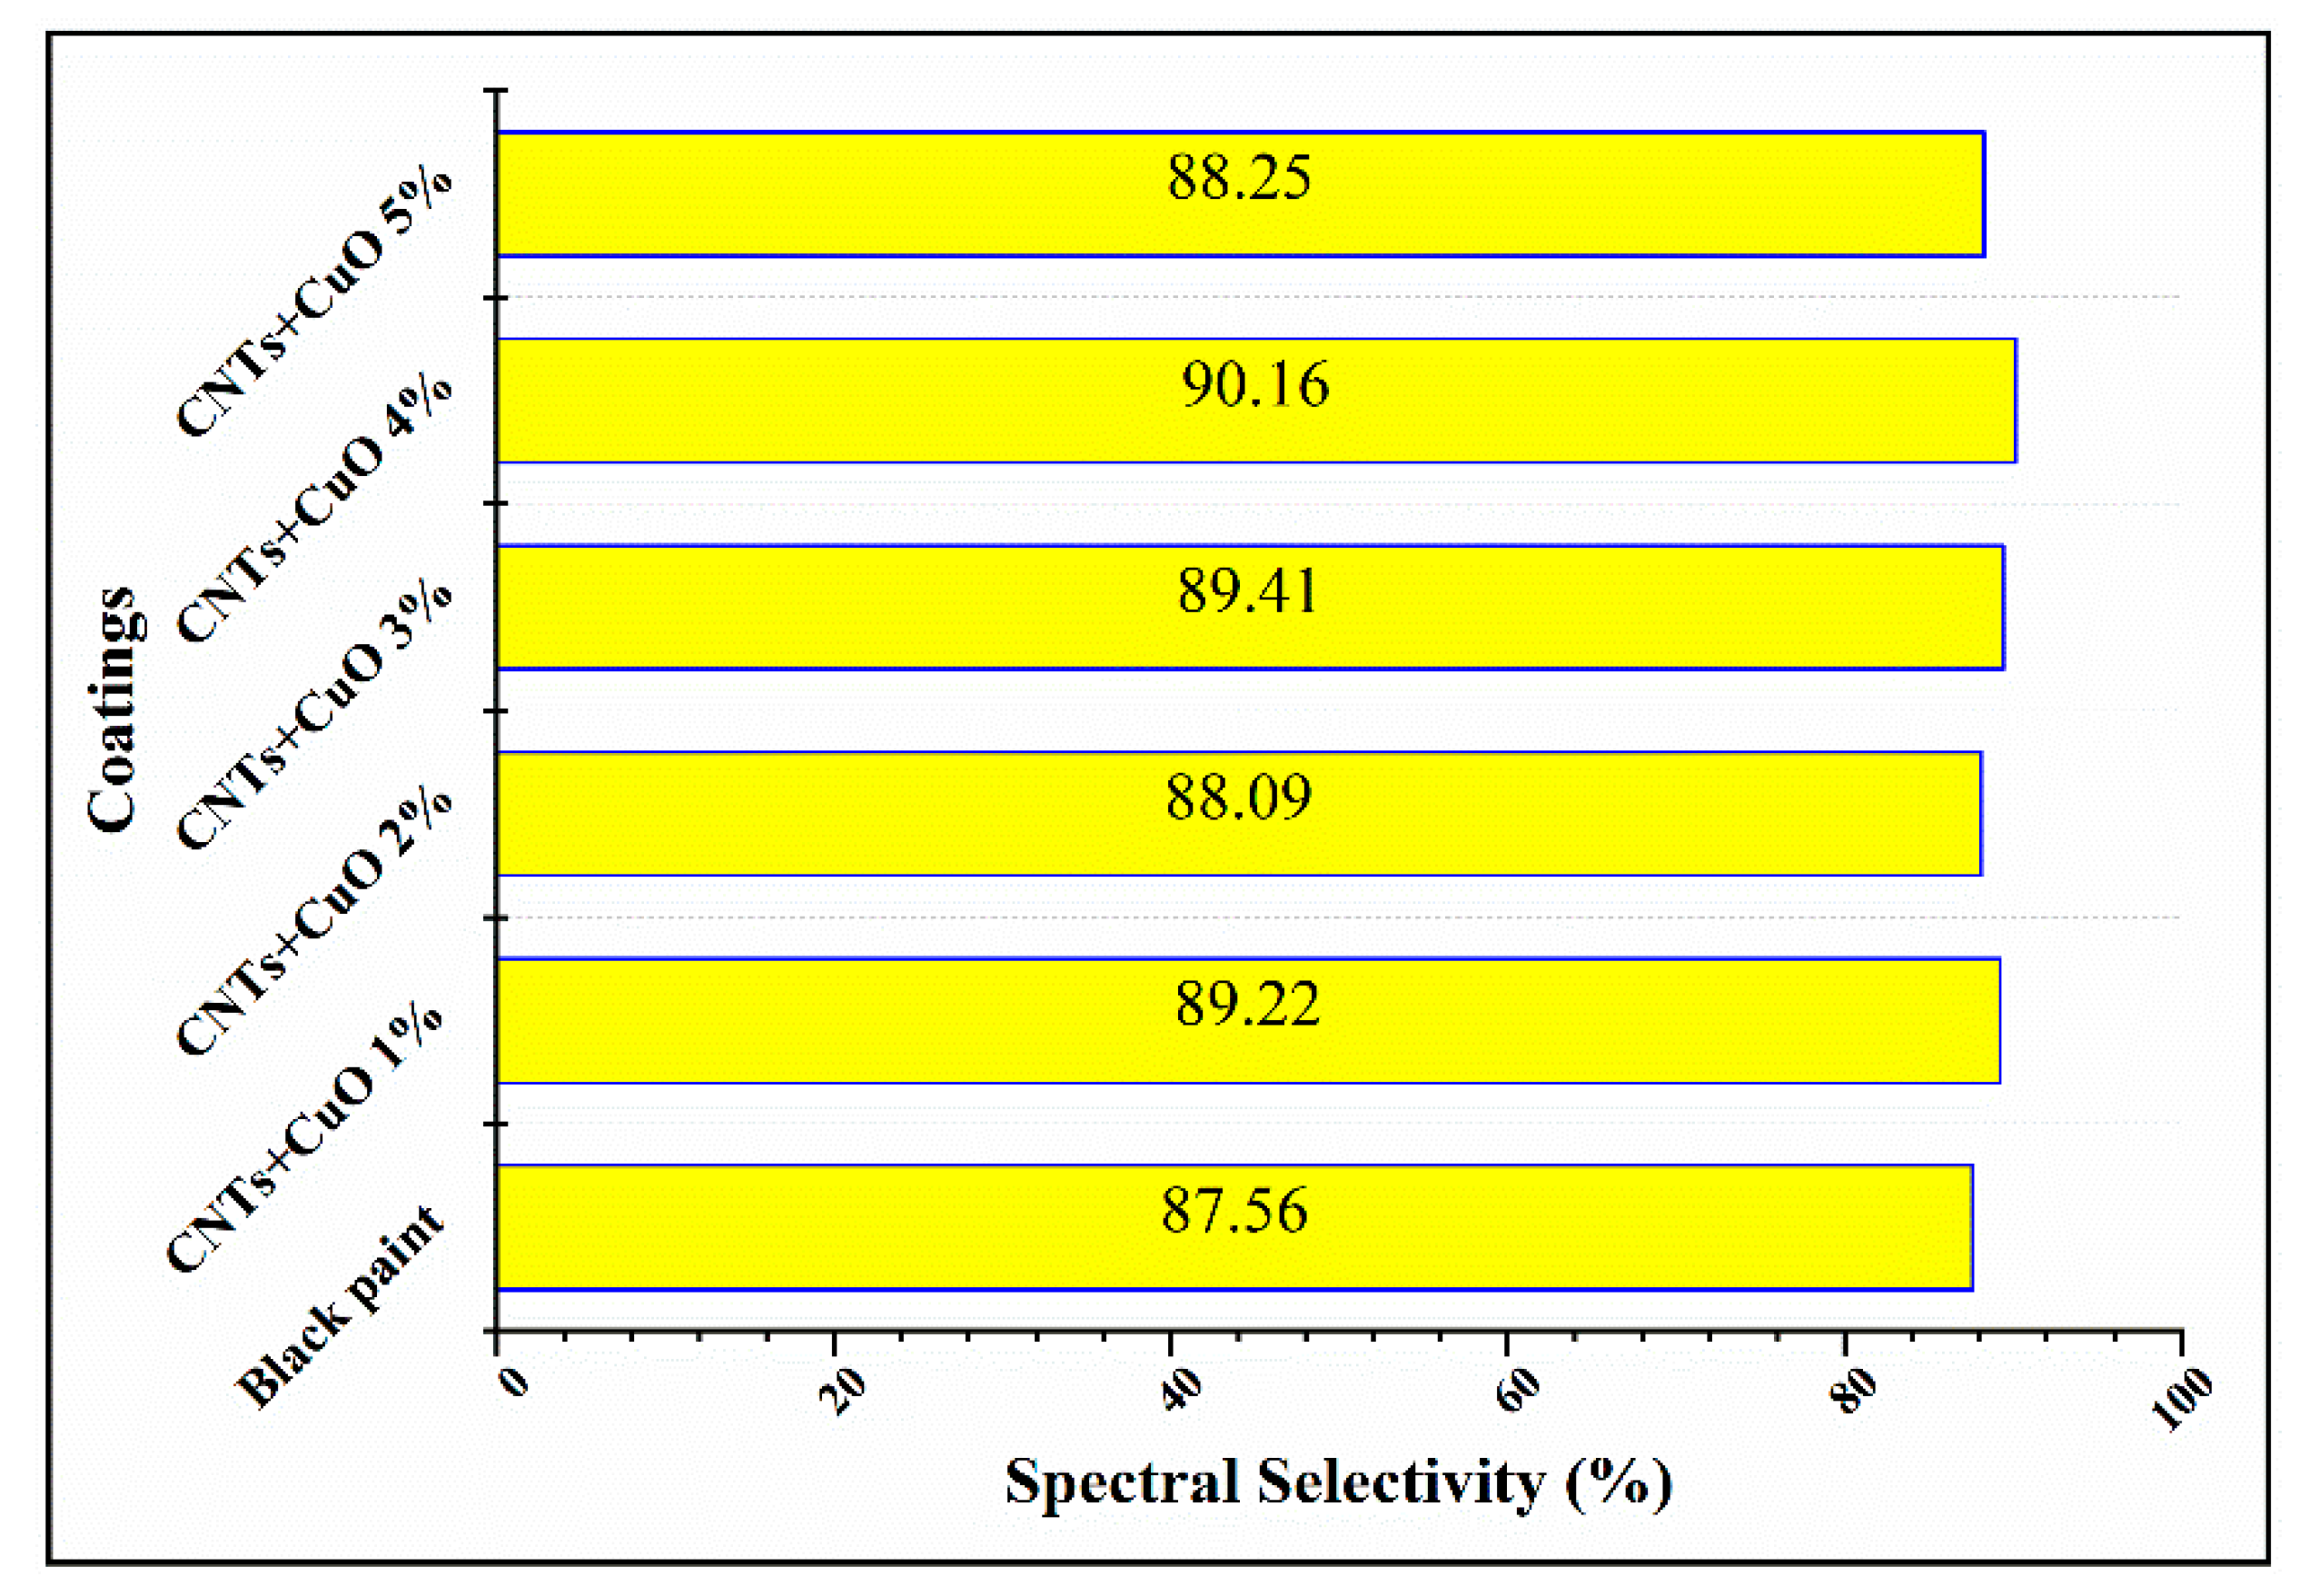
2.1. Coating Preparation
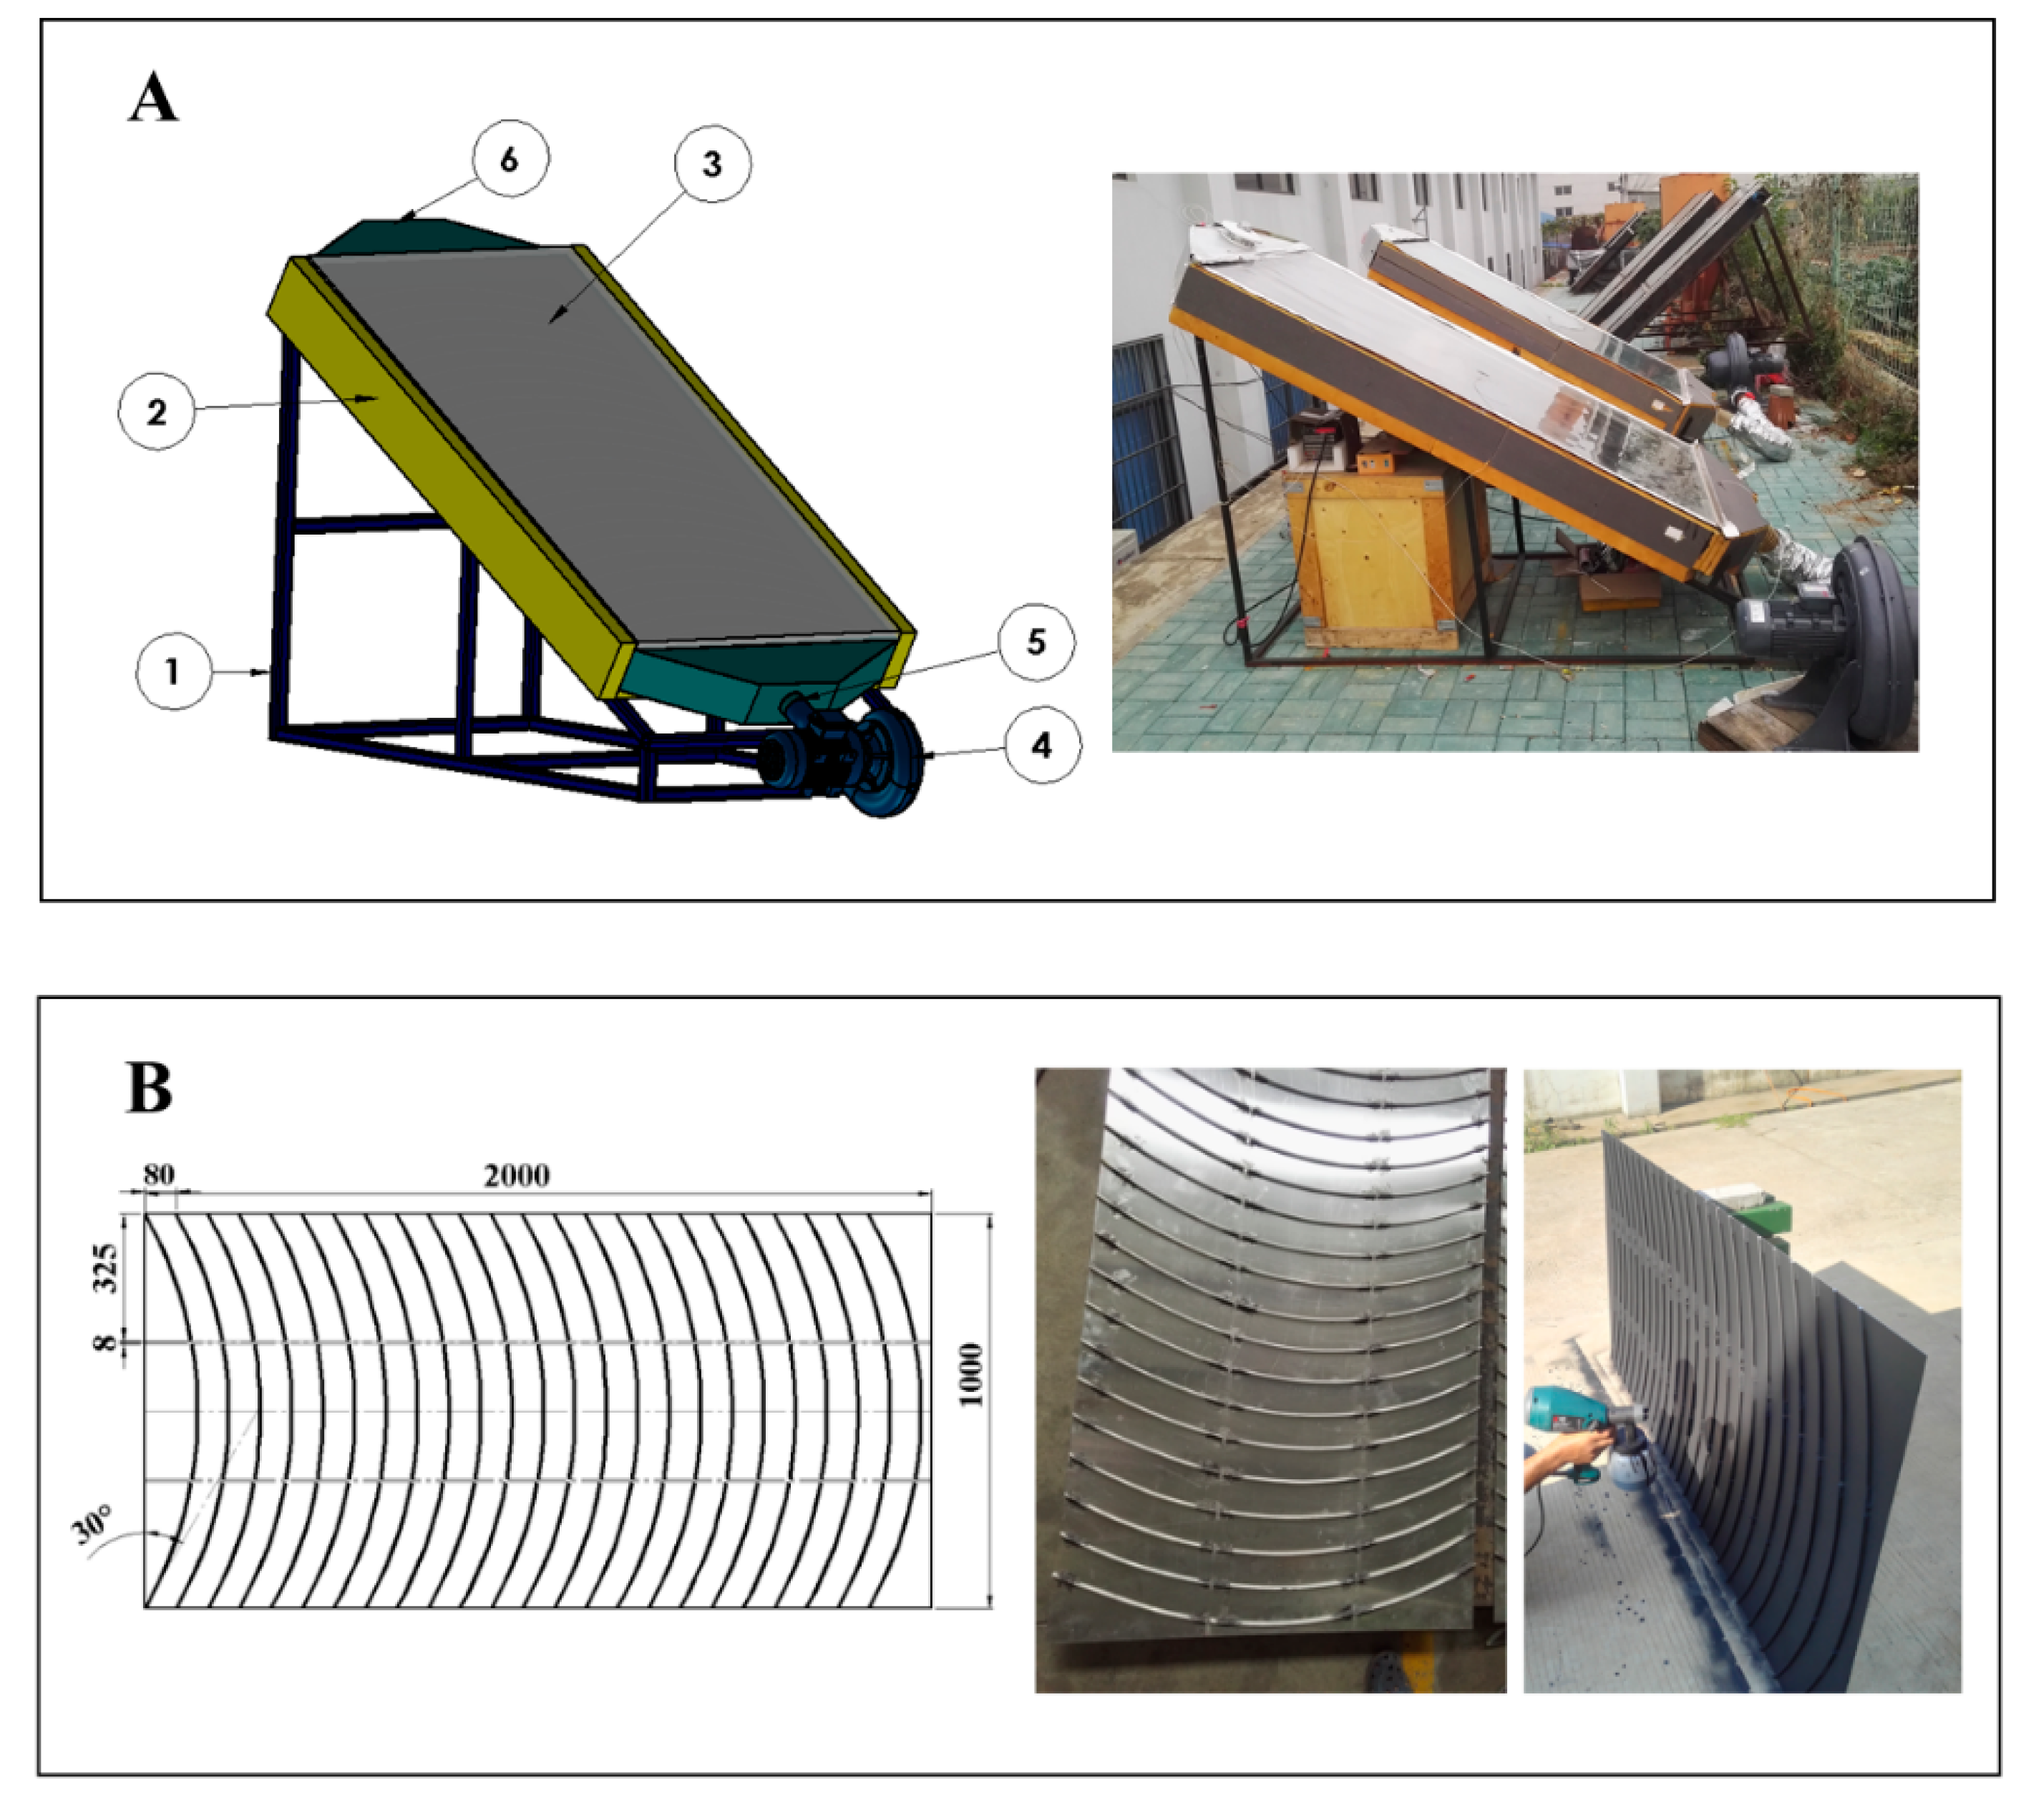
2.2. The Solar Air Heaters (SAHs) Installation
2.3. Performance Analysis of the Flat Plate Solar Air Heaters
2.4. Energetic and Exergetic Performance
2.5. Uncertainty Analysis
3. Results and Discussion
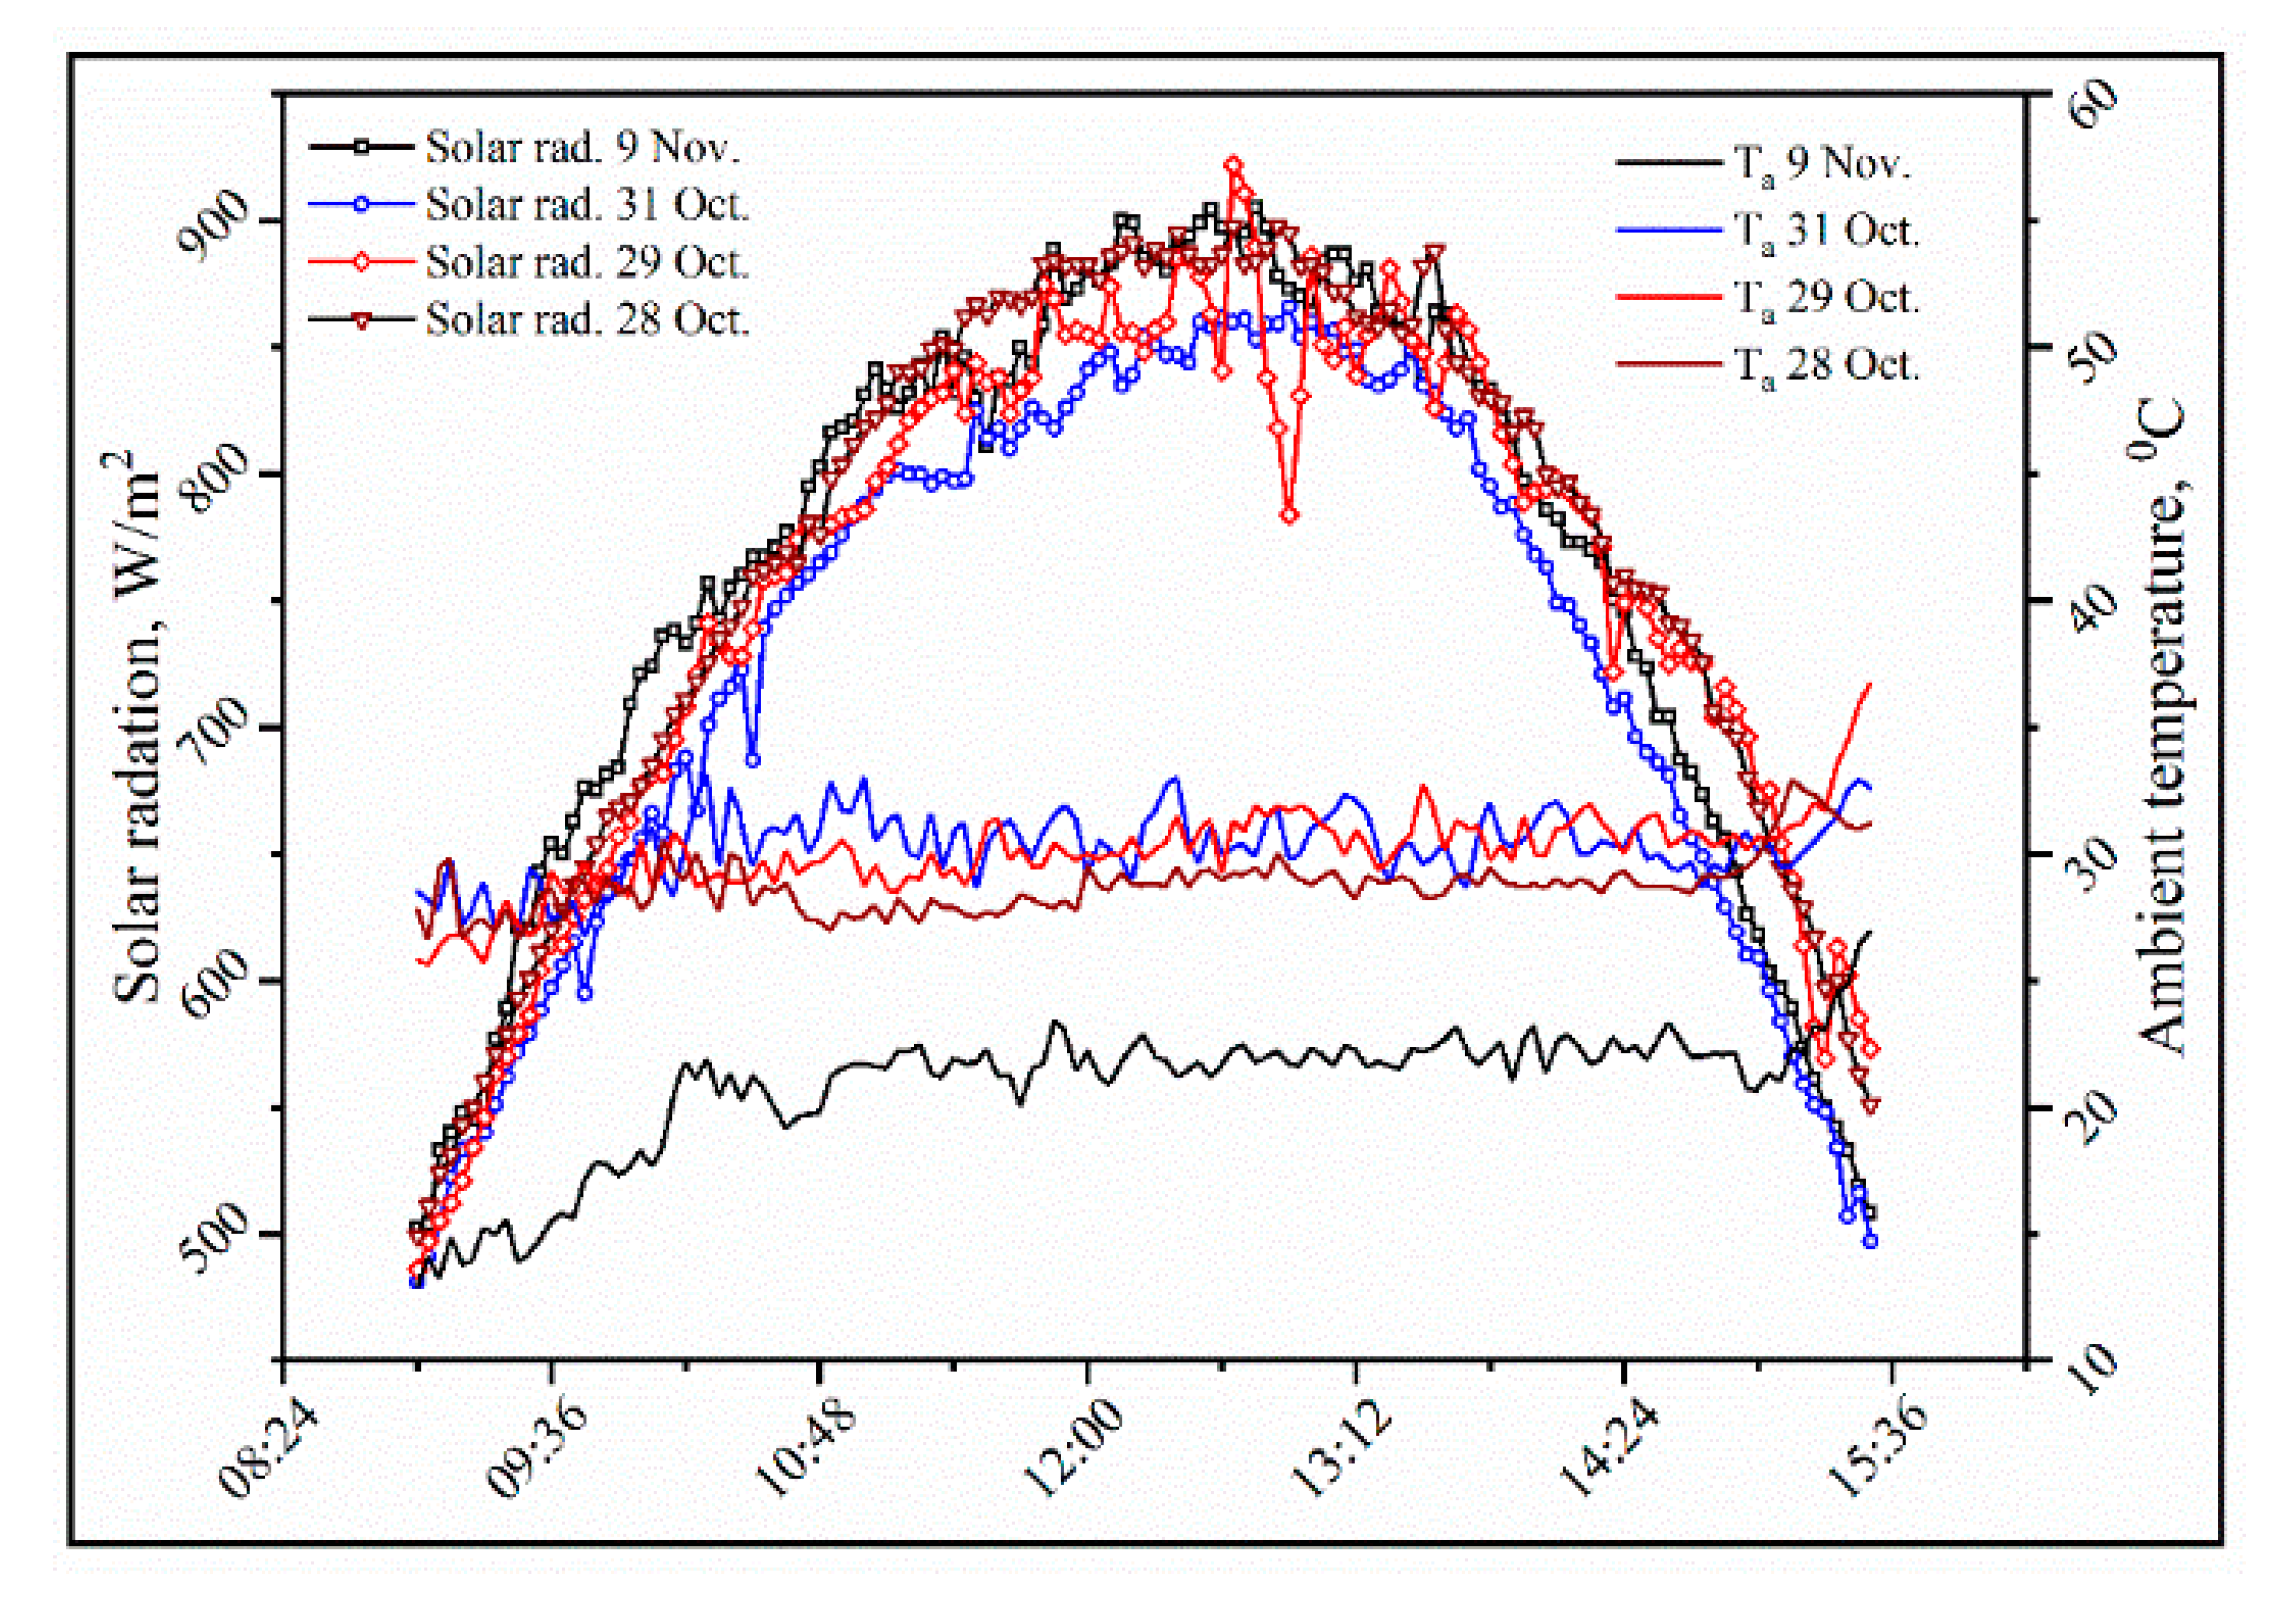
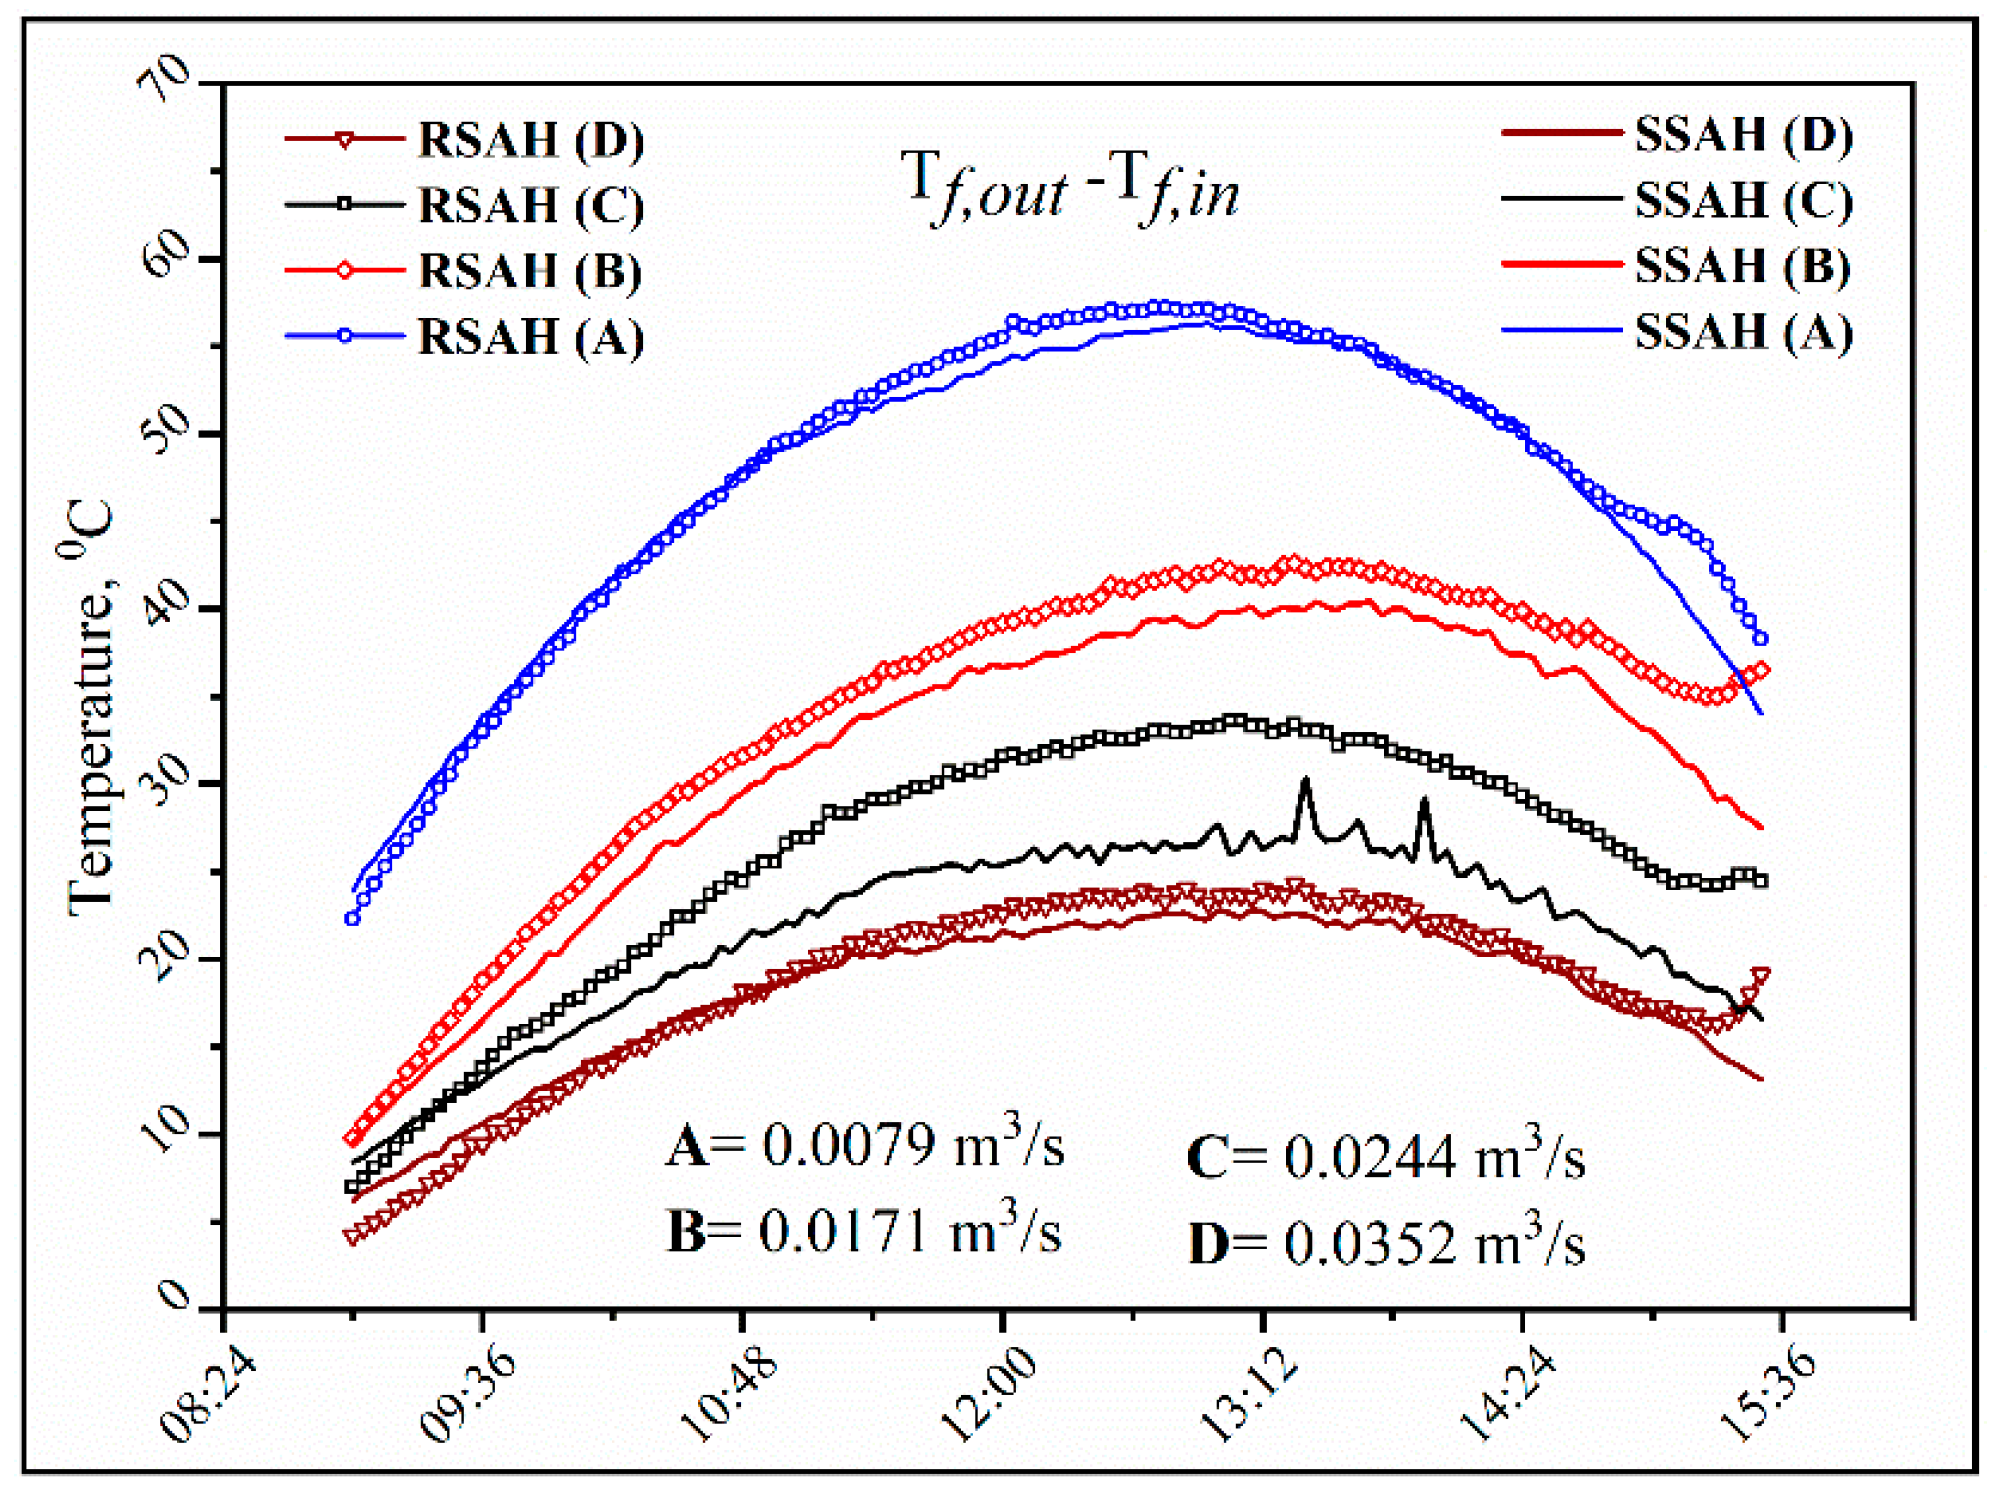
3.1. Variation of Solar Radiation, Ambient Temperature, SAHs Air Outlet, and Inlet Temperature Differences for Roughened and Smooth Solar Air Heaters, Respectively
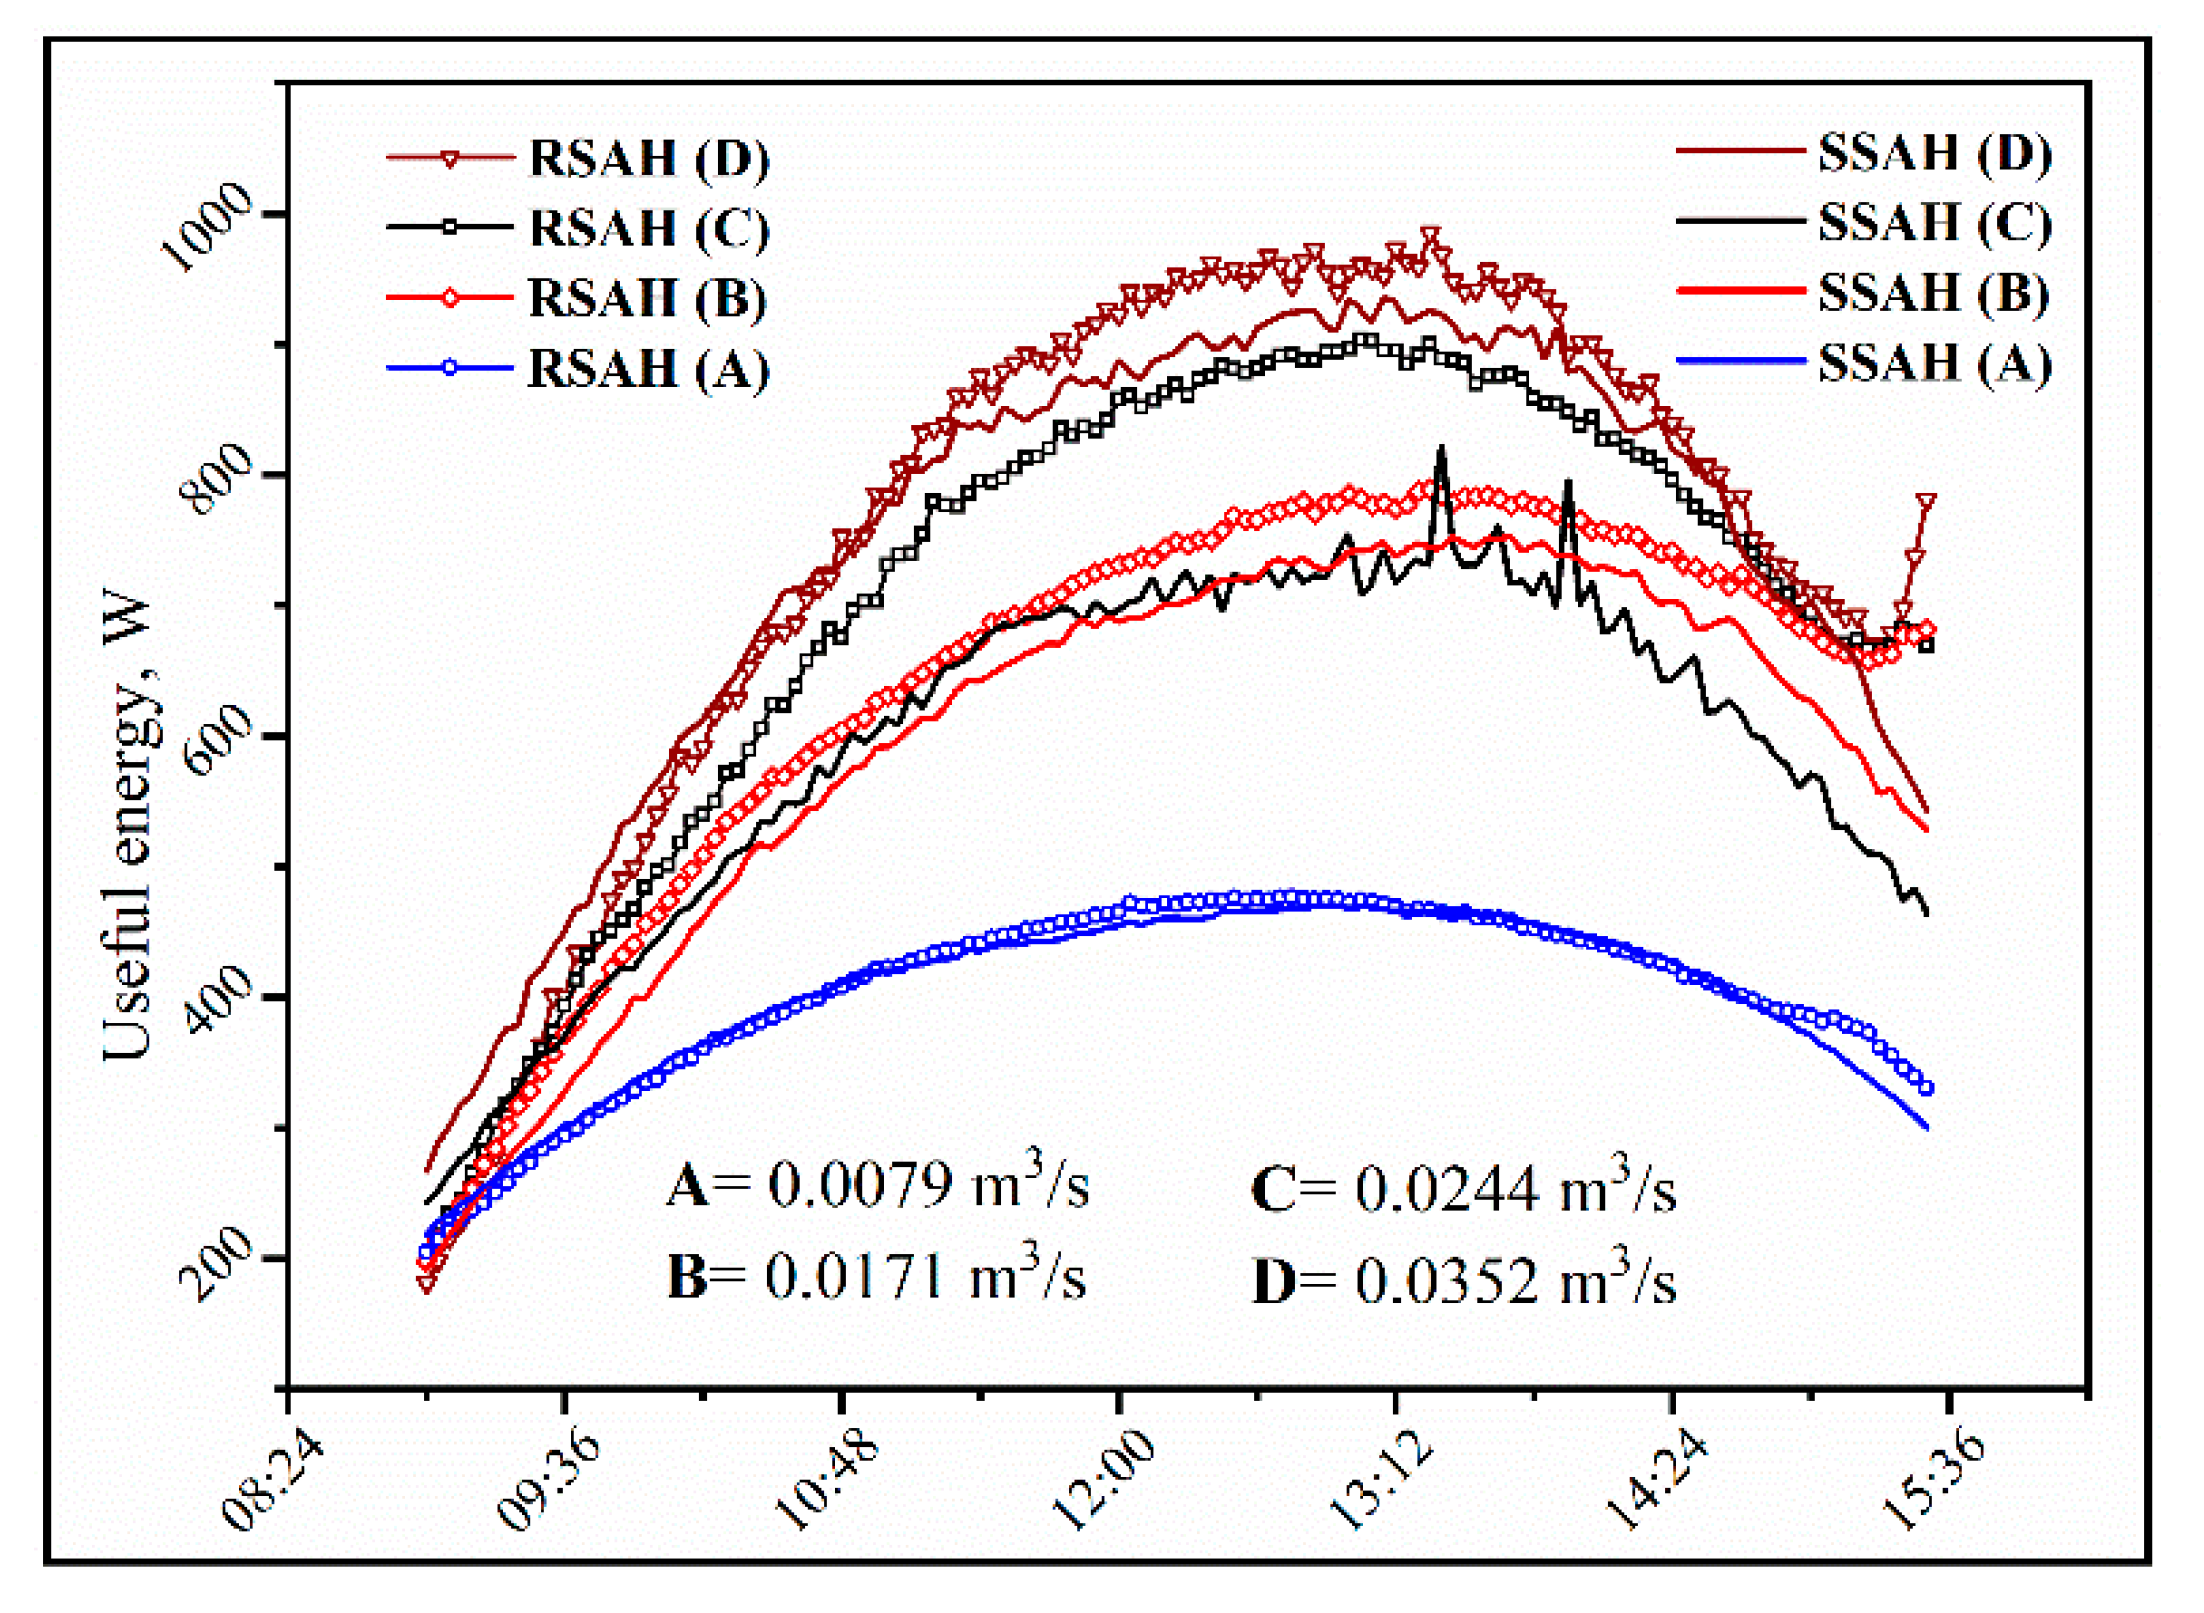
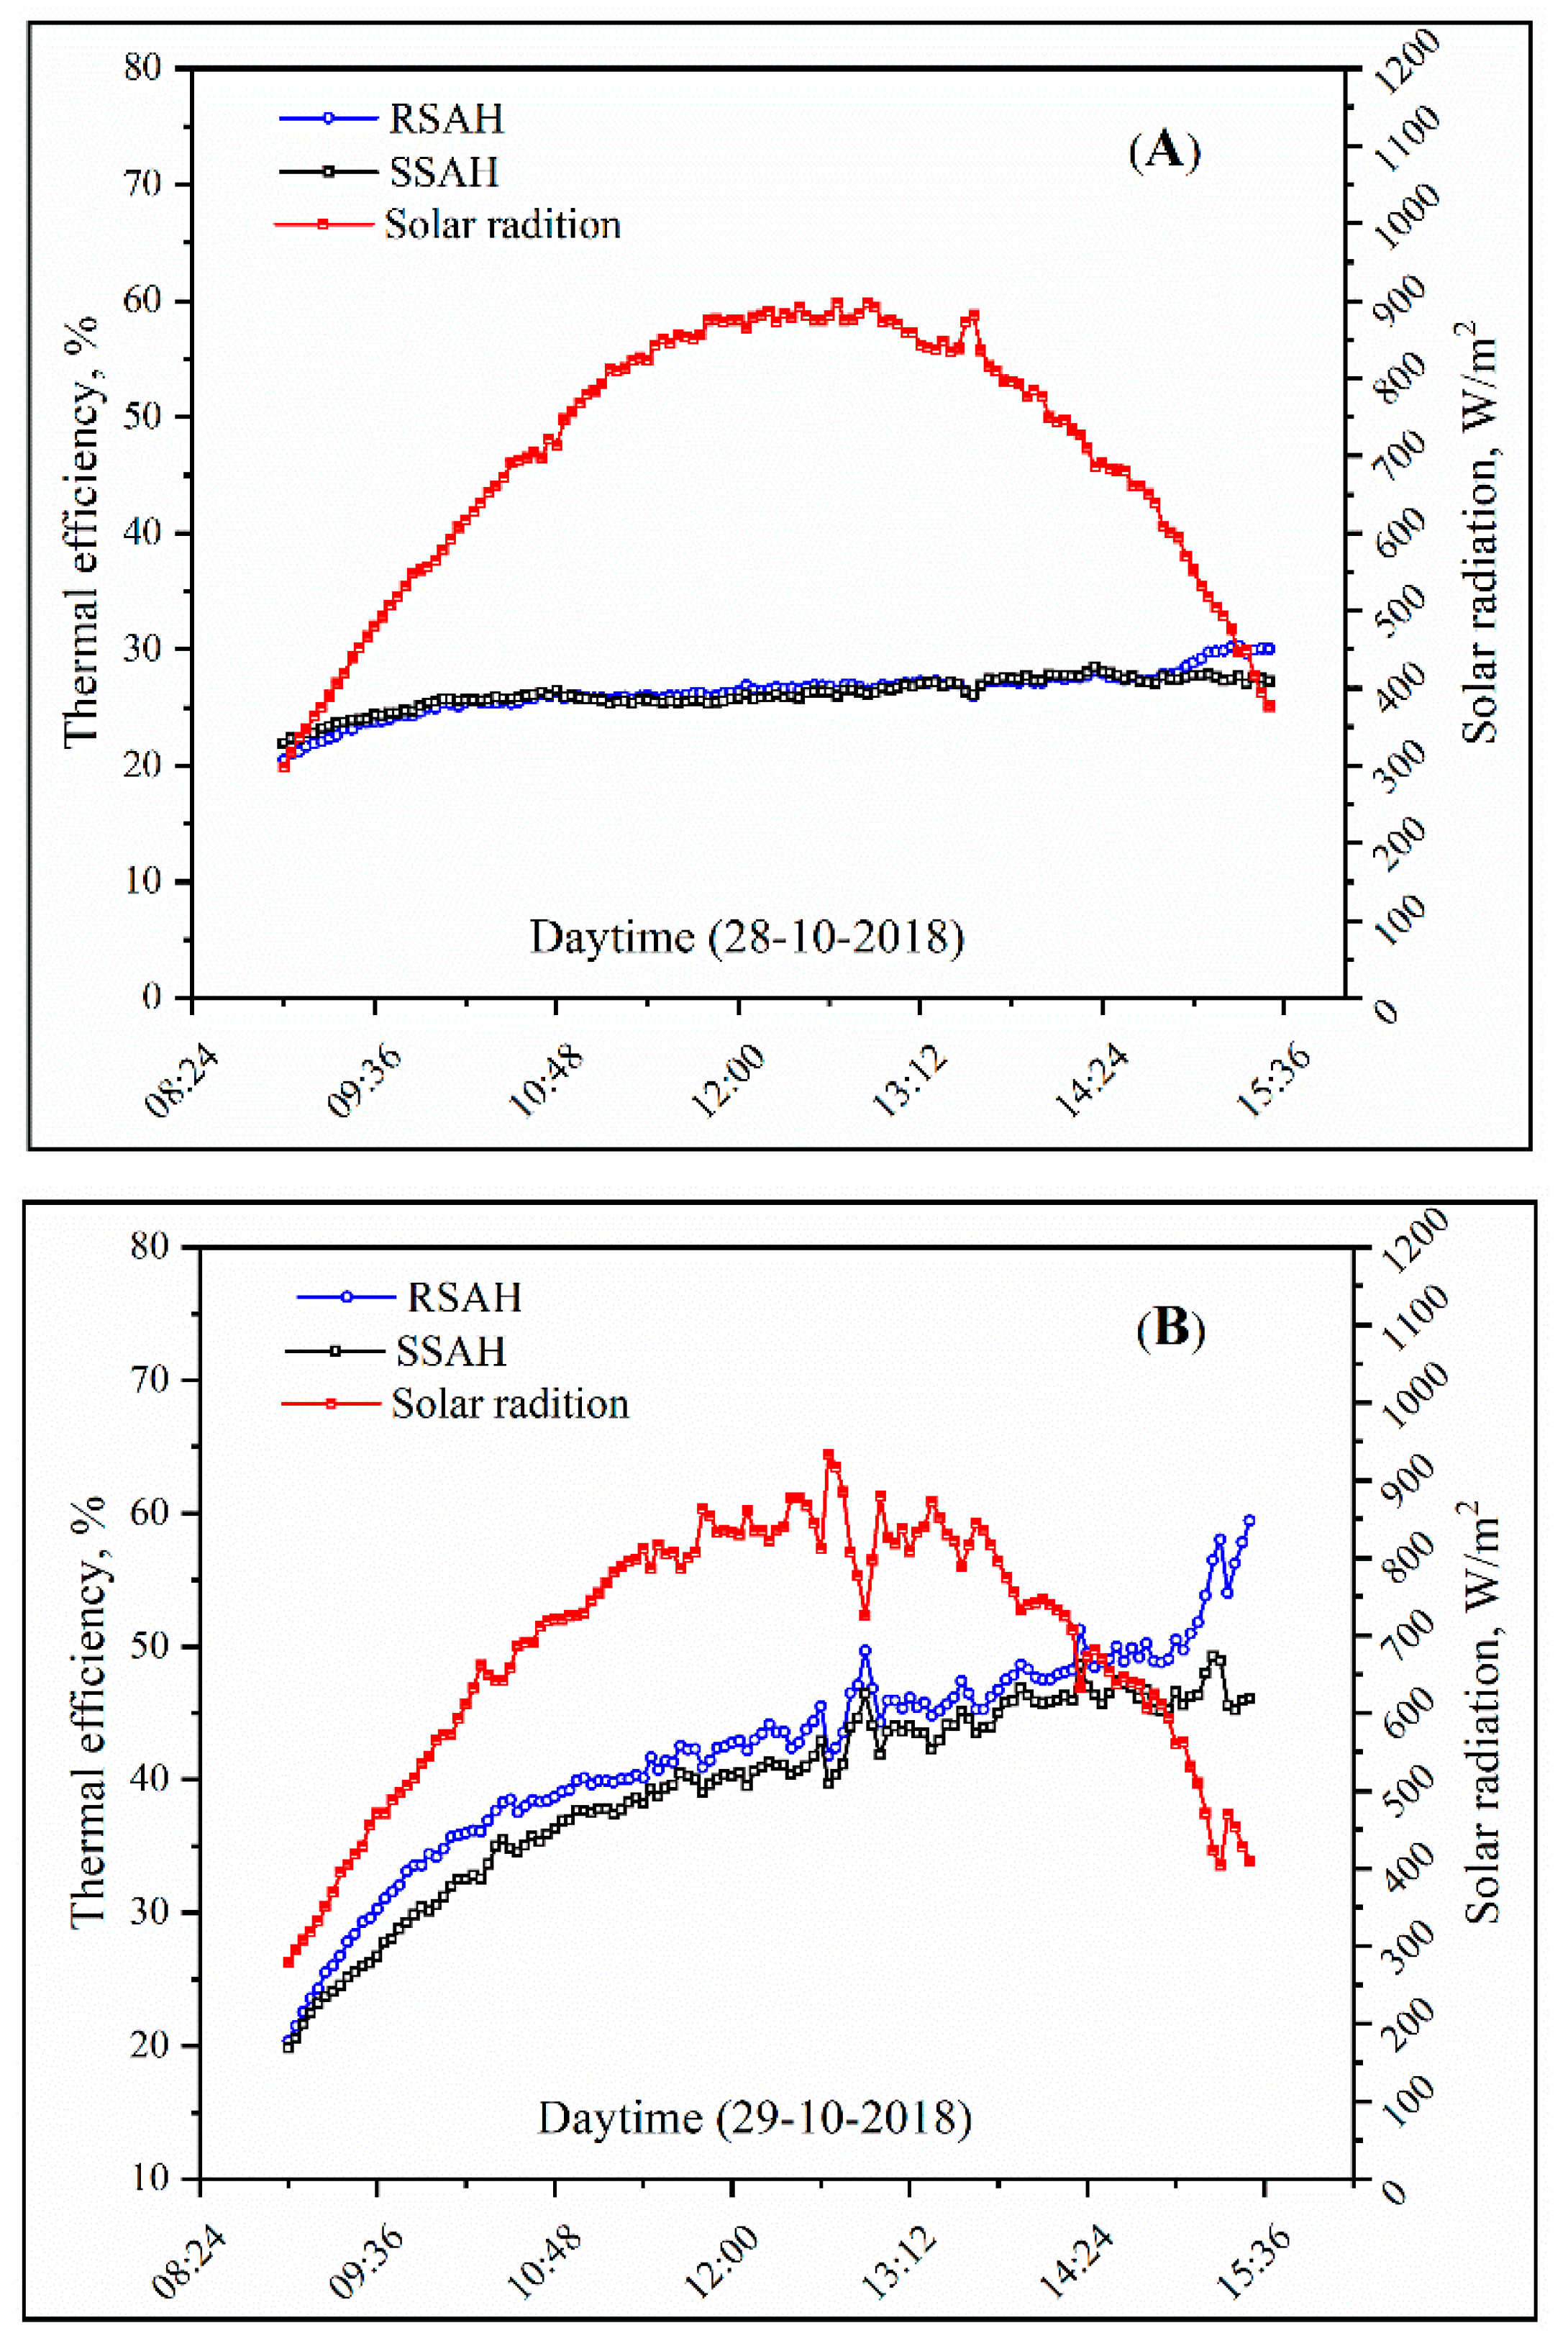
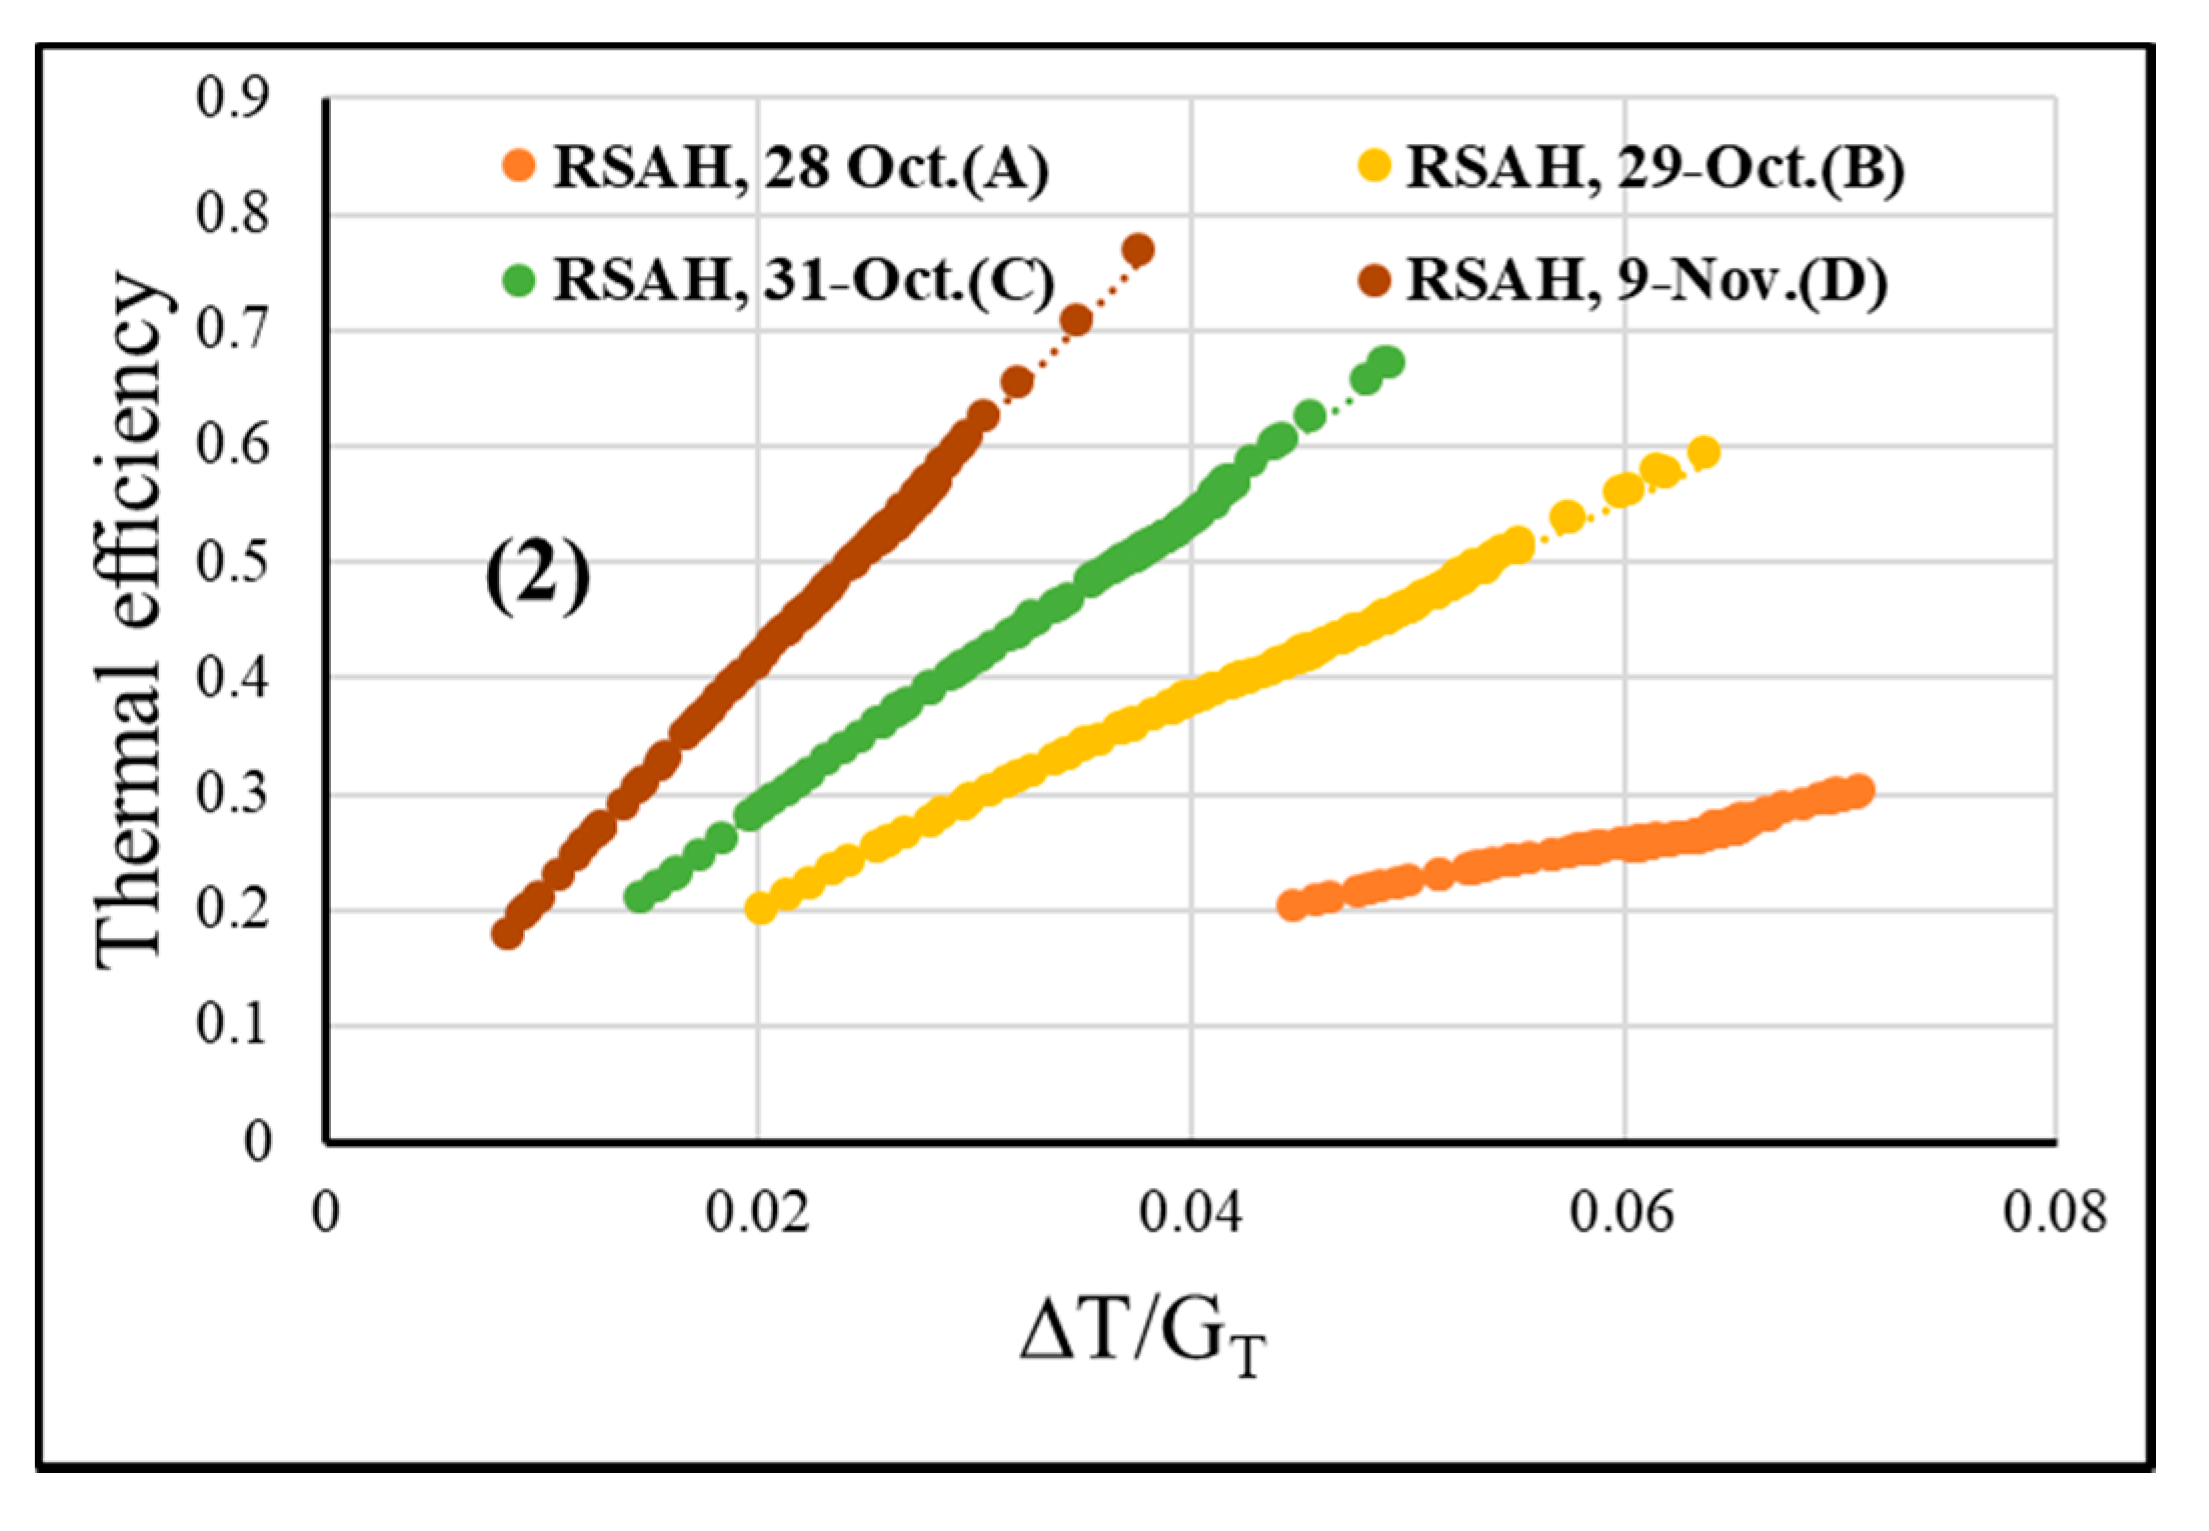
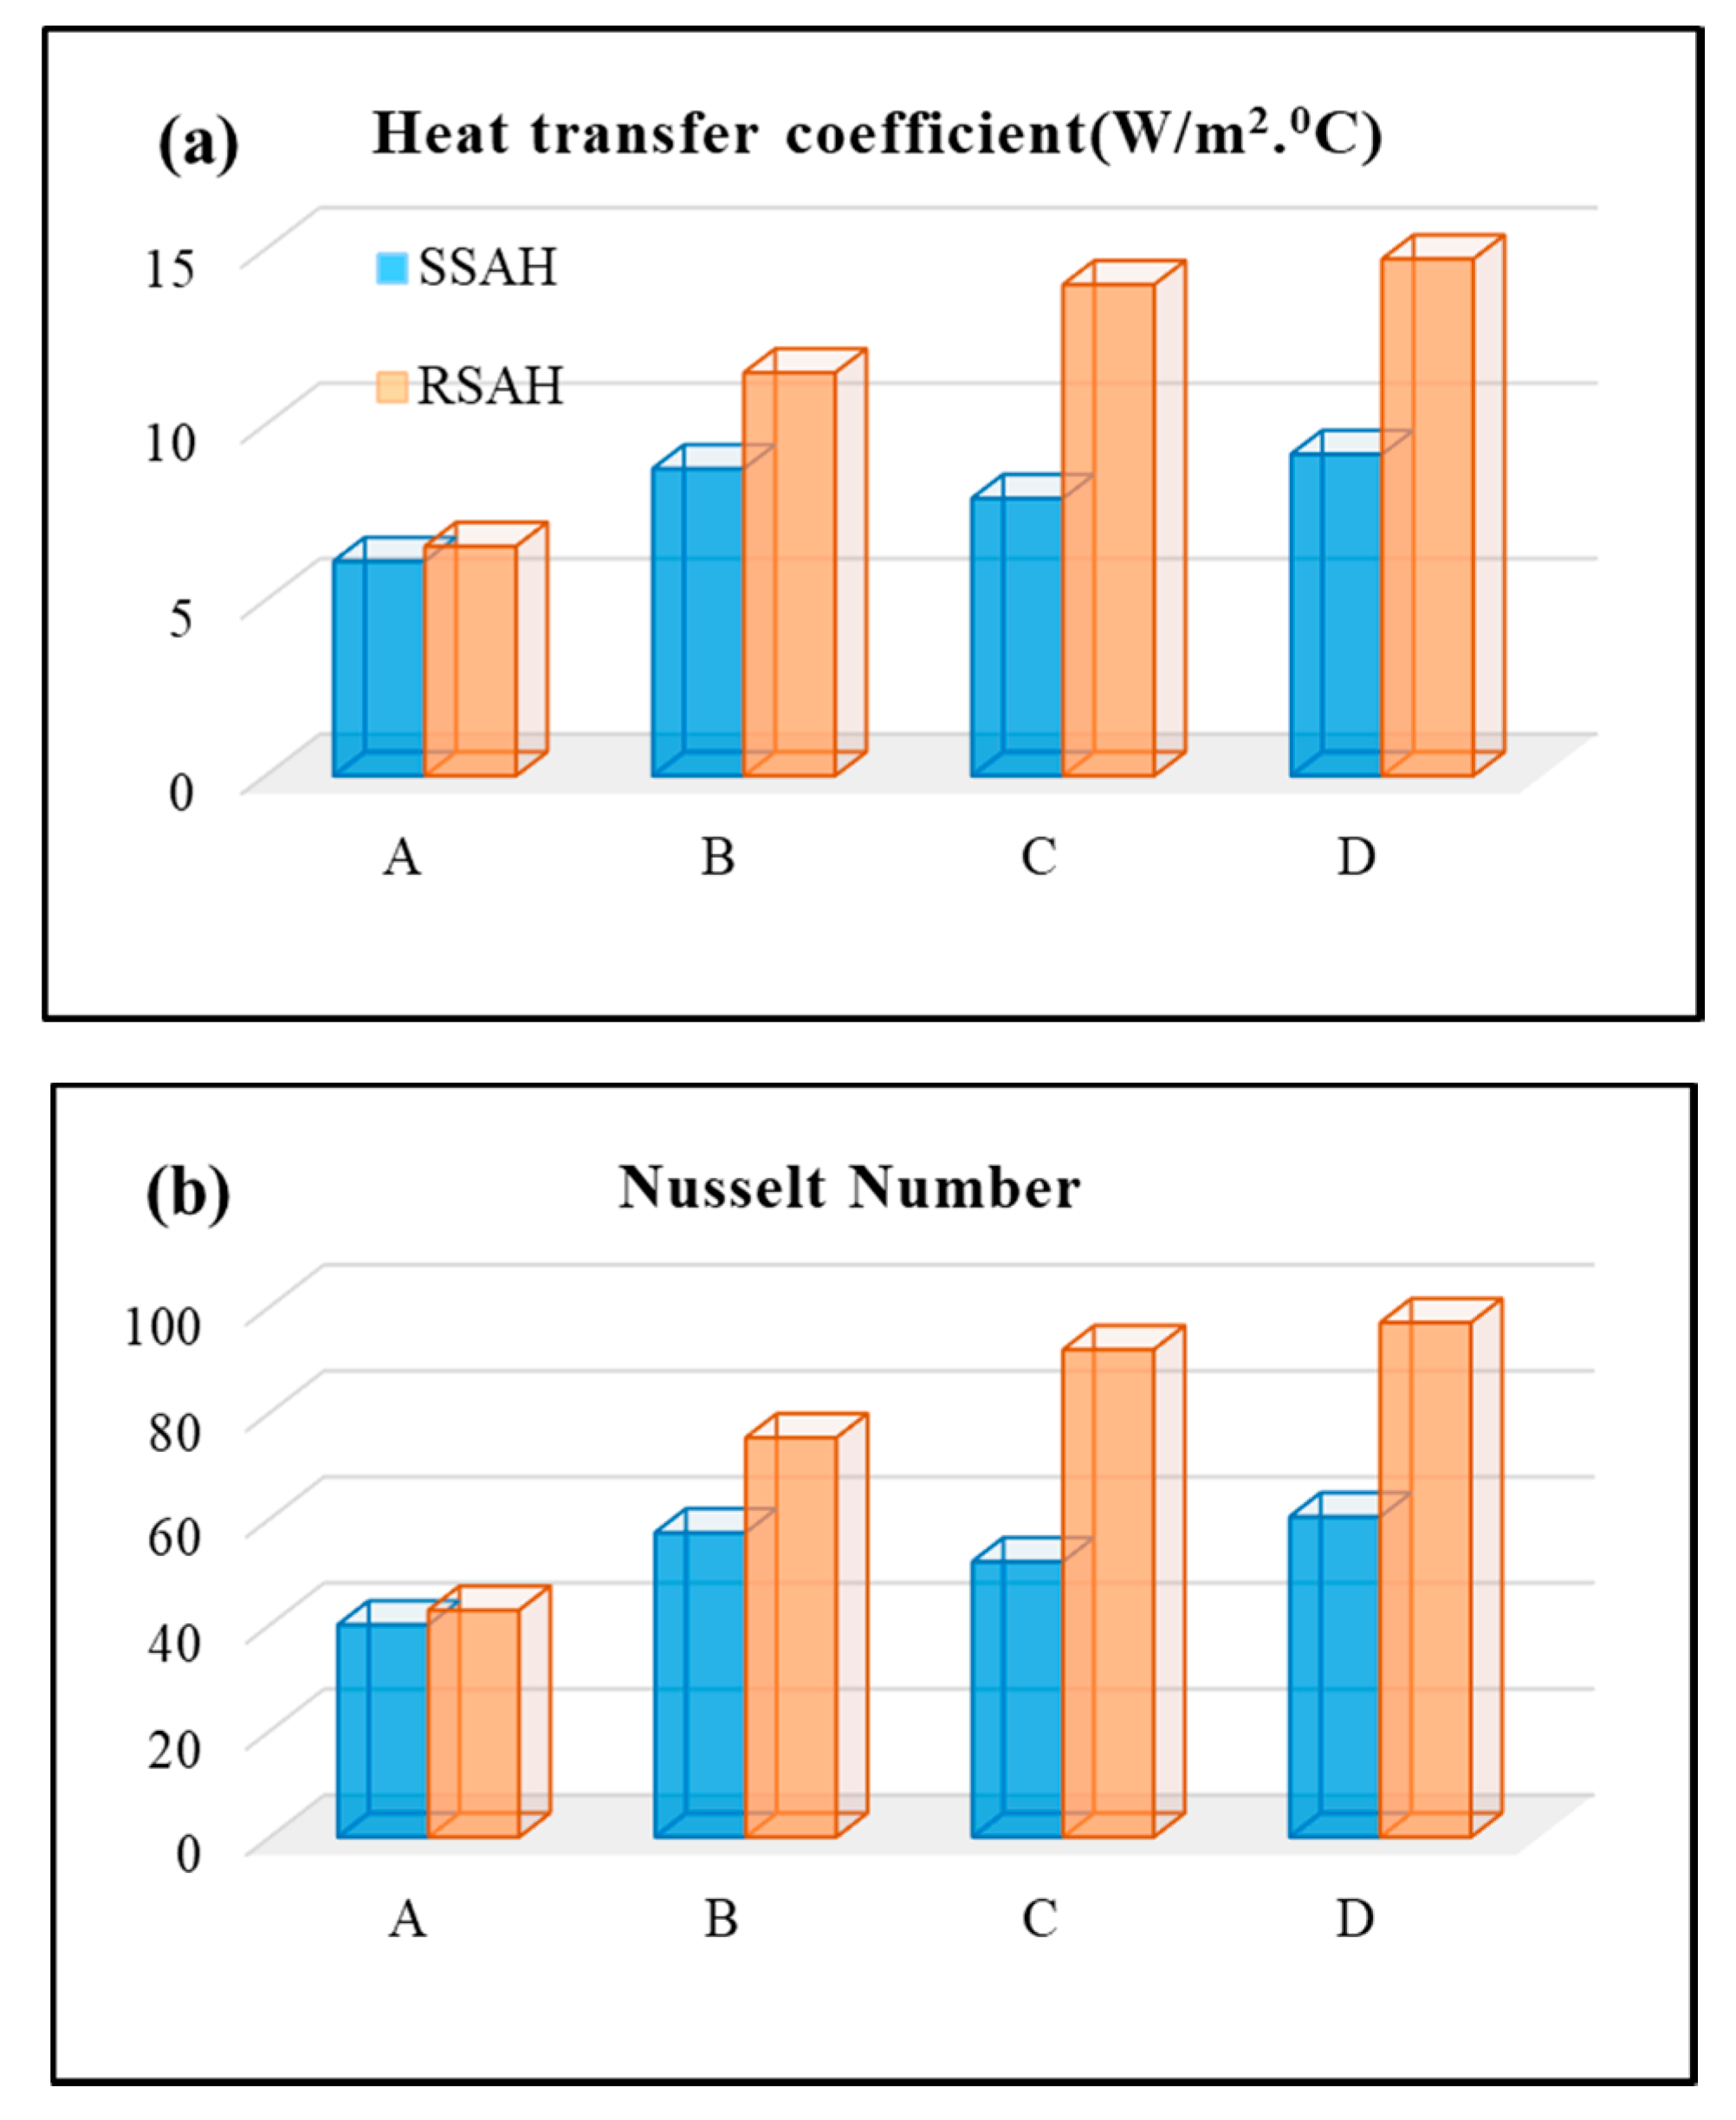
3.2. Useful Energy (W), Thermal Efficiency (%,) and Nusselt Number Variation Under Different Working Conditions
- Condition A ranged from 20.5 to 30.3 with an average of 26.3 (%), and from 21.9 to 28.5 with an average of 26.1 (%) for RSAH and SSAH, respectively.
- Condition B ranged from 20.4 to 59.5 with an average of 42.1 (%), and from 19.8 to 49.3 with an average of 39.2 (%) for RSAH and SSAH, respectively.
- Condition C ranged from 21.1 to 67.3 with an average of 48.2 (%), and from 25.3 to 51.2 with an average of 40.7 (%) for RSAH and SSAH, respectively.
- Condition D ranged from 18.1 to 76.9 with an average of 49.3 (%), and from 26.6 to 57.2 with an average of 48.4 (%) for RSAH and SSAH, respectively.
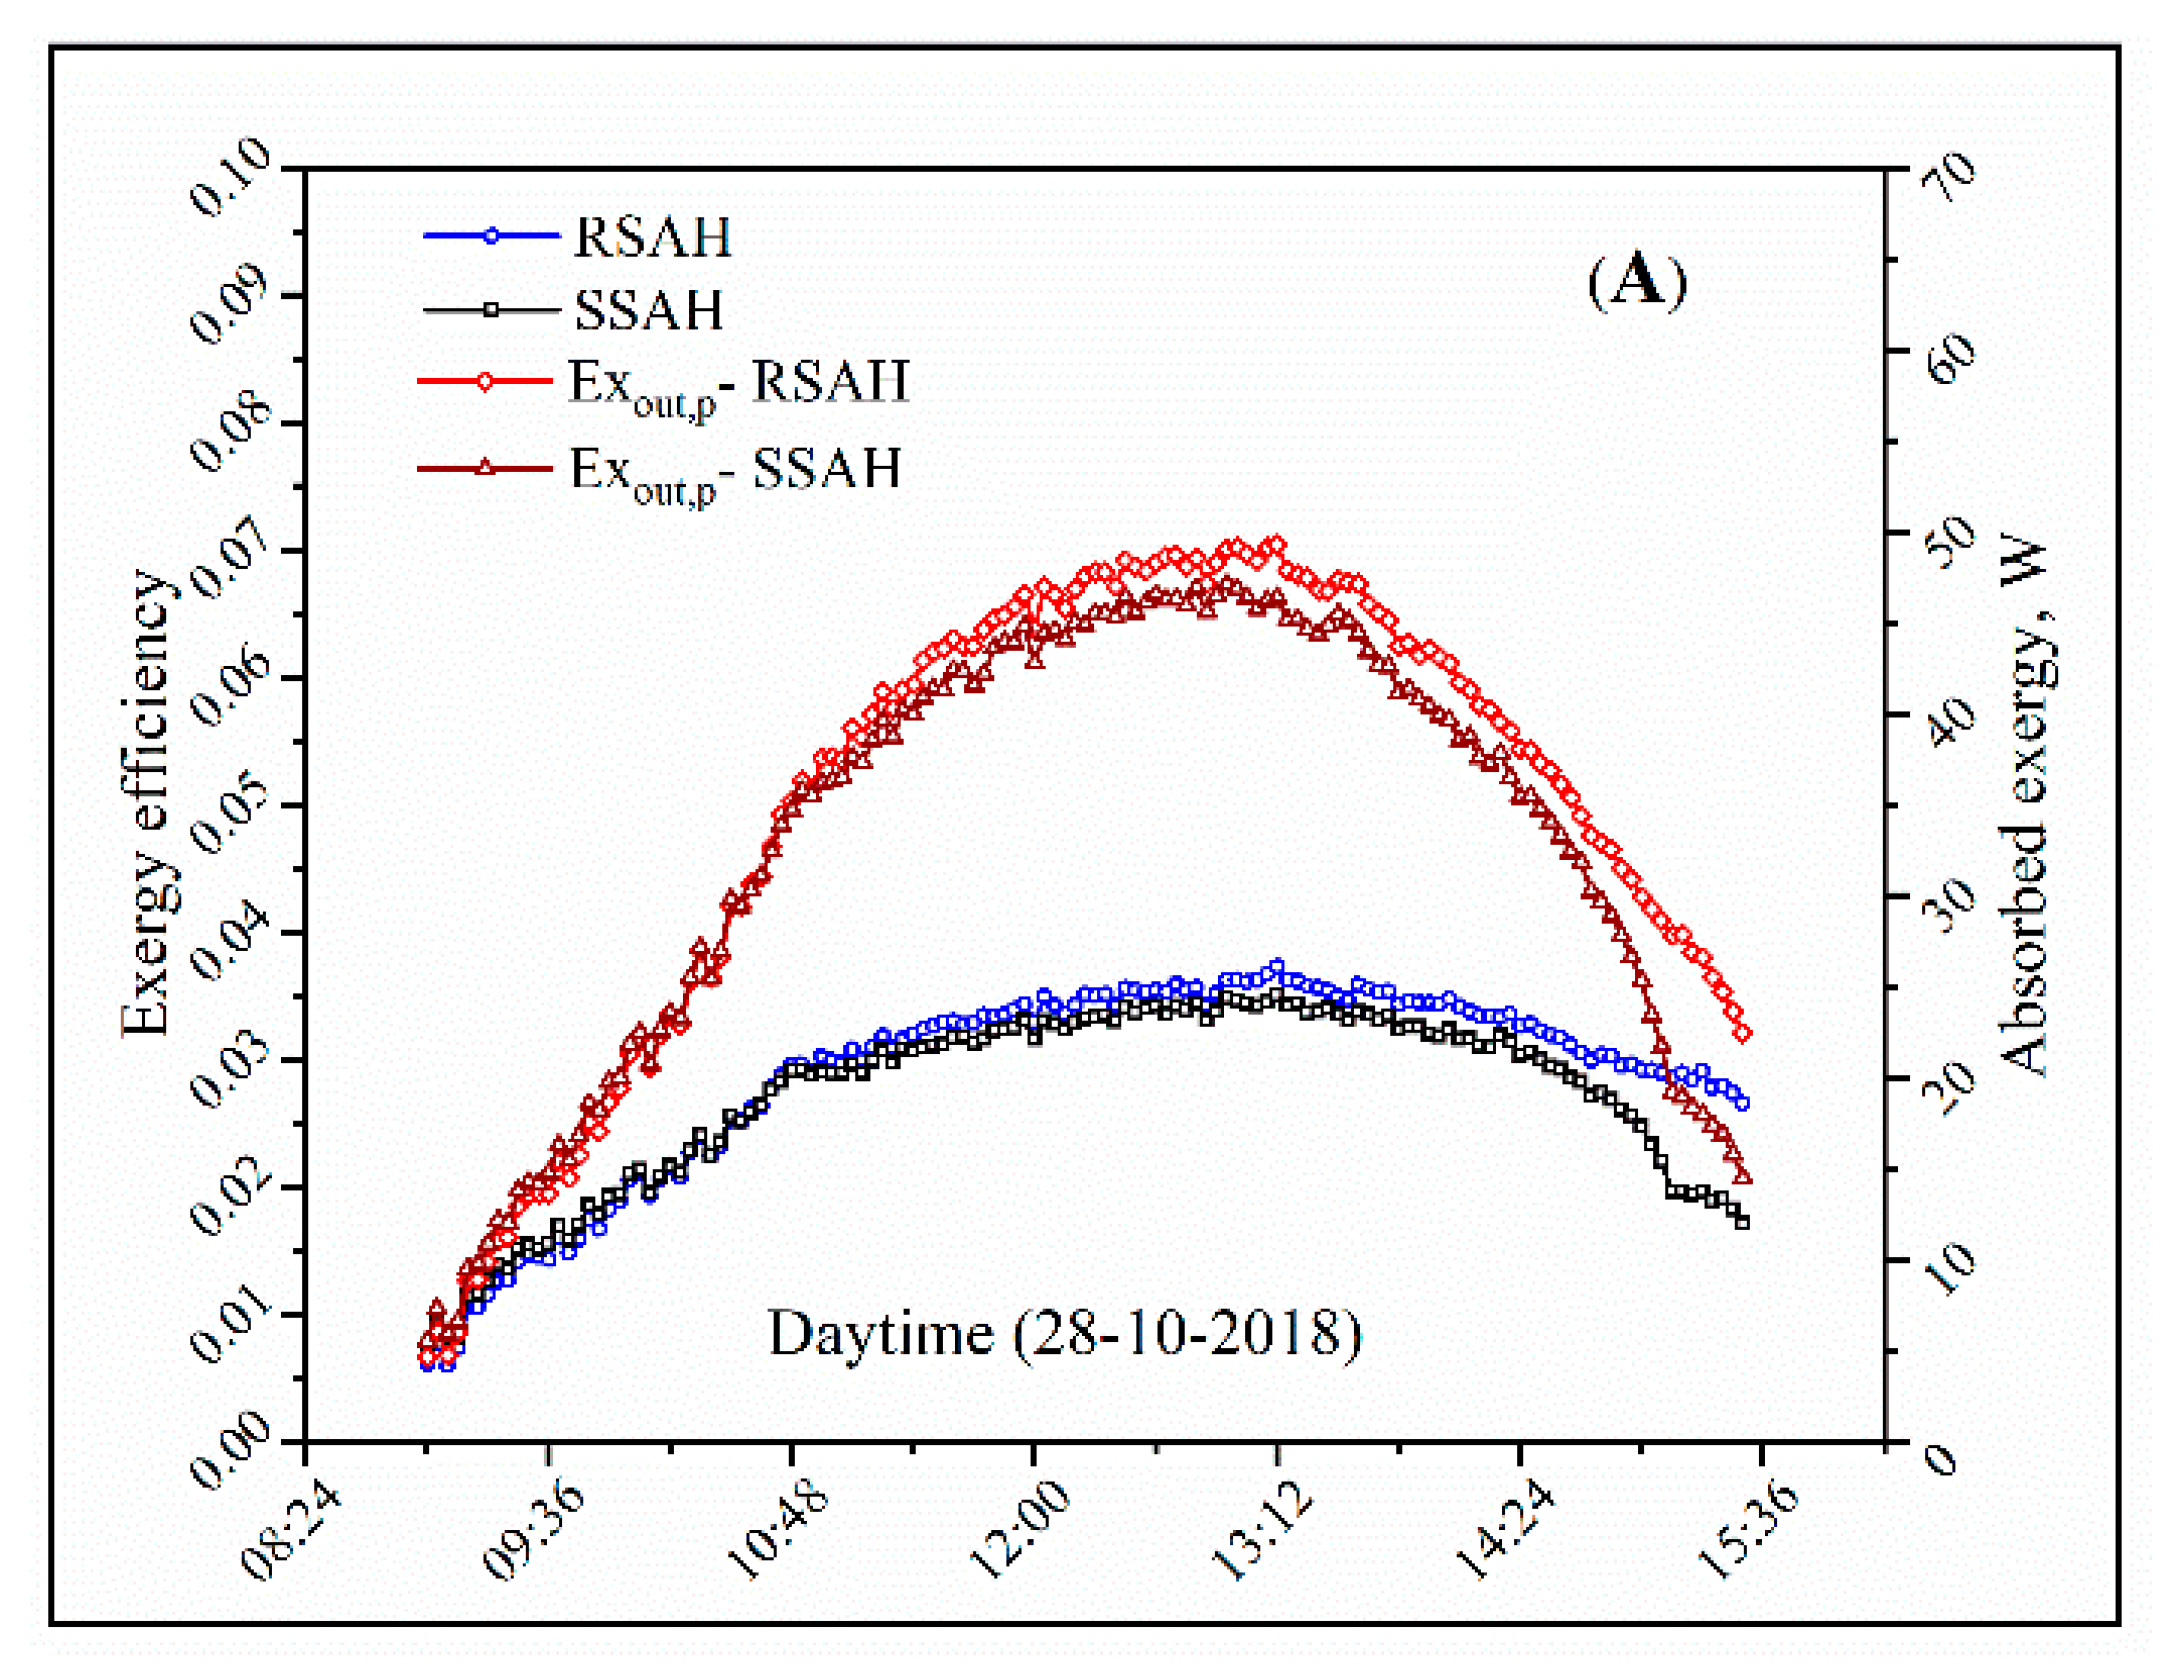
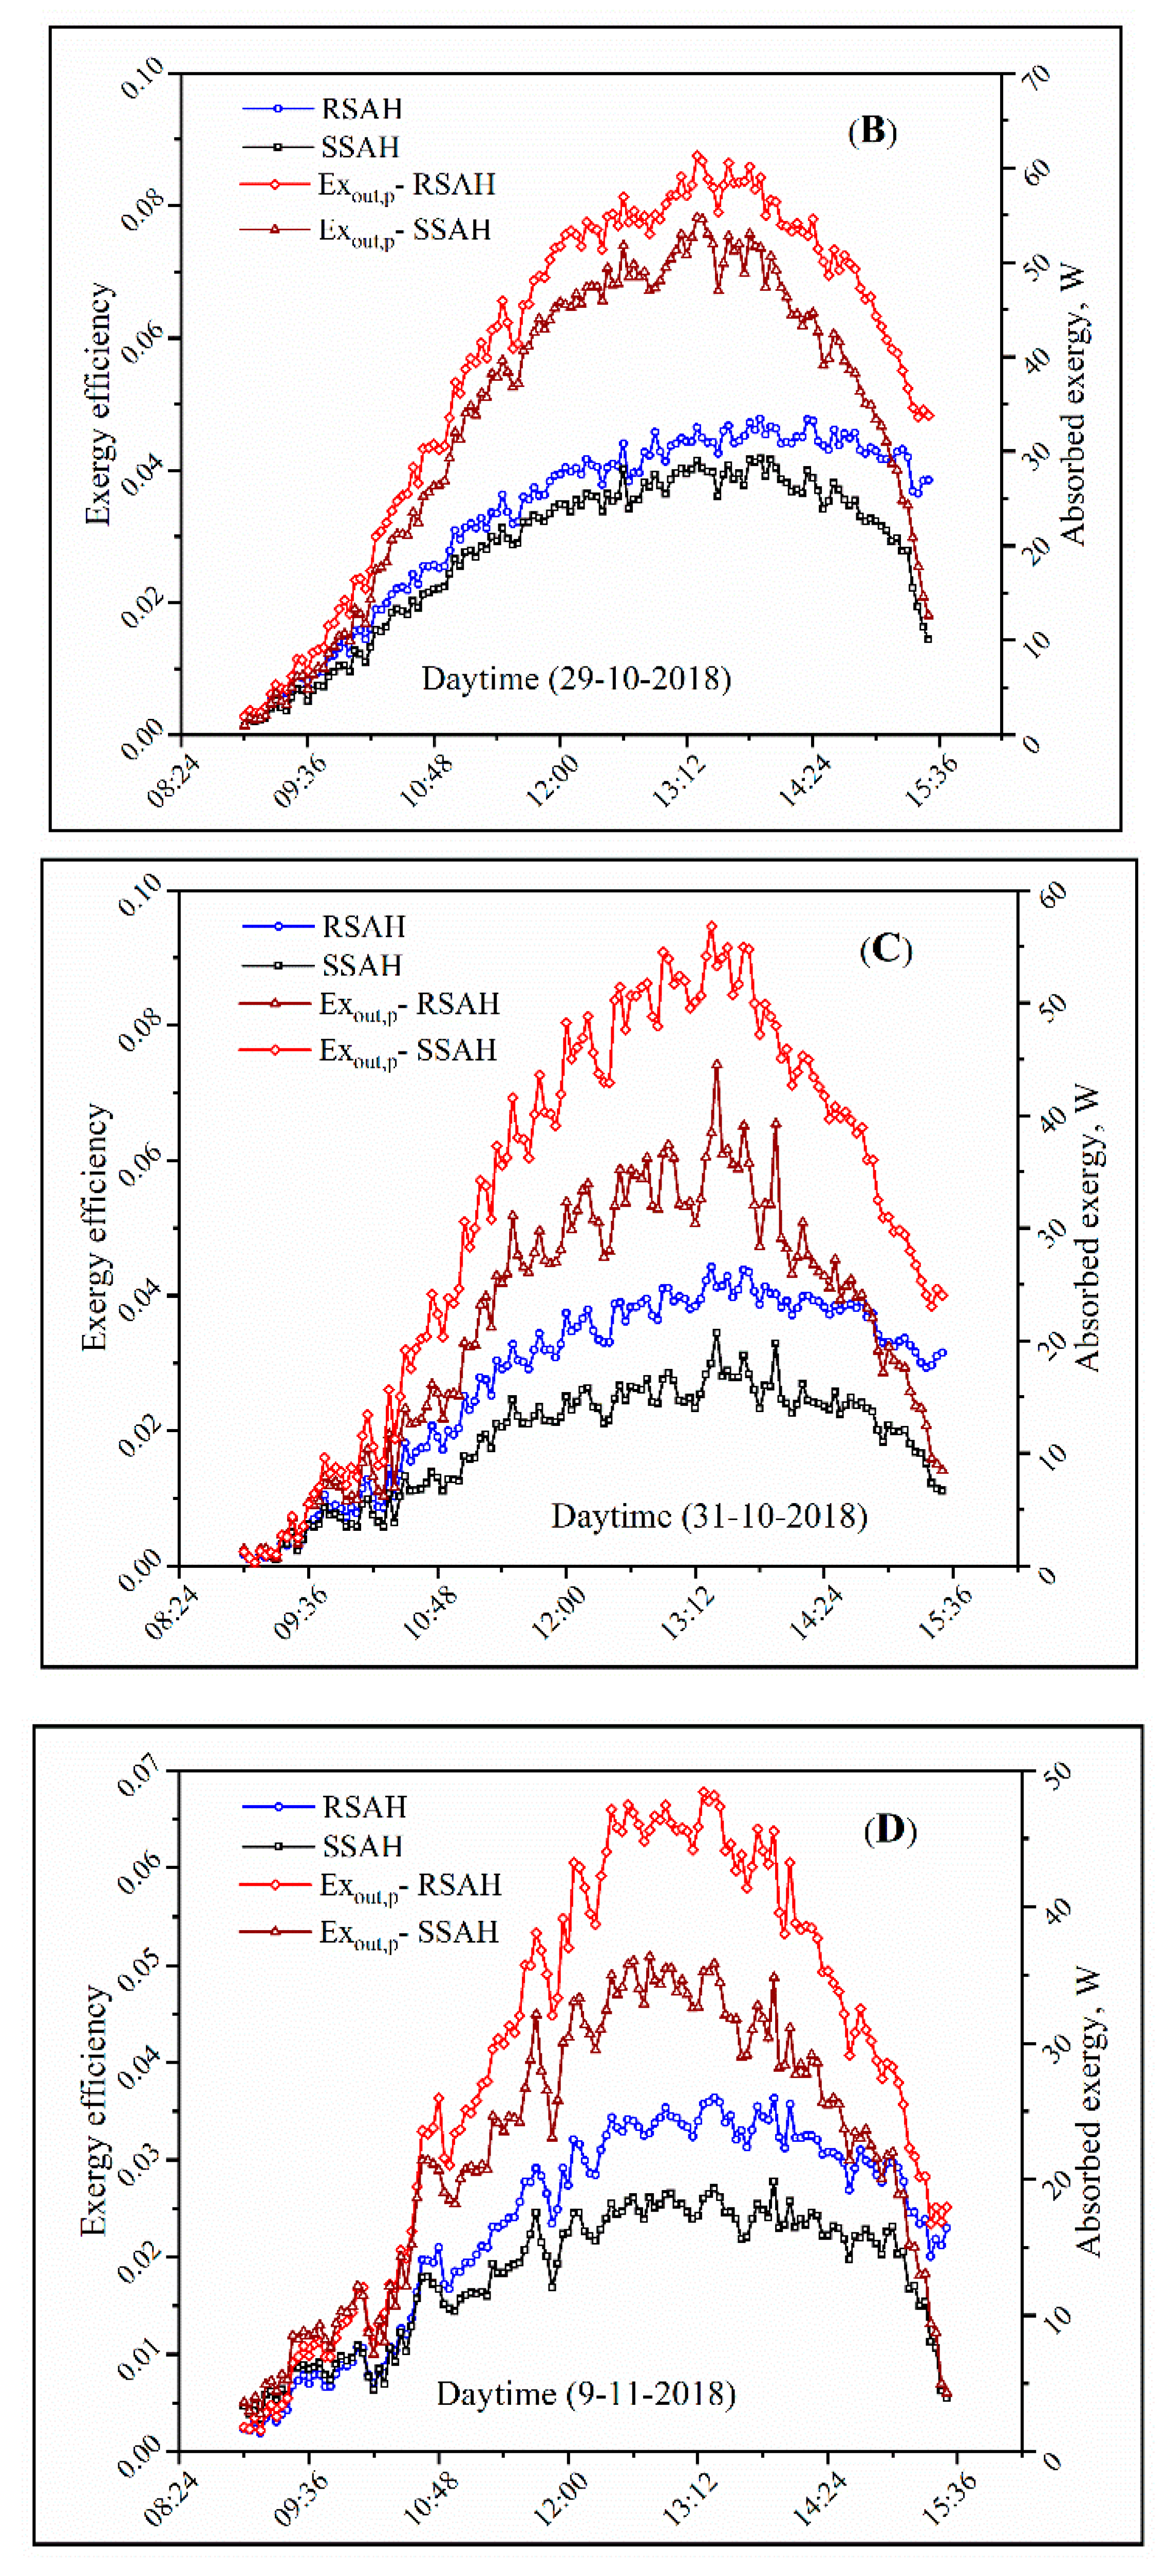
3.3. Exergy Efficiency (%) and Improvement Potentials (W) for RSAH and SSAH with the New Coating
4. Conclusions
Author Contributions
Funding
Conflicts of Interest
Nomenclature
| Collector area (m2) | Useful energy (W) | ||
| Constant pressure-specific heat of the air (J/Kg. °C) | Uncertainty | ||
| Constant volume-specific heat of the air (J/Kg. °C) | Relative uncertainty for thermal efficiency | ||
| Global solar radiation (W/m2) | The effective product transmittance–absorptance. | ||
| Ambient temperature (°C) | Collector tilt (deg.) | ||
| Inlet temperature (°C) | Density (kg/m3) | ||
| Outlet temperature (°C) | Absorbed exergy of air (W) | ||
| Mean fluid temperature (°C) | Absorbed exergy of air ignoring pressure drop (W) | ||
| Mean plate temperature (°C) | Destroyed exergy (W) | ||
| Mass flowrate (kg/s) | The exergy of solar radiation (W) | ||
| The collector heat removal factor (dimensionless) | Exergy Efficiency (dimensionless) | ||
| Dh | Hydraulic diameter (m) | R | Ideal gas constant |
| Ka | Thermal conductivity of air (W/m.°C) | ||
| h | Heat transfer coefficient (W/m2.°C) | RSAH | Roughened solar air heater |
| Overall losses heat transfer coefficient (W/m2.°C) | SSAH | Smooth solar air heater | |
| Glass cover thermal emittance (%) | CNTs | Carbon nanotubes | |
| Absorber thermal emittance (%) | CuO | Cupric oxide | |
| Solar radiation power at AM1.5 | CCu-BP | 4% CNTs/CuO-black paint | |
| Spectral reflectance | N | Number of glass covers | |
| ∆T | Spectral black body emissive power at room temperature. | ||
| ASHRAE | The American Society of Heating, Refrigerating and Air-Conditioning Engineers |
References
- Hu, J.; Zhang, G. Performance improvement of solar air collector based on airflow reorganization: A review. Appl. Therm. Eng. 2019, 155, 592–611. [Google Scholar] [CrossRef]
- Kabeel, A.E.; Hamed, M.H.; Omara, Z.M.; Kandeal, A.W. Solar air heaters: Design configurations, improvement methods and applications—A detailed review. Renew. Sustain. Energy Rev. 2017, 70, 1189–1206. [Google Scholar] [CrossRef]
- El-Sebaii, A.A.; Al-Snani, H. Effect of selective coating on thermal performance of flat plate solar air heaters. Energy 2010, 35, 1820–1828. [Google Scholar] [CrossRef]
- Hernández, A.L.; Quiñonez, J.E. Experimental validation of an analytical model for performance estimation of natural convection solar air heating collectors. Renew. Energy 2018, 117, 202–216. [Google Scholar] [CrossRef]
- Fudholi, A.; Sopian, K.; Othman, M.Y.; Ruslan, M.H.; Bakhtyar, B. Energy analysis and improvement potential of finned double-pass solar collector. Energy Convers. Manag. 2013, 75, 234–240. [Google Scholar] [CrossRef]
- Ghiami, A.; Ghiami, S. Comparative study based on energy and exergy analyses of a baffled solar air heater with latent storage collector. Appl. Therm. Eng. 2018, 133, 797–808. [Google Scholar] [CrossRef]
- Yianoulis, P.; Giannouli, M.; Kalogirou, S.A. Solar Selective Coatings; Elsevier Ltd.: Amsterdam, The Netherlands, 2012; Volume 3, ISBN 9780080878737. [Google Scholar]
- Oztop, H.F.; Bayrak, F.; Hepbasli, A. Energetic and exergetic aspects of solar air heating (solar collector) systems. Renew. Sustain. Energy Rev. 2013, 21, 59–83. [Google Scholar] [CrossRef]
- Chauhan, R.; Thakur, N.S. Investigation of the thermohydraulic performance of impinging jet solar air heater. Energy 2014, 68, 255–261. [Google Scholar] [CrossRef]
- Pandey, K.M.; Chaurasiya, R. A review on analysis and development of solar flat plate collector. Renew. Sustain. Energy Rev. 2017, 67, 641–650. [Google Scholar] [CrossRef]
- Abdelkader, T.K.; Zhang, Y.; Gaballah, E.S.; Wang, S.; Wan, Q.; Fan, Q. Energy and exergy analysis of a flat-plate solar air heater coated with carbon nanotubes and cupric oxide nanoparticles embedded in black paint. J. Clean. Prod. 2019, 250, 119501. [Google Scholar] [CrossRef]
- AlShamaileh, E. Testing of a new solar coating for solar water heating applications. Sol. Energy 2010, 84, 1637–1643. [Google Scholar] [CrossRef]
- Singh Bisht, V.; Kumar Patil, A.; Gupta, A. Review and performance evaluation of roughened solar air heaters. Renew. Sustain. Energy Rev. 2018, 81, 954–977. [Google Scholar] [CrossRef]
- Singh, I.; Singh, S. A review of artificial roughness geometries employed in solar air heaters. Renew. Sustain. Energy Rev. 2018, 92, 405–425. [Google Scholar] [CrossRef]
- Hans, V.S.; Gill, R.S.; Singh, S. Heat transfer and friction factor correlations for a solar air heater duct roughened artificially with broken arc ribs. Exp. Therm. Fluid Sci. 2017, 80, 77–89. [Google Scholar] [CrossRef]
- Kumar, A.; Saini, R.P.; Saini, J.S. Heat transfer and friction factor of solar air heater having duct roughened artificially with discrete multiple v-ribs. J. Renew. Sustain. Energy 2012, 4. [Google Scholar] [CrossRef]
- Alam, T.; Saini, R.P.; Saini, J.S. Experimental Investigation of Thermohydraulic Performance of a Rectangular Solar Air Heater Duct Equipped with V-Shaped Perforated Blocks. Adv. Mech. Eng. 2014, 6, 948313. [Google Scholar] [CrossRef]
- Ravi, R.K.; Saini, R.P. Experimental investigation on performance of a double pass artificial roughened solar air heater duct having roughness elements of the combination of discrete multi V shaped and staggered ribs. Energy 2016, 116, 507–516. [Google Scholar] [CrossRef]
- Deo, N.S.; Chander, S.; Saini, J.S. Performance analysis of solar air heater duct roughened with multigap V-down ribs combined with staggered ribs. Renew. Energy 2016, 91, 484–500. [Google Scholar] [CrossRef]
- Kumar, A.; Kumar, R.; Maithani, R.; Chauhan, R.; Sethi, M.; Kumari, A.; Kumar, S.; Kumar, S. Correlation development for Nusselt number and friction factor of a multiple type V-pattern dimpled obstacles solar air passage. Renew. Energy 2017, 109, 461–479. [Google Scholar] [CrossRef]
- Kramer, K.S.; Thoma, C.; Mehnert, S.; Fahr, S. Testing solar air-heating collectors. Energy Procedia 2014, 48, 137–144. [Google Scholar] [CrossRef][Green Version]
- Bayrak, F.; Oztop, H.F.; Hepbasli, A. Energy and exergy analyses of porous baffles inserted solar air heaters for building applications. Energy Build. 2013, 57, 338–345. [Google Scholar] [CrossRef]
- Liu, H.D.; Wan, Q.; Lin, B.Z.; Wang, L.L.; Yang, X.F.; Wang, R.Y.; Gong, D.Q.; Wang, Y.B.; Ren, F.; Chen, Y.M.; et al. The spectral properties and thermal stability of CrAlO-based solar selective absorbing nanocomposite coating. Sol. Energy Mater. Sol. Cells 2014, 122, 226–232. [Google Scholar] [CrossRef]
- Carlsson, B.; Köhl, M. Recommended qualification test procedure for solar absorber surface durability. IEA SHC Task 2004, 27, 1–28. [Google Scholar]
- Duffie, J.A.; Beckman, W.A. Solar Engineering of Thermal Processes, 4th ed.; John Wiley & Sons, Inc.: Hoboken, NJ, USA, 2013; ISBN 9780470873663. [Google Scholar]
- Klein, S.A. Calculation of the monthly-average transmittance-absorptance product. Sol. Energy 1979, 23, 547–551. [Google Scholar] [CrossRef]
- Kumar, R.; Goel, V.; Singh, P.; Saxena, A.; Kashyap, A.S.; Rai, A. Performance evaluation and optimization of solar assisted air heater with discrete multiple arc shaped ribs. J. Energy Storage 2019, 26, 100978. [Google Scholar] [CrossRef]
- Rabha, D.K.; Muthukumar, P. Performance studies on a forced convection solar dryer integrated with a paraffin wax–based latent heat storage system. Sol. Energy 2017, 149, 214–226. [Google Scholar] [CrossRef]
- Akpinar, E.K.; Koçyiĝit, F. Energy and exergy analysis of a new flat-plate solar air heater having different obstacles on absorber plates. Appl. Energy 2010, 87, 3438–3450. [Google Scholar] [CrossRef]
- Bahrehmand, D.; Ameri, M.; Gholampour, M. Energy and exergy analysis of different solar air collector systems with forced convection. Renew. Energy 2015, 83, 1119–1130. [Google Scholar] [CrossRef]
- Alta, D.; Bilgili, E.; Ertekin, C.; Yaldiz, O. Experimental investigation of three different solar air heaters: Energy and exergy analyses. Appl. Energy 2010, 87, 2953–2973. [Google Scholar] [CrossRef]
- Van Gool, W. Energy policy: Fairy tales and factualities. In Innovation and Technology—Strategies and Policies; Springer: Berlin, Germany, 1997; pp. 93–105. [Google Scholar]
- Holman, J.P.; Gajda, W.J. Experimental Methods for Engineers, 8th ed.; McGraw-Hill: New York, NY, USA, 2012. [Google Scholar]
- El Khadraoui, A.; Bouadila, S.; Kooli, S.; Guizani, A.; Farhat, A. Solar air heater with phase change material: An energy analysis and a comparative study. Appl. Therm. Eng. 2016, 107, 1057–1064. [Google Scholar] [CrossRef]
- Salman, A.Z.; Hamdi, R.T.A. Theoretical Technique for Studying the Effecting Factors for Loss Coefficients Theoretical Technique for Studying the Effecting Factors for Loss Coefficients in Solar Collectors. Int. J. Trend Res. Dev. 2018, 5, 1–6. [Google Scholar]
- Maheshwari, B.K.; Karwa, R.; Gharai, S.K. Performance Study of Solar Air Heater Having Absorber Plate with Half-Perforated Baffles. ISRN Renew. Energy 2011, 2011, 1–13. [Google Scholar] [CrossRef]


| Parameter | Value |
|---|---|
| Relative gap position (d/w) | 0.65 |
| Arc-angle (a) | 30° |
| Relative gap width (g/e) | 1 |
| Relative roughness pitch (P/e) | 10 |
| Relative roughness height (e/Dh) | 0.044 |
| Aspect ratio | 10 |
| Condition | Day | Air Volume Flow (m3/s) | Air Velocity Inside Duct (m/s) |
|---|---|---|---|
| A | 28 October | 0.0079 | 0.0793 |
| B | 29 October | 0.0171 | 0.1711 |
| C | 31 October | 0.0244 | 0.2441 |
| D | 9 November | 0.0352 | 0.3525 |
| Thermal Efficiency, A Condition | SSAH | =3.1957 × (∆T/GT) + 0.0665 | R² = 0.9205 |
| RSAH | =3.3852 × (∆T/GT) + 0.0542 | R² = 0.9614 | |
| Thermal Efficiency, B Condition | SSAH | =8.7494 × (∆T/GT) + 0.0307 | R² = 0.9973 |
| RSAH | =8.6385 × (∆T/GT) + 0.0351 | R² = 0.9972 | |
| Thermal Efficiency, C Condition | SSAH | =12.808 × (∆T/GT) + 0.0303 | R² = 0.9968 |
| RSAH | =12.879 × (∆T/GT) + 0.0286 | R² = 0.9977 | |
| Thermal Efficiency, D Condition | SSAH | =19.467 × (∆T/GT) + 0.0289 | R² = 0.999 |
| RSAH | =19.529 × (∆T/GT) + 0.024 | R² = 0.9989 |
| Day | 11 Oct. | 31 Oct. | 24 Nov. |
|---|---|---|---|
| Parameter | |||
| Ta (°C) | 26.2 | 30.3 | 21.7 |
| Tf,o – Tf,i (°C) | 28.2 | 26.0 | 18.8 |
| GT (W/m2) | 821.7 | 729.2 | 621.4 |
| V wind (m/s) | 1.496 | 0.694 | 0.439 |
| h w (W/m2.°C) | 11.455 | 8.349 | 7.365 |
| Tpm (°C) | 74.1 | 68.7 | 52.8 |
| Thermal efficiency (%) | 46.49 | 48.2 | 42.82 |
| Air Flowrate | Exergy Input (W) | Exergy Destruction (W) | Exergy Efficiency (%) | Improvement Potentials (W) | |||||||||
|---|---|---|---|---|---|---|---|---|---|---|---|---|---|
| Min. | Max. | Av. | Min. | Max. | Av. | Min. | Max. | Av. | Min. | Max. | Av. | ||
| SSAH | A | 766.46 | 1378.82 | 1179.07 | 760.95 | 1332.97 | 1146.00 | 0.72 | 3.50 | 2.71 | 755.48 | 1288.91 | 1113.91 |
| B | 746.87 | 1414.91 | 1158.70 | 745.89 | 1366.48 | 1125.38 | 0.13 | 4.17 | 2.74 | 744.91 | 1319.71 | 1093.17 | |
| C | 738.68 | 1329.48 | 1119.36 | 740.14 | 1292.87 | 1098.00 | 0.01 | 3.45 | 1.82 | 741.61 | 1257.27 | 1077.13 | |
| D | 774.01 | 1392.21 | 1172.56 | 770.39 | 1355.87 | 1150.52 | 0.33 | 2.78 | 1.81 | 766.78 | 1322.55 | 1128.95 | |
| RSAH | A | 766.46 | 1378.82 | 1179.07 | 761.80 | 1331.37 | 1144.08 | 0.60 | 3.72 | 2.87 | 757.17 | 1285.81 | 1110.19 |
| B | 746.87 | 1414.91 | 1158.70 | 744.93 | 1360.66 | 1119.14 | 0.26 | 4.78 | 3.29 | 743.00 | 1308.49 | 1081.11 | |
| C | 738.68 | 1329.48 | 1119.36 | 738.41 | 1274.99 | 1087.09 | 0.04 | 4.42 | 2.76 | 715.13 | 1223.94 | 1055.93 | |
| D | 774.01 | 1392.21 | 1172.56 | 762.51 | 1346.60 | 1143.90 | 0.19 | 3.64 | 2.35 | 744.97 | 1304.77 | 1116.07 | |
© 2020 by the authors. Licensee MDPI, Basel, Switzerland. This article is an open access article distributed under the terms and conditions of the Creative Commons Attribution (CC BY) license (http://creativecommons.org/licenses/by/4.0/).
Share and Cite
Abdelkader, T.K.; Fan, Q.; Gaballah, E.S.; Wang, S.; Zhang, Y. Energy and Exergy Analysis of a Flat-Plate Solar Air Heater Artificially Roughened and Coated with a Novel Solar Selective Coating. Energies 2020, 13, 997. https://doi.org/10.3390/en13040997
Abdelkader TK, Fan Q, Gaballah ES, Wang S, Zhang Y. Energy and Exergy Analysis of a Flat-Plate Solar Air Heater Artificially Roughened and Coated with a Novel Solar Selective Coating. Energies. 2020; 13(4):997. https://doi.org/10.3390/en13040997
Chicago/Turabian StyleAbdelkader, Tarek Kh., Qizhou Fan, Eid S. Gaballah, Shaowei Wang, and Yanlin Zhang. 2020. "Energy and Exergy Analysis of a Flat-Plate Solar Air Heater Artificially Roughened and Coated with a Novel Solar Selective Coating" Energies 13, no. 4: 997. https://doi.org/10.3390/en13040997
APA StyleAbdelkader, T. K., Fan, Q., Gaballah, E. S., Wang, S., & Zhang, Y. (2020). Energy and Exergy Analysis of a Flat-Plate Solar Air Heater Artificially Roughened and Coated with a Novel Solar Selective Coating. Energies, 13(4), 997. https://doi.org/10.3390/en13040997