1. Introduction
Analysis of the dynamic effects in power distributions substations is an important issue in designing new facilities and modernizing the existing ones. Research centers around the world have already been interested in studying the phenomenon of electrodynamic interactions for short overhead spans in switching stations. Calculation of the dynamic effects in power distribution substations with flexible conductors has been discussed by many authors [
1,
2,
3,
4,
5,
6,
7]. In the nineties, the issue was also addressed by CIGRÉ. The effect of the team’s work as part of CIGRÉ included the brochure [
8] and standard [
9]. In CIGRÉ Brochure No. 105, [
8] provided information about mechanical effects of short circuit currents in High Voltage (HV) and Extra High Voltage (EHV) open air conventional substations. The standard [
9] provides procedures for calculating the effects of short circuit currents in alternating current networks with rated voltages up to and including 420 kV. The effects of electromagnetic impact on rigid and flexible conductors, as well as thermal effects in bare conductors are included. Although these methods are easy to implement, both of them have some limitations.
In [
4], Awad et al. presented methods to design a strain bus for new 230 and 500 kV power distribution substations and to uprate the existing substations. In addition, the authors discussed mechanical, electrical, and arc-thermal effects of short circuit currents on strain-bus systems. In turn, in [
5] Hermann et al. presented studies of tensile forces, stresses, and conductor displacements for short circuit currents in arrangements representing strained conductors of typical 123 and 420 kV power distribution substations. Based on the obtained results, they developed a calculation method taking into account short circuit duration, which leads to reduced forces and displacements in the case of brief current flows. In reference [
6], Stein et al. conducted extensive short circuit tests on substation bus bars of stranded conductors with and without droppers. These tests included 100 and 400 kV systems. When calculating the dynamic effects in substations with flexible conductors the authors found that the Finite-Element Method (FEM) showed a remarkable comparative accuracy. In [
1], the authors measured the dynamic effects by conducting short circuit tests on a typical 138 kV disconnect switch stand. The authors performed dynamic finite element analyses on the tested structure, which were validated with the test data. The authors’ results confirmed the reduced dynamic response of the structure. In 2010, the Institute of Electrical and Electronic Engineers published a guide [
7] providing information on different bus arrangements used in power distribution substations and specifying the advantages and disadvantages of each of them. The guide also gives information on calculation tools for each bus type. Based on these calculations, specification of forces acting on the bus structure is also possible. The IEEE 605 guide assumed straight long parallel conductors in two-dimensional (2D) force calculations while ignoring any bends and 3D placement of conductors. Referring to [
7] and [
8] Bosworth et al. in [
2] proposed two extensions to IEEE 605 and CIGRE 105 for calculating short circuit current reaction forces. The authors presented a closed-form equation defining the simplified 2D short circuit force time history during a fault and a computationally inexpensive numerical 3D force calculation technique. In reference [
3] Stein et al. presented the results of studies showing a simplified approach to short circuit strength assessment. The authors presented the results of short circuit tests and compared them with the FEM calculations for four representative 100 kV conductor arrangements. Based on the obtained results, very good compatibility of calculations and test results was stated, which indicates the usefulness of FEM technology for this type of analysis.
Correct and effective operation of an electric power system necessitates constant conduct of various observations and considerations, for both regular and fault conditions [
10,
11]. Adjusting device parameters to short circuit conditions is one of the most important tasks at the stage of designing and modernizing power networks. The constant development of global economies, involving the growing demand for power, forces the development of power infrastructure. In addition, a constantly growing number of generating units and transformers significantly affects the maximum value of short circuit currents in the power system. This forces the necessity to assess the adaptation of existing substation components to new short circuit powers. However, the data and assumptions, as well as models adopted by power system operators to make the analyses create various types of uncertainty. It is not uncommon that decisions based on defined values do not always allow a comprehensive risk assessment of making too many errors. It should be borne in mind that assessment of the adopted assumptions, models, and data from the point of view of reliability and costs of proposed solutions is important [
12,
13]. For example, the increase in short circuit power in an electric power system entails the need to adapt the power distribution substation to new short circuit conditions. Therefore, calculations of dynamic effects in power distribution substations are an important element of short circuit analyses [
1,
2,
3].
Performing an analysis of dynamic effects in power distribution substations involves the knowledge of quantities characterizing the short circuit current. Assuming the appropriate value of short circuit duration (short circuit current flow time
Tk) in calculations is particularly important [
9,
14]. The maximum values of forces related to conductor movement caused by interfacial interaction in HV and EHV switchgears usually occur during short circuits lasting longer than 300 ms (this time depends on: The value of short circuit current, span length and phase conductor spacing, type of force). Usually, short circuits occurring in high voltage switchgears and in their vicinity are switched off in about 100 ms. Adopting such a time value significantly reduces the determined force values in relation to the maximum possible value. Higher values of short circuit duration are also possible in the event of, for example, failure of protections or switches. However, the probability of such a short circuit is relatively low. In the case of switchgear modernization associated with matching it with higher levels of short circuit currents, appropriate determination of the short circuit duration value has an economic dimension. For example, it affects decisions regarding the supporting structures: Whether to leave the existing ones for further operation, strengthen them, or replace with new ones. Adoption of excessive values of short circuit duration may be associated with oversizing switchgear components and it may even enforce an uneconomical decision to rebuild the entire switchgear. On the other hand, adoption of an excessively small value of short circuit duration may lead to losses related to damage to or even destruction of devices.
Few papers dealing with statistical studies on short circuit duration in the HV grid provide a view on the type of distribution of this value [
1,
9]. However, due to the relatively low number of available samples, the credibility of the obtained distributions of this random variable is low and does not permit the assessment of short circuit duration value
Tk based on the probability of its occurrence. Moreover, such
Tk values and their probability distribution depend on different factors including types of implemented circuit-breakers and protections, their settings, and operating reliability. To some extent, the choice of the short circuit duration value for finding the risk caused by fault disturbances can be supported by simulation examinations. The issue of using probabilistic analyses for the dimensioning of power distribution substation elements was the focus of interest of many authors [
15,
16,
17,
18]. Although the problem is not new, it is still valid. For economic reasons, High Voltage (HV) and Extra High Voltage (EHV) substations operating in Poland will be overhead substations for several or several dozen years going forward. This means that a significant proportion of them must be adapted to new, higher levels of short circuit current. As the available literature shows, there are no studies on the criteria for the selection of short circuit duration values in analyzing dynamic forces in power distribution substations. The issue of short circuit duration impact on the values of dynamic pulls in substations discussed in the literature is a focus of the deterministic approach. There are basically no works devoted to other criteria for determining the value of short circuit duration when calculating dynamic effects in high-voltage switchgears with flexible conductors. Therefore, the goal adopted by the authors of this paper was to consider the possibility of using a probabilistic approach to develop principles helpful in determining the value of time
Tk when analyzing dynamic effects in substations. The use of the risk criterion, i.e., the allowable annual frequency of exceedances of the calculated force, was proposed to determine the value of short circuit duration for dynamic force calculations. This value can be determined, for example, against an economic account [
19]. Monte Carlo simulation was used to solve the task, using the developed simulation model of switchgear and its surroundings. It includes models of the place and type of short circuit for individual power network elements, as well as the duration model of short circuit associated with the work mapping for Power System Protection Automatics PSPA and circuit breakers used in the EHV network (location, configuration, and reliability of these devices and protection zones). In a simulation study, current flowing through a selected bay is calculated for a specific location and type of short circuit and current flow time is determined. Taking into account the random nature of these two short circuit quantities, the annual frequency of exceeding individual values of the calculated dynamic force is determined. During the simulation, the values of dynamic forces were calculated using the method described in DIN EN 60865-1. The subject matter of the study was not the very method contained in the aforementioned standard. The designer performs calculations of the dynamic force value for the maximum current value during a short circuit on bus-bars and for a specified value of short circuit duration. When assuming time values which are smaller than the value at which the maximum force value appears, the designer must take into account a certain risk of exceeding the determined force value caused by the possibility of more adverse conditions (maximum current and short circuit duration greater than originally assumed). The study carried out tests of this type of risk as a function of short circuit duration assumed during the calculation of dynamic forces. It was proposed that in choosing the value of short circuit duration, one should be guided by the value of the risk of exceedances considered as acceptable (e.g., determined on the basis of economic impact calculations). For the acceptable risk values adopted from the available literature, examples are given of short circuit duration values which should be used in calculations of forces for the selected protection system configurations. Currently, no described method is available for determining the duration of a short circuit taking into account the economic criterion. Therefore, the proposed approach can support the deterministic analysis of dynamic forces in power distribution substations. The authors’ intention was not to replace the deterministic method with the probabilistic method, but to apply a probabilistic approach to determining the value of short circuit duration.
The paper was organized in the following way: Analysis of short circuit quantities in highest voltage networks from the point of view of dynamic effects in a substation with flexible bus-bars was carried out using the developed model based on the Monte Carlo simulation method presented in
Section 2. The principle of determining the duration of short circuit and the structure of the developed model are also described in
Section 2. In turn,
Section 3 presents the developed time distributions of protection operation occurring in the examined network.
Section 4 presents short circuit current distributions for the two points of the 220 kV substation under test.
Section 5 contains the results of short circuit duration and dynamic force analysis for the four selected PSPA configurations.
Section 6 presents the authors’ method of determining the value of short circuit duration for the purposes of calculating dynamic forces. A method based on the risk criterion (expected annual frequency of exceedances of the determined force) was proposed. Based on the presented method, the impact of selected factors on the estimated short circuit duration was also examined. The obtained results allowed the authors to formulate guidelines helpful in determining the value of fault duration during the analysis of dynamic short circuit effects in the substation.
Section 7 contains a summary and the final conclusions. Example values of short circuit duration are given for a risk of 10
−3 1/a depending on the PSPA configuration.
2. Scheme of Finding the Dynamic Forces Distribution by the Monte Carlo Simulation Method
The method described in standard IEC 60865-1 [
9] was used to determine the value of dynamic forces acting from flexible conductors on the supporting structures of the substations.
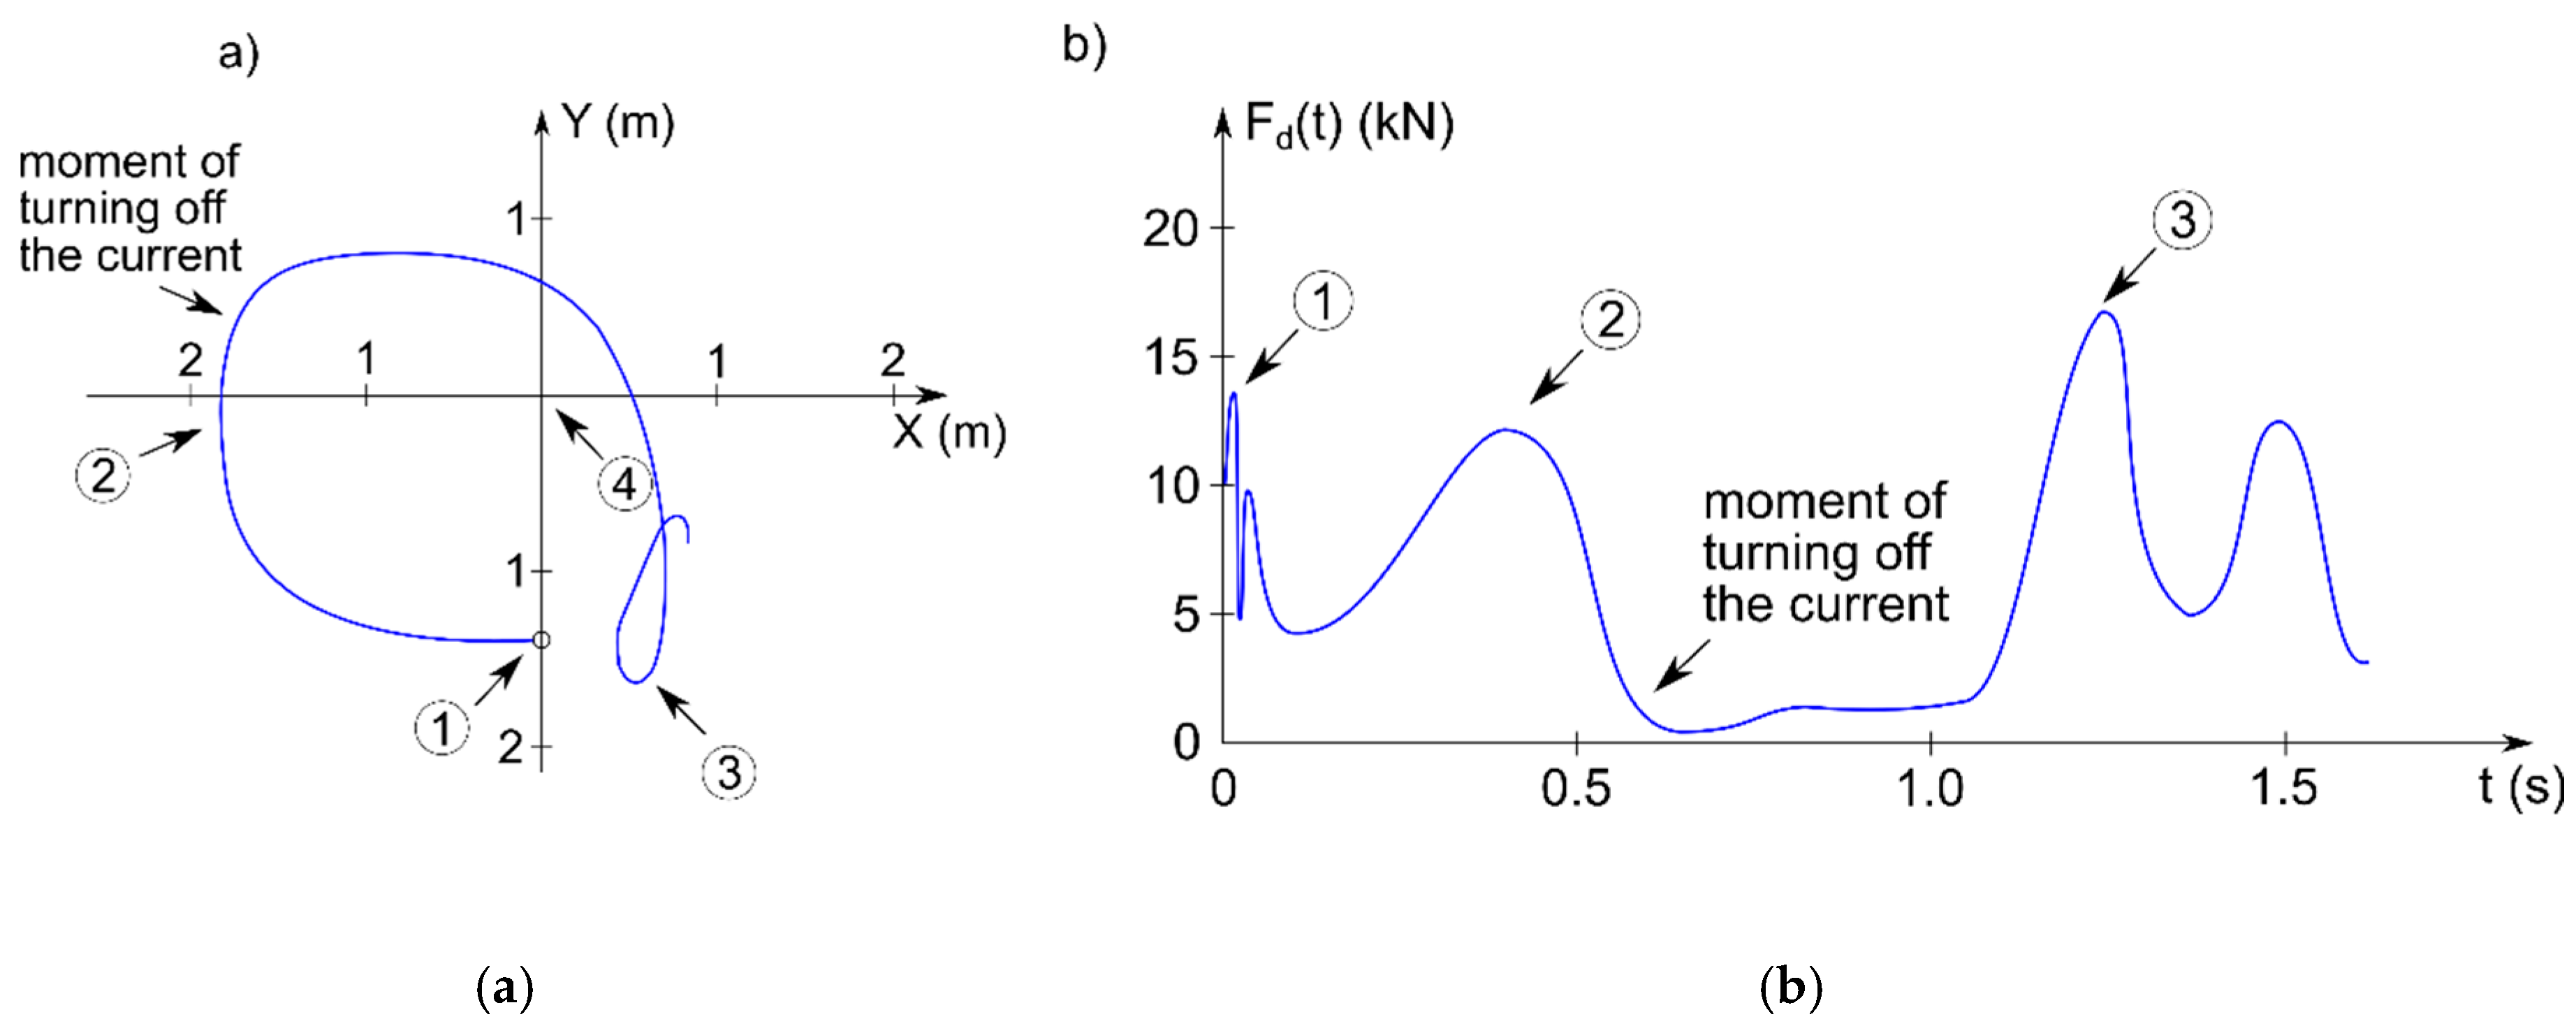
Figure 1a shows an example of phase conductor movement due to short circuit current. The phase conductor suspension points are at the axis intersection at point 4. In turn,
Figure 1b presents the time of occurrence of the characteristic dynamic forces acting at the phase conductor suspension points. At the beginning of the short circuit current flow, as a result of the conductors approaching in the harness, force
Fpi occurs (point 1). Due to interaction between conductors of adjacent phases, the conductors move and the maximum force caused by this interaction (force
Ft) is observed at point 2. After switching off the short circuit current, the conductor continues its upward movement and then falls. At this moment, a force is caused by the falling conductor
Ff (point 3).
The time of occurrence of force
Fpi has very small values, lower than the actual values of short circuit duration in the electric power system [
19]. However, the values of forces
Ft and
Ff depend on the flow time and the value of short circuit current (periodic component) [
14].
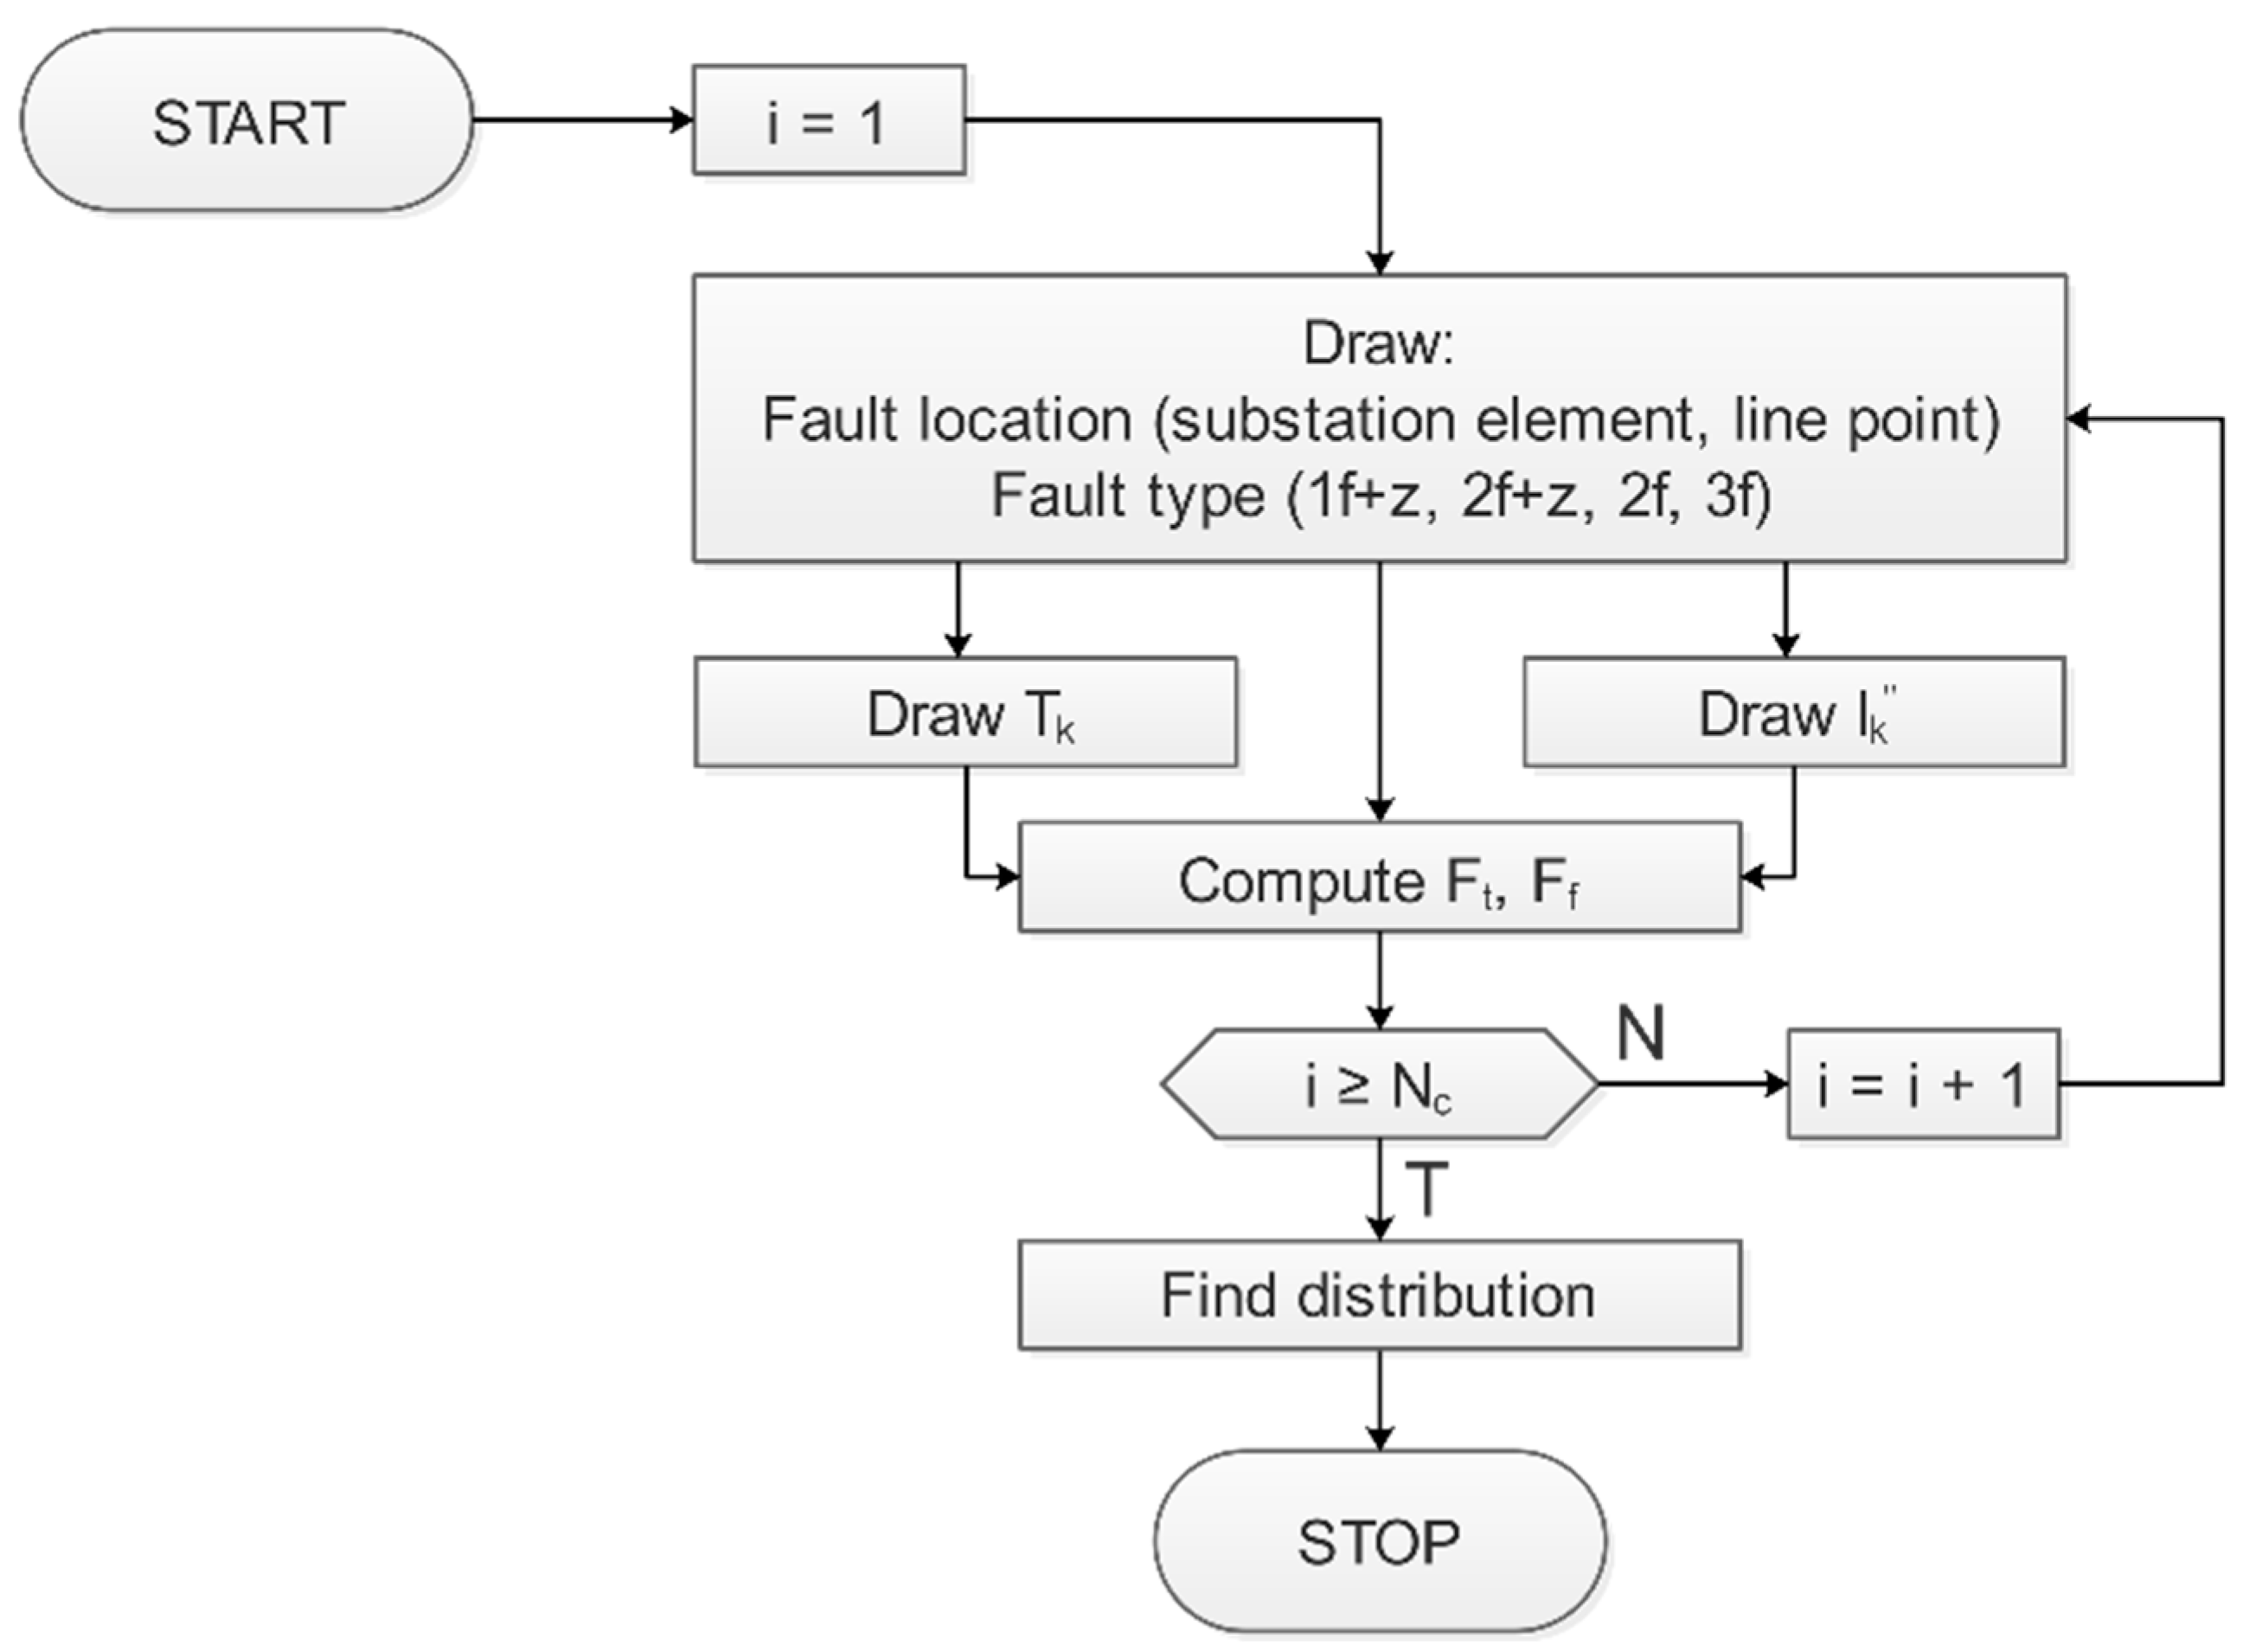
Calculations of the values and probability distributions of dynamic forces occurring in a given span of the substation are made using the Monte Carlo method (
Figure 2). During simulation calculations, short circuits on the substation bus-bars, in its bays and surroundings are taken into account. The values of dynamic forces in the span are specified on the basis of the determined value of current in the conductors and the duration of short circuit for a random place and type of short circuit. Random number generators were used for the draw. After an assumed number of simulations have been done, the annual frequency of occurrence of these forces is calculated [
14]. On that basis, also the expected annual frequency of exceeding individual force values is calculated.
The structure of the place model and type of short circuit is based on historical data obtained from recorded disturbances in power networks [
19]. The selection (draw) of the short circuit location is made on the basis of the annual intensity of faults in individual elements of the system. For all lines at a given voltage level, the same average value of interference intensity and the same probability of short circuit along the line were adopted. The same short circuit intensity was adopted for individual types of devices (e.g., all circuit breakers). The simulation model includes four basic types of short circuits: Single-phase with earth, two-phase, two-phase with earth, three-phase, and three-phase with earth. The selection (draw) of the fault location is based on the data characterizing the shares of individual short circuits in the lines and on the elements of the substations.
A computer program for dynamic force analysis using a simulation method was created in Delphi. Its basic elements are simulation models of short circuit current [
19,
21] and short circuit duration.
The PLANS (Plans Ltd., Warsaw, Poland) program was used to calculate the short circuit current in the power grid [
22]. The program allows modeling various types of short circuit. PLANS makes it possible to calculate the value of short circuit current in a selected node, as well as its spread.
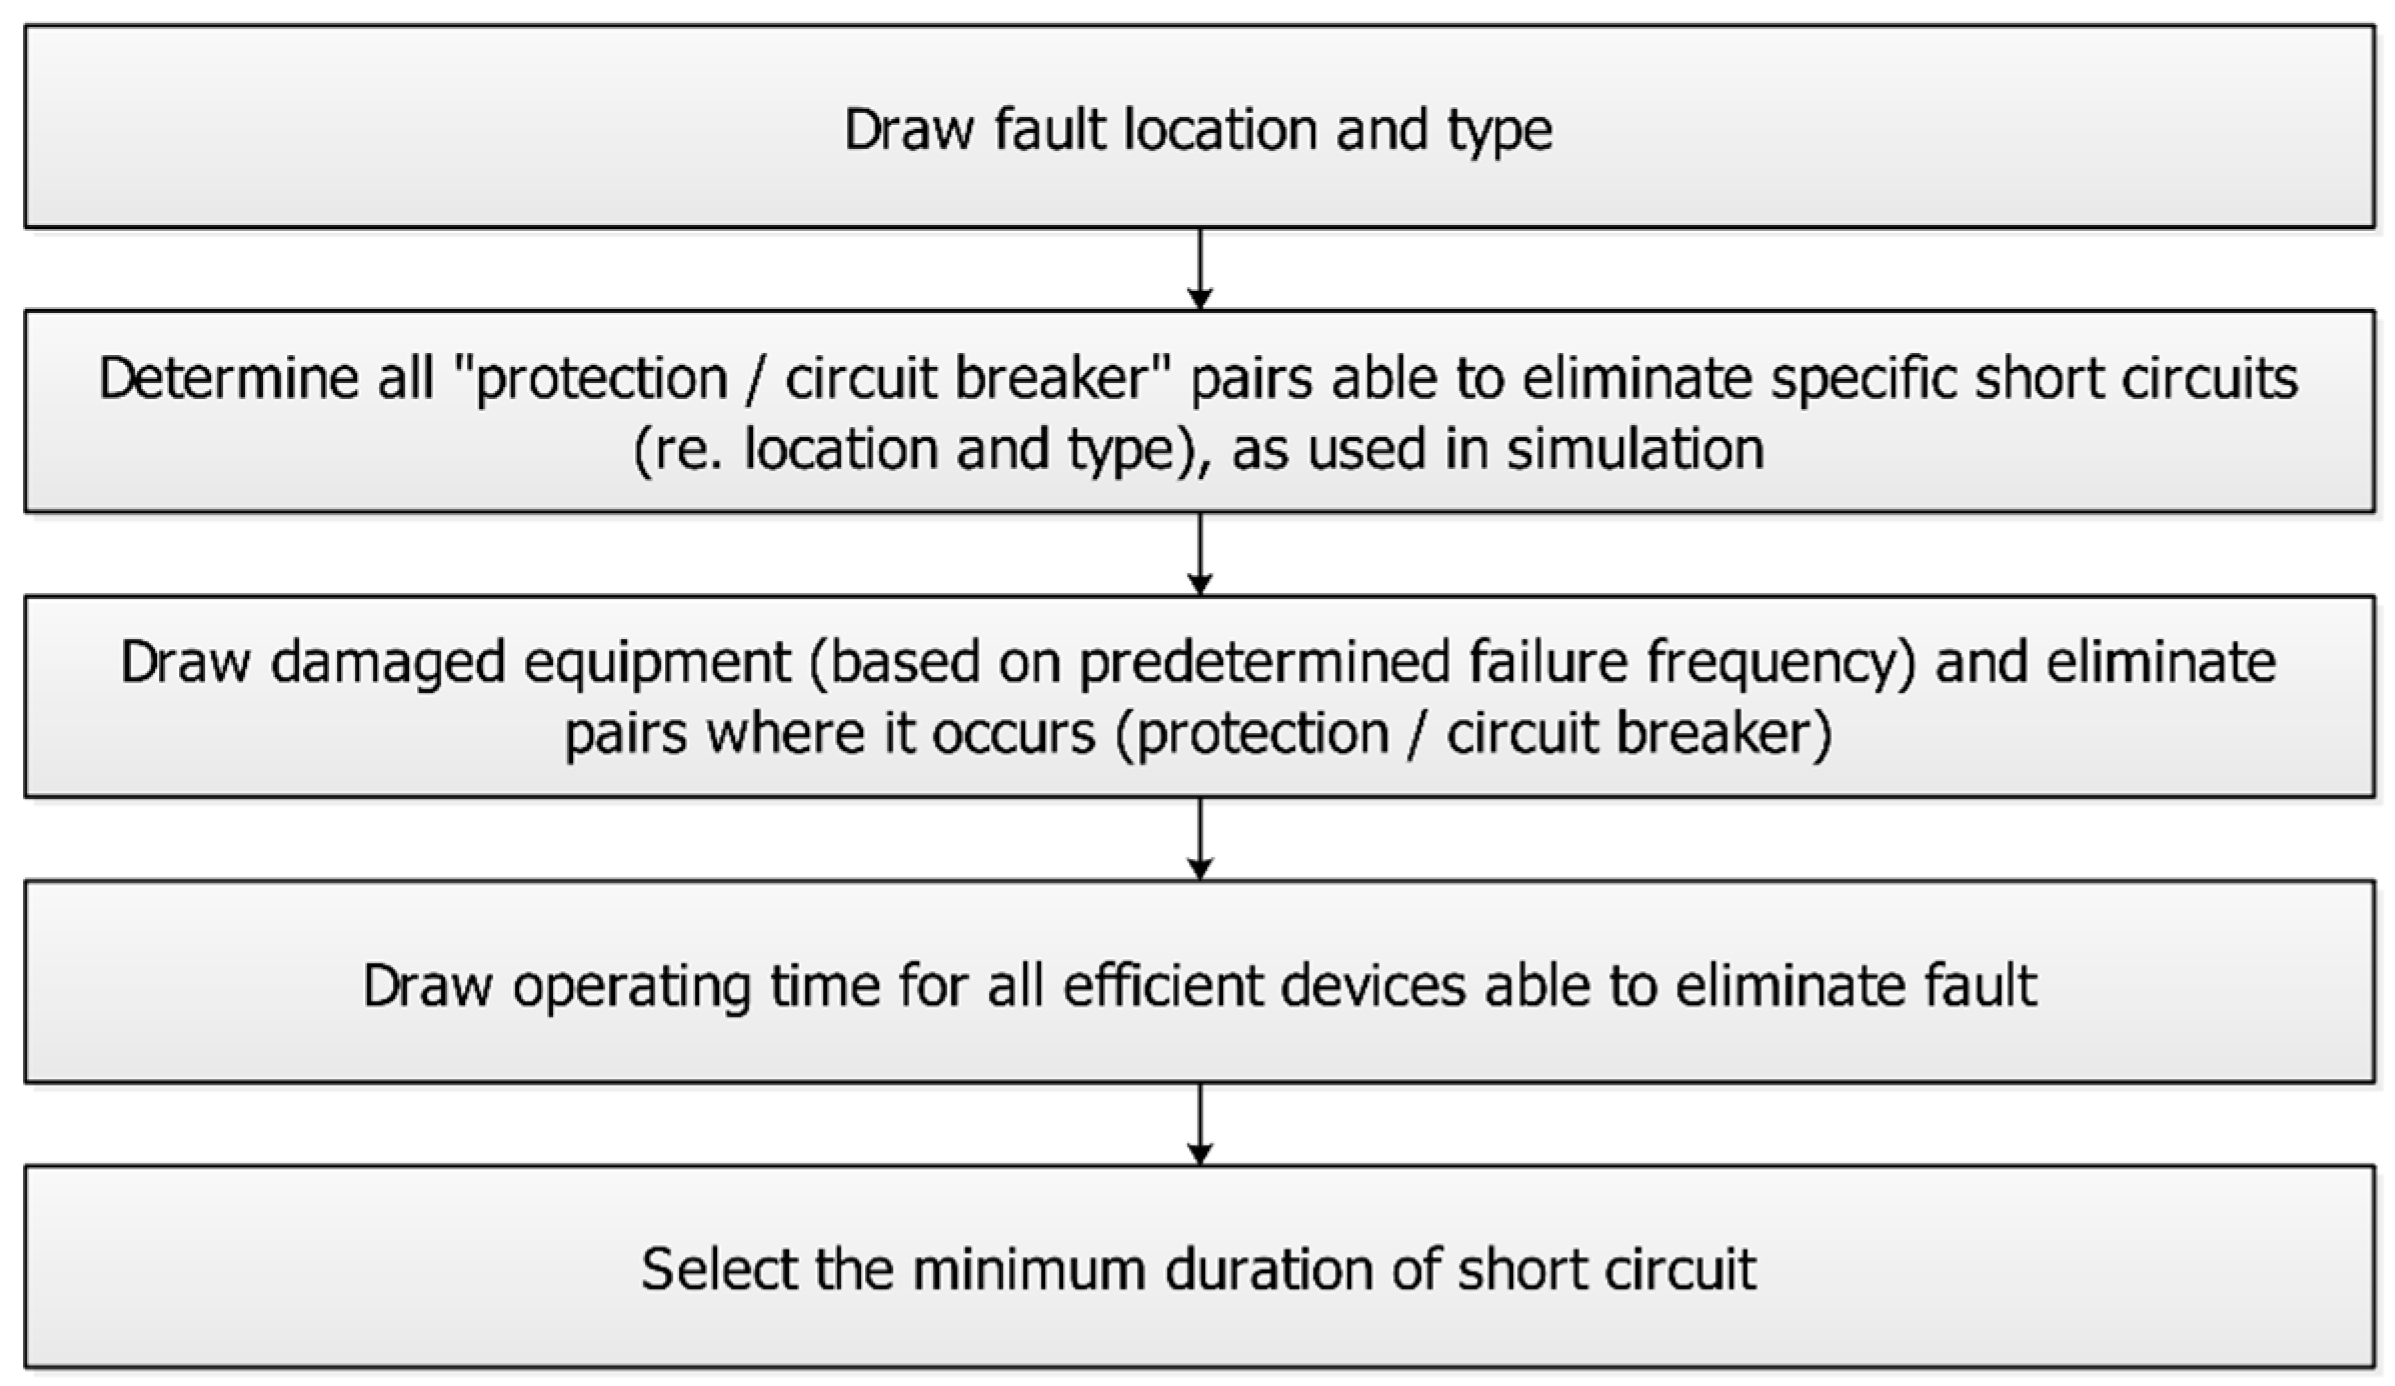
The value of short circuit duration (short circuit current flow) for a specific place and type of short circuit is specified for randomly determined values of protection times and switches participating in interference elimination. It can be considered that short circuit current and short circuit duration are, to some extent, dependent variables. Their values depend on the short circuit location and type. Determining the fault duration value in subsequent simulated faults takes place in the stages shown in
Figure 3.
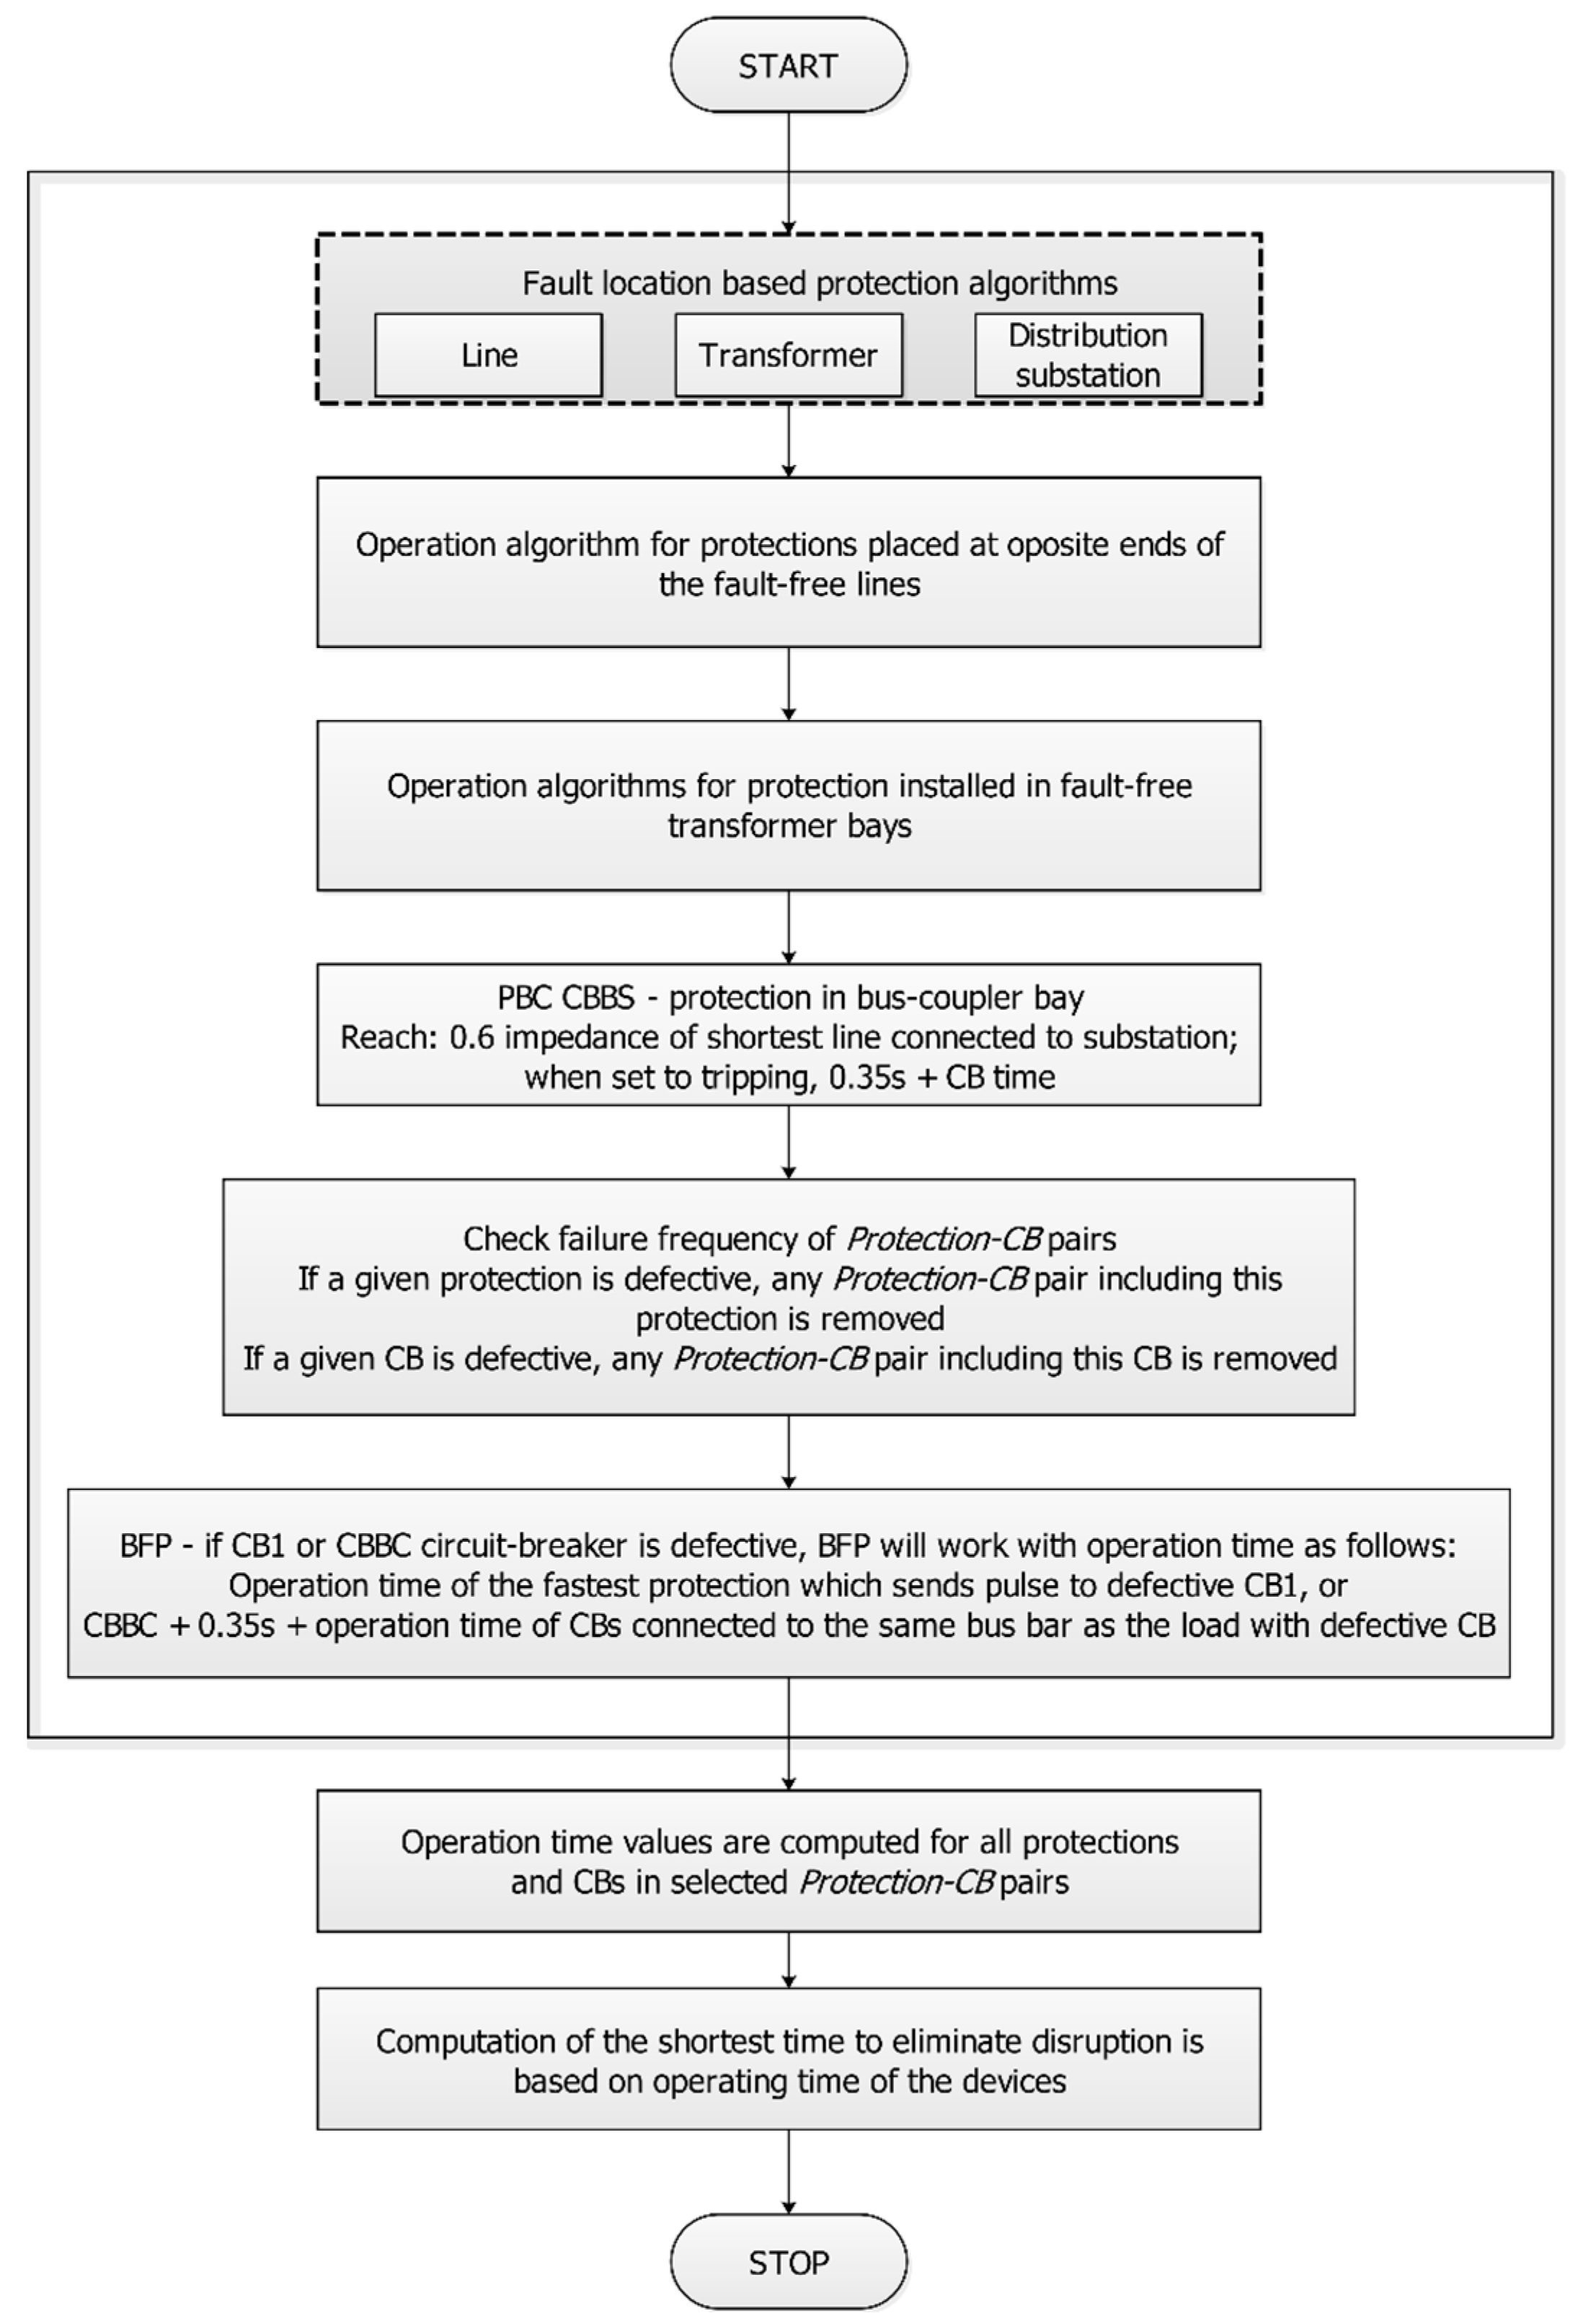
Types, arrangement, operation, and range of zones used in the simulation model of PSPA elements protecting substation bus bars, devices in its substation bays, lines, and transformers are presented in [
23]. The model takes into account the requirements contained in the Instruction of Transmission System Operation and Maintenance [
24]. The general scheme for calculating short circuit duration is shown in
Figure 4. Detailed algorithms for determining the value of short circuit duration during short circuits occurring on elements of the power network are presented in [
23].
3. Operation Time of Protections
Distributions of operation times for chosen protections and circuit breakers found on the basis of analysis of true fault recordings are presented in [
25]. To find the distributions of the protection’s operation times for simulation purposes, the results of periodic inspections carried out in the years 2003–2009 were used. Protections in the distribution bays of the 400, 220, and 110 kV substations belonging to Polskie Sieci Elektroenergetyczne S.A., Poland, and located in the area managed by Polskie Sieci Elektroenergetyczne S.A. Poznan, Poland, were investigated.
Investigations of the protections are carried out in the distribution bays at the place of their installation. The protections are separated from the protected elements and connected to the dedicated circuit. Protection operation time is measured with a timer from the excitation time until the pulse is sent to the circuit-breaker.
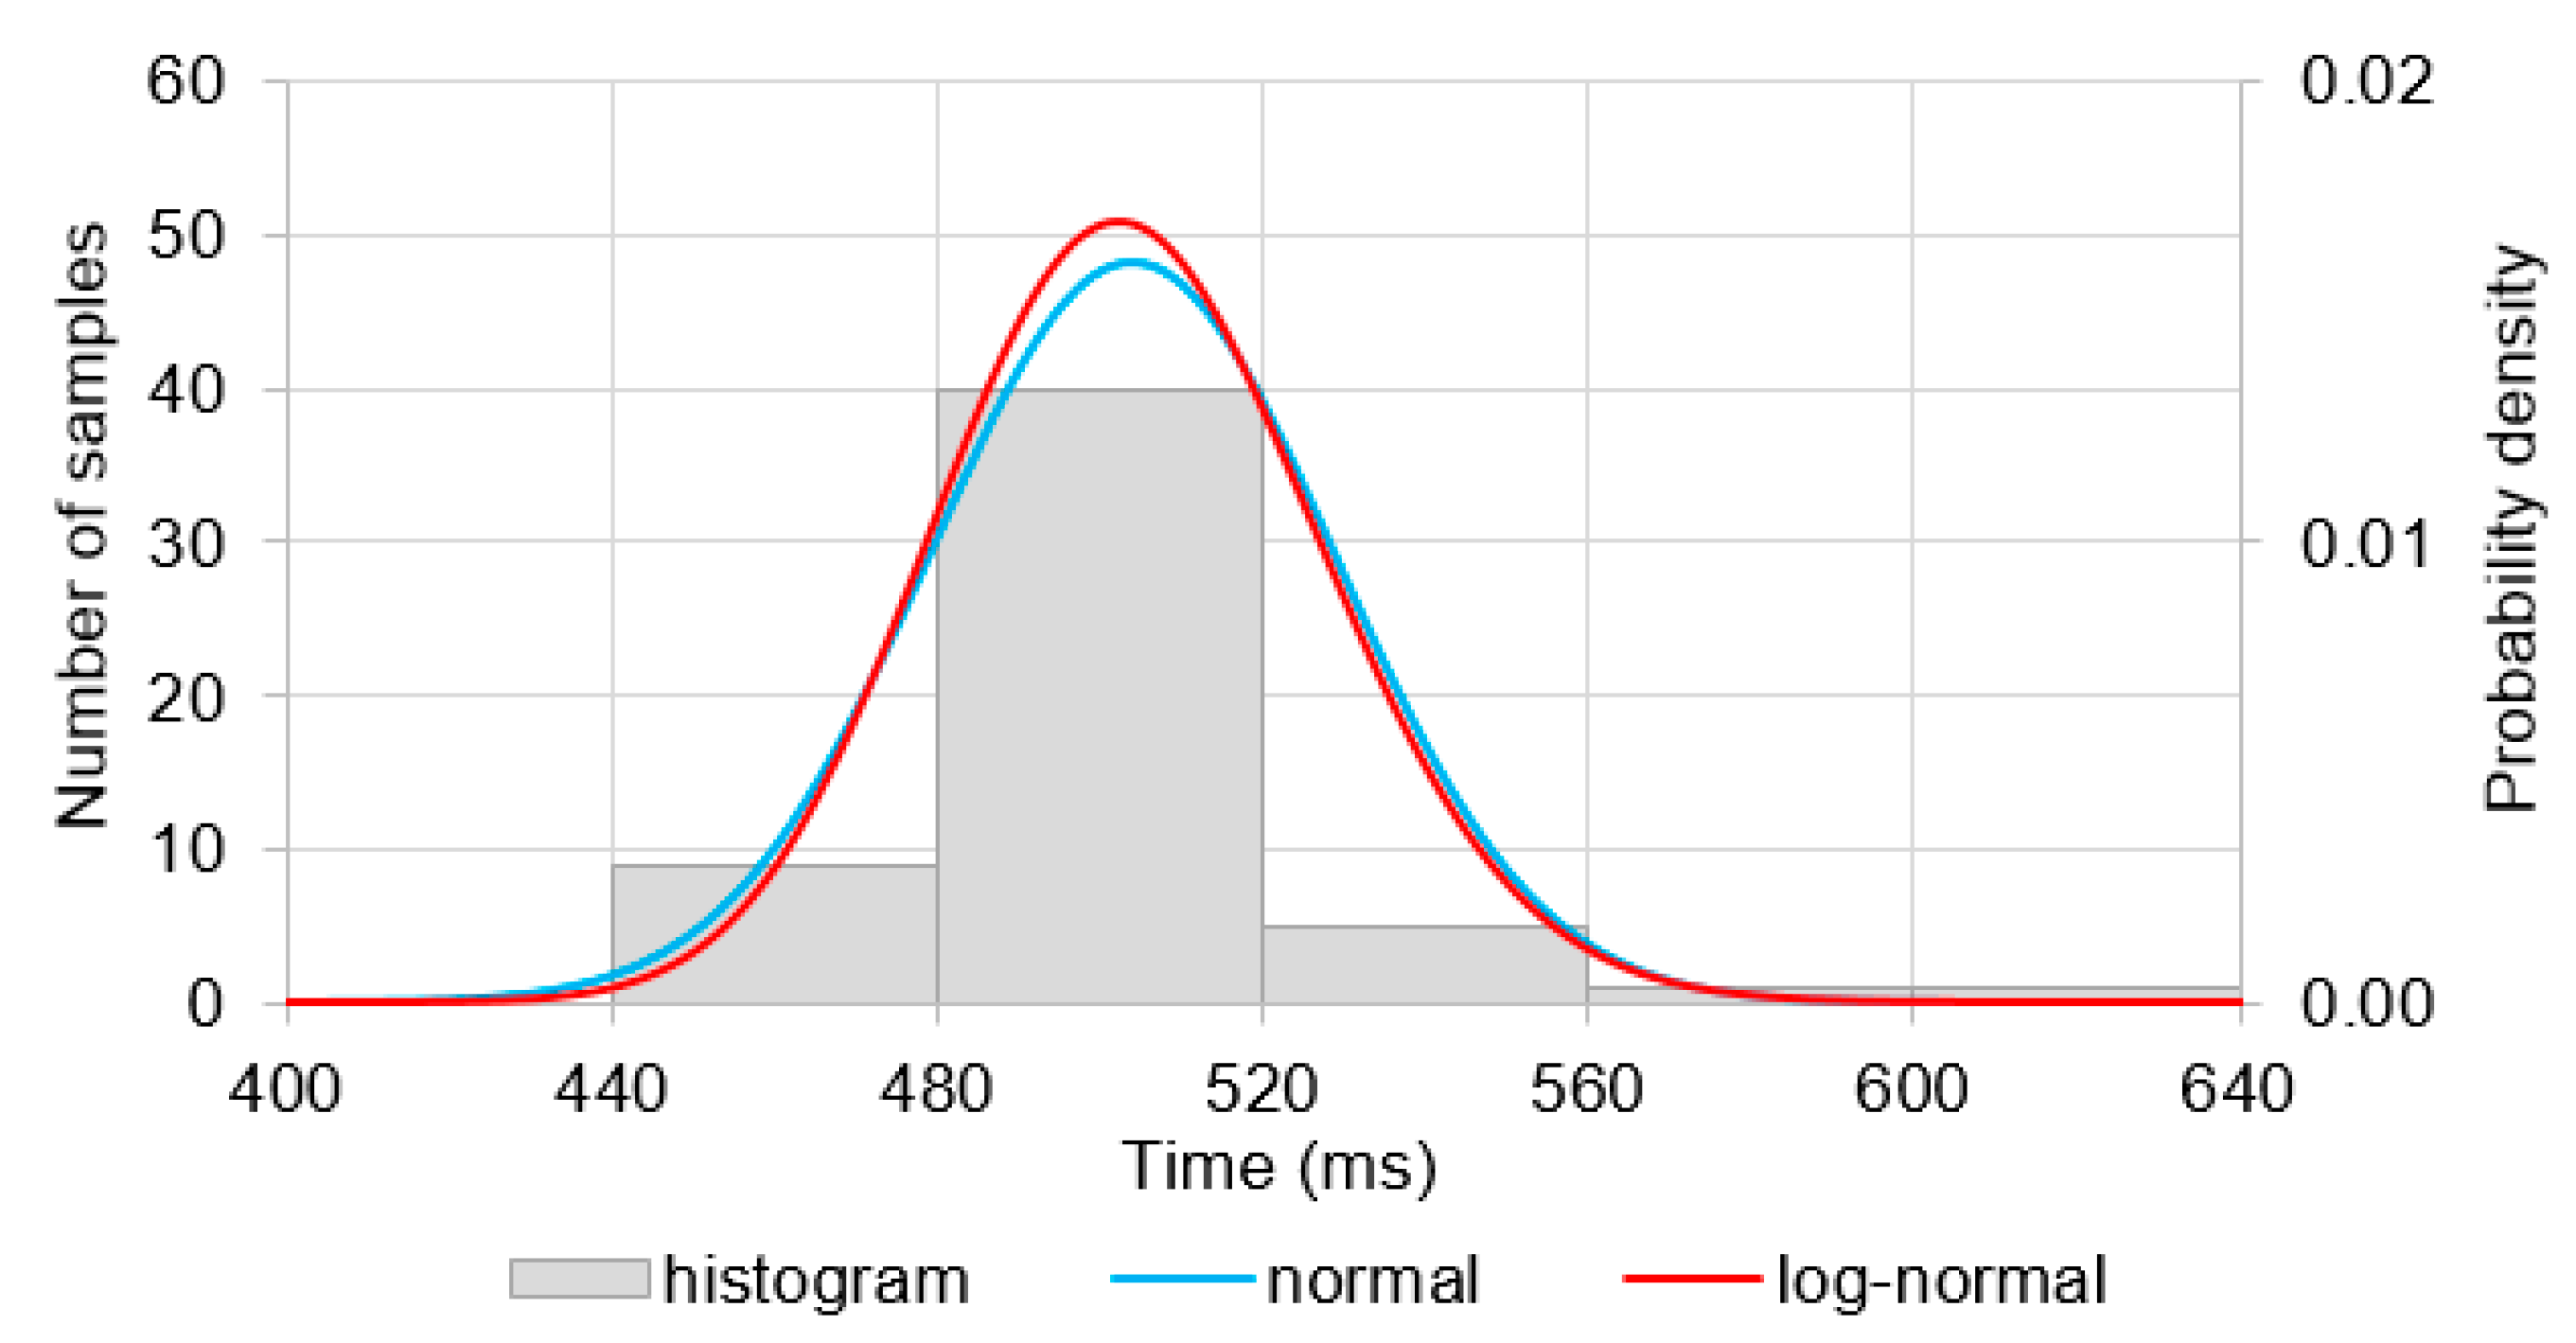
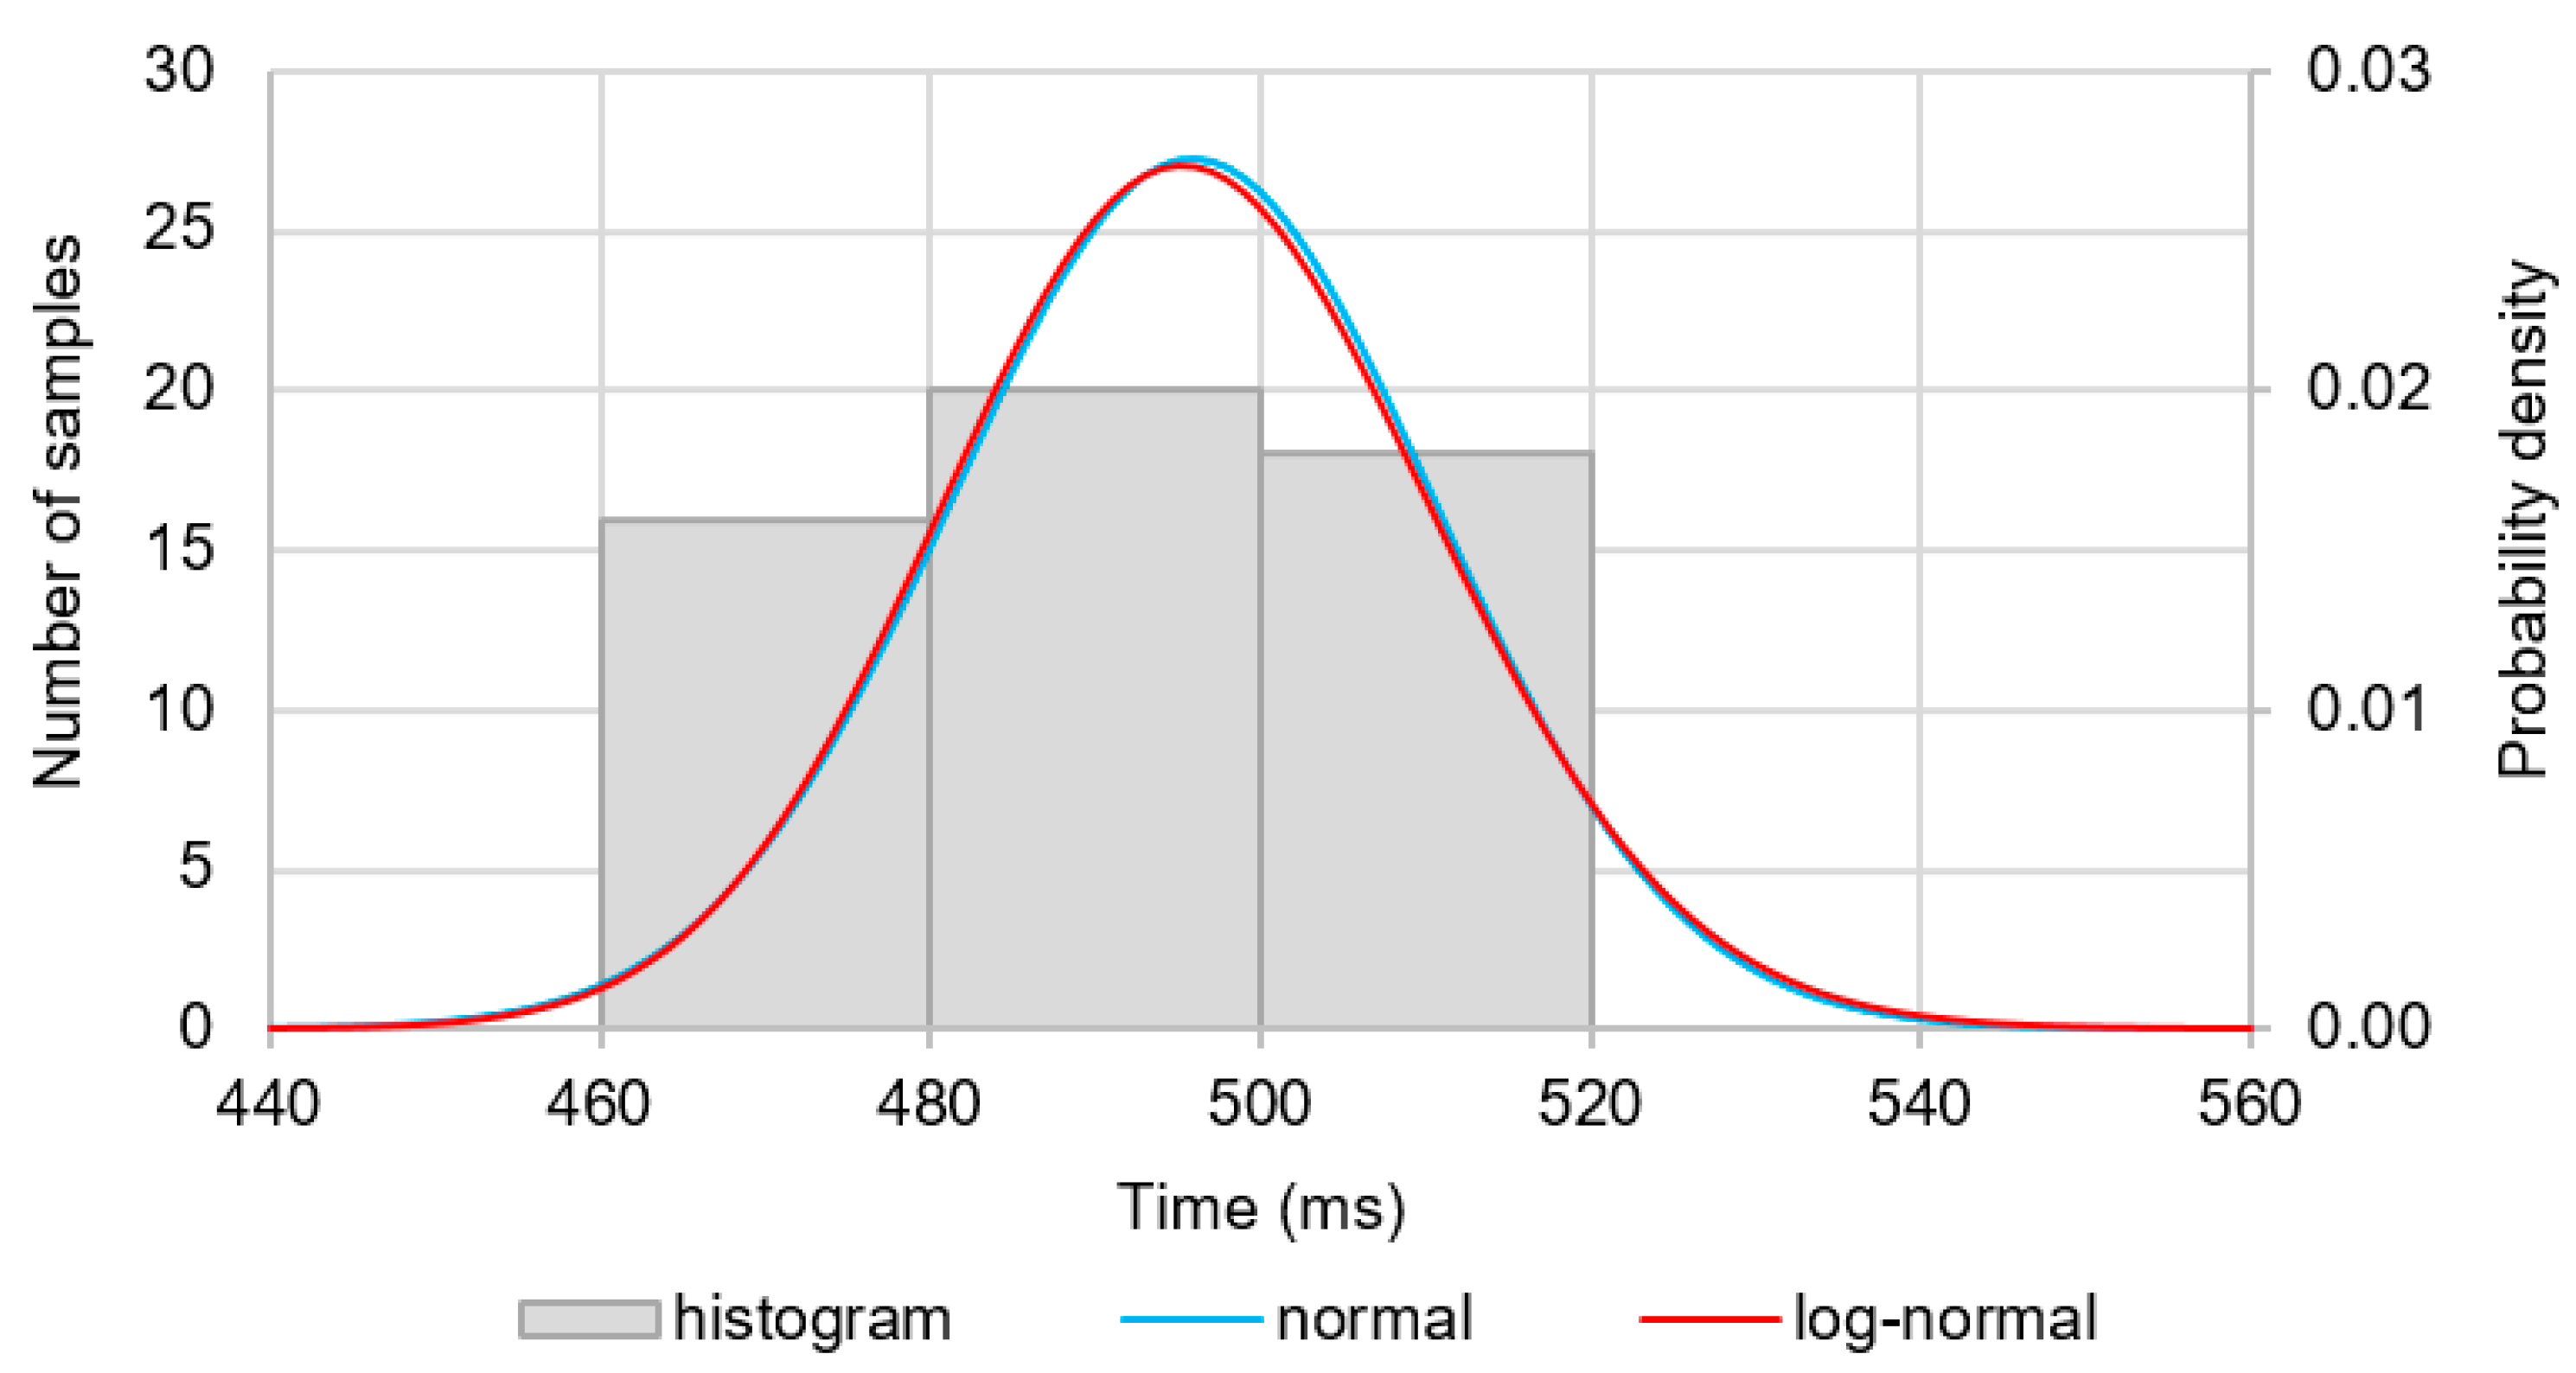
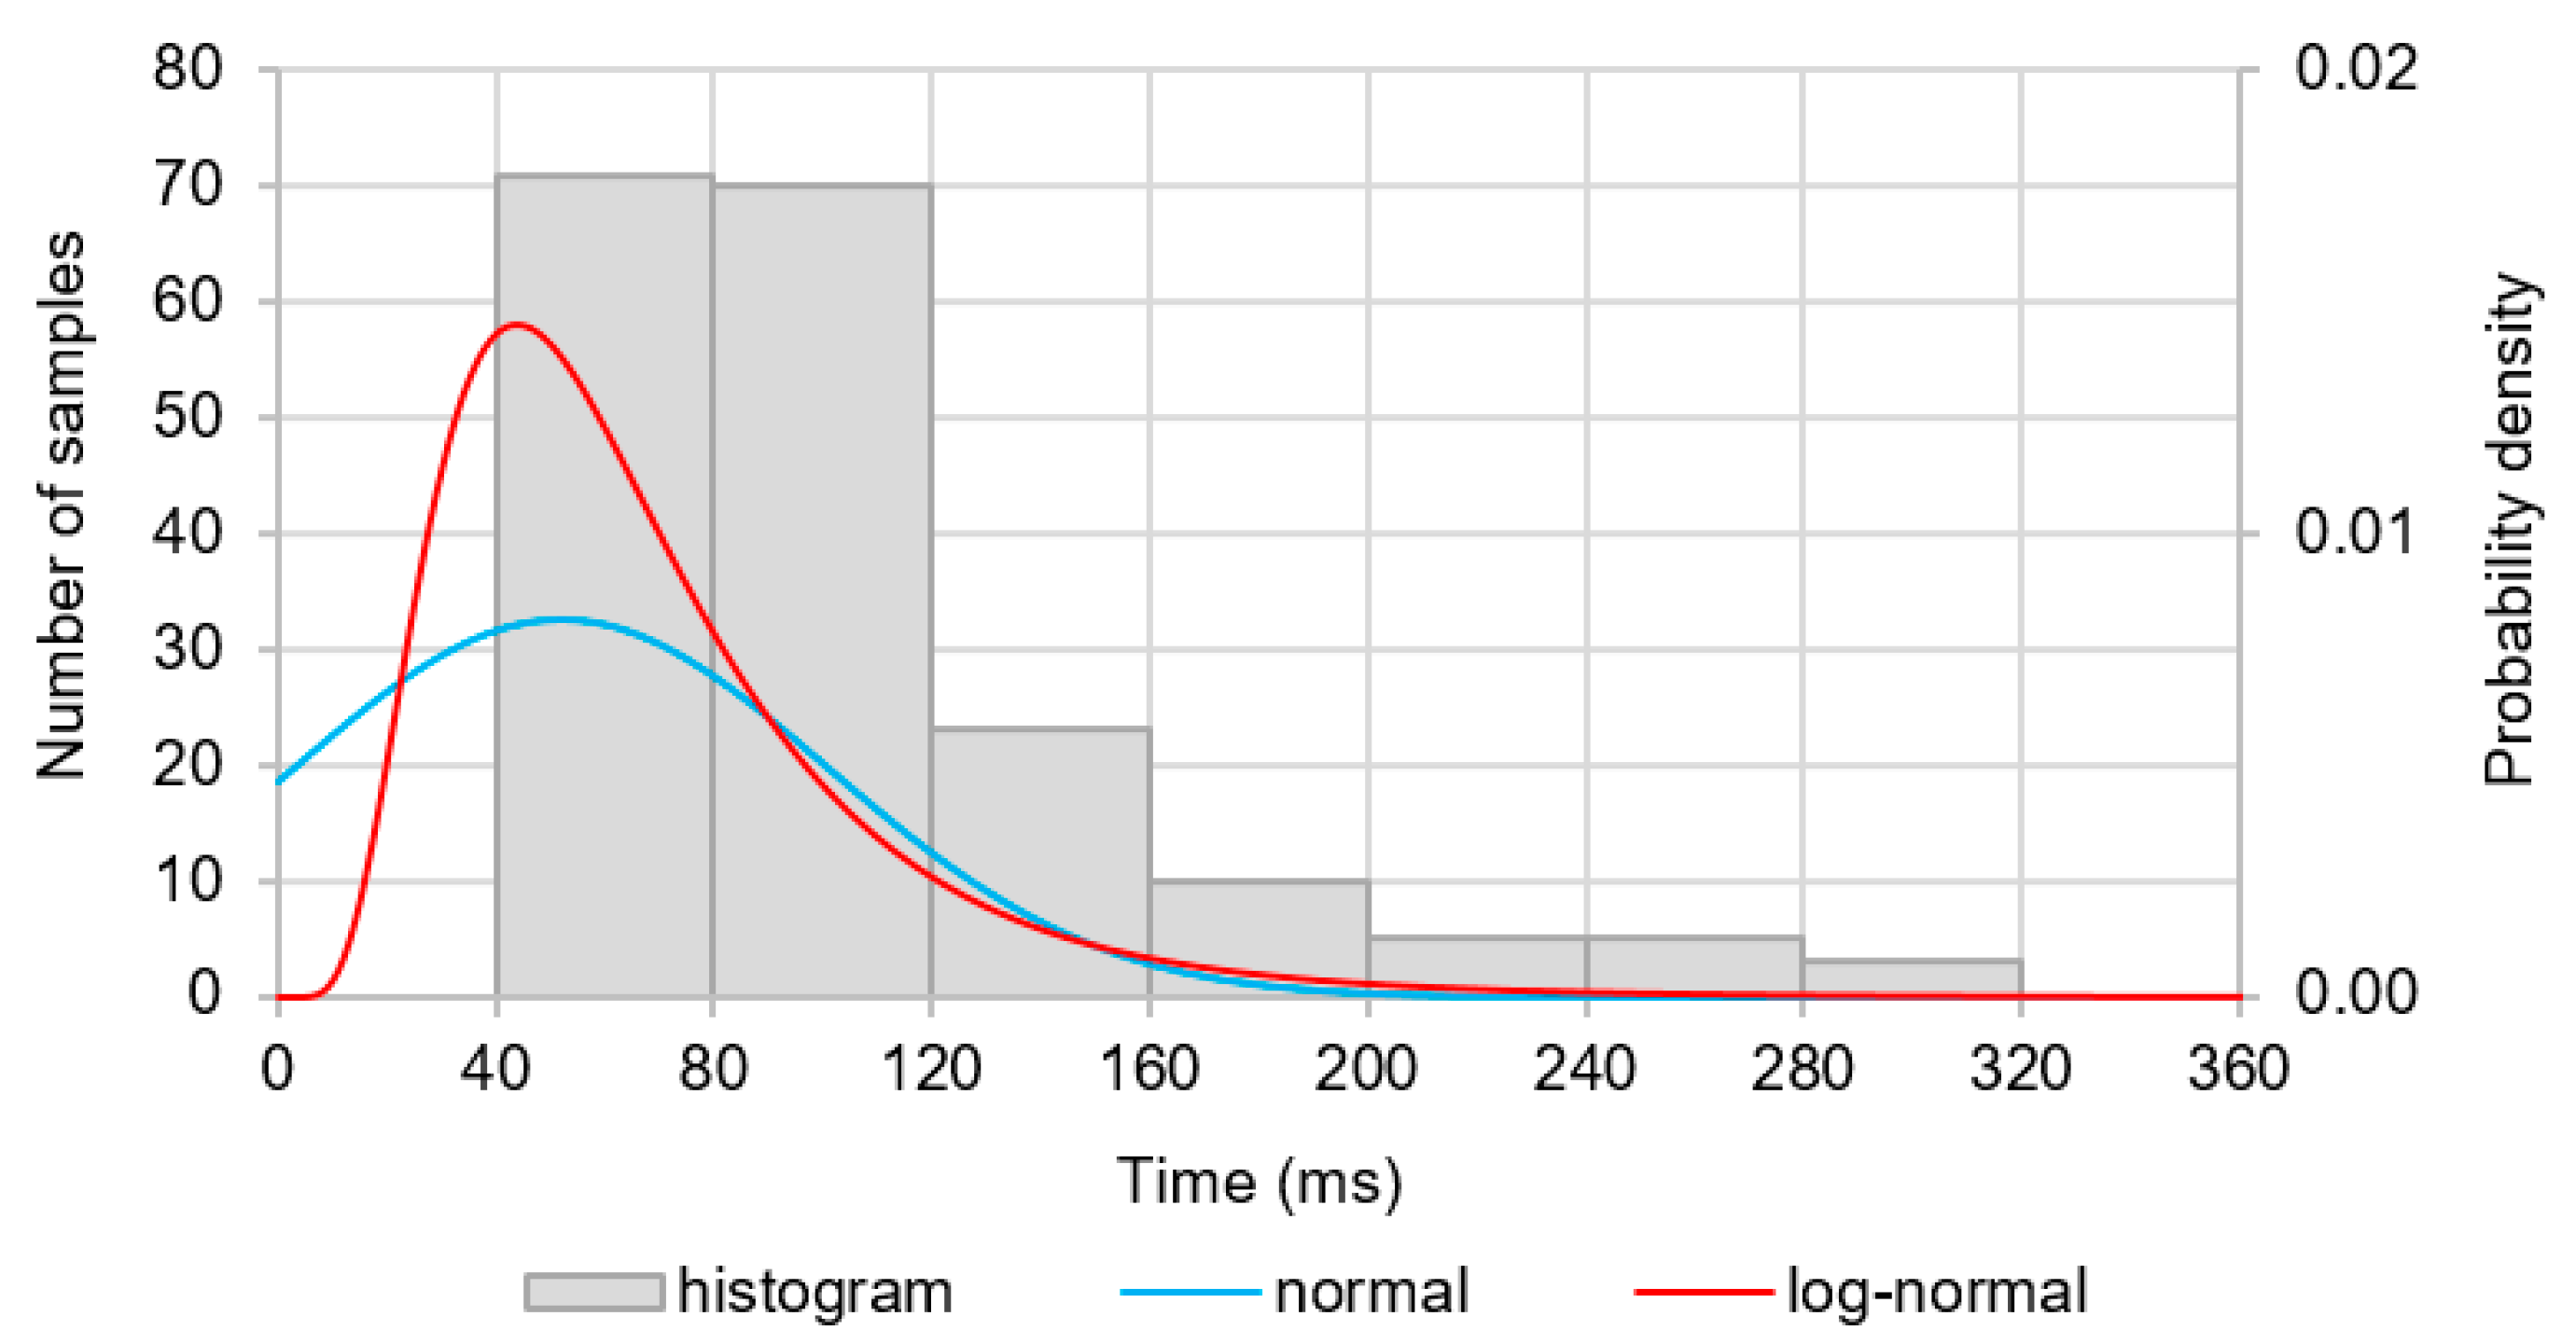
For protections located in the section of interest of the 220 kV substation, the histograms were found and the adequate theoretical distribution was chosen (positive contingency test results). The Statistica (Tibco Software Inc., Palo Alto, CA, USA) software was implemented. For investigated protections, the probability density of the normal and log-normal distributions was found, and the latter is more suitable for the variable’s description.
For illustration, the distributions of operation time of the LZ-32 distance protection (an old-type electromechanical protections still in operation) is shown in
Figure 5 and
Figure 6; the operation duration probability distributions of the protection found for 187 measurements and instantaneous setting is shown in
Figure 5 whilst those found for 65 results and 500 ms setting are shown in
Figure 6.
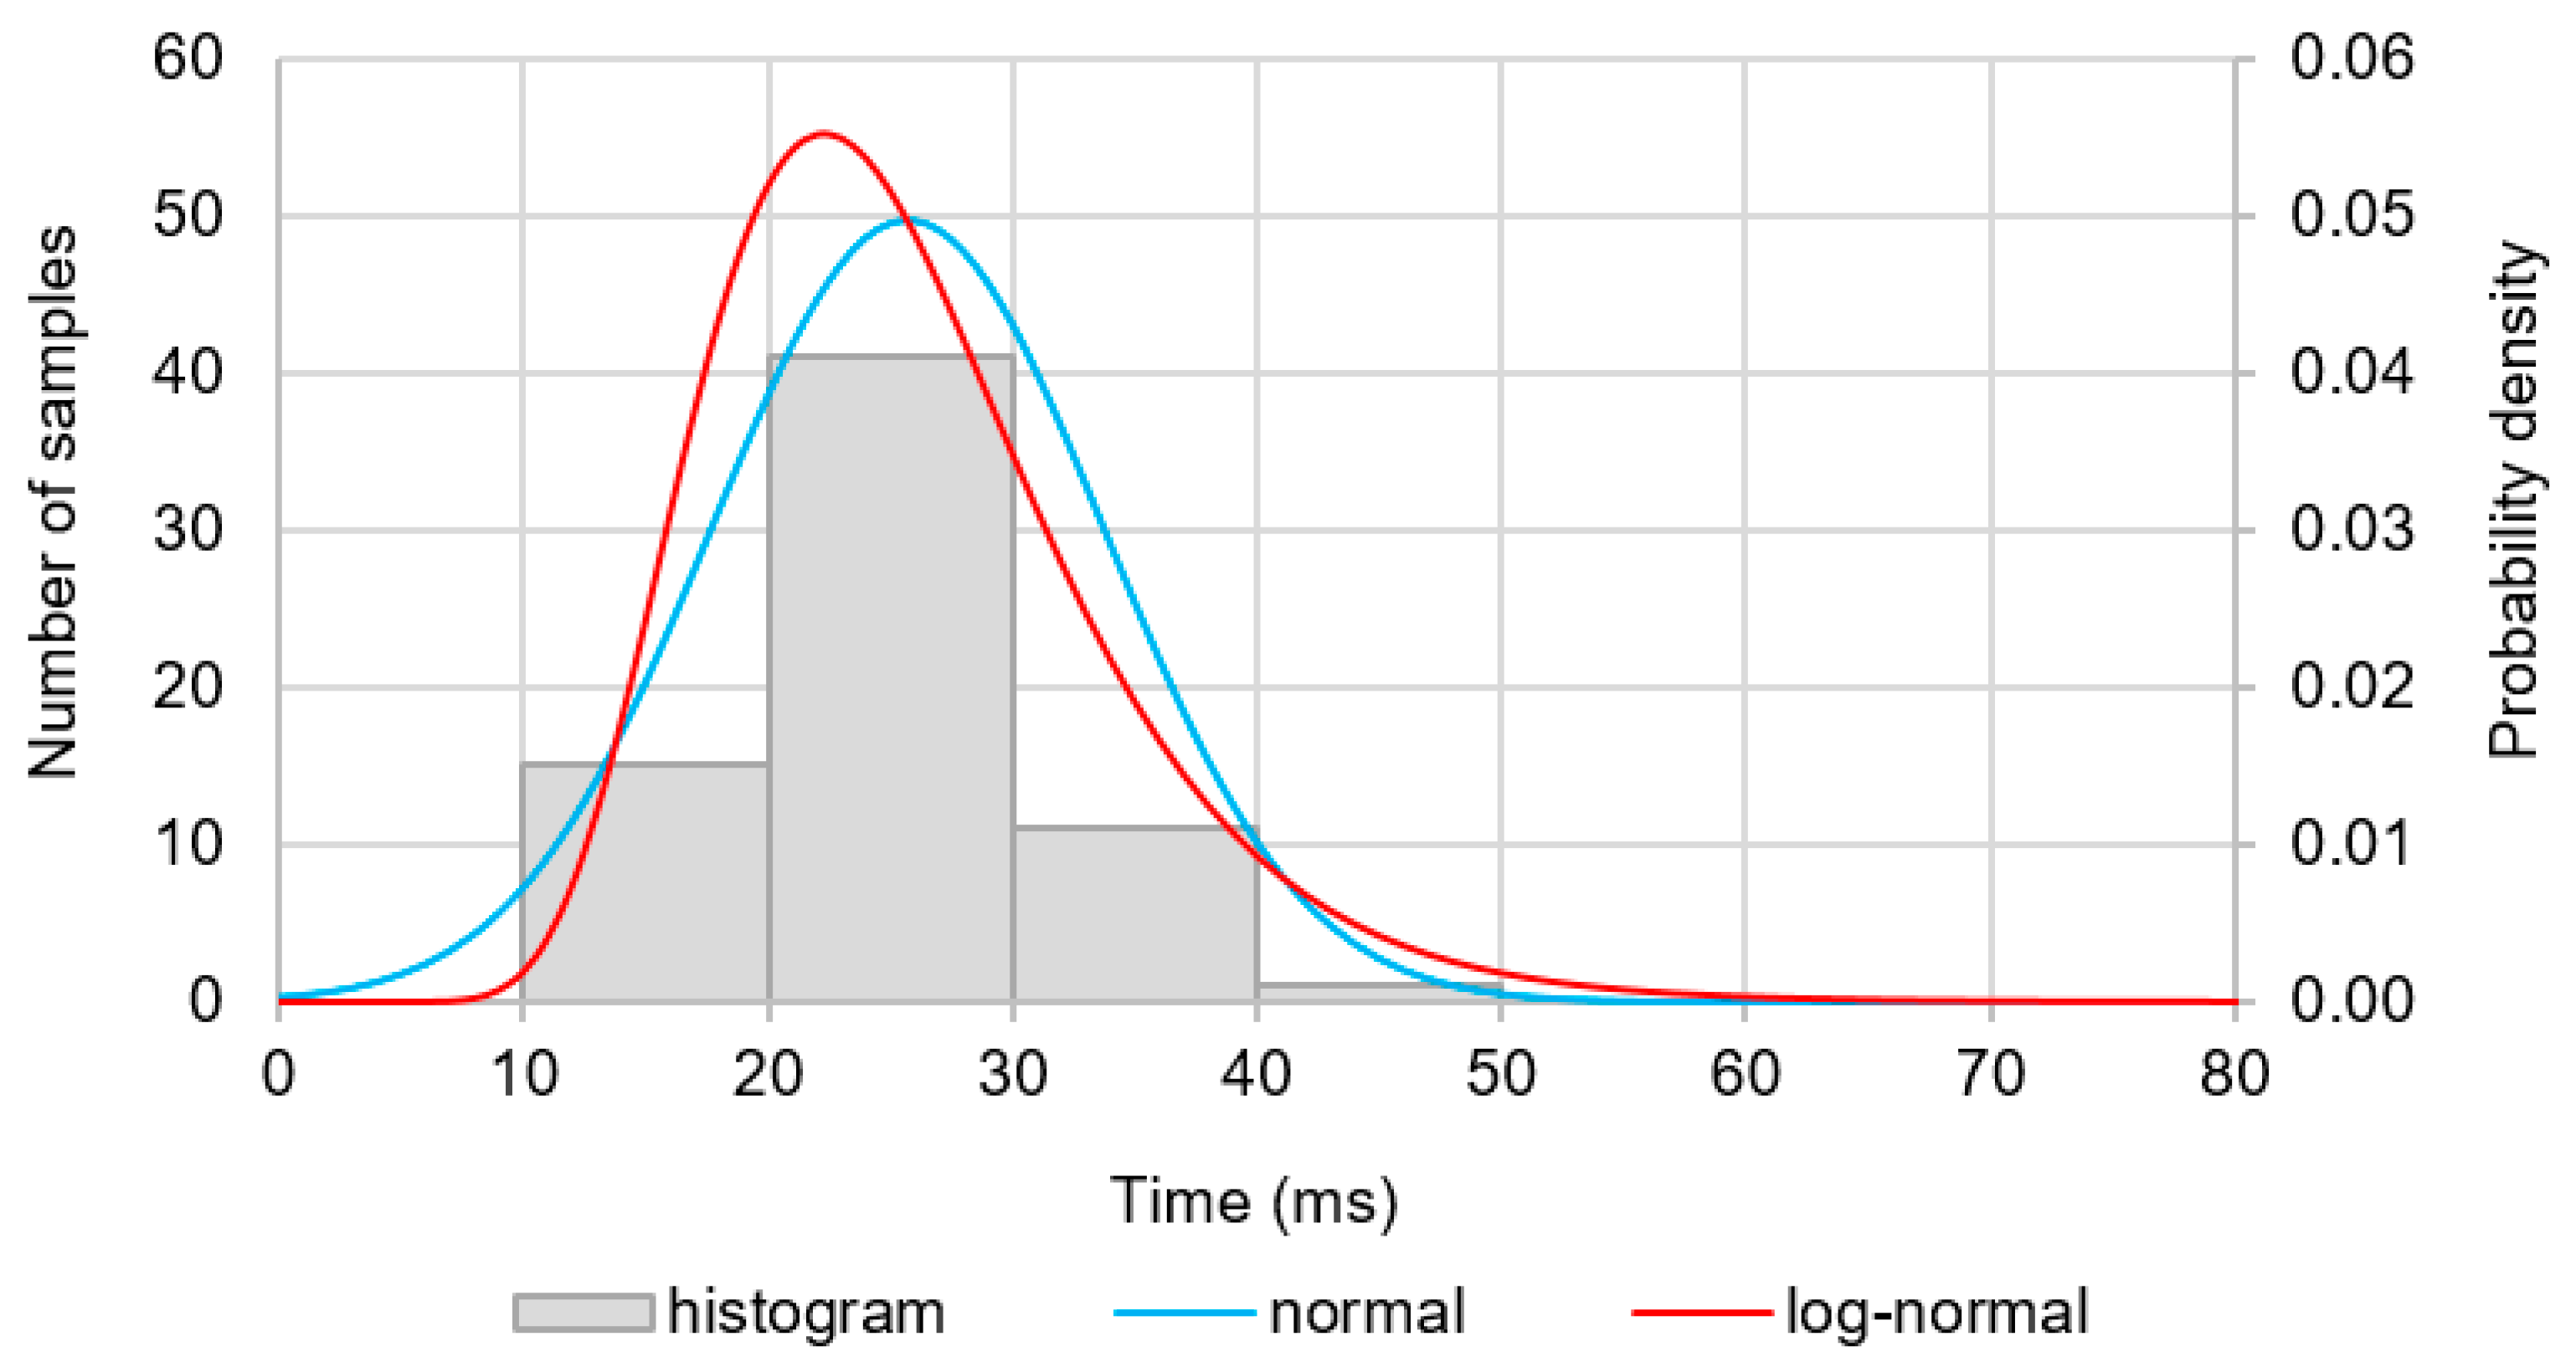
Similar distributions were found for the 7SA protection which is the increasingly applied new-generation digital distance protection superseding the older ones. It is characterized by a slightly lower operating time dispersion. For instantaneous setting (
Figure 7), the 7SA protection’s operating time values are clustered around 25 ms; thus, its operating time is much shorter than that of LZ-32. For 500 ms setting, the measured time values fall between 460 and 520 ms (
Figure 8). The 7SA protection’s operating reliability is much higher than that of the older electromechanical ones.
4. Distribution Substation’s Model and Short Circuit Current Distribution
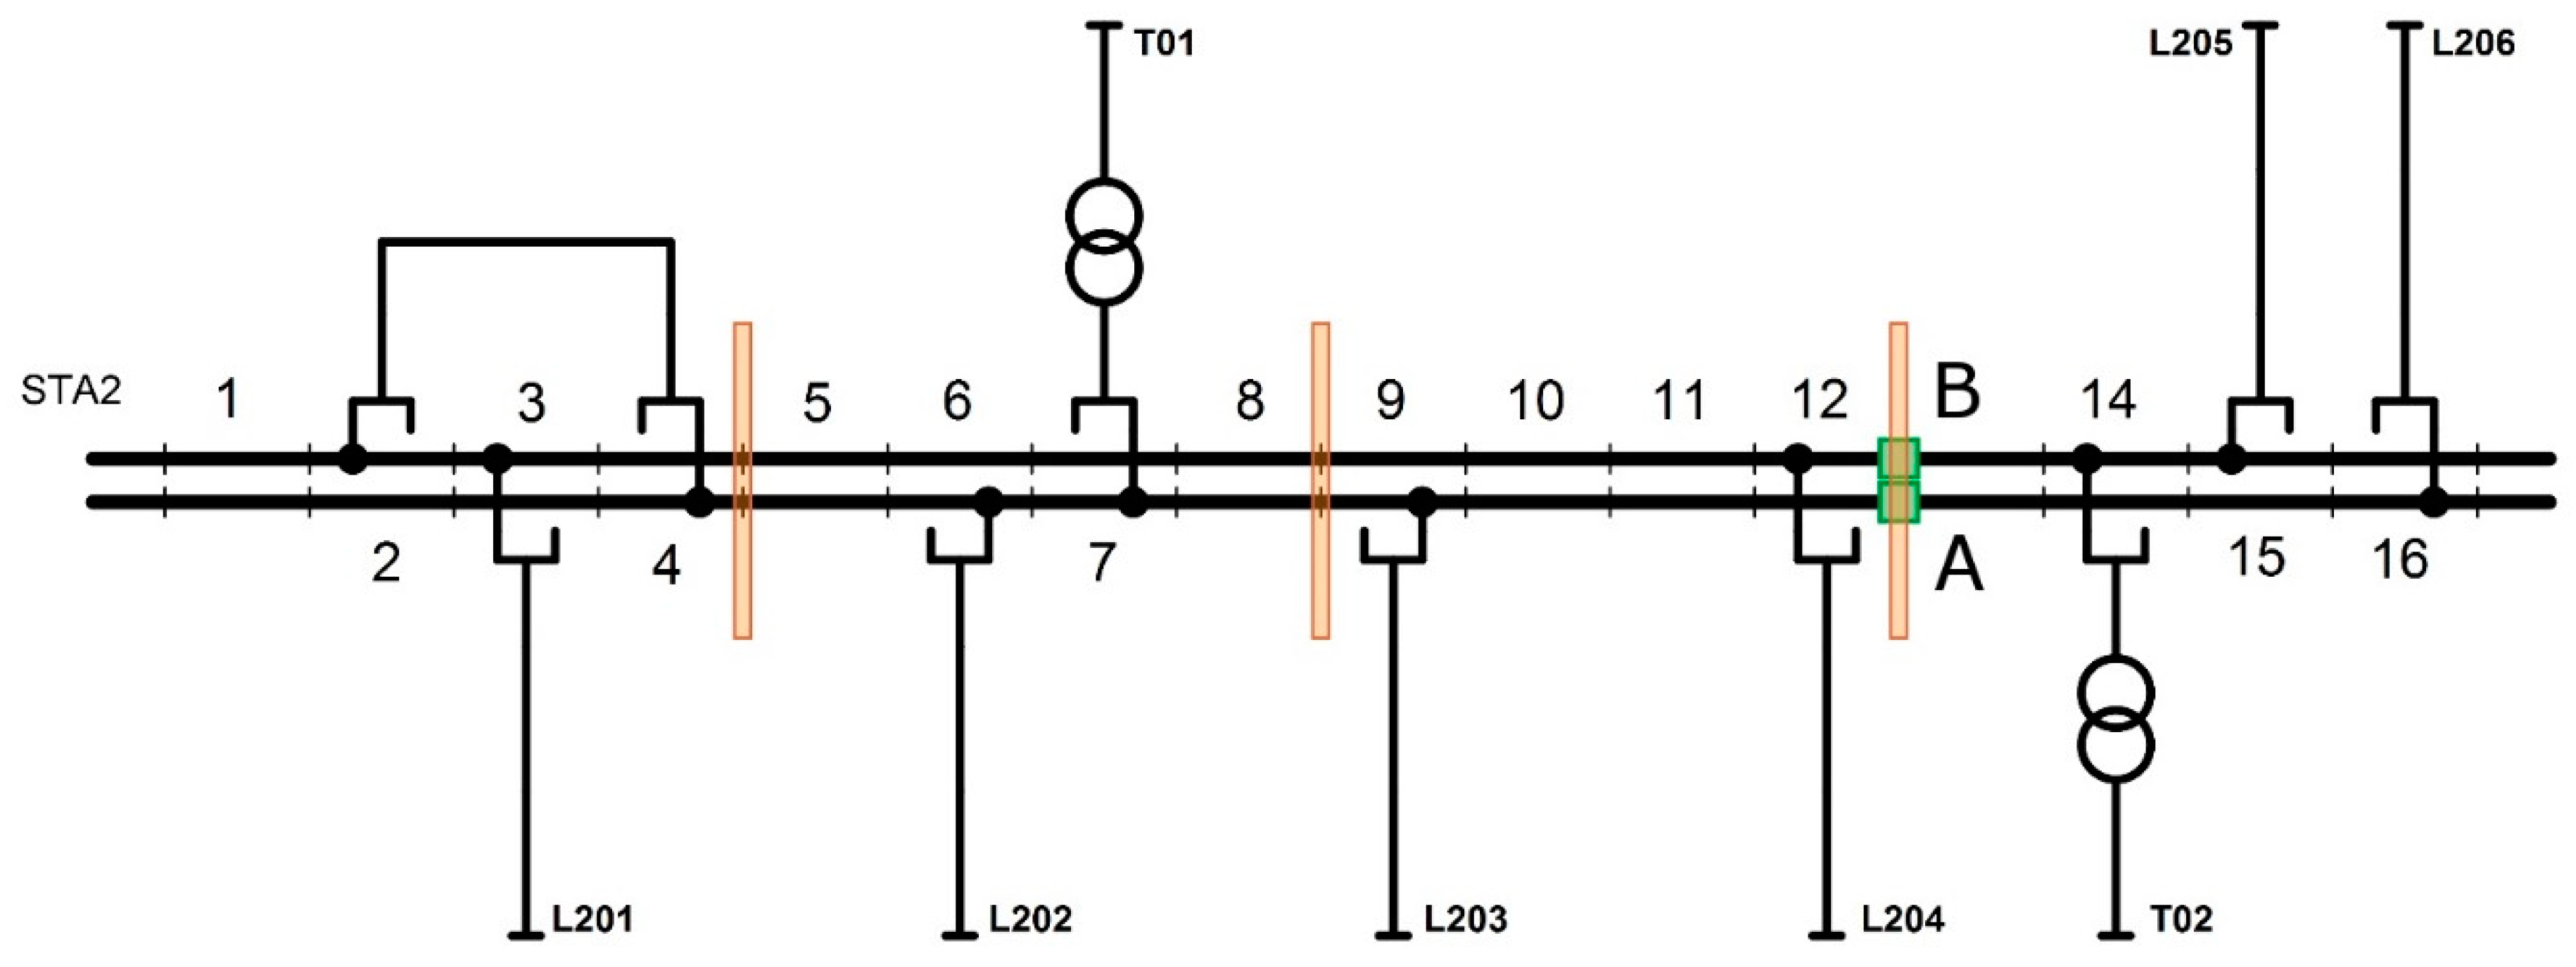
For the purposes of dynamic effects analysis, a 220 kV two-system substation with 16 bay sections was chosen. Six overhead 220 kV lines, two transformers, and one transversal coupler bay used for connecting bus bars and covering two bay sections, are connected to the ten bays in use.
In
Figure 9, the 220 kV substation is shown, and the points of division of the bus system into the wire sections are indicated. The width of a bay section is 14 m. A single-wire section of the bus system covers four bay sections and is 56 m long. The entire sixteen-bay substation comprises four guy-wire sections forming a single bus bar system. Within the section, a bundle of two AFL 8-525 conductors per phase was applied.
Moreover, two points A and B are indicated on the bus bar system at which the fault conditions and dynamical strengths were analyzed.
In the first case (system II, point A), the line (bay No. 16) with a very low contribution to the bus fault current is located on one side of the inspection point. The fault in this substation’s area results in the flow of fault current nearly reaching the maximum value.
In the second case, two bays with the transformer (bay No. 14) and the line (bay No. 15) connected are on one side of the investigation point, whilst the other branches considered in the scheme are on the other side. To assess the substation’s capability to deal with higher fault currents, an algorithm allowing for the appropriate rescaling of the short circuit current flow was developed. The scaling is carried out with respect to the maximum value of fault current on the substation bus (for instance, 40 or 50 kA).
PSPA systems included in the simulation tests are presented in [
14].
Referring to statistical data, the failure rate of protections, Circuit Breakers (CB) and Breaker Failure Protection (BFP) was assumed as 0.03, 0.03, and 0.01, respectively. Parameters describing the intensity of faults on the individual elements of the substation, as well as on those of the connected lines and transformers were also assumed [
19].
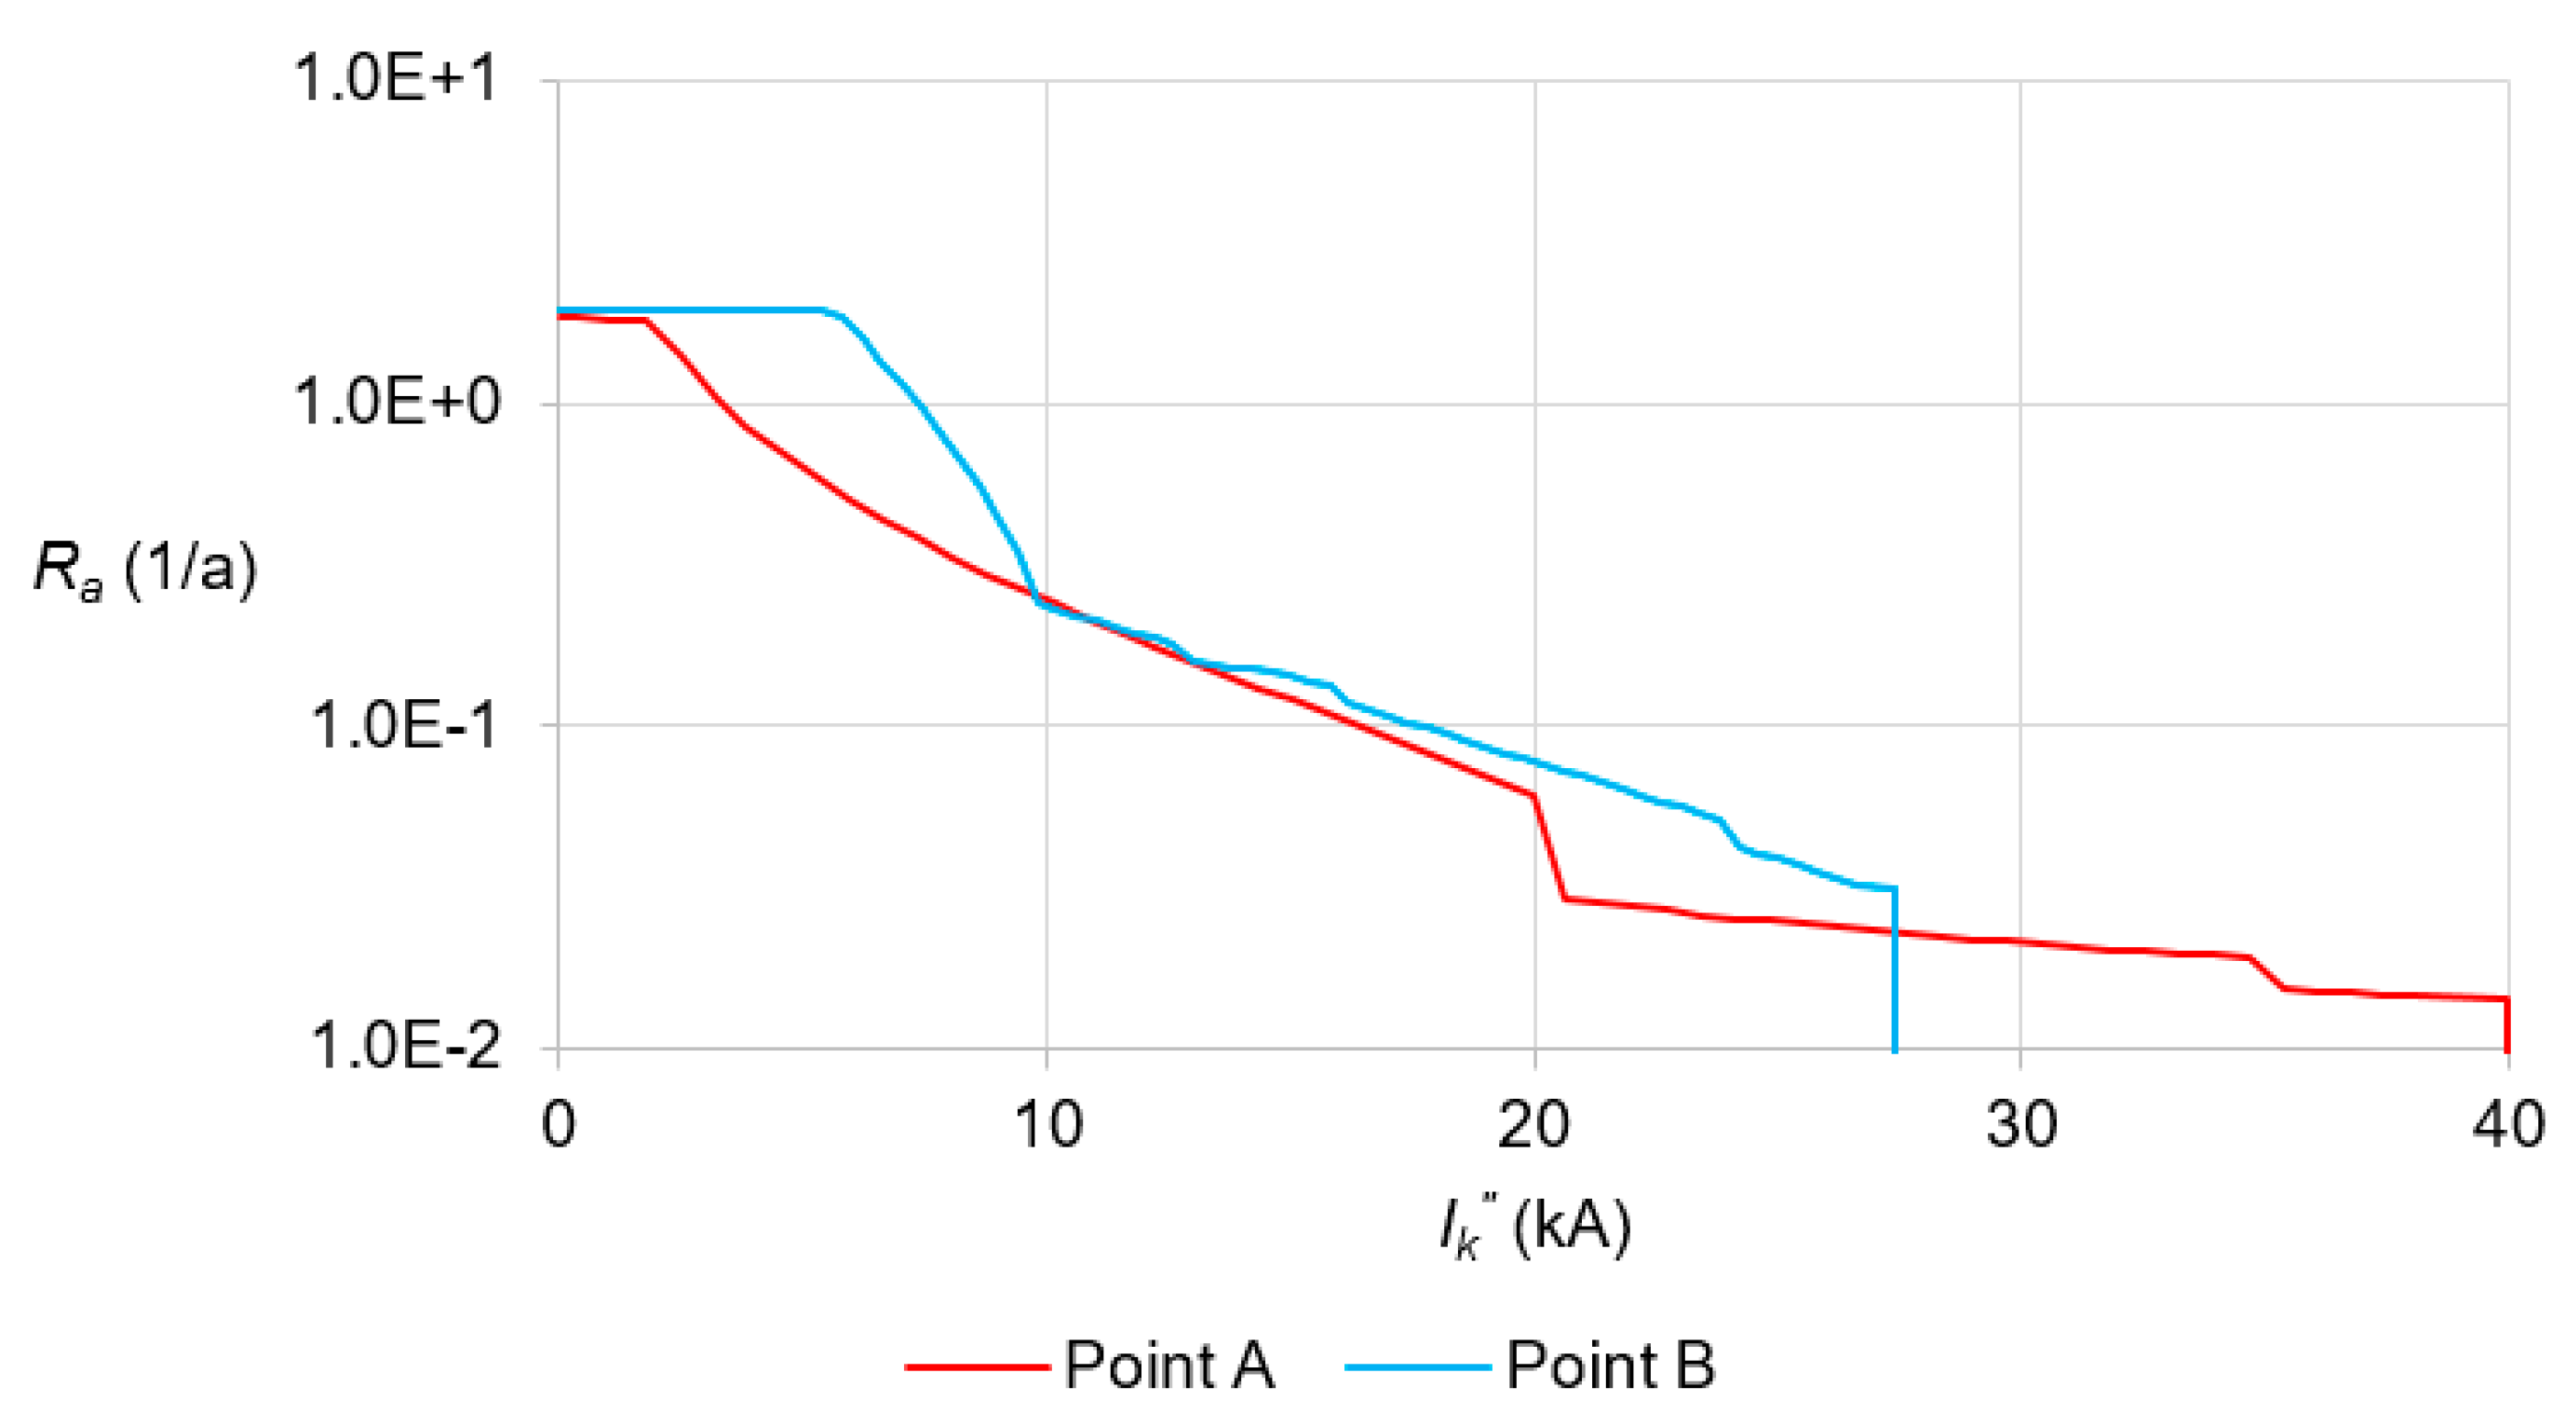
In
Figure 10, the results of analysis of the expected annual frequency of exceeding (risk) individual values of the short circuit current at the lookout points A and B during the faults in the considered system section are reported; the unit is 1/a. The maximum assumed value of the short circuit current on the bus bar was 40 kA.
The maximum currents expected at points A and B of the substation during three-phase short circuits are close to 40 and 27 kA, respectively.
5. Results of the Short Circuit Duration and Dynamic Force Analyses
The annual frequency of exceeding actual values of short circuit duration was discussed for four different PSPA configurations in the 220 kV substation. The main distance protections are assumed to be the new 7SA release. The PSPA configurations in substations are described in detail in
Table 1. In the simulations, system sections in which the short circuit current values (important in dynamic effect analysis) flow through the lookout points are considered.
The plots presenting the found frequency of exceeding the short circuit duration at lookout point A for the considered four different PSPA configurations are shown in
Figure 11. In calculations, faults on the second bus bar system section in line bay No. 16 and on the line connected to the bay (on the right of the lookout point) were taken into account.
If only one 220 kV line is on the right of the lookout point, the Automatic Reclosing (AR) equipment, as well as duplication of protections on the line affect mostly the investigated frequency. When the exceeding frequency is 10−1 1/a or 10−2 1/a, the lack of AR equipment significantly overstates the short circuit duration values that are found.
The curves in
Figure 11 for configuration No. 1, No. 3, and No. 4 are comparable. When exceeding frequency is 10
−3 1/a or lower, there is no noticeable impact of the PSPA configuration on the results obtained.
Short circuit duration values for both selected levels of frequency of exceeding and the considered PSPA configurations at the lookout point A are reported in
Table 2.
At lookout point B, the influence of PSPA configuration on the short circuit duration distribution is slightly different [
5].
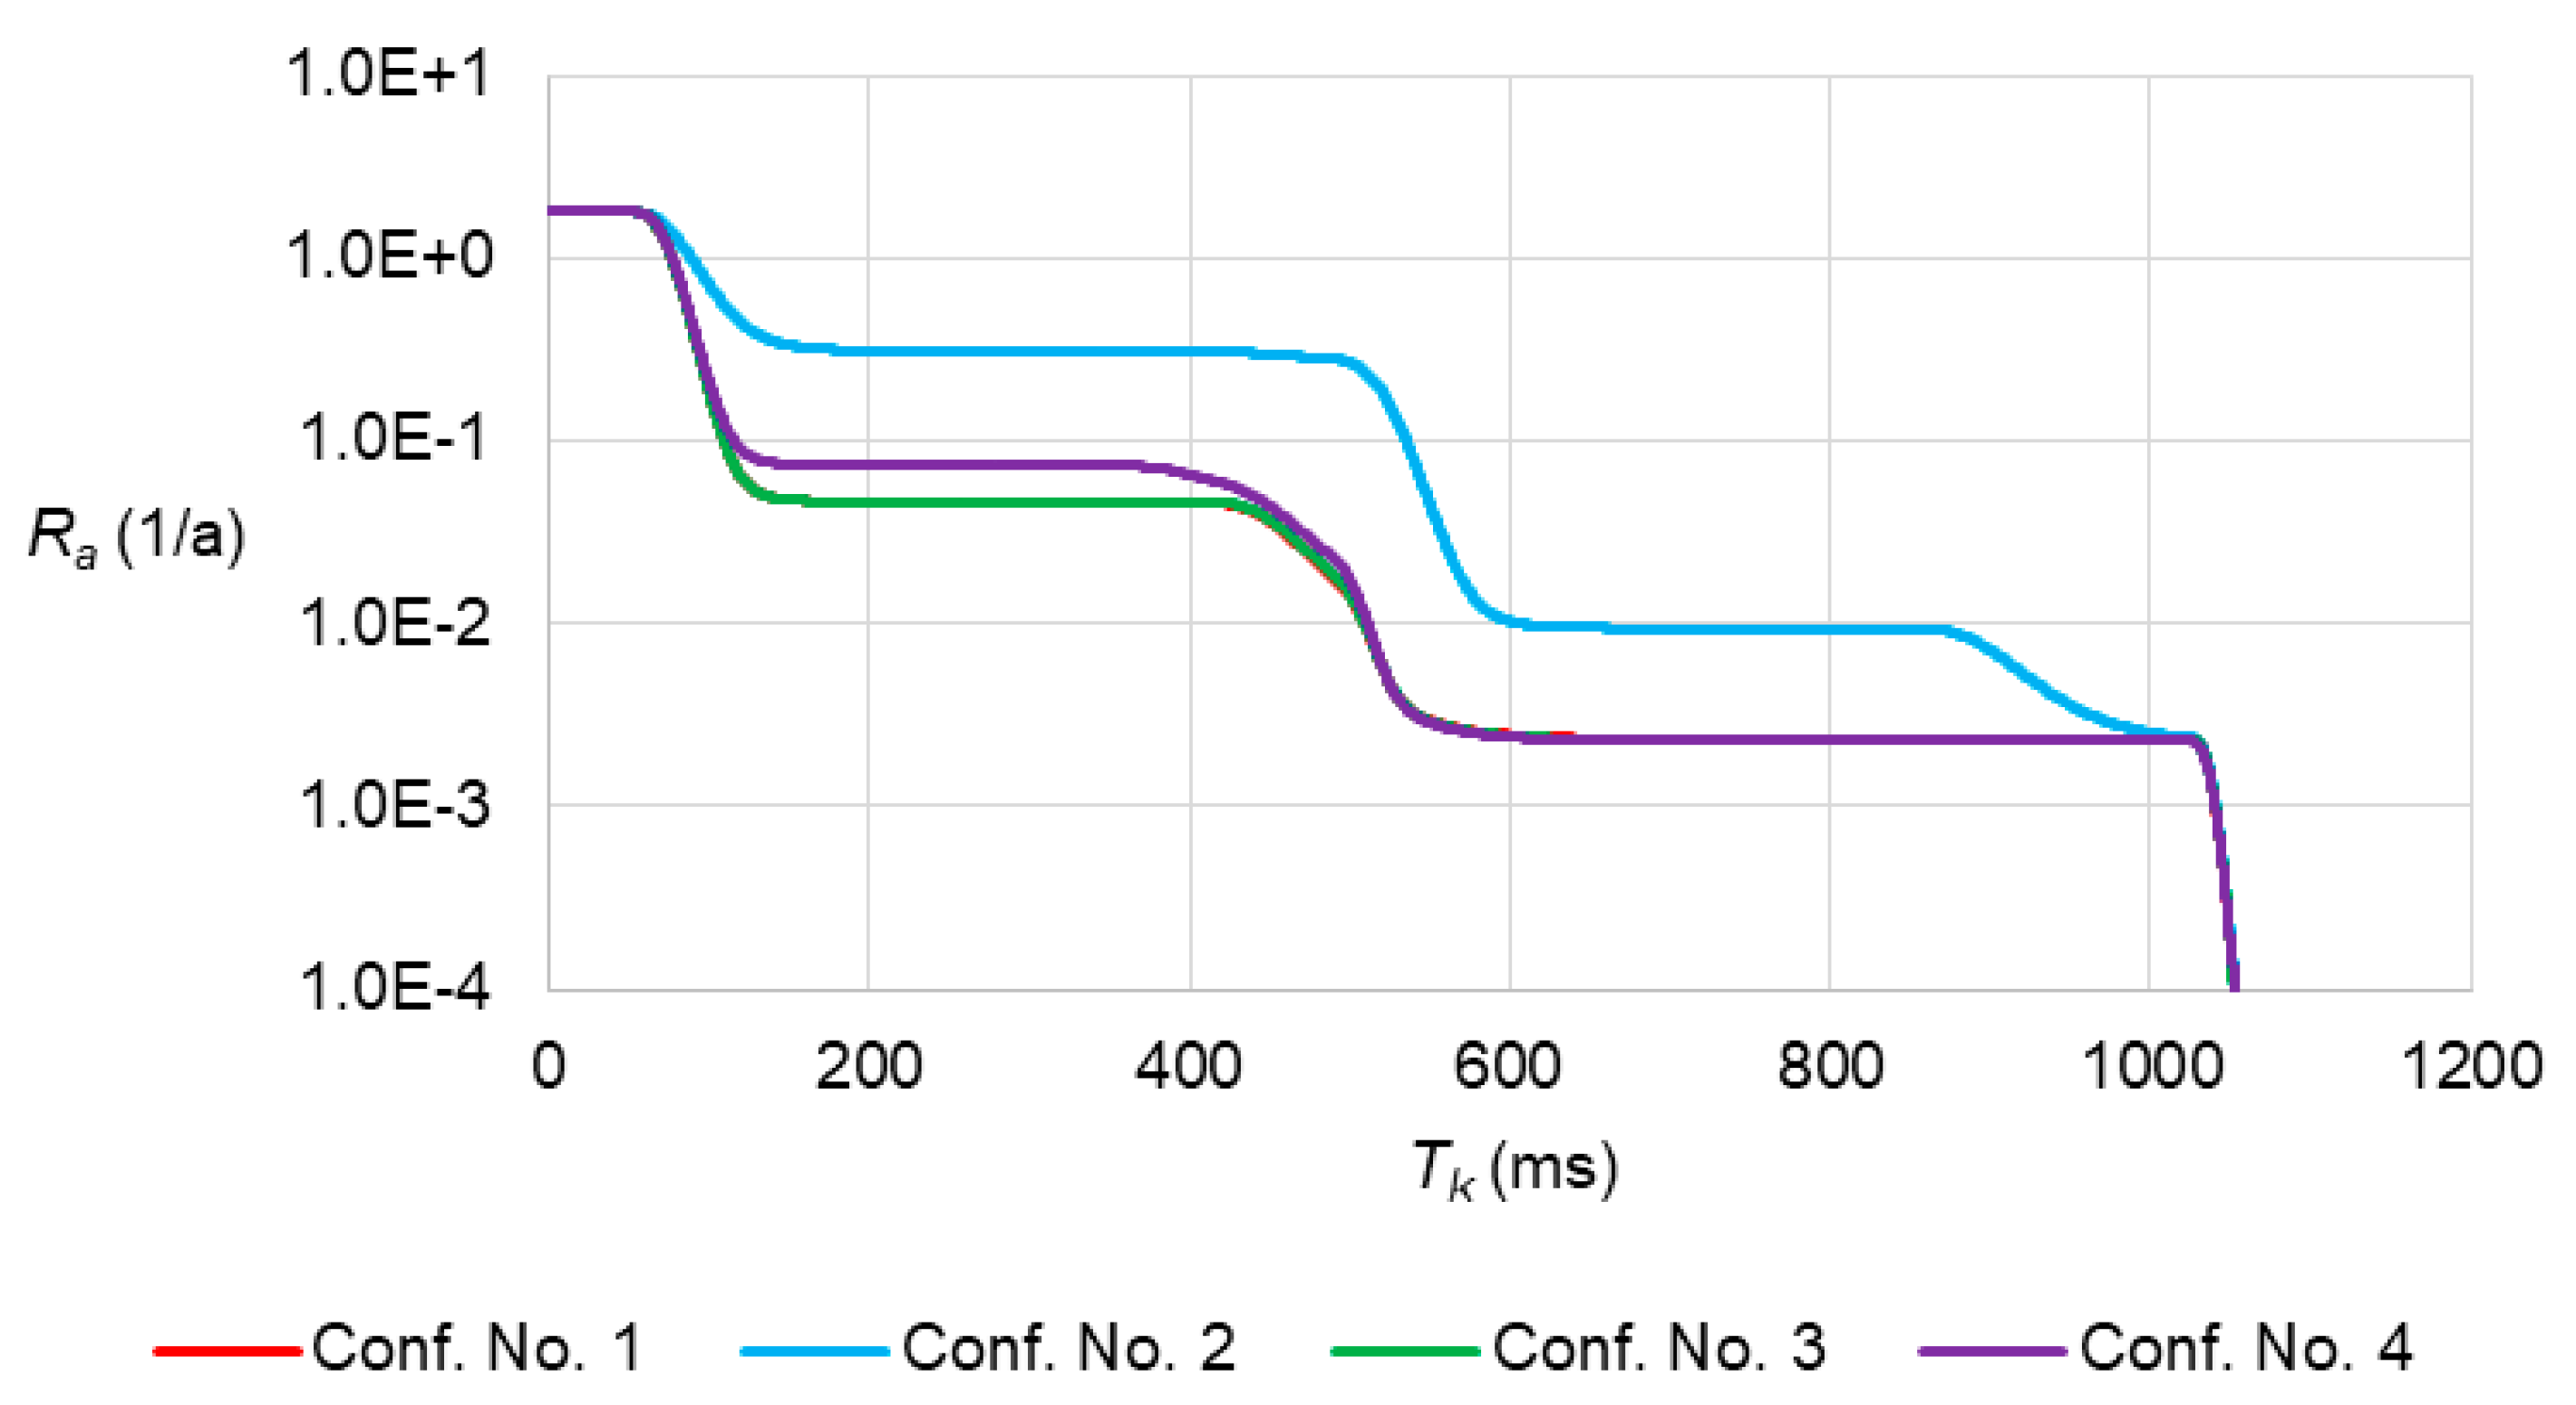
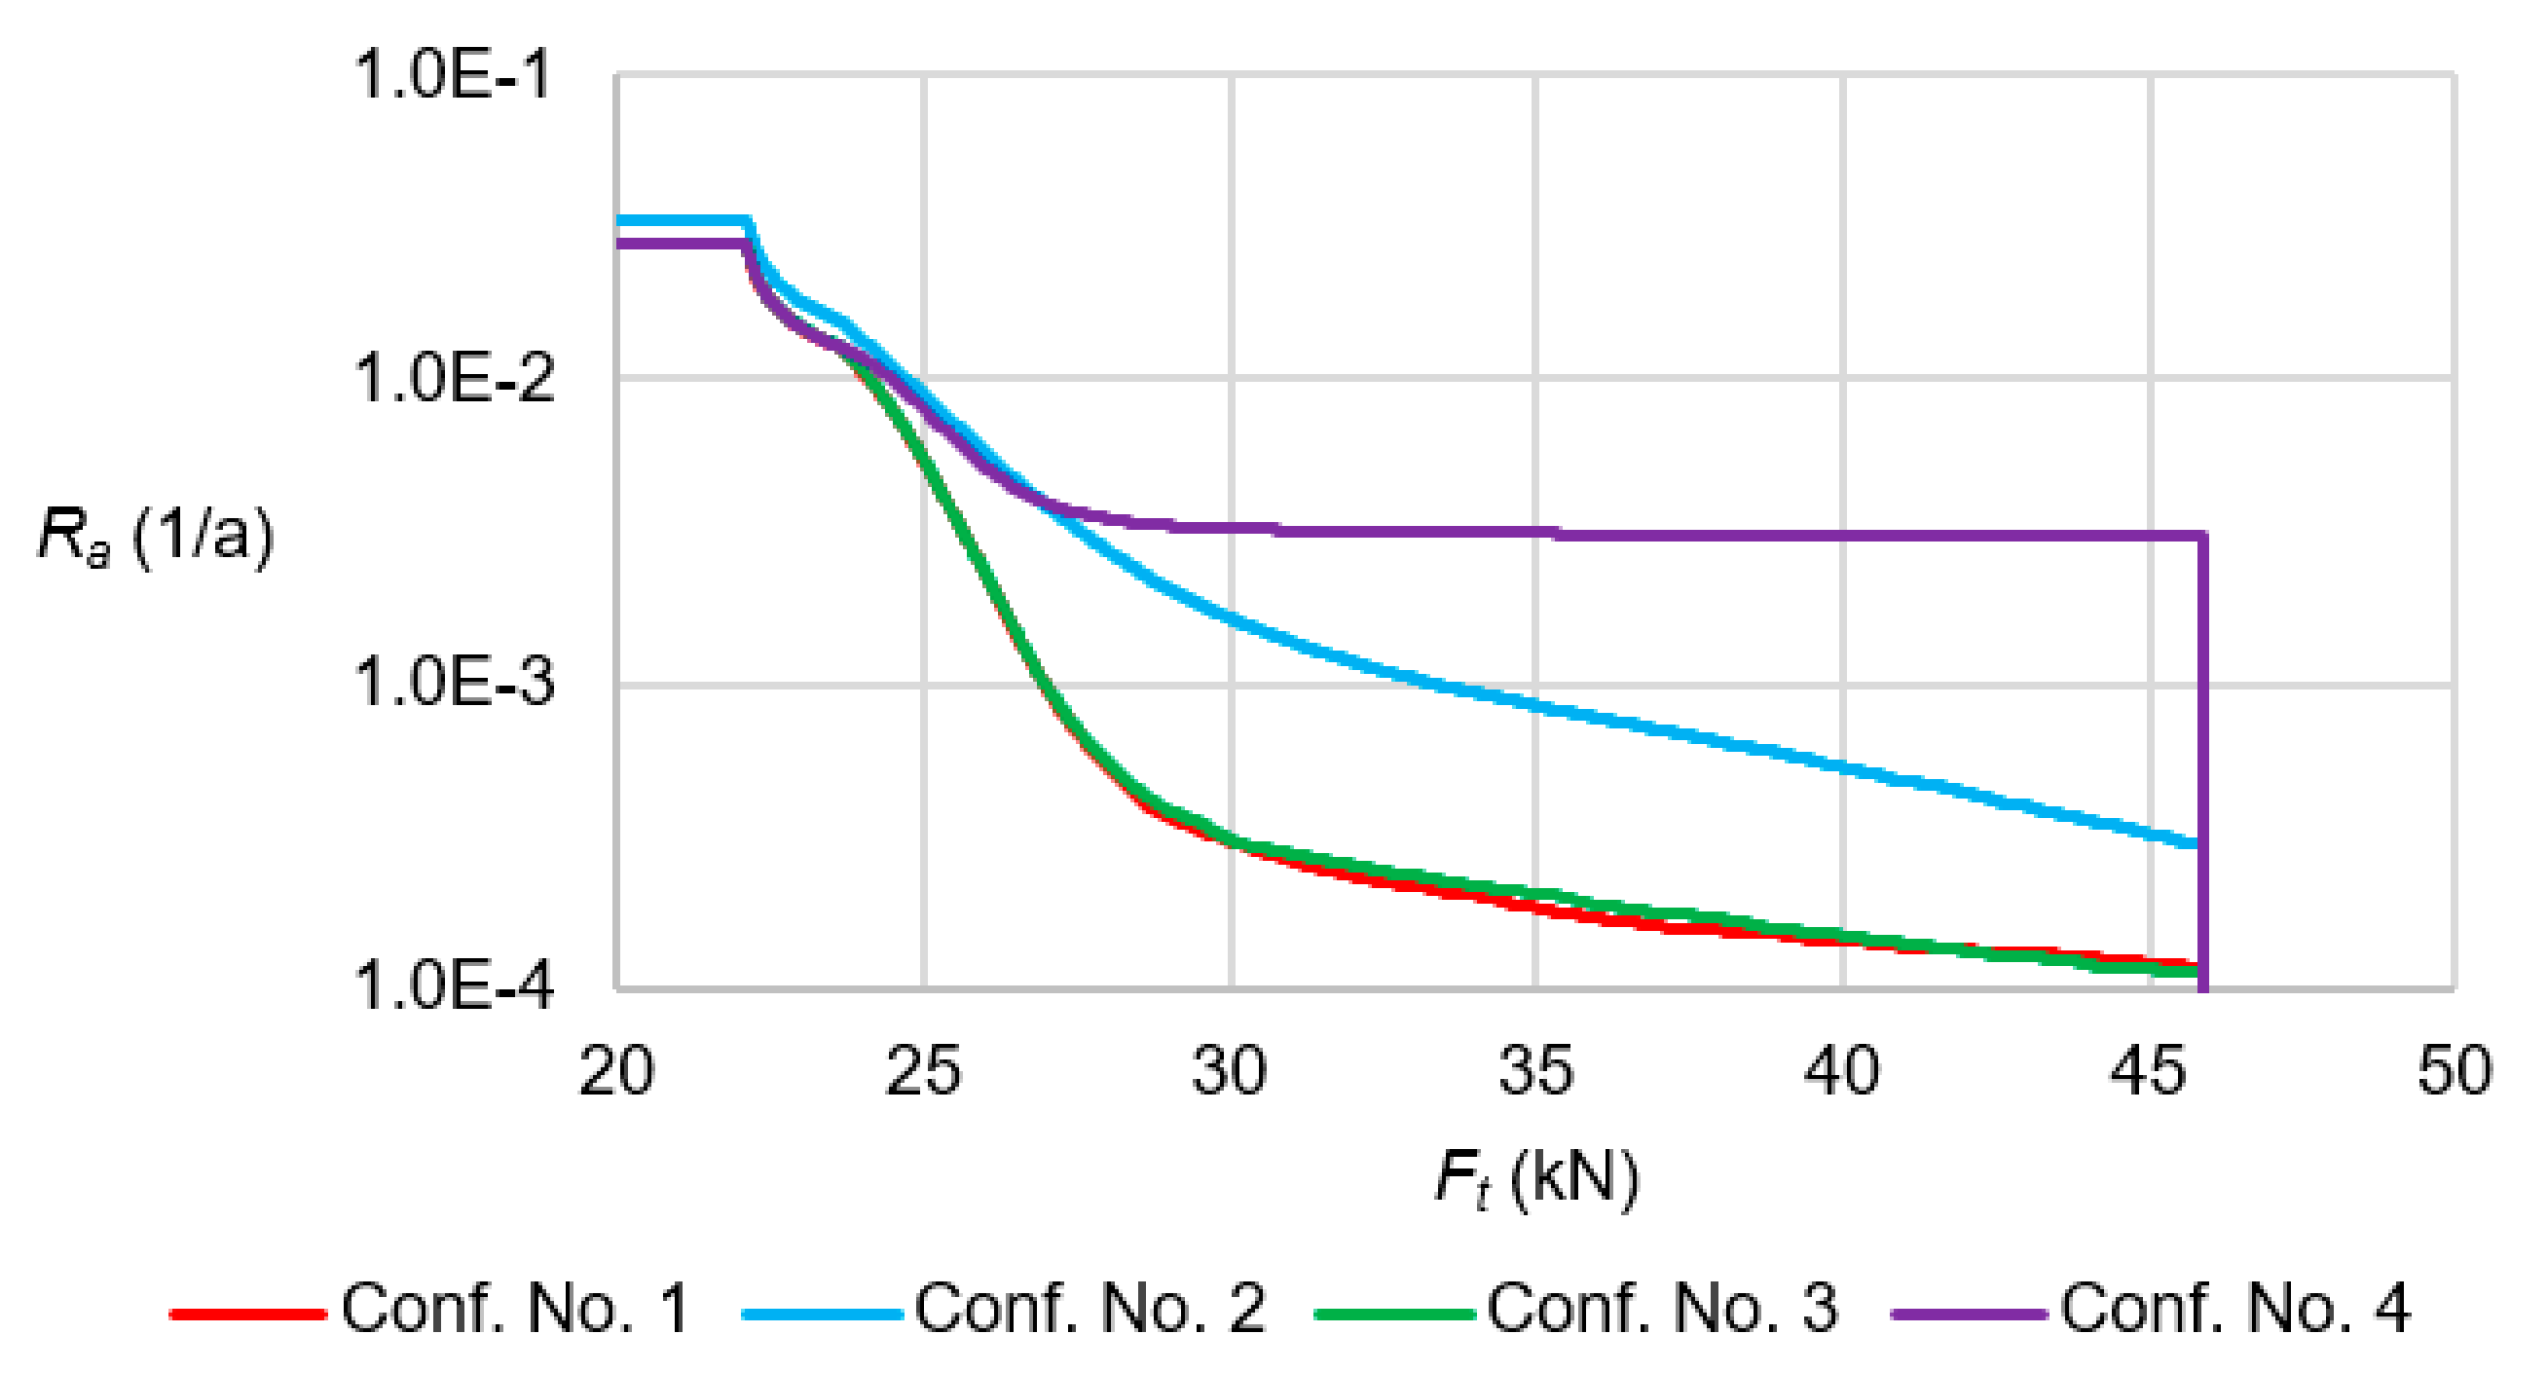
As an example, computations for a defined 56 m long 220 kV span were carried out. In
Figure 12, the curves presenting the annual frequency of exceeding the value of force
Ft for four different PSPA configurations are shown.
Table 3 presents the found values of the considered force
Ft for three risk levels.
The highest impact of the PSPA configuration is observed when the risk of exceedance is 10−3 1/a. The value of Ft found for configurations No. 1 and No. 3 is 27.0 kN. The highest value equal to the maximum one (i.e., 45.9 kN) occurs when there is no bus protection. When AR is missing, Ft equals 33.4 kN.
The PSPA configuration affects the expected annual frequency of exceeding force Ff in the similar way as it is for Ft. However, the probability that force Ff occurs is much lower: Ff occurs only for sufficiently high values of both the current and the short circuit duration.
6. Finding the Short Circuit Duration Value for Dynamic Force Assessment Purposes
6.1. Probablilistic Method
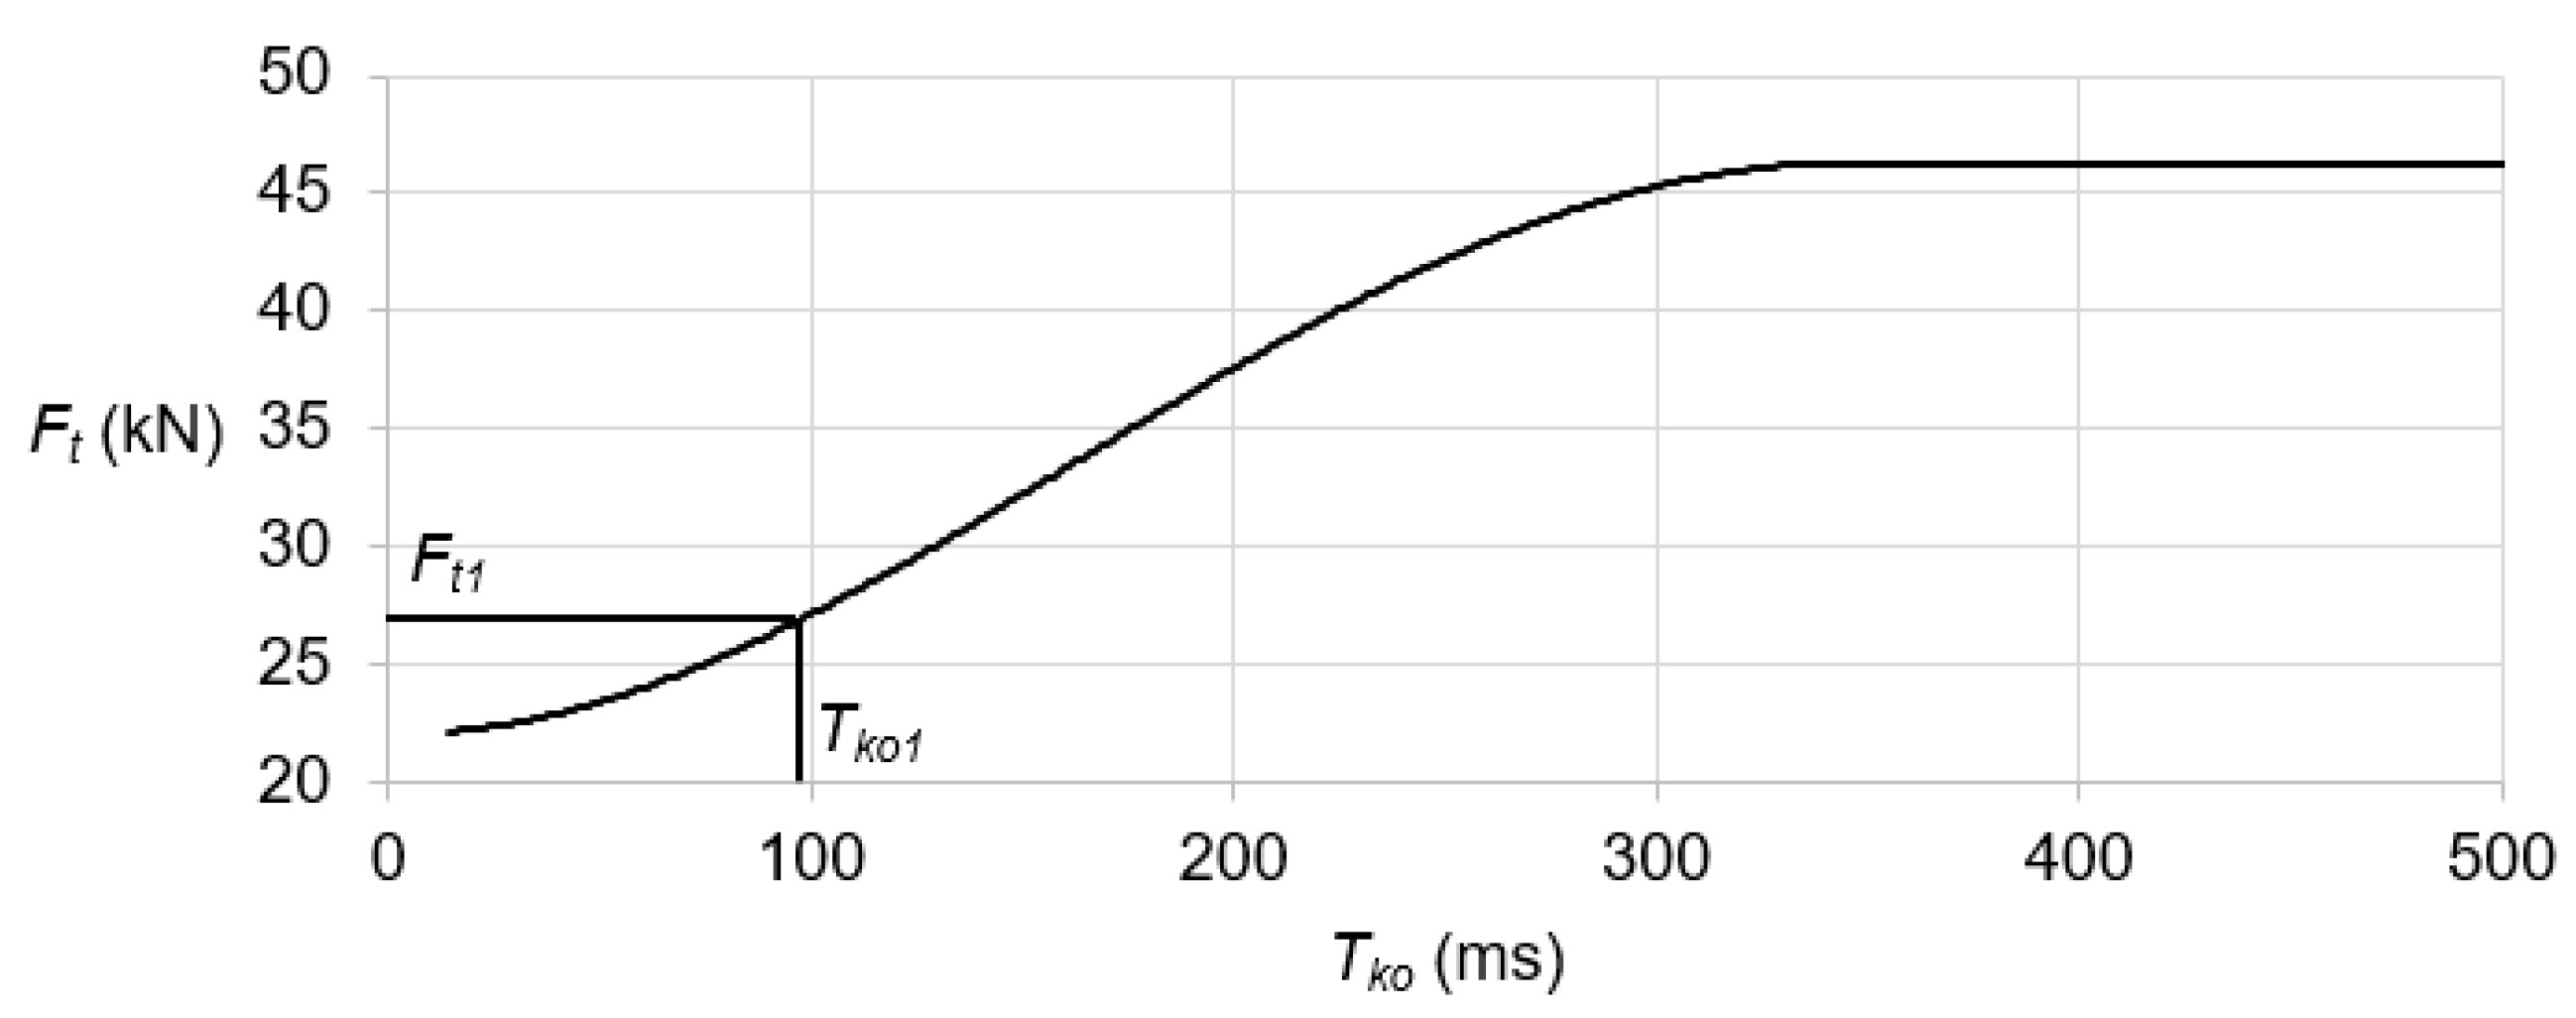
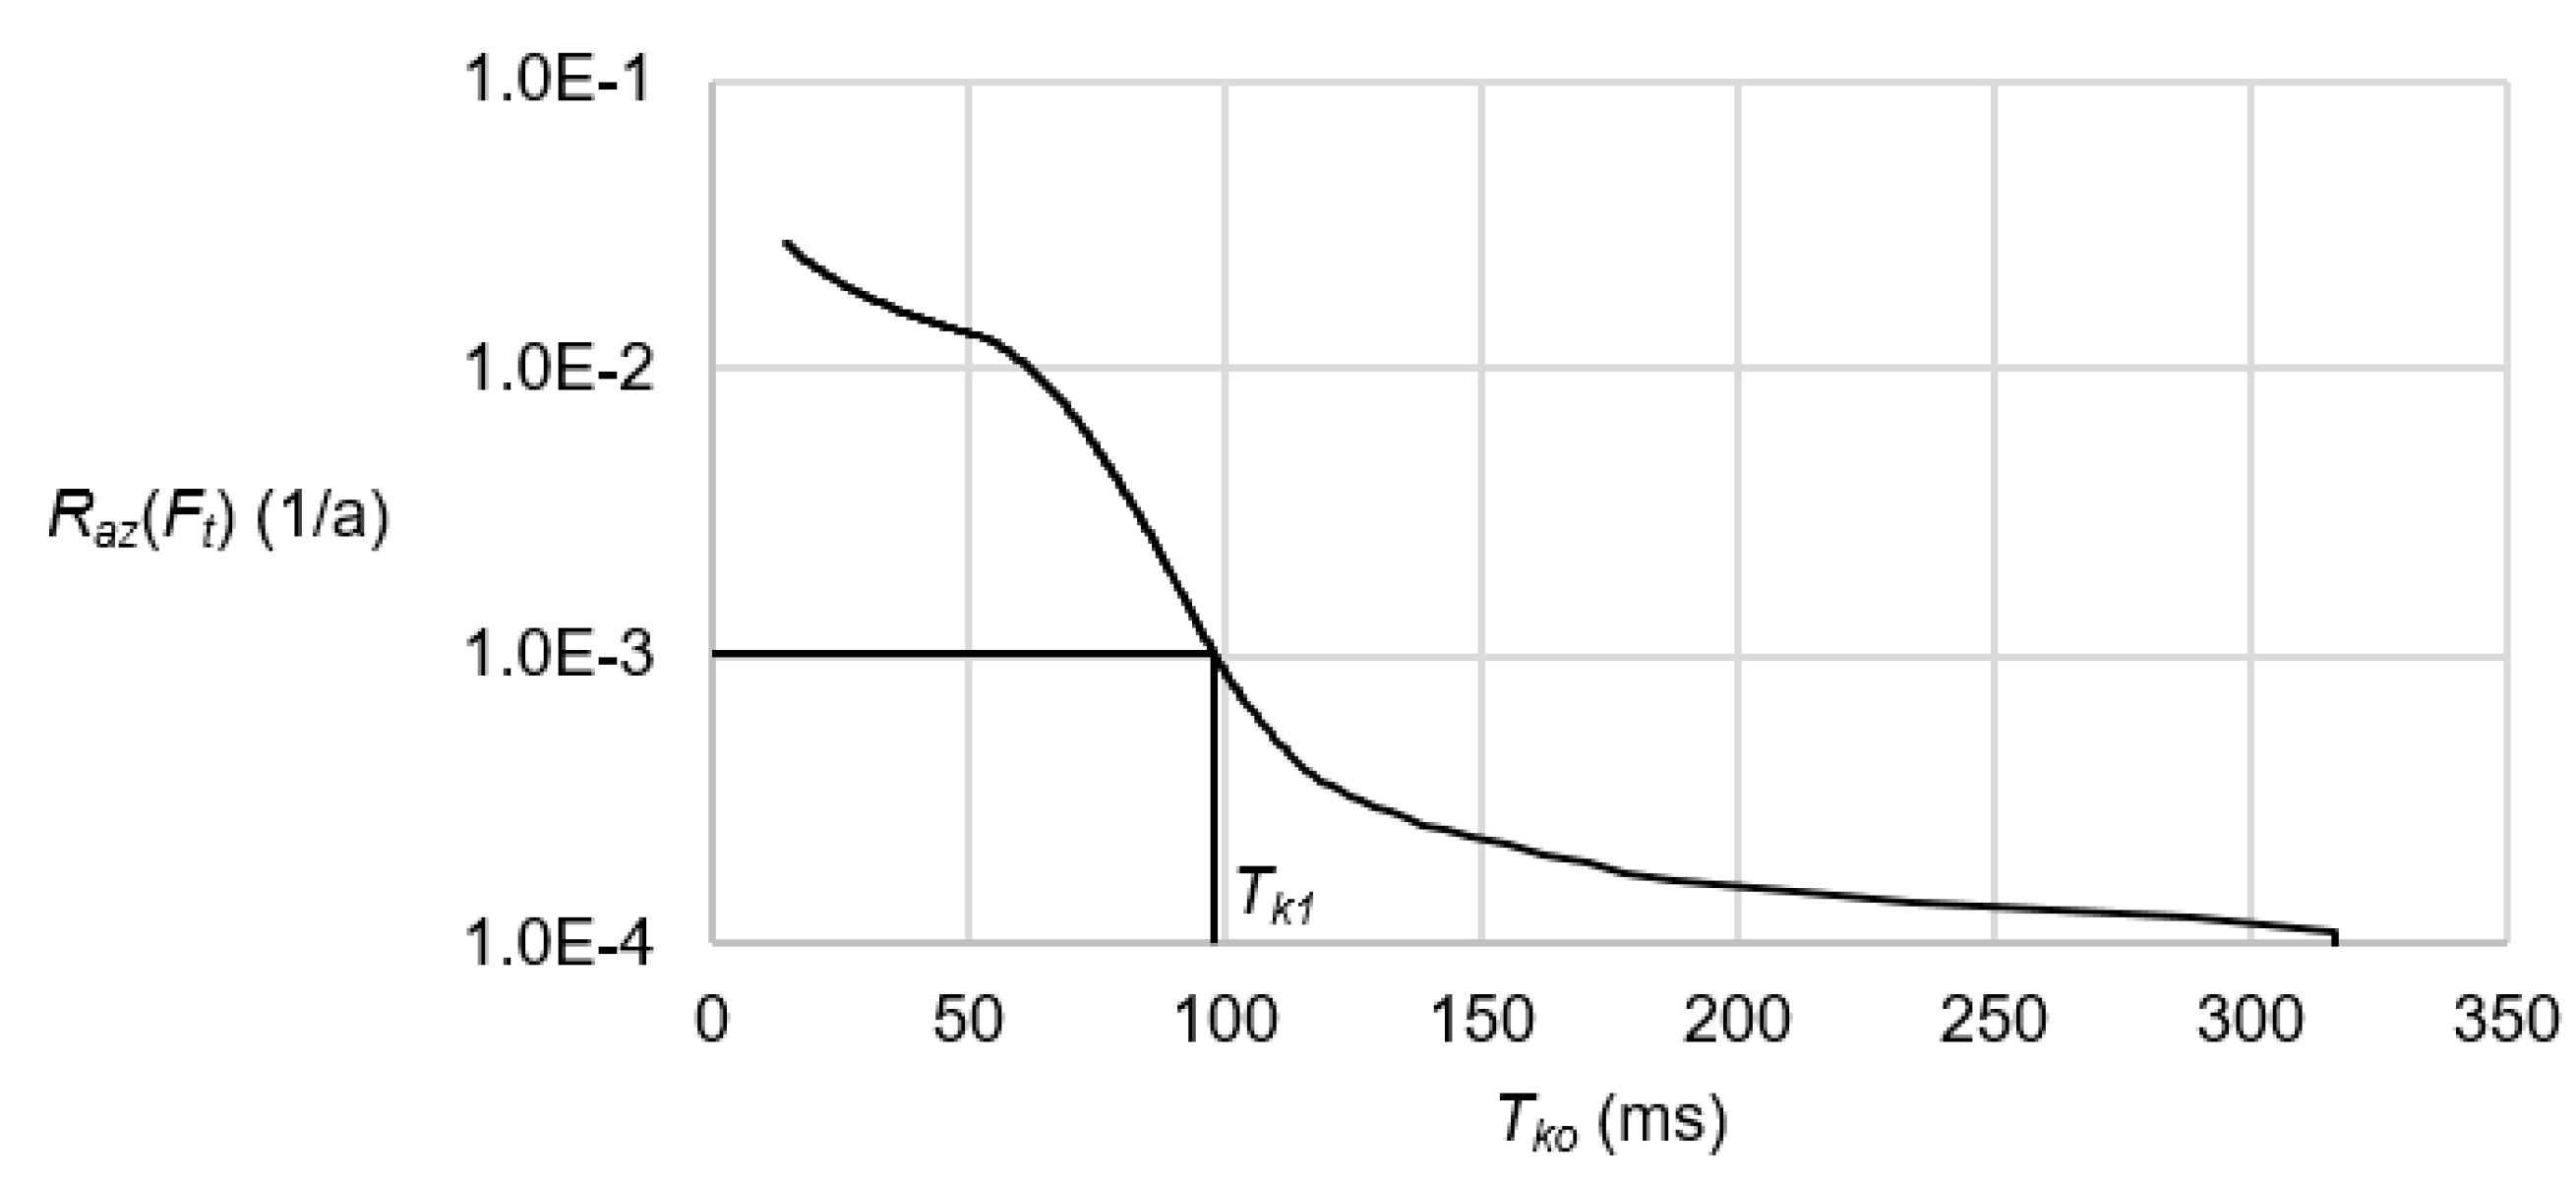
Using the expected annual frequency of exceedances of individual dynamic force values and the dependence of this force value on the duration of short circuit adopted for its calculation
Tko, it is possible to determine the relationship between this time and the risk of exceeding the calculated force. To illustrate, the method of determining the time value
Tko for calculating force
Ft is assumed taking into account a risk of exceedance at 10
−3 1/a. The current value during a three-phase short circuit on the substation bus bars is 40 kA. For the first PSPA configuration, the assumed risk value corresponds to force
Ft equal to 27 kN (
Table 3). This force value is obtained assuming a short circuit duration of 98.4 ms (
Figure 13). In this way, the relationship between the risk of exceeding the calculated value of force
Ft and the value of time
Tko can be determined (
Figure 14). Based on this relationship, it is possible to estimate the value of time
Tko which should be taken when calculating the dynamic force
Ft at different risk levels.
Similarly, values of Tko can be found to determine force Ff.
6.2. Influence of Power System Protection Automatics Configuration on Estimated Short Circuit Duration
Influence of PSPA configuration on estimated short circuit duration values has been presented under short circuit conditions at lookout point A in which much higher values of the short circuit current occur. A list of force
Ft values and the corresponding time
Tko values for four considered PSPA configurations at selected risk levels are reported in
Table 4.
Found values of Tko at risk value equal to 10−3 1/a are 100 ms (configuration No. 1 and No. 3). The lack of bus bar protection results in an important increase (approx. three times) in the time value found. For the considered risk level, the influence of the lack of both, AR and protections duplication, is evident (Tko of 160 ms).
Results of similar analysis carried out under short circuit conditions at lookout point B and reported in
Table 5:
Tko values seem to be much lower due to lower values of the short circuit current (
Figure 11). In configurations 1, 2, and 3, at risk level of 10
−2 1/a, force
Ft does not occur for such current values as lookout point B. A list of force
Ff values and corresponding time values for four considered PSPA configurations and under short circuit conditions at lookout point A is shown in
Table 6.
The impact of PSPA configuration on the results of force
Ff and time
Tko analyses for short circuit conditions in point A is shown in
Table 6. The risk of force
Ff occurrence for PSPA configuration No. 1 and No. 3 is less than 10
−3 1/a. For other configurations, time
Tko values are 270 ms (for configuration No. 3) and 425 ms (for configuration No. 4).
6.3. Influence of Maximum Value of Short Circuit Current
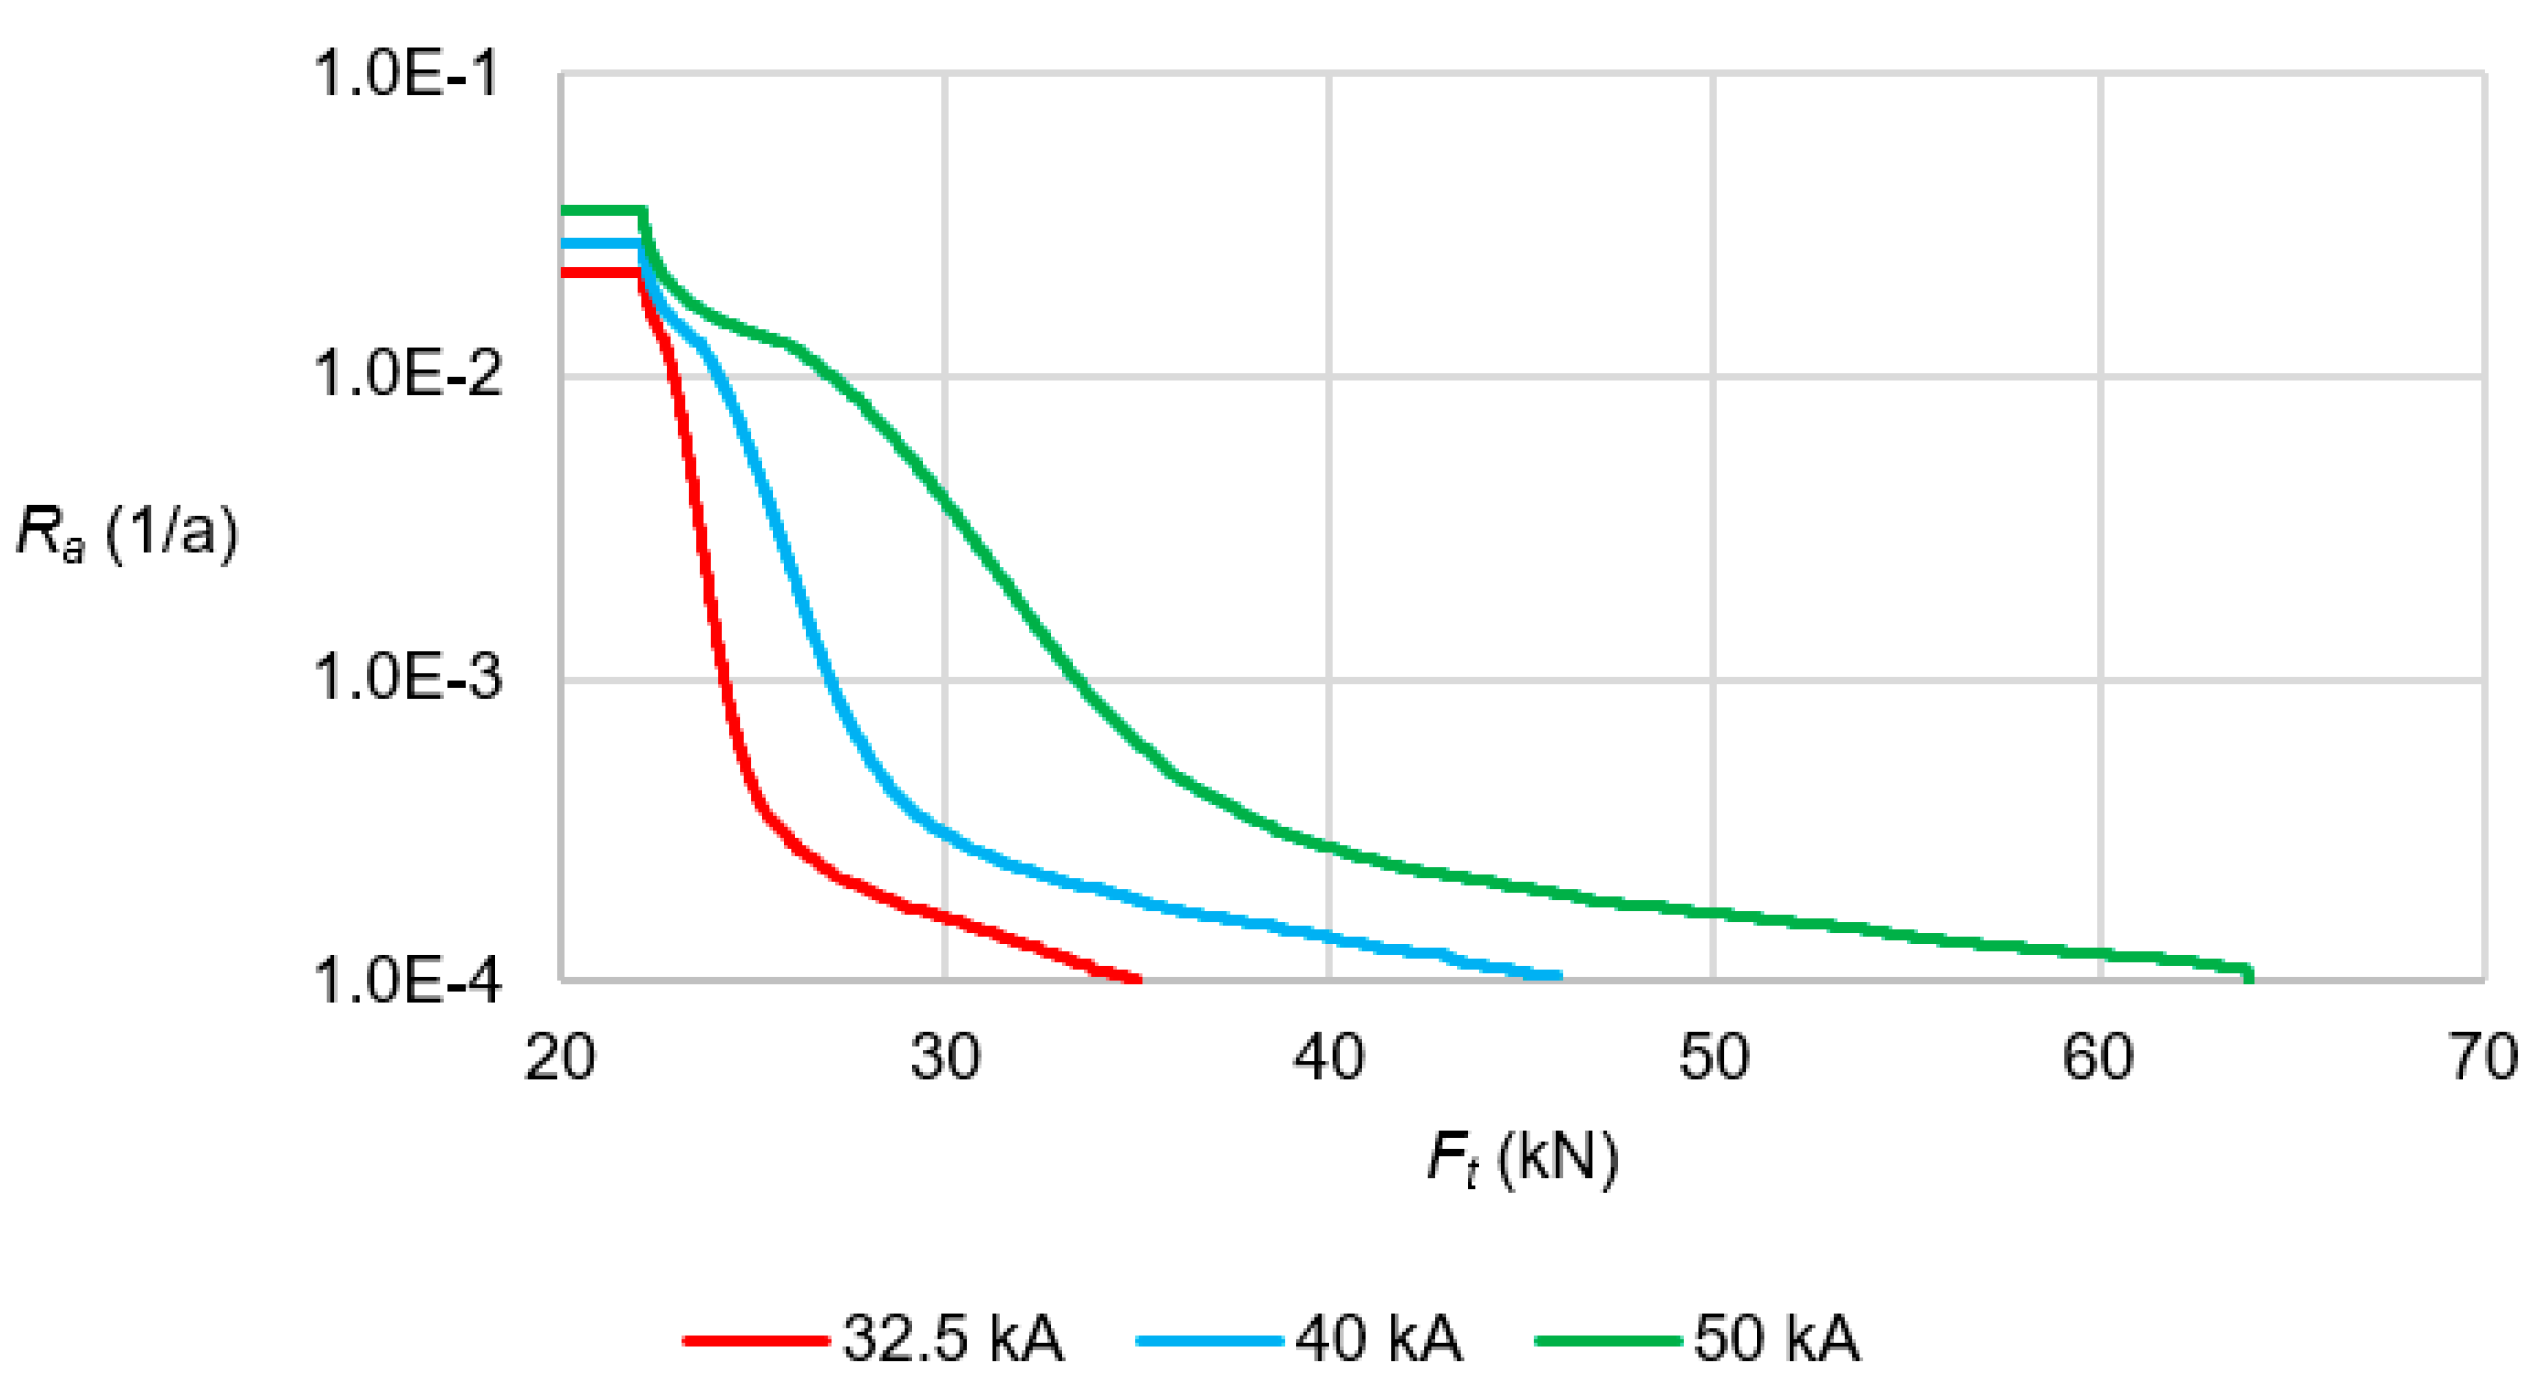
In
Figure 15, the annual frequency of exceeding force
Ft value for three current values during a three-phase fault in the bus is presented. In
Figure 16, the risk of exceeding the found force versus time
Tko assumed for its calculation is plotted at the same three current values. Calculations were carried out for short circuit conditions at point A with PSPA configuration No. 1.
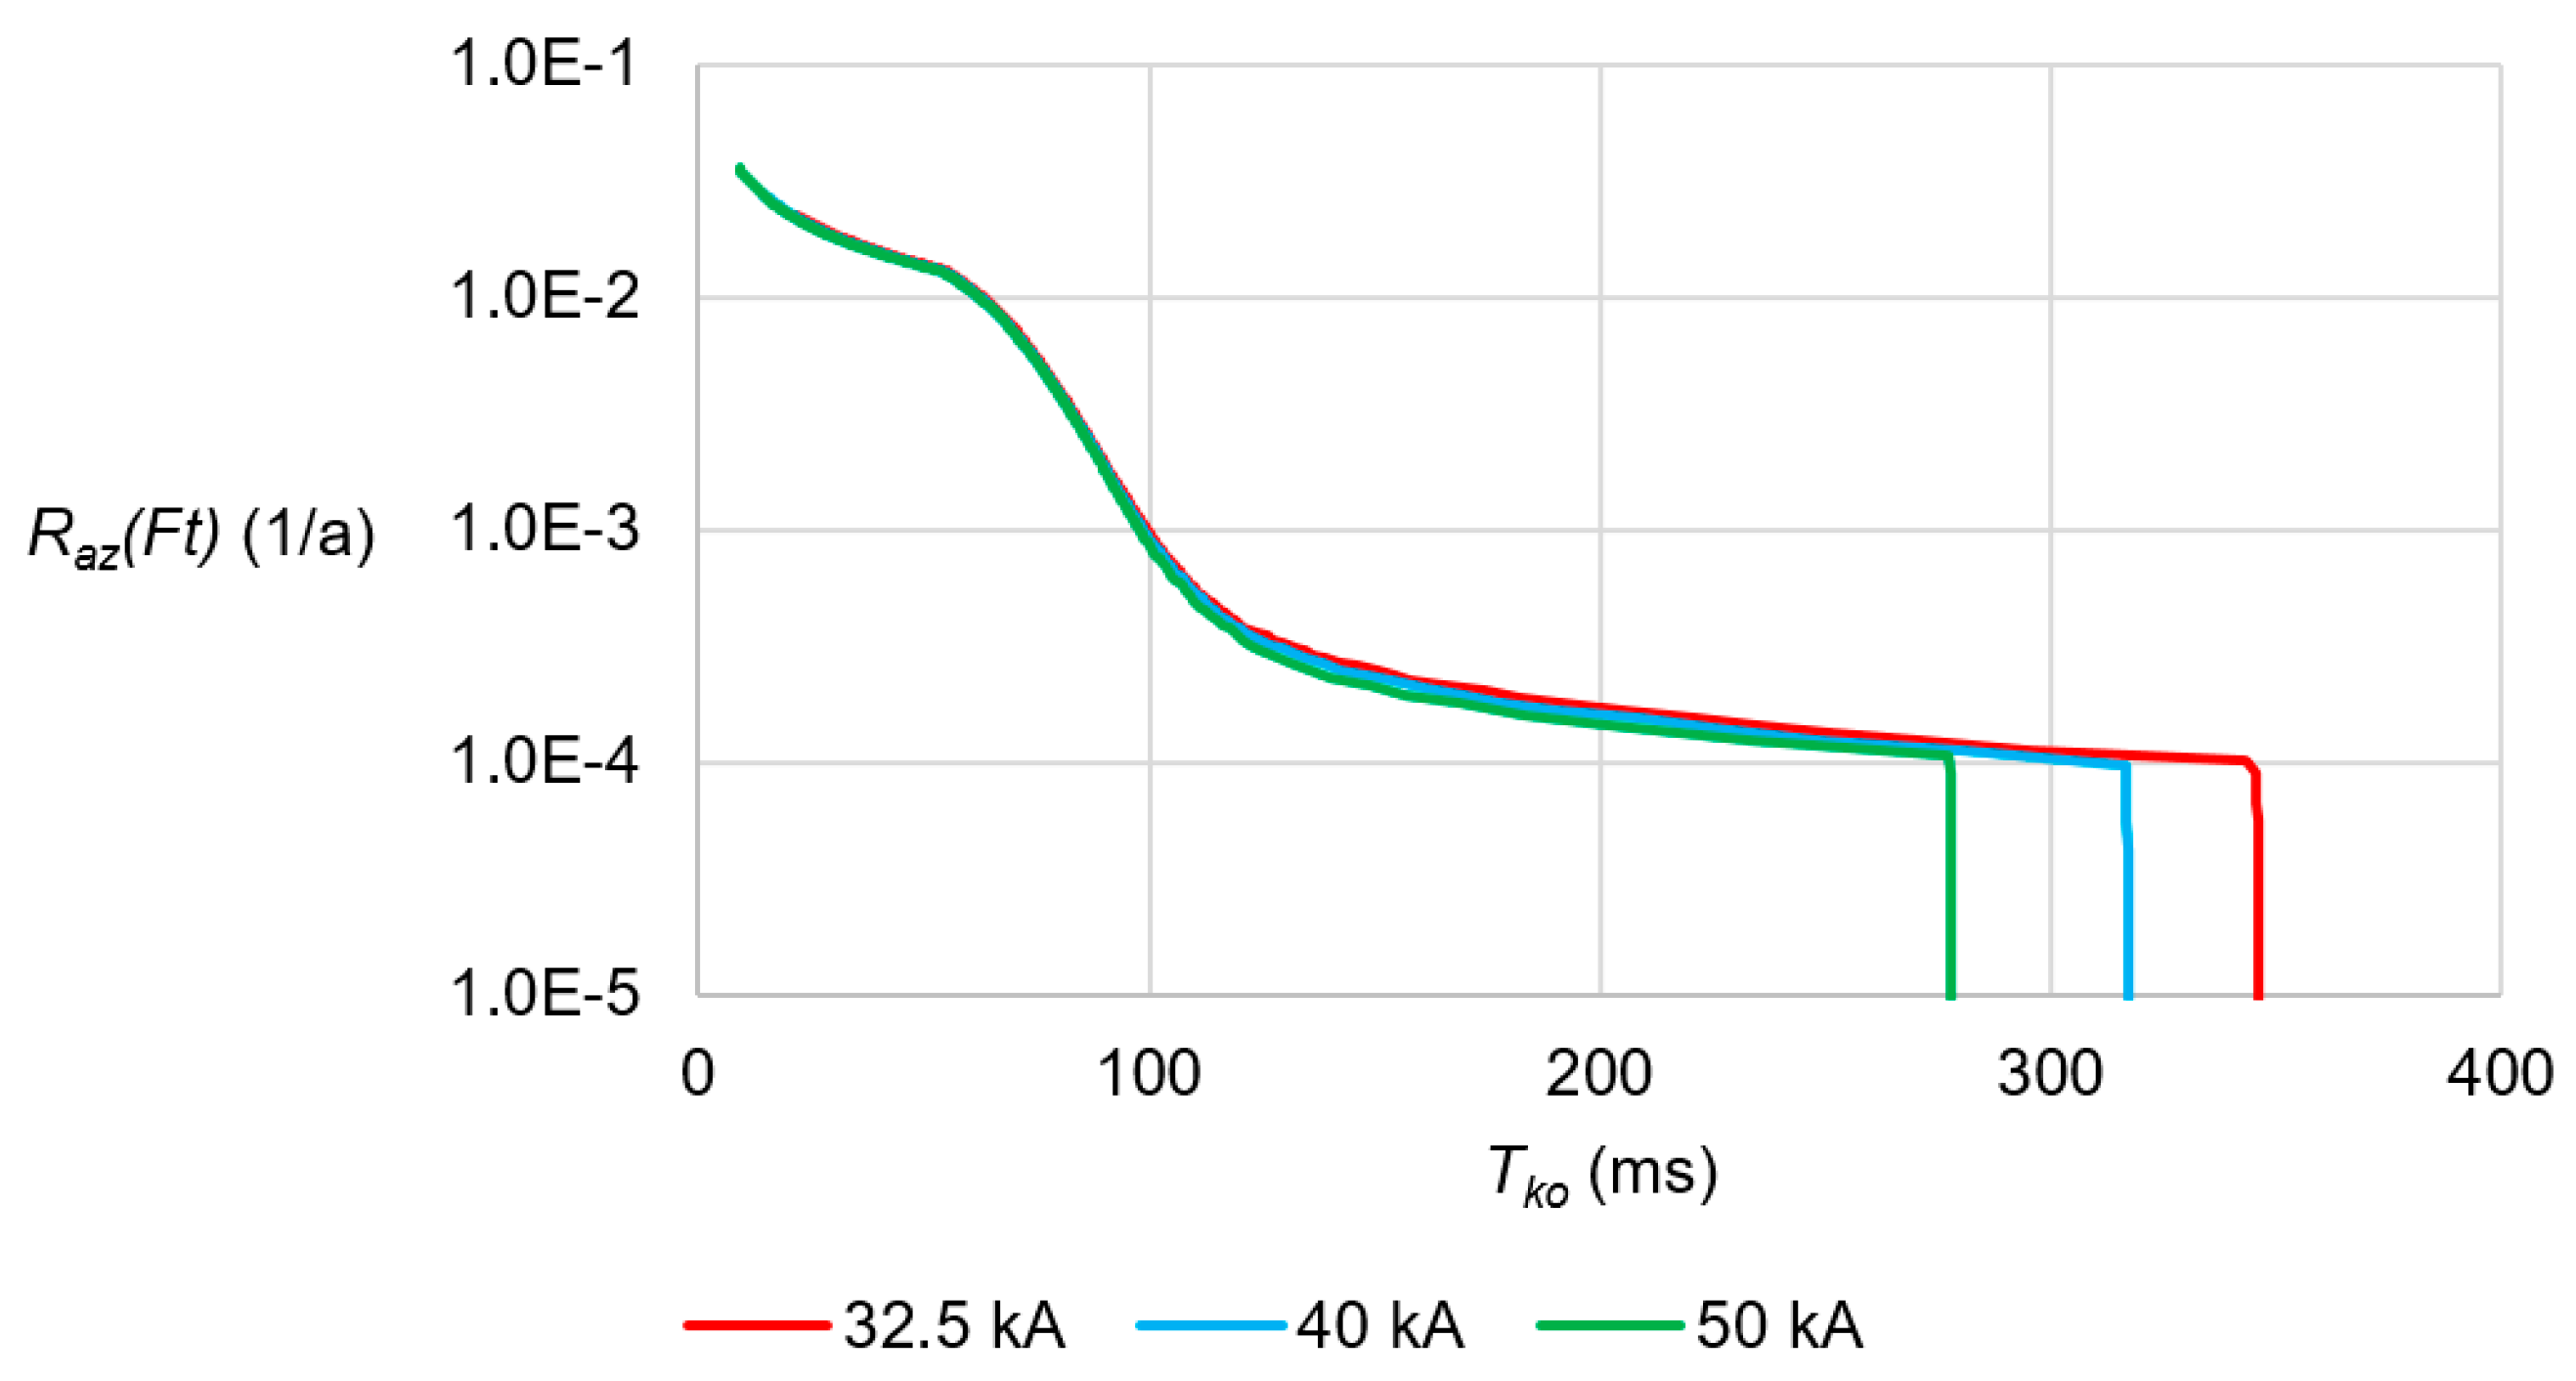
For risk values of 10−2 1/a and 10−3 1/a, the short circuit current value strongly affects the maximum value of force Ft, and does not affect the found value of Tko. However, for lower risk value (10−4 1/a), the found values of Tko differ significantly and equal 280 and 340 ms for currents of 50 and 32.5 kA, respectively.
For a full configuration of protections (configuration No. 1), the occurrence frequency of force
Ff is below 10
−3 1/a (
Table 6). To keep the frequency of exceeding
Ff at 10
−4 1/a, time
Tko taken for its calculation should be close to 380 ms for the three considered short circuit currents (32.5, 40, and 50 kA) in the bus.
6.4. Influence of Failure Rate of Protections and Circuit-Breakers
Results of simulation studies carried out for an assumed failure rate of protections and circuit-breakers equal to
NbZ =
Nbw =
Nb = 0.03 were compared to those for failure rate two times lower and two times higher. A list of force
Ft values and corresponding
Tko values for three different failure rate values is shown in
Table 7.
Thus, the influence of changes in protection and circuit-breaker failure rates within assumed limits on the found Tko values at the assumed risk equal to 10−2 1/a is negligible. Influence is noticeable at risk equal to 10−3 1/a, and evident at 10−4 1/a.
6.5. Influence of Span Parameters
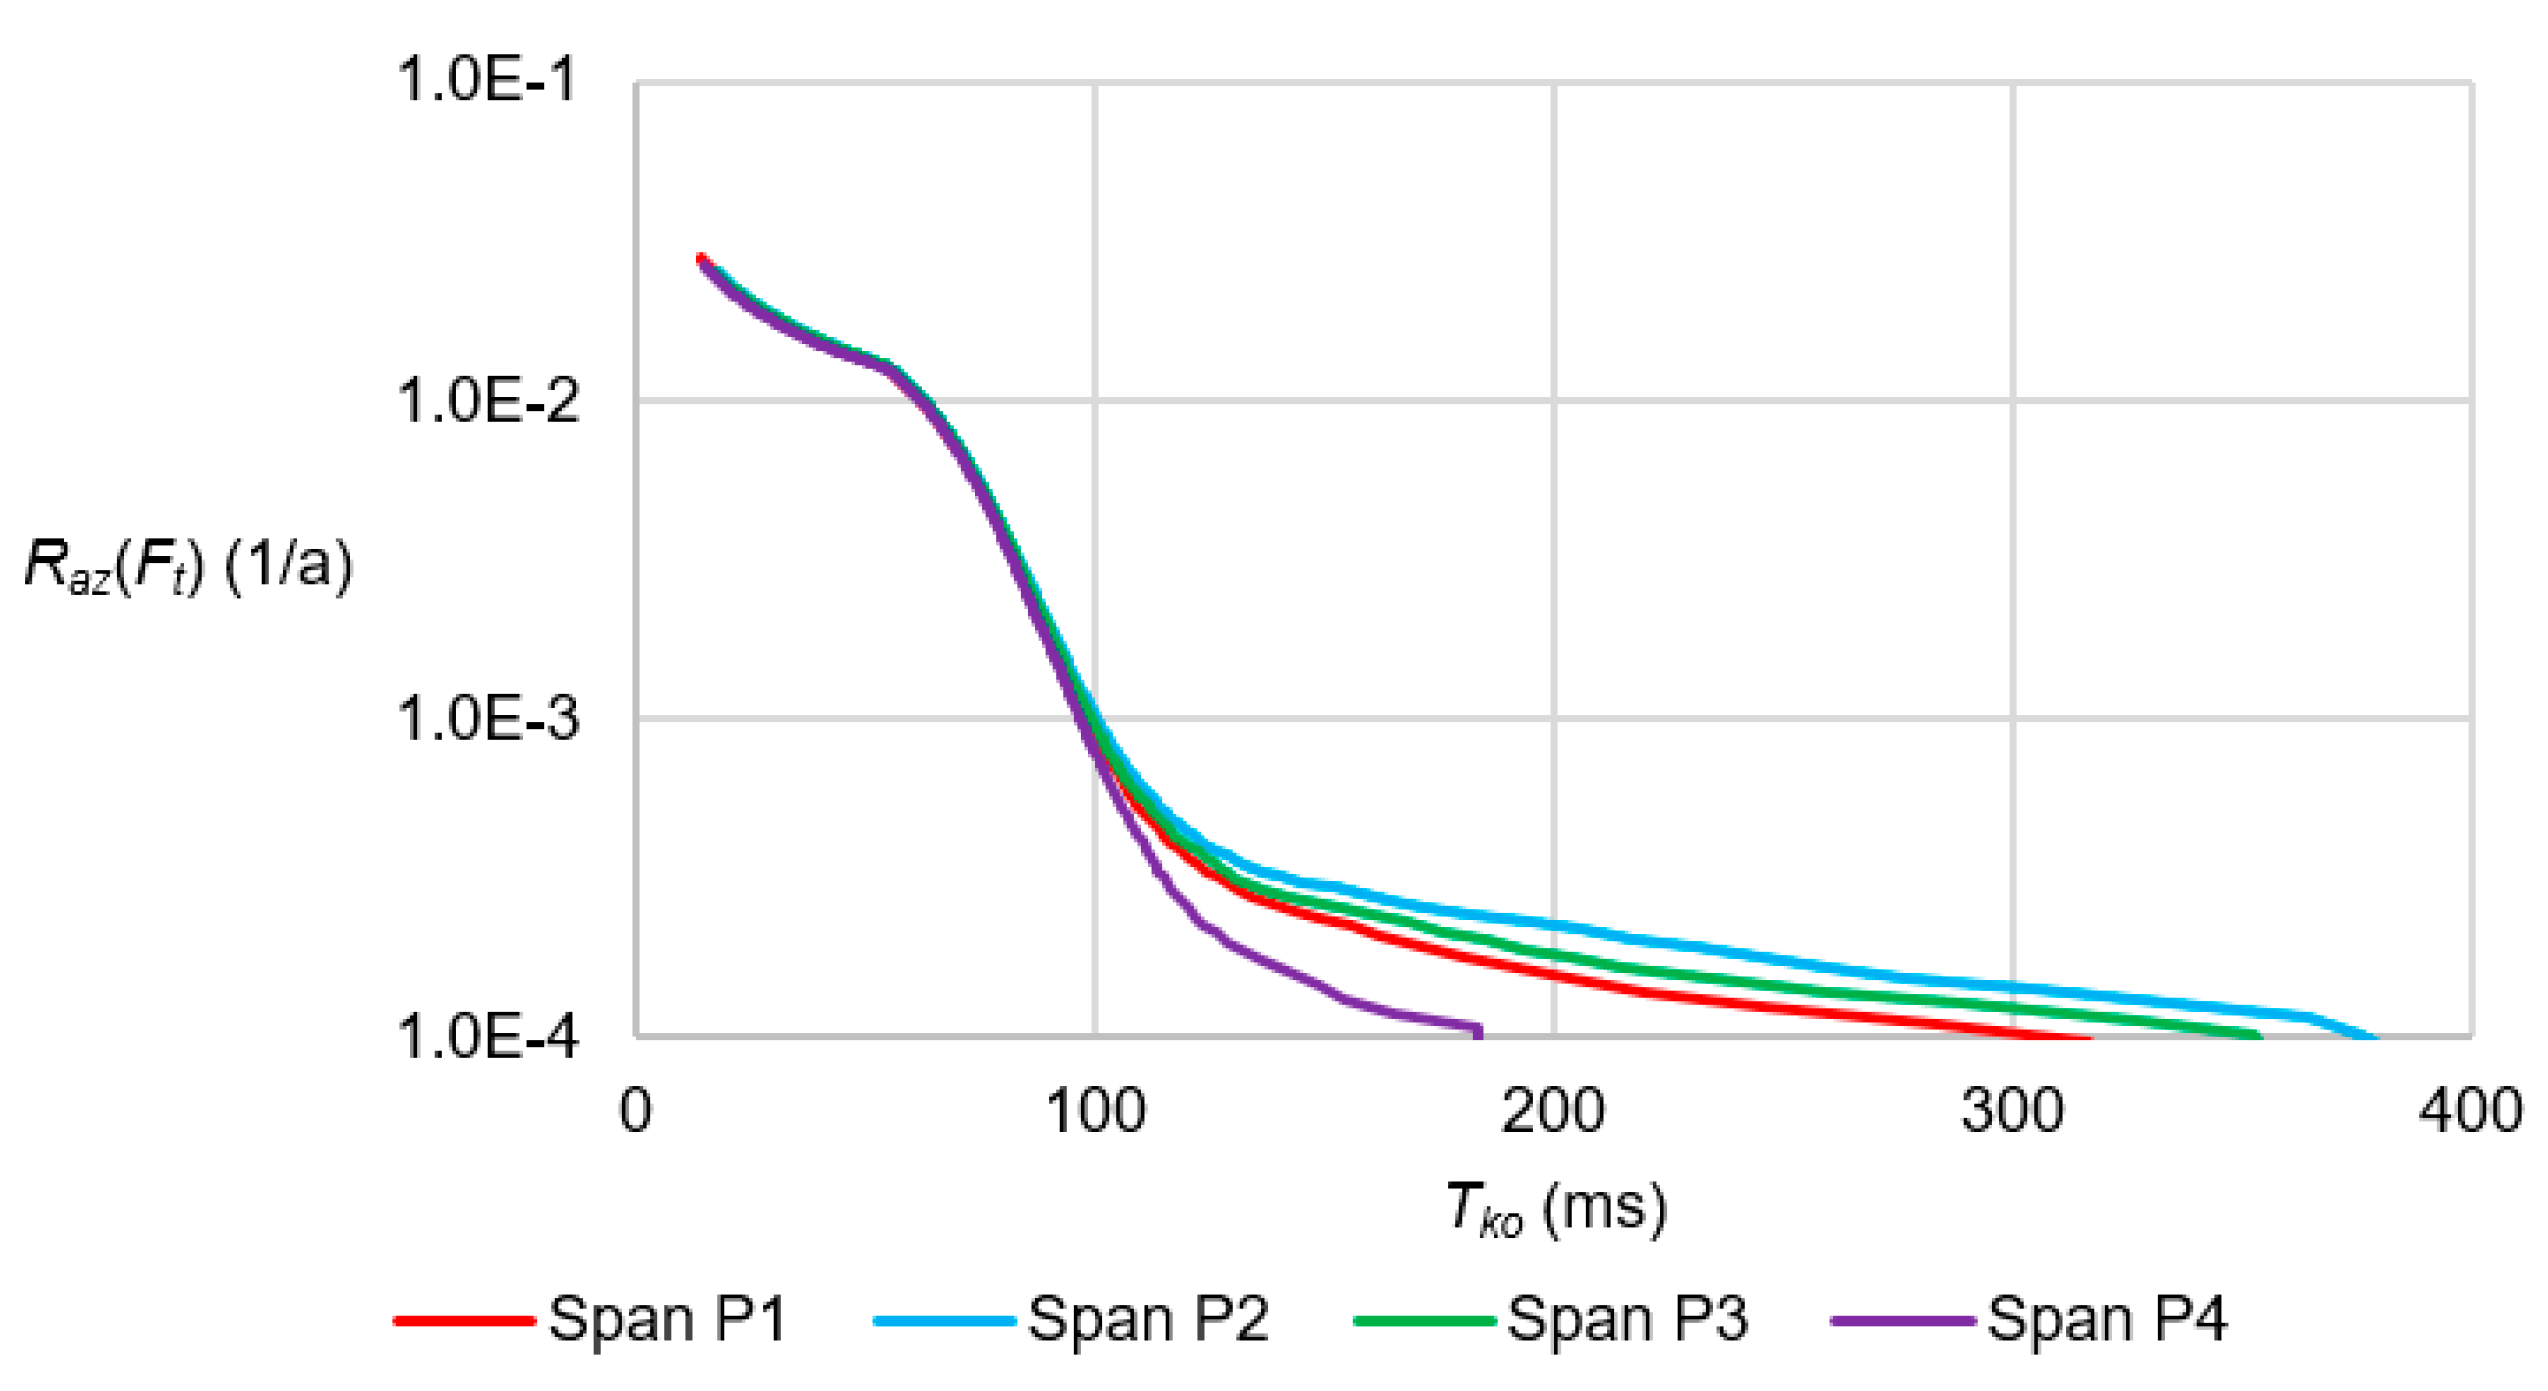
Calculations for four spans with parameters listed in
Table 8 were carried out. In
Figure 17, curves presenting the risk of exceeding force
Ft versus
Tko values taken for calculation are shown for four considered spans.
For risk levels of 10−3 1/a or higher, time Tko can be regarded as nearly constant in values (near 100 ms) and independent from the considered span parameters. However, at lower risk of exceeding the values, Tko values depend on span parameters, and are evidently lower for the shorter span P4.
To keep the frequency of exceeding the found force Ff at 10−4 1/a, time Tko for the full configuration of protections taken for its calculations should be 400 ms for spans P1, P2, P3. For the shorter span P4, force Ff does not occur.
7. Conclusions
The paper presents the method of determining short circuit duration in HV and EHV networks for the purposes of dynamic forces analysis in electric distribution substations. Expected annual frequency of exceeding the determined force was proposed as a criterion for selecting Tko fault duration. Due to the performed investigations, the influence of PSPA equipment configuration, maximum short circuit current values on the buses, protection and circuit-breaker failure rates, and span parameters on the examined values of time Tko, was established under defined fault conditions in the 220 kV substation.
In works approaching the problem of risk allowable in choosing devices for specific fault conditions, the values of 10
−2 1/a and 10
−3 1/a are indicated [
19]. Our studies have shown that for risk values mentioned above, the short circuit duration value found to calculate force
Ft is mostly affected by PSPA configuration, whereas the influence of maximum short circuit current on the bus, failure rate of protections, and circuit-breakers, as well as span parameters is negligible.
When discussing dynamic forces Ft for a 220 kV substation assuming the risk level at 10−3 1/a, the following values of Tko are to be taken:
100 ms—full PSPA configuration in substation and no protection in the coupler bay,
160 ms—no AR working, no duplication of protections,
320 ms—no bus protection.
A lack of disconnecting protection in the bus connector bay does not affect the calculated short circuit duration value. Results of calculations carried out for risk levels lower than 10−3 1/a also show the influence of other factors on the estimated Tko values.
In EHV substations, force Ff values are generally higher than those of force Ft. However, the probability that Ff appears is low, i.e., less than 10−3 1/a at the full PSPA configuration in the substation. The Tko values found to calculate force Ff under low risk conditions are higher than those used to calculate force Ft.
Due to the adopted assumptions, particularly the omission of short circuit current flow within a single span or constant temperature of conductors before the fault, the calculated expected risk value can be overestimated and true risk can be lower.
Further research will focus on analyses of higher short circuit currents and 400 kV substations. The studies will assess the usefulness of the relevant relationships and obtained results for the abovementioned conditions.


