Article

Fabrication and Photovoltaic Properties of Organic Solar Cell Based on Zinc Phthalocyanine

1
Department of Physics, International Islamic University Islamabad, Islamabad 44000, Pakistan
2
Department of Physics, Abdul Wali Khan University, Mardan 23200, Pakistan
3
Department of Electrical Engineering, Faculty of Engineering, University of Malaya, Kuala Lumpur 50603, Malaysia
4
Department of Electronics, Jinnah College for Women, University of Peshawar, Peshawar 25120, Pakistan
5
Department of Physics, Karakoram International University, Gilgit Baltistan 15100, Pakistan
6
Department of Mechanical Engineering, Faculty of Engineering, University of Malaya, Kuala Lumpur 50603, Malaysia
7
Department of Electric, Electronics and System Engineering, Faculty of Engineering and Built Environment, Universiti Kebangsaan Malaysia, Bangi 43600, Malaysia
*
Author to whom correspondence should be addressed.
Energies 2020, 13(4), 962; https://doi.org/10.3390/en13040962
Submission received: 16 September 2019 / Revised: 17 December 2019 / Accepted: 19 December 2019 / Published: 21 February 2020

Abstract

:
Herein, we report thin films’ characterizations and photovoltaic properties of an organic semiconductor zinc phthalocyanine (ZnPc). To study the former, a 100 nm thick film of ZnPc is thermally deposited on quartz glass by using vacuum thermal evaporator at 1.5 × 10⁻⁶ mbar. Surface features of the ZnPc film are studied by using scanning electron microscope (SEM) with in situ energy dispersive x-ray spectroscopy (EDS) analysis and atomic force microscope (AFM) which reveal uniform film growth, grain sizes and shapes with slight random distribution of the grains. Ultraviolet-visible (UV-vis) and Fourier Transform Infrared (FTIR) spectroscopies are carried out of the ZnPc thin films to measure its optical bandgap (1.55 eV and 3.08 eV) as well as to study chemical composition and bond-dynamics. To explore photovoltaic properties of ZnPc, an Ag/ZnPc/PEDOT:PSS/ITO cell is fabricated by spin coating a 20 nm thick film of hole transport layer (HTL)—poly-(3,4-ethylenedioxythiophene) poly(styrene sulfonic acid) (PEDOT:PSS)—on indium tin oxide (ITO) substrate followed by thermal evaporation of a 100 nm layer of ZnPc and 50 nm silver (Ag) electrode. Current-voltage (I-V) properties of the fabricated device are measured in dark as well as under illumination at standard testing conditions (STC), i.e., 300 K, 100 mW/cm2 and 1.5 AM global by using solar simulator. The key device parameters such as ideality factor (n), barrier height ( ϕ b ), junction/interfacial resistance (Rs) and forward current rectification of the device are measured in the dark which exhibit the formation of depletion region. The Ag/ZnPc/PEDOT:PSS/ITO device demonstrates good photovoltaic characteristics by offering 0.48 fill factor (FF) and 1.28 ± 0.05% power conversion efficiency (PCE), η.

1. Introduction

Recently, application of organic semiconductors in photovoltaic devices has acquired new impetus due to the growing interest in solar energy conversion. Organic semiconductors bear potential for technologies suitable for large scale power generation with minimal environmental effects and unlimited availability. In contrast to their inorganic counterparts, organic semiconductors offer low material and fabrication costs with high power conversion efficiency that can possibly outcast existing inorganic solar-cell technologies. Amongst a plethora of organic compounds, phthalocyanines (Pcs) possess variety of salient features such as planarity, symmetry and electron delocalization [1] that make them a perfect choice to be employed in numerous optoelectronic applications: solar cells [2,3,4], light-emitting diodes [5,6], sensors [7,8,9,10,11,12], etc. Pcs have been extensively employed in Schottky diodes [13,14,15,16] and multilayered solar cells [17,18] due to their promising photoconductive and photovoltaic responses [4].
Amidst many metal-phthalocyanines (MPcs), copper phthalocyanine (CuPc) has been widely studied as a potential material for solar cells due to its better photovoltaic and photoconductive properties [19,20]. The efficiency of CuPc-based devices was improved by varying thickness of the active layer [21], device structure and top electrodes [22,23]. From the previous studies, it is observed that small molecular weight organic semiconductors have exhibited relatively good photovoltaic performance. However, the potential of zinc phthalocyanine (ZnPc) as an active material for the fabrication of organic solar cells still needs to be explored by optimizing the device structure and adding some materials as hole transport layers (HTL) to enhance its power conversion efficiency (PCE). ZnPc is a deep bluish-green colored organic dye which is a p-type organic semiconductor that demonstrates comparatively better thermal, chemical and mechanical stabilities [24]. ZnPc exhibits π-conjugated structure and acts as a hole conducting material that works as electron donor [25]. Furthermore, it has served as a promising candidate in many electronic and optoelectronic devices [26]. ZnPc is a promising candidate for photovoltaic applications [27,28], owing to the fact that it can be easily synthesized, has broad absorption spectrum in the visible region and is non-toxic to the environment [29]. It manifests structural self-organization characteristics, which is reflected in an efficient energy migration in the form of extinction transport [30].
Studying Schottky barrier cell makes it a good start to evaluate the performance of a single layer solar cell. Owing to metal-organic semiconductor contact, Schottky barrier solar cells have been investigated using vanadyl phthalocyanine (VOPcPhO) [3] and copper phthalocyanine [4,31]. The PCEs reported for organic Schottky solar cells employing CuPc, iron phthalocyanine (FePc), cobalt phthalocyanine (CoPc) and VOPcPhO are 0.001%, 0.00006%, 0.00013% and 0.00108%, respectively [1,3]. Loutfy and his co-workers reported the highest PCE of 1.2% for a Schottky barrier organic solar cell fabricated with an active layer of metal-free phthalocyanine [32]. Even though several studies have been conducted on ZnPc, according to our literature survey, ZnPc has not been formerly investigated as a single-junction solar cell.
Herein, an investigation is reported on the photovoltaic properties of ZnPc-based device, in which the active layer of ZnPc is sandwiched between Ag and PEDOT:PSS/ITO electrodes to fabricate Ag/ZnPc/PEDOT:PSS/ITO solar cell where PEDOT:PSS acts as HTL. One of key purposes of this work is to recognize the photovoltaic properties of ZnPc as an active material for its potential applications in solar cells for energy harvesting. The structural, morphological and optical properties of thermally evaporated ZnPc thin films are also studied.

2. Experimental Work

2.1. Materials and Device Fabrication

ZnPc and PEDOT:PSS were purchased from ACROS and Sigma Aldrich, respectively. The chemical structures of ZnPc and PEDOT:PSS are shown in Figure 1a,b, respectively. ITO coated glass and quartz glass were used as substrates. To remove contamination, the substrates were cleaned in acetone for 10 min followed by a further 10 min cleaning in iso-propanol using ultrasonic bath (Elma Ultrasonic Cleaner S30H). A 20 nm layer of PEDOT:PSS was spin-coated ITO substrate at 2000 rpm for 30 s by using spin coater (EZ4- Spin Coater). The grown thin film of PEDOT:PSS was annealed at 70 °C for 4 h using hot plate (Stuart-US152 Hot Stirrer). A 100 nm thick layer of ZnPc was deposited on PEDOT:PSS/ITO by using thermal evaporator (Edward Auto-306) at high vacuum ≈1.5 × 10⁻⁶ mbar. The deposition rate of ZnPc film was 0.2–0.3 nm/s, which was observed by quartz crystal thickness monitor (Edwards FTM5). Finally, Ag ~50 nm was thermally deposited as top contact to form Ag/ZnPc/PEDOT:PSS/ITO device. The fabricated device structure is presented in Figure 1c. The energy levels of the materials used in the fabrication of device are illustrated in Figure 1d. The HOMO and LUMO energy levels of ZnPc reported in the literature are 5.2 and 3.4 eV, respectively [33]. The external quantum efficiency (EQE) of the Ag/ZnPc/PEDOT:PSS/ITO device was measured within broad-range from 300 to 800 nm wavelengths using an EQE system Optronic Laboratories.

2.2. Material and Device Characterization

The surface morphology of ZnPc thin films were obtained by atomic force microscope (AFM) s-contact mode and scanning electron microscopy (SEM) using JEOL JSM-5910 (120kV), respectively. The structural properties were investigated by BRUKER D8-ADVANCE X-ray diffraction setup. The UV-vis and Fourier transformed infrared (FTIR) spectroscopic investigations were carried out by Perkin-Elmer UV-Vis Spectrophotometer Lambda-25 and Perkin-Elmer Frontier IR/NIR system, respectively.
Photovoltaic properties of the device were measured by current-voltage (I-V) characteristics by using Keithley source measuring unit (SMU-236) under illumination and in dark. For measuring photocurrent response, a Xenon arc lamp of output power (100 mW/cm2) was used as a light source. All the measurements were carried out in ambient conditions at a room temperature (300 K).

3. Results and Discussion

3.1. Material Characterization

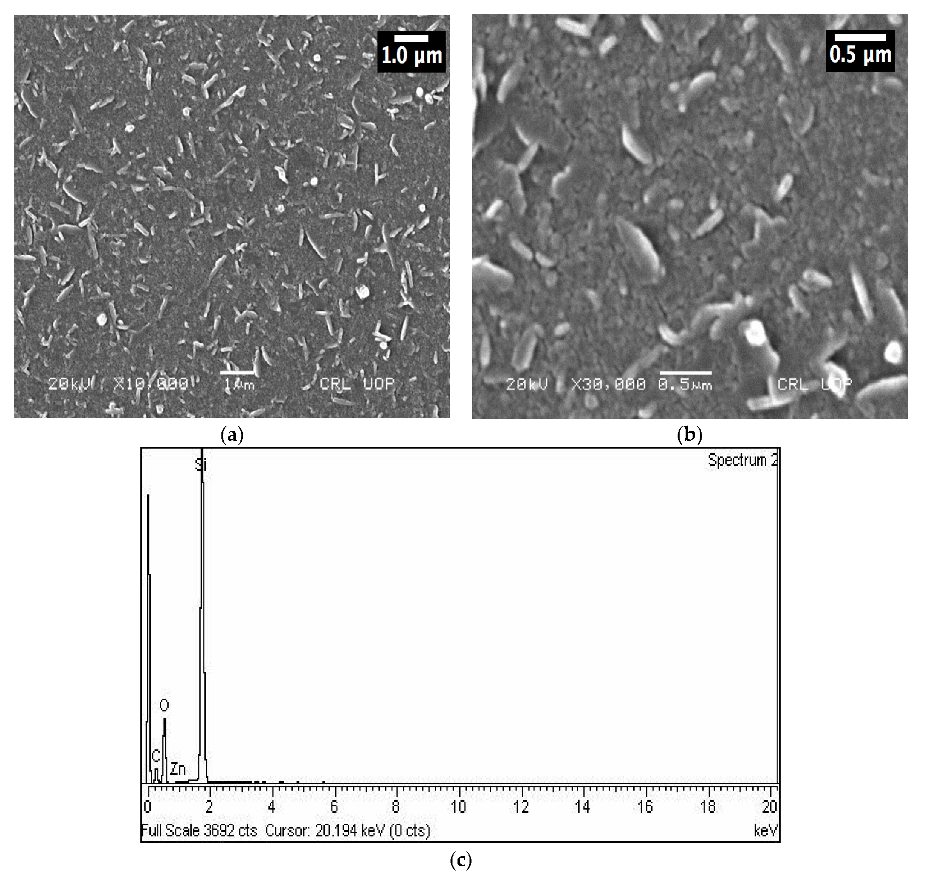
SEM micrographs of ZnPc thin film are shown in Figure 2a,b at low and high resolution, respectively. It can be clearly seen from Figure 2 that the film contains grains which have granular nature and are oriented arbitrarily with ordinary distribution of grain concentration. Such morphology might occur due to non-uniform and comparatively high growth rate inside the thermal evaporation. The non-uniform surface is responsible for traps and interfacial states, which result in localization of charge carriers. Figure 2c shows EDS analysis of ZnPc film that reveals some traces of silicon (Si), carbon (C), oxygen (O) and zinc (Zn) in the film, which verifies the composition of ZnPc. However, the presence of Si in EDS is due to the quartz substrate. Table 1 presents EDS details of ZnPc.
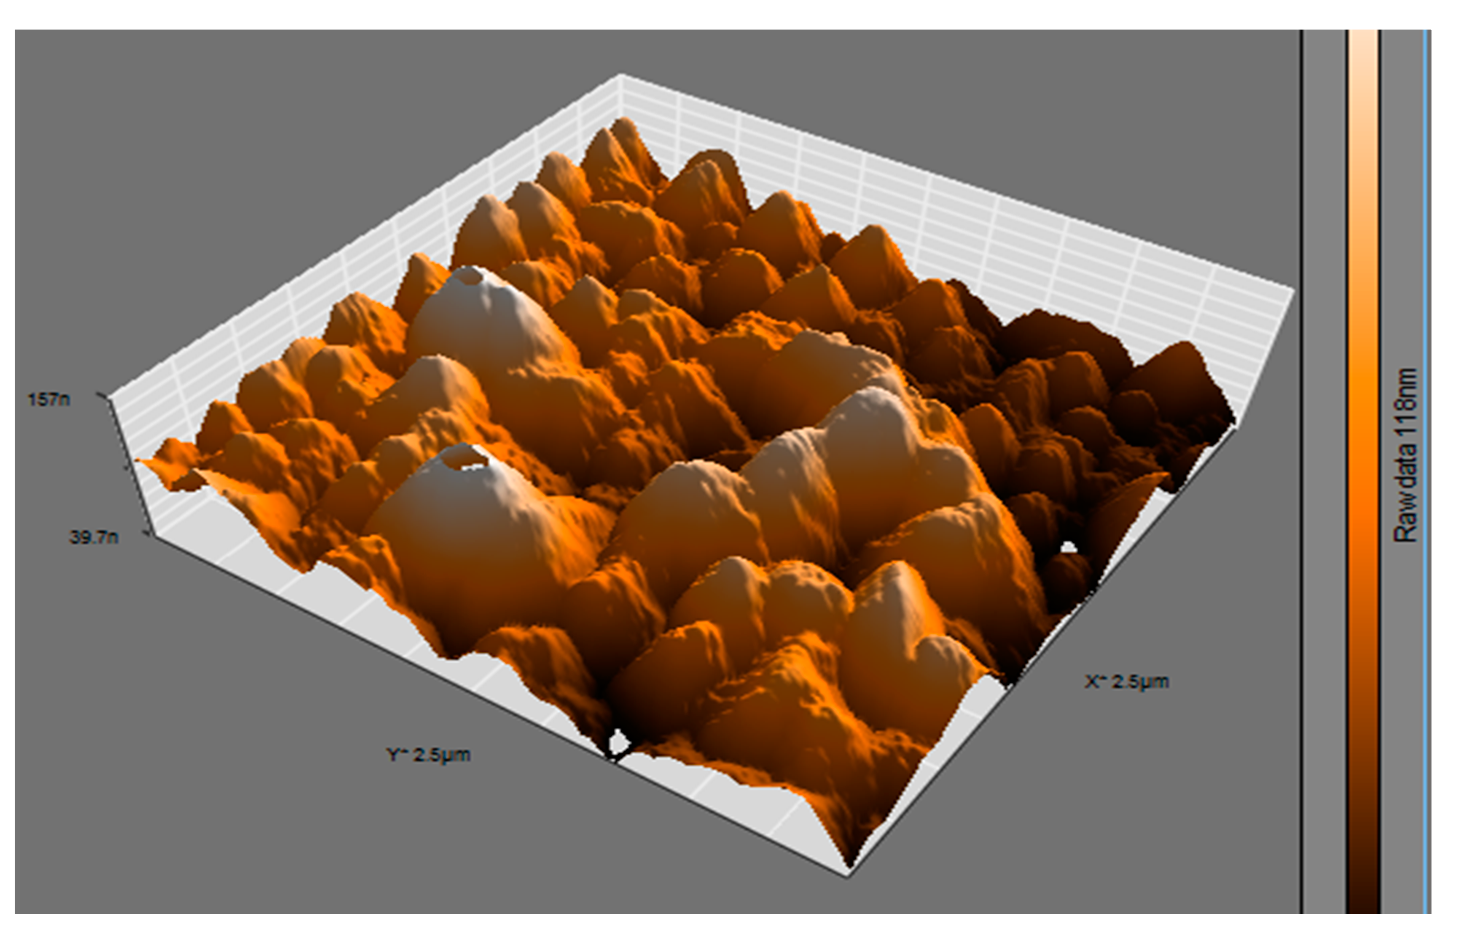
The surface morphology ZnPc thin film is examined by atomic force microscope (AFM). The AFM was operated in non-contact mode in order to avoid damage to the film surface. Figure 3 presents 3-D AFM micrograph of ZnPc thin film. The average surface roughness (Ra) of the film is 15.48 nm which represents slightly rough and non-uniform surface. The surface of ZnPc thin film indicates formation of localized islands and mosaics which result in traps for charge carriers and more localized states.
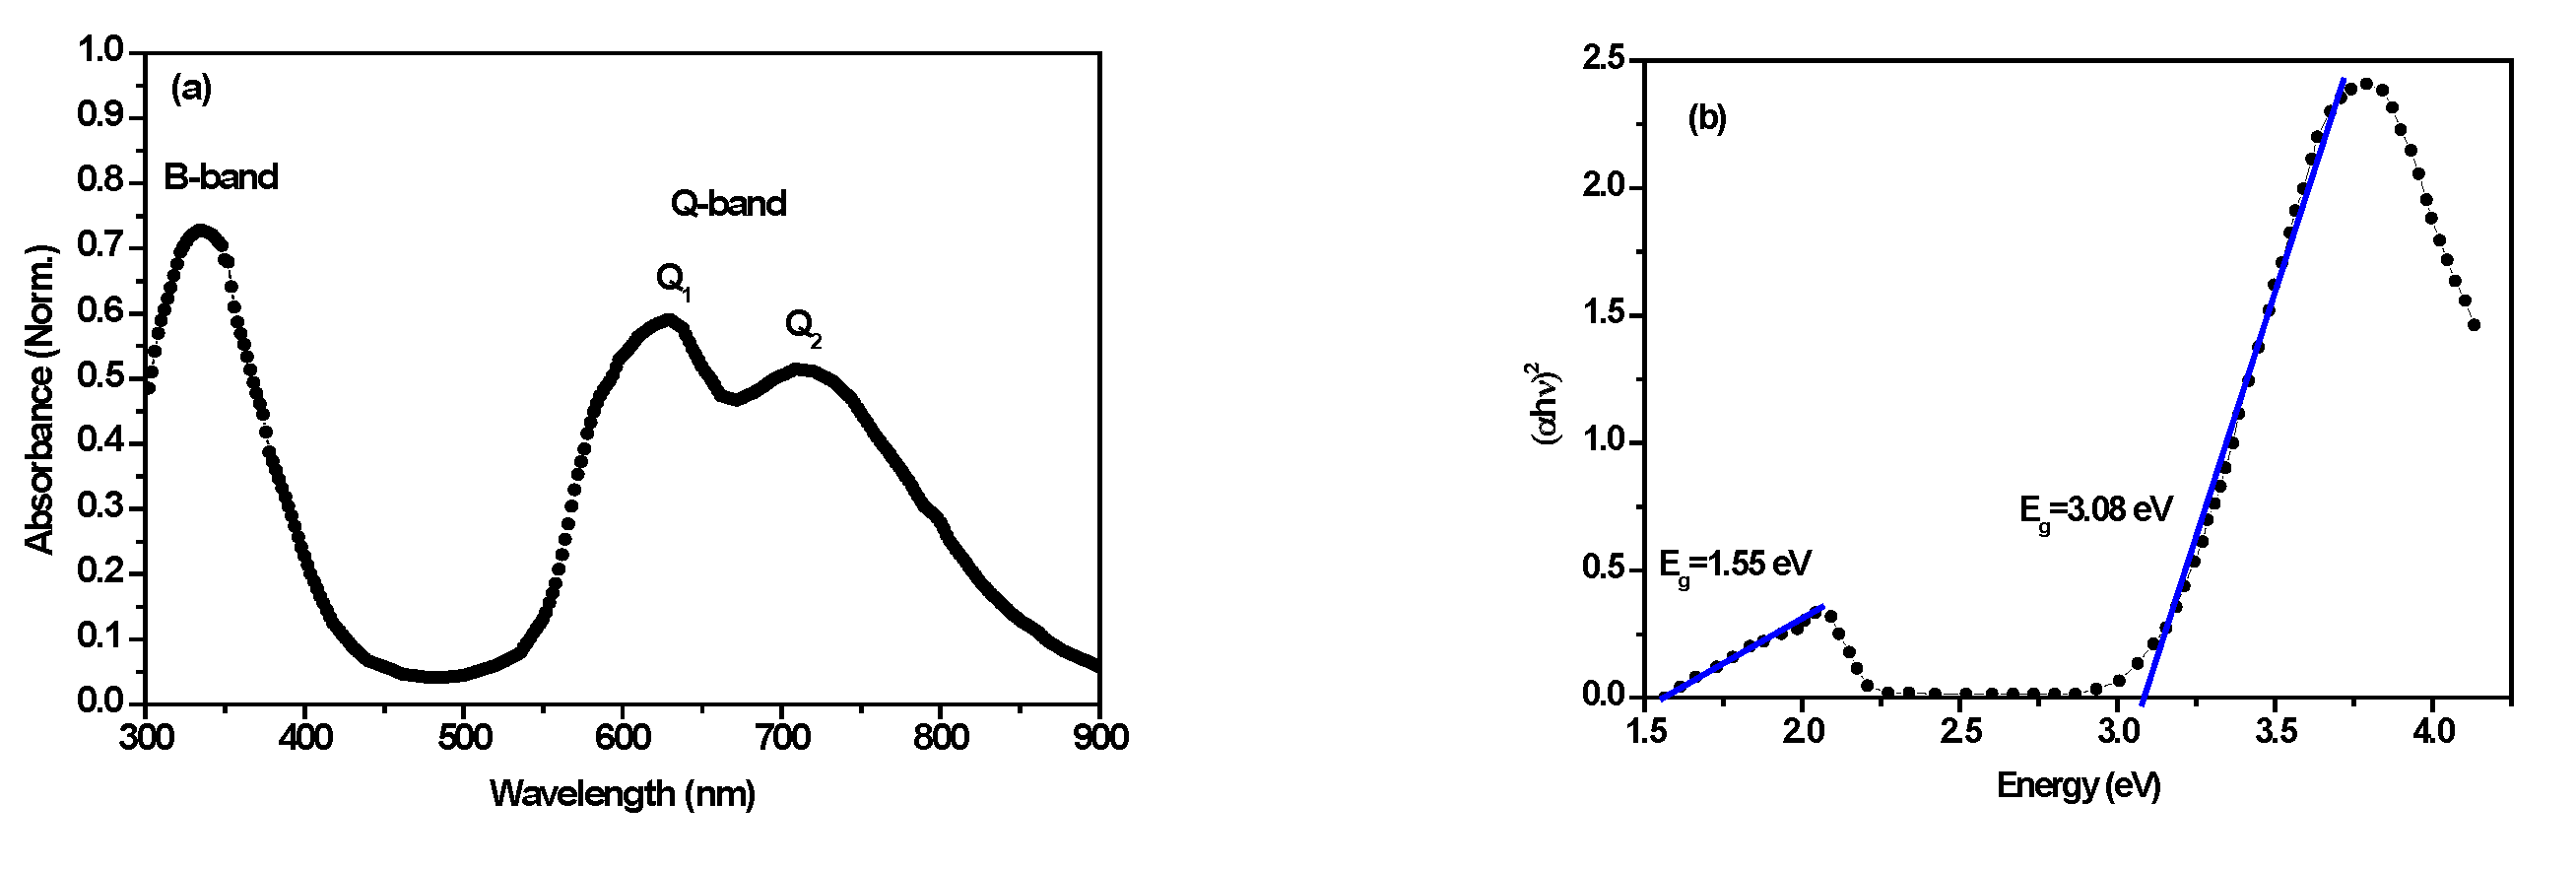
Figure 4a presents optical absorption spectra of ZnPc thin film. The spectra show two sharp absorption peaks; one at 335 ± 5 nm (at high-energy B-band) and the other starting at 630 ± 5 nm in the visible region (at low-energy Q-band), which spreads further into near infrared region. There appears a small shoulder near the peak at 700 ± 5 nm. Both of these transitions occur due to π–π* transitions in the visible spectral region while the lowest allowed n–π* transition may occur in B-band. Usually, ZnPc does not exhibit metal to ligand and/or ligand to metal transitions because of its fully filled Zn+2 d10 electronic configurations that result in a simplified spectrum relative to other MPcs. In Figure 4a, the B-band known as γ -band or Soret-band—as in porphyrins—has the maximum intensity at 330–340 nm for ZnPc., whereas the Q band that is equivalent to α -band in porphyrins has split into two bands, Q1 and Q2, due to Davydov splitting which is attributed to excitons coupling between two nonequivalent molecules in a unit cell. The Q1 (at 625–635 nm) and Q2 (at 695–705 nm) bands are known as the Q–band of a monomer and dimer or higher aggregates, respectively. On the basis of Davydov model, a blue-shift of the Q-band occurred when a co-facial alignment takes place between two or more than two molecules while a red-shift of the Q-band is observed in case of coplanar dimers and/or stripes when a strong coupling between electronic states occurs. Herein, the spectrum obtained for ZnPc are in line with previously reported literature [30] where peaks are observed at 350, 630 and 690 nm [34].
Tauc’s plot has been used for the calculation of energy bandgap of ZnPc according to the following equation:
α E = ( E E g ) m
where α is the absorption coefficient and can be calculated as
A = ln ( I I 0 ) A = α d
where ‘E’ shows photon energy, Eg represents bandgap energy, d indicates thickness of the film and ‘m’ is transition constant (m equals 1/2 for direct and 2 for indirect transition) [35]. The direct permitted transition model is used to calculate the optical bandgap. Therefore, (αE)2 is plotted against E, as shown in Figure 4b. The values of Eg were extracted by extrapolating linear portion of (αE)2 versus E to zero and were found to be 1.55 and 3.08 eV. The obtained values of optical bandgaps are in agreement with those estimated elsewhere [30,34].
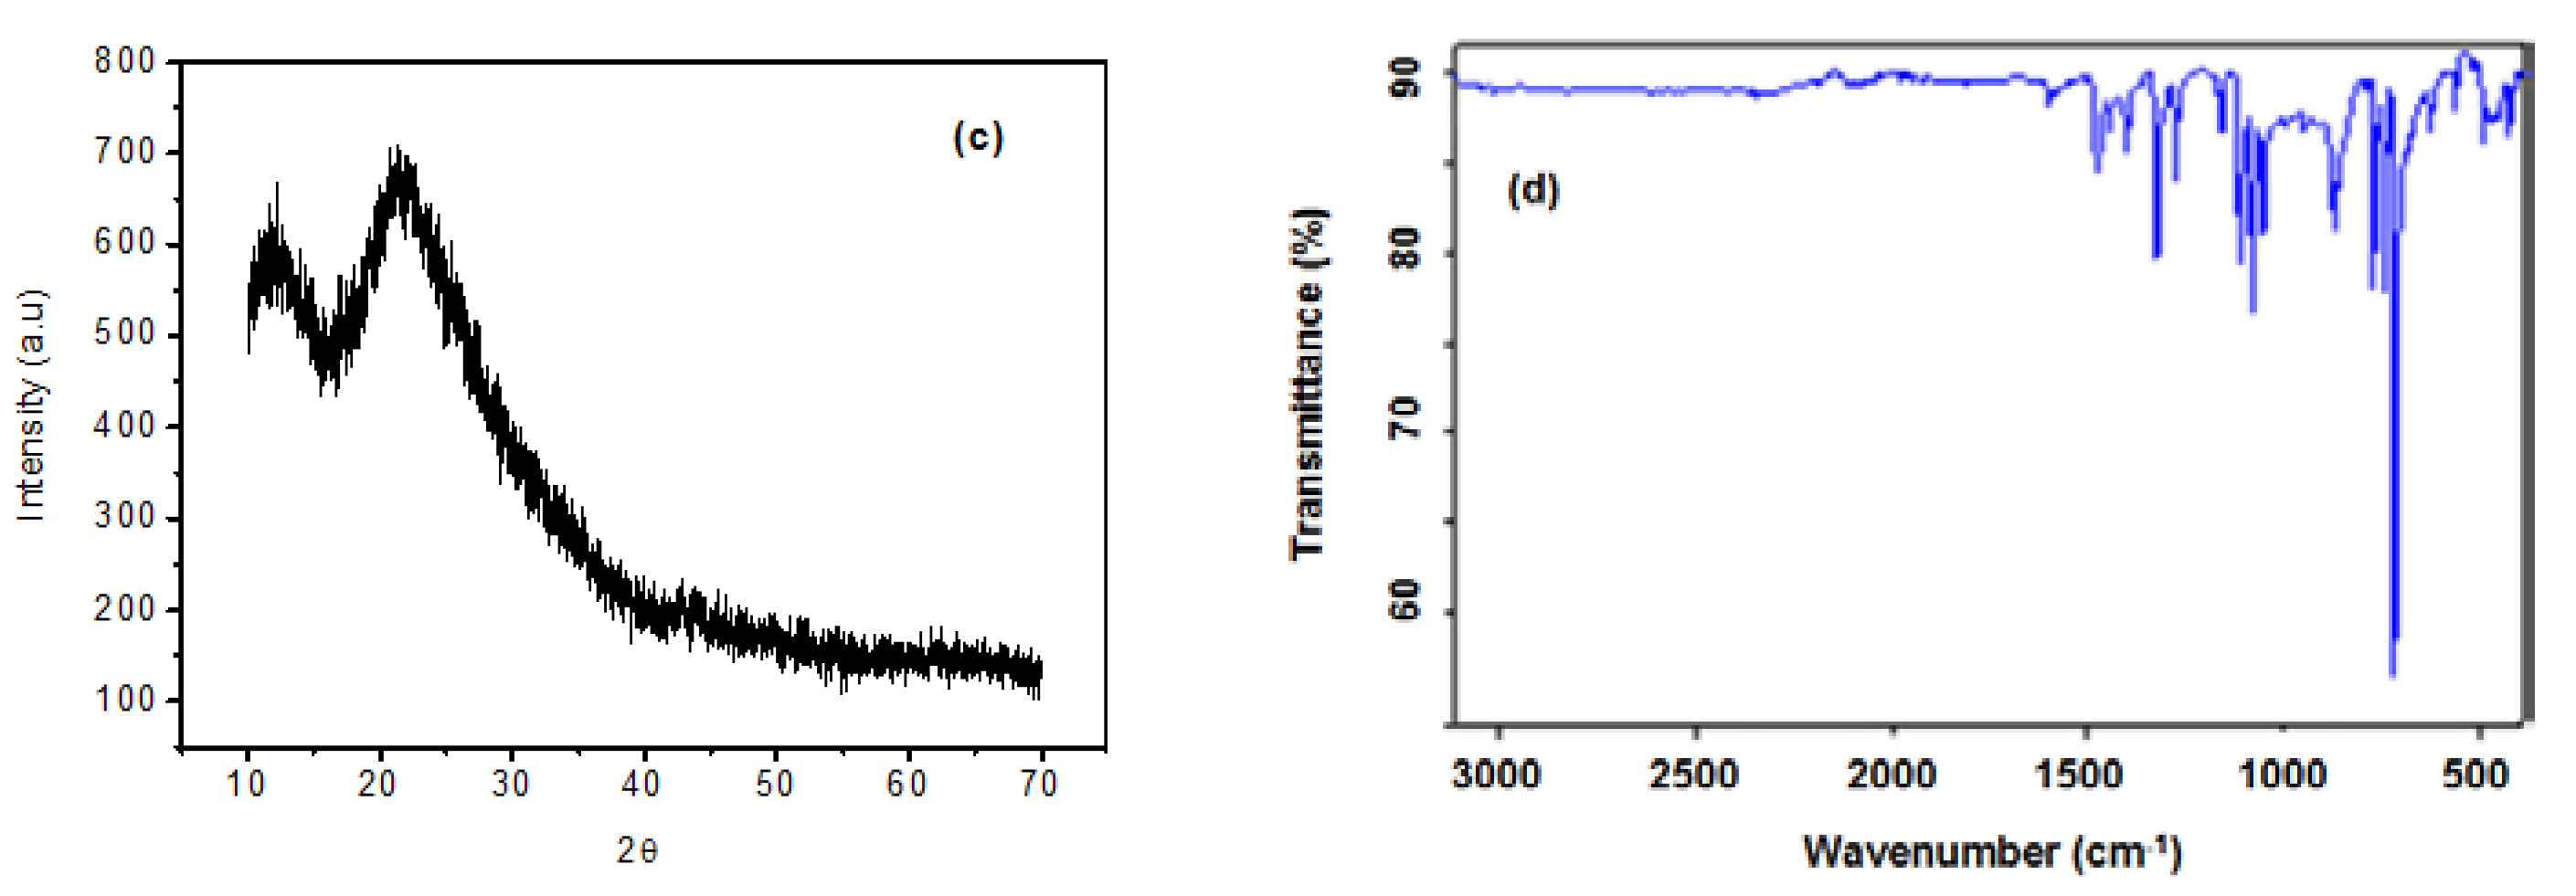
X-ray diffraction (XRD) pattern of ZnPc thin film is shown in Figure 4c. The film in as deposited condition in the current research work was recognized to be in amorphous phase. However, the crystal or amorphous nature of ZnPc depends upon (1) temperature at which the film is deposited and (2) annealing temperature that converts its structure into crystalline β-form. Increasing annealing temperature increases volume fraction of β-form [34]. The films of ZnPc that are deposited at substrate temperature (Ts = 303K) are found amorphous, and those deposited at higher substrate temperature (Ts = 373K) are found to be polycrystalline in nature [30]. There is a clear Bragg peak located at 2θ = 11.4° that evidently exhibits that the thin film of ZnPc might possess some small crystallites [36]. Herein, the XRD spectrum with significant line broadening at 2θ = 18 − 32° indicates the presence of the growth of smaller crystallites. Not any other irrelevant Bragg reflection corresponding to other impurities is observed, which confirms that ZnPc are phase pure [37]. The broad peak centered at 2θ = 21° may also be attributed to some of the smaller crystallites of ZnPc laying parallel to the plane of substrate surface and their stacking axes being inclined to it [38]. The XRD investigations demonstrate that the as-deposited ZnPc film grown at lower temperature is amorphous in nature. The film is identified to be mainly amorphous in nature with a halo around of 2θ = 21° [34].
The FTIR absorption technique has been employed to confirm chemical composition and bond dynamics of ZnPc as well as existence of polymorphs. The FTIR transmission spectra of ZnPc thin film (as deposited) is shown in Figure 4d. The observed bands/energies and their assignments are presented in Table 2. The ZnPc is characterized by various in-plane C-H bend modes, which are located at 751, 1057, 1084, 1116, 1165 and 1285 cm−1. The peaks at 721 and 886 cm−1 correspond to out-of-plane C-H bend modes. The bands associated with 1329 and 1408 cm−1 verify in-plane pyrrole and isoindole stretch, respectively. The C-C Benzene stretch is associated with the peaks observed at 1484, 1522, 1606 cm−1. The peaks witnessed at 1722 cm−1 identify C-H stretch. The observed bands confirm the chemical structure of ZnPc which is line with literature reported elsewhere [39,40].

3.2. Current-Voltage (I-V) Characteristics

The performance of a photovoltaic device is best illustrated by the current-voltage (I-V) characteristics. The dark I-V curves provide information on the forward rectifying diode behavior, the cell shunt and series resistances. However, the photo I-V characteristics give insight into the photovoltaic properties of the device.

3.2.1. Dark I-V Characteristics

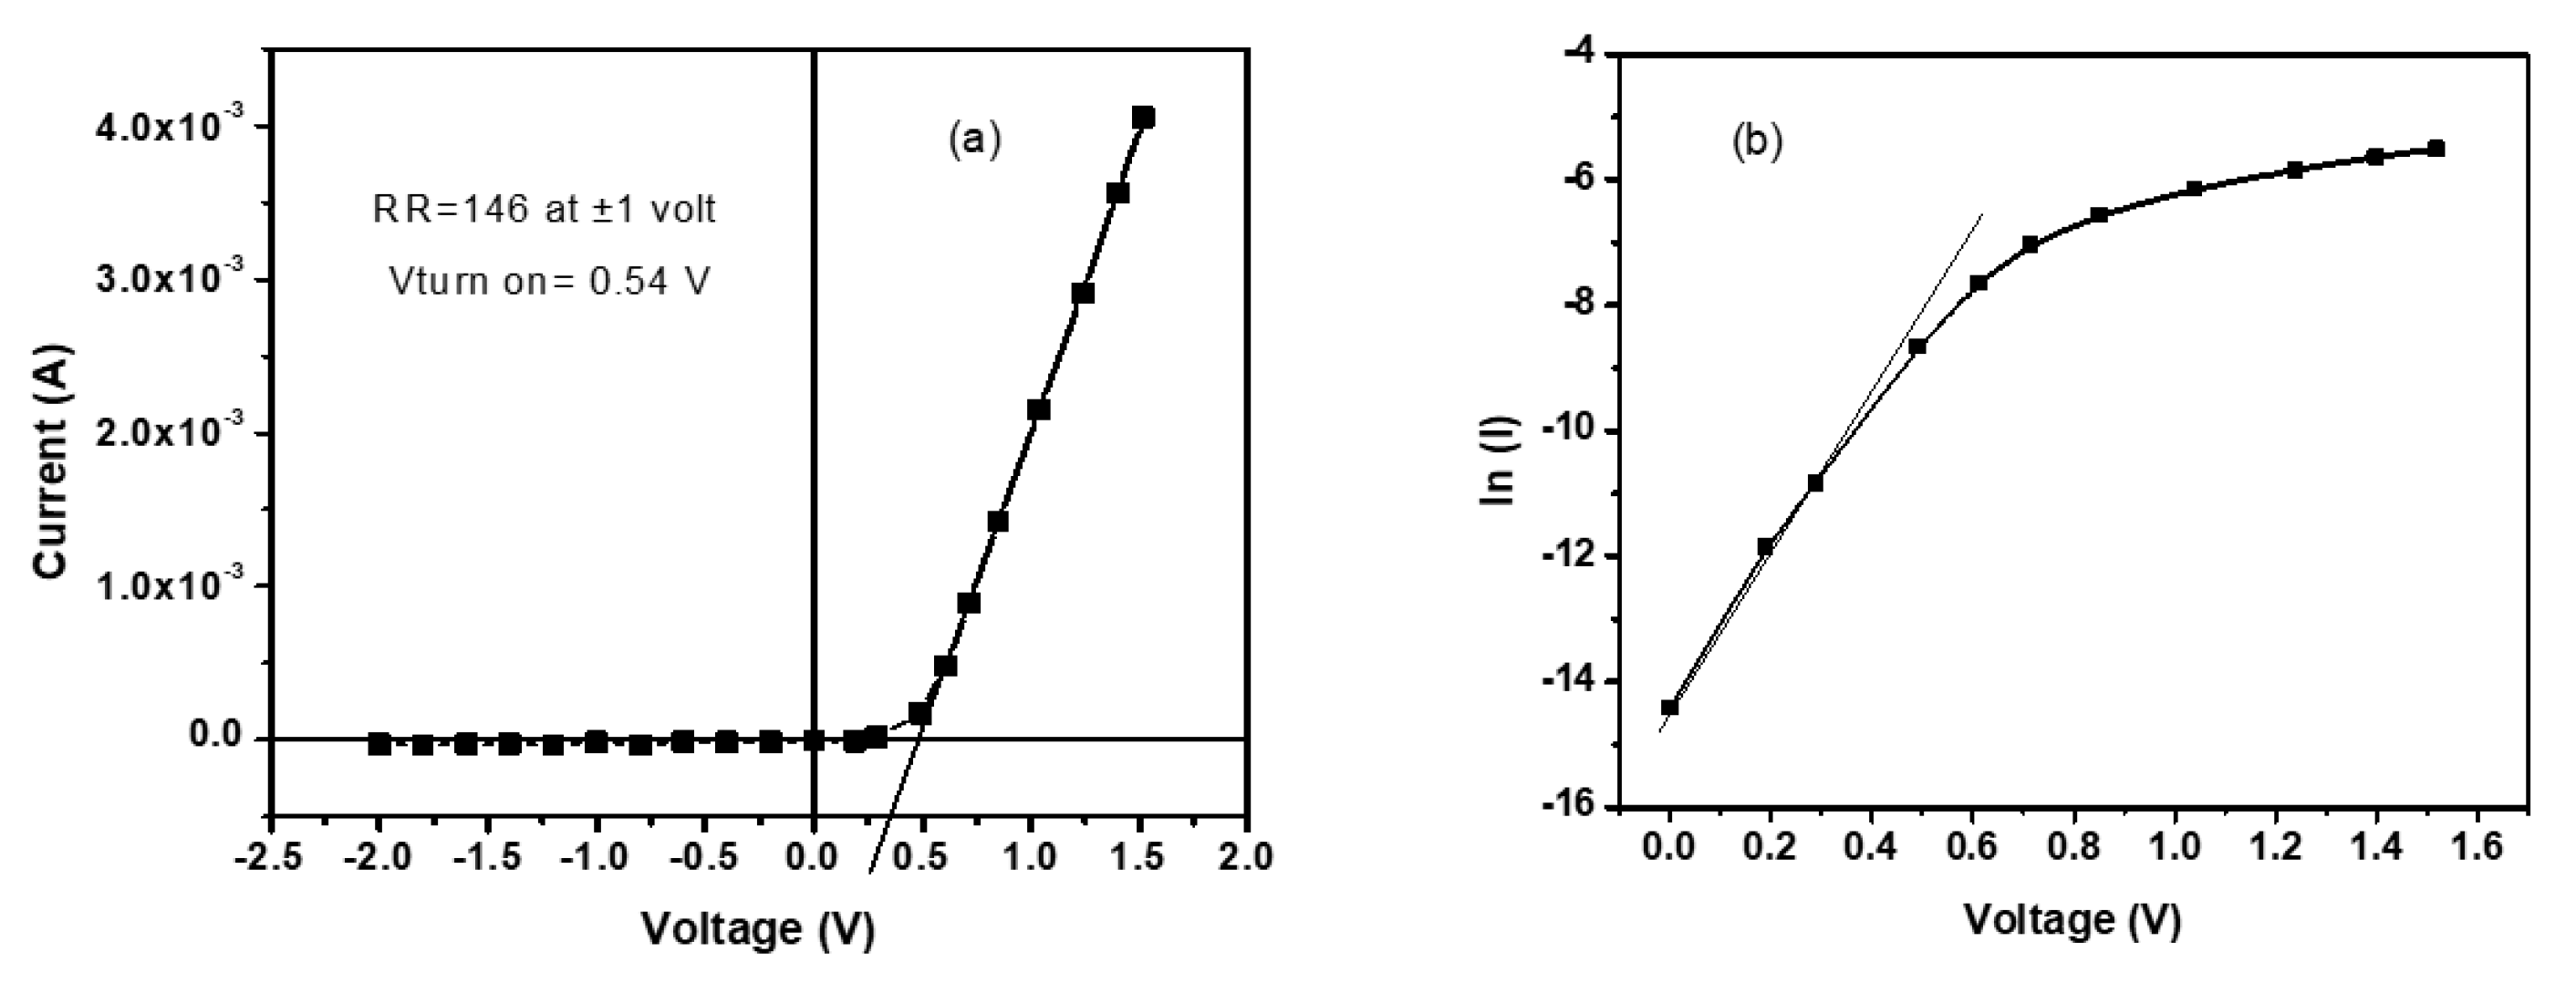
Figure 5a presents I-V characteristics of Ag/ZnPc/PEDOT:PSS/ITO solar cell in dark obtained at room temperature. The I-V curves provide information about device parameters, i.e., rectification ratio (RR), reverse saturated current (Io), ideality factor (n), series (Rs) and shunt (Rsh) resistances, barrier height ( ϕ b ), etc. The asymmetrical I-V characteristics exhibit rectifying behavior that verifies formation of non-ohmic junction. The rectification ratio (RR) of the junction is extracted from I-V graph which is found as 146 at ± 1 V. Whereas, the turn on voltage (Vturn on) is observed as 0.54 V. In the forward region, exponential behavior of I-V curves depends on the properties of organic active layer. In exponential region, slope of I-V characteristics relies on two parameters, ideality factor (n) and reverse saturation current (I0). The information about recombination process, in the cell and interfaces, can be obtained from ideality factor [41]. However, saturation current provides density of charge carriers that rise above the barrier in reverse [42,43]. An ideal device has ideality factor closed to unity whereas saturation current in pico-scale.
Figure 5b shows semi-log I-V characteristics, which are used to determine ideality factor, barrier height and reverse saturation current. These parameters, in fact, evaluate the properties of interface between ITO and ZnPc heterojunction. Generally, it is considered that the forward current follows thermionic emission when a metal is brought in contact with a semiconductor. Thus, a modified Shockley equation is given as below:
I = I 0 [ exp ( q ( V I R s ) n k T ) 1 ]
In the given equation, V represents voltage across the junction, q is a magnitude of charge, n shows quality factor of the diode, k is Boltzmann’s constant, Io is reverse saturation or leakage current and T is temperature in Kelvin. The value of Io is obtained from the intercept of straight line at zero voltage of ln I-V graph and is given as follows [44]:
I 0 = A A * T 2 e x p ( q ϕ b k T )
where A represents the diode effective area (~0.09 cm2), A* is Richardson constant which is 1.3 × 10⁵ Acm−2K−2 for ZnPc [45,46] and ϕ b denotes apparent barrier height. The equation for ideality or quality factor n is written as:
n = q k T d V d ( ln I )
The barrier height is obtained by rearranging Equation (4) as follows:
φ b = k T q ln ( A A * T 2 I 0 )
From ln(I)-V characteristics of Figure 5b and using Equations (4) to (6), the values of ϕ b , n, and Io are calculated as 0.92 eV, 3.8 and 5.5 × 10⁻⁷A, respectively. As a matter of fact, the ideality factor should be close to unity. However, in the present case, the ideality factor is deviated from the ideal value. Since the value obtained is greater than 2, it can be conjectured that the prevalent current in single-layer photovoltaic devices is due to recombination [47].
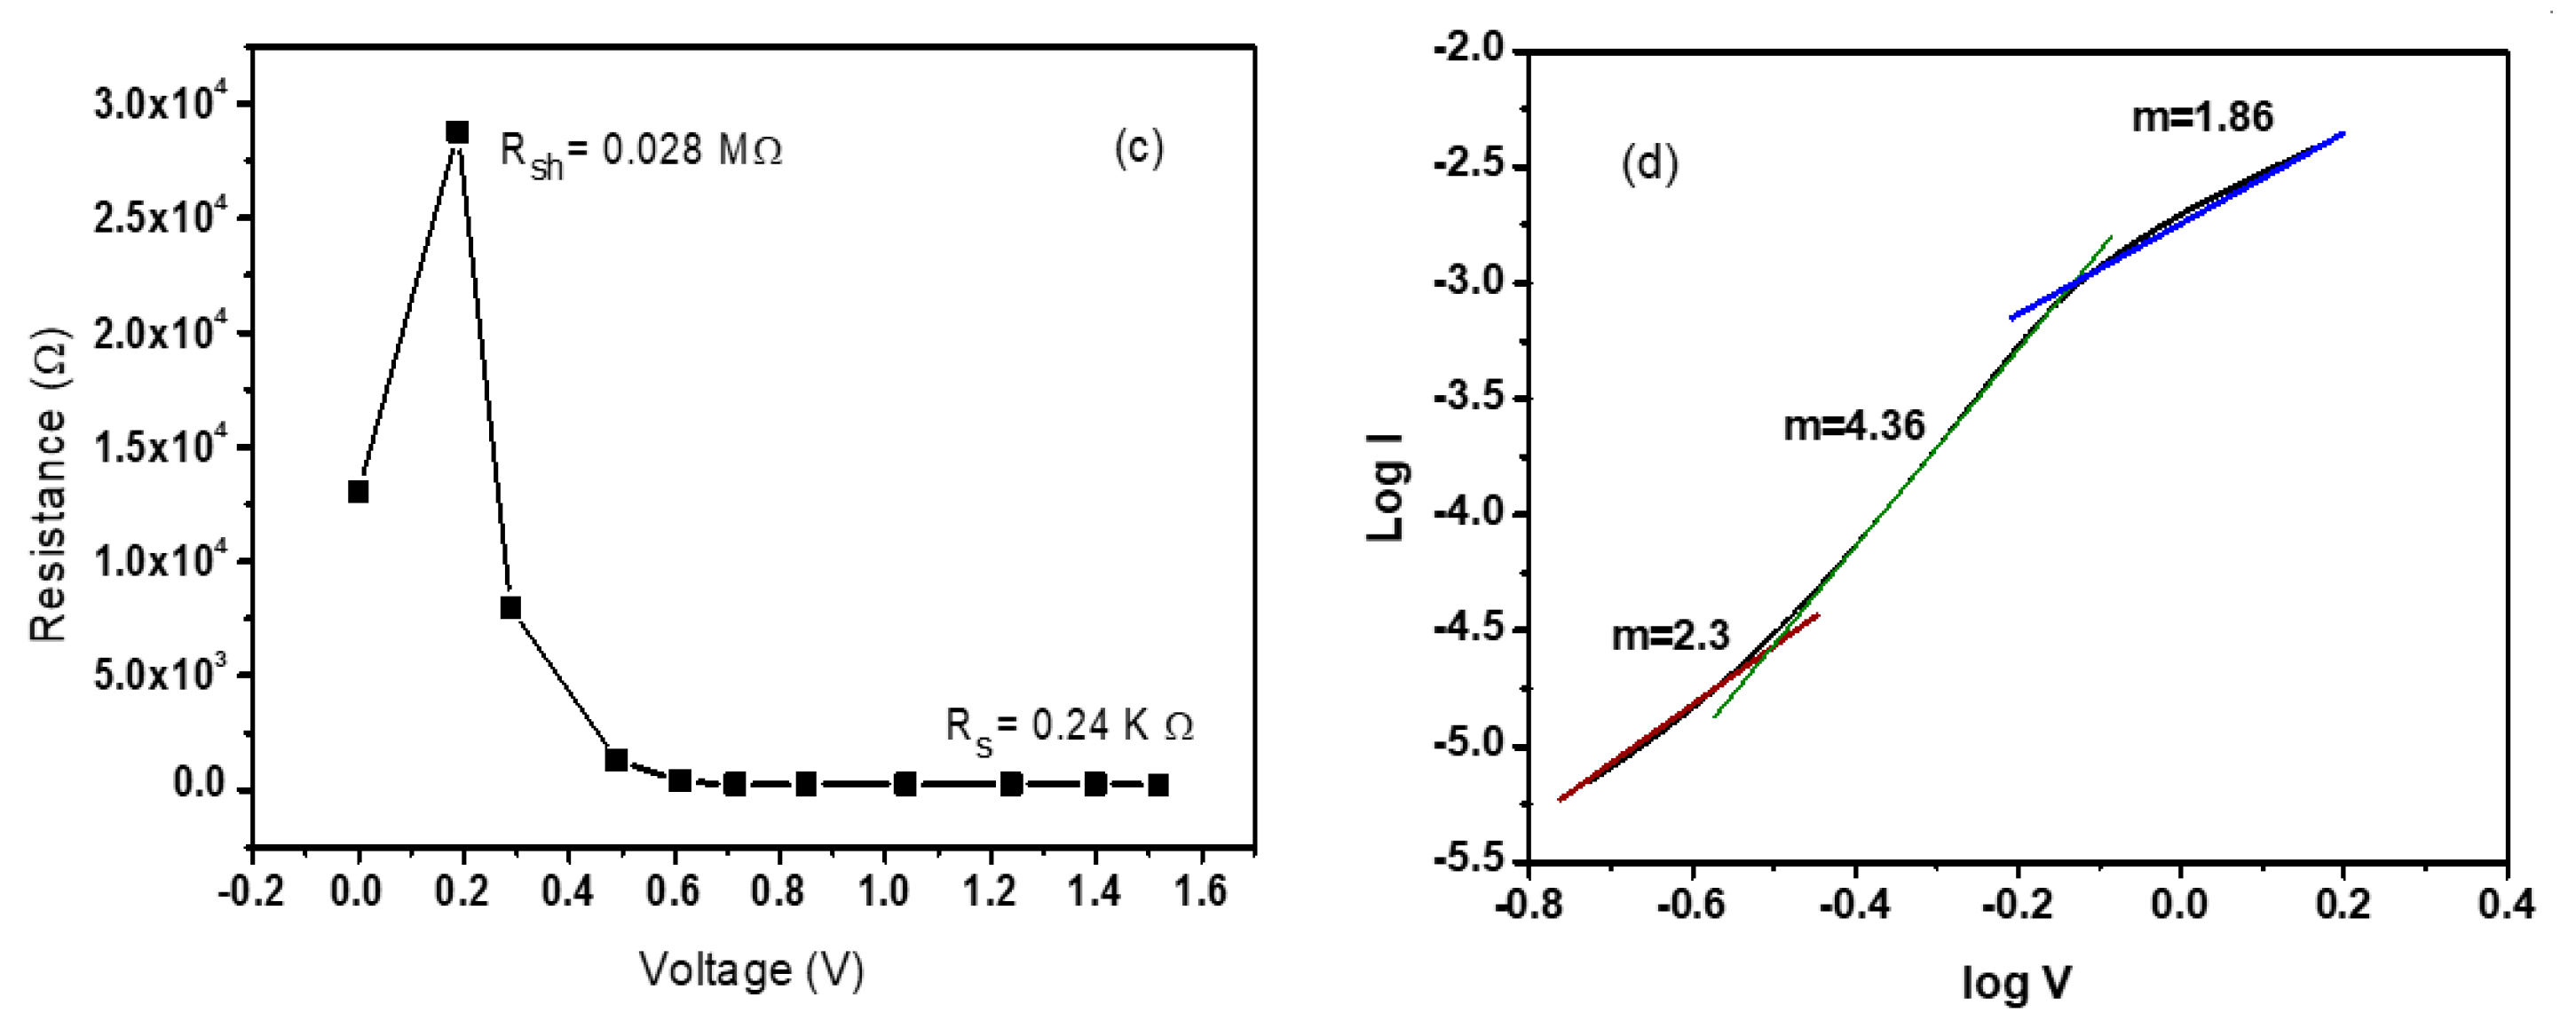
The performance of PV cell can be enhanced by high shunt (Rsh) and low series (Rs) resistances. Shunt resistance Rsh points to recombination of charge carrier that occurs in dissociation site, i.e., interface region of donor and acceptor materials. However, series resistance Rs affects the conductivity, i.e., hole mobility of donor (p-type) and electron mobility of acceptor (n-type) materials. The Rsh and Rs are determined from the graph of the junction resistance (Rj) versus voltage (V) shown in Figure 5c. The values obtained for Rsh and Rs are 28 KΩ and 240 Ω, respectively.
To realize the nature of conduction mechanism through the heterojunction, the log I versus log V curve is plotted as shown in Figure 5d. This graph is governed by Child’s or Power law, i.e., (I ≈ Vm) that indicates different conduction mechanisms for different values of m. When m = 1, Child’s law becomes I ≈ V, which is actually Ohm’s law where current is directly proportional to voltage. If m = 2, the relation becomes I ≈ V2, which represents space charge limiting current (SCLC) region which actually takes place in the depletion region of heterojunction and p-n junction devices. The higher values of m represent trap charge region and trapped filled region, which occur due to shallow and deep traps in the film. The dominant conduction mechanism in ZnPc/ITO device is the SCLC mechanism.
The plot of log I vs. log V in Figure 5d exhibits three distinct regions with slope equal to 2 in the first and third regions and 4.36 in the second region. The regions having slope almost equal to 2 show that the SCLC is the dominant conduction mechanism in regions I and III, which is controlled by a single trap level. The current density in these regions can be expressed as follows:
J S C L C = 9 ε 0 ε r μ V 2 8 d 3
where ε 0 = 8.85 free space and ε r = 3.4 is the relative permittivity of ZnPc [48,49], µ is the hole mobility, V is the applied voltage and d (=100 nm) is the thickness of the film. The slope greater than 2 in region II of Figure 5d demonstrates that the dominant transport mechanism in this region is trap-charge-limited current (TCLC) with exponential distribution of traps. In the presence of traps, the current density can be expressed as [50]:
J T C L C = 9 ε 0 ε r θ μ V 2 8 d 3
where θ is a trapping factor.

3.2.2. Photo I-V Characteristics

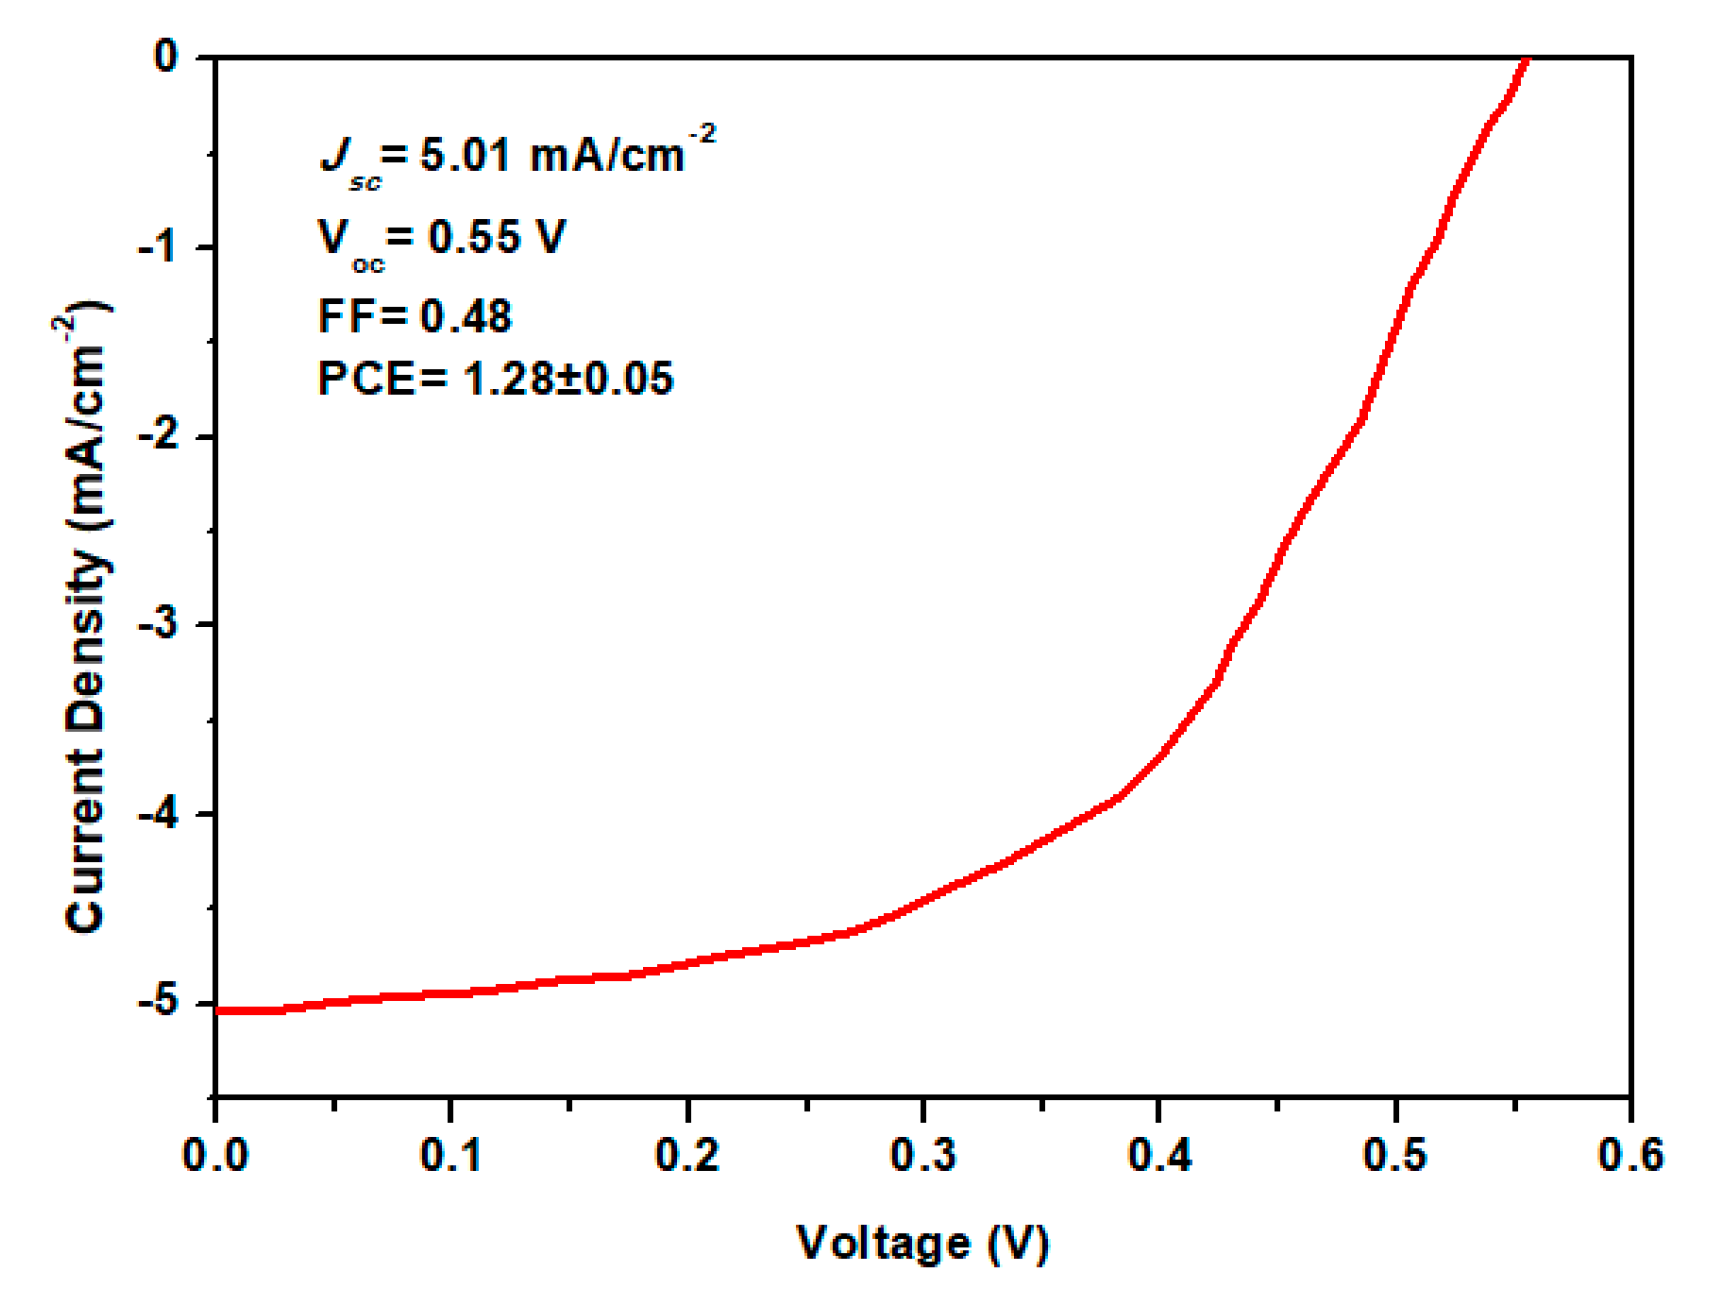
The performance of a solar cell can be investigated by its current density–voltage (J-V) characteristics in dark and under illumination. In order to demonstrate the potential application of ZnPc in organic solar cells, the current density–voltage (J-V) characteristics were evaluated under standard testing conditions (STC), i.e., 1.5 AM global, solar illumination at 100 mWcm−2 and 300 K. The J-V curves of illuminated Ag/ZnPc/PEDOT:PSS/ITO solar cell are shown in Figure 6. The graph clearly shows that the amount of current through the device under light is greater than that of obtained in the dark, which demonstrates that excess electron-hole pairs are produced due to the absorption of photons leading to generation of photocurrent.
The performance parameters for the solar cell have been extracted according to the expressions given below. The Fill Factor (FF) and Pmax were calculated by the following equations:
F F = J max V max J S C V O C
and
P max = ( J S C V O C ) × F F
The PCE “η” is an important parameter of a solar device, which is defined as the ratio of maximum output power Pmax and incident light power Plight, which is given by:
η = P max P l i g h t × 100 %
The short circuit current density (JSC) and open circuit voltage (VOC) for the ZnPc Schottky solar cell were measured as 5.01 × 10⁻³ A/cm2 and 0.55 V, respectively. The FF was obtained as 0.48. The PCE of the Ag/ZnPc/PEDOT:PSS/ITO solar cell is found to be 1.28 ± 0.05%. The photocurrent in the active layer can be ascribed mainly to the charge carrier transport to the external electrodes without recombination [51].
The increase in the efficiency is obviously due to the enhancement of VOC and FF values. The increase in the VOC is attributed to the increased absorption of light in the bulk of the ZnPc layer. Hence, more excitons are created which find their dissociation sites at the interface of ZnPc silver (Ag) electrode [31]. There may be several reasons for improved short circuit current density of the ZnPc Schottky solar cell: (1) reduced charge recombination in the active layer; (2) increased interface surface area, which gives rise to enhanced carrier transport [52]. Various parameters of Ag/ZnPc/PEDOT:PSS/ITO solar cell are compared with the previously reported phthalocyanines-based solar cells and are presented in Table 3, which depicts an evident enhancement in the PCE of ZnPc Schottky solar cell.
Another important parameter while studying solar cells is the external quantum efficiency (EQE) that is a characteristic of photovoltaic device, demonstrating the number of electron-hole pairs collected at the electrodes to number of incident photons absorbed by the device, measured at 0 V. EQE measured with illumination of monochromatic light of wavelength λ , is expressed as:
E Q E ( λ ) = I s c ( λ ) h c q λ P λ
where Isc( λ ) is the short-circuit current, h is Planck’s constant, c is the speed of light, q the electron charge and P( λ ) is the power of incident light.
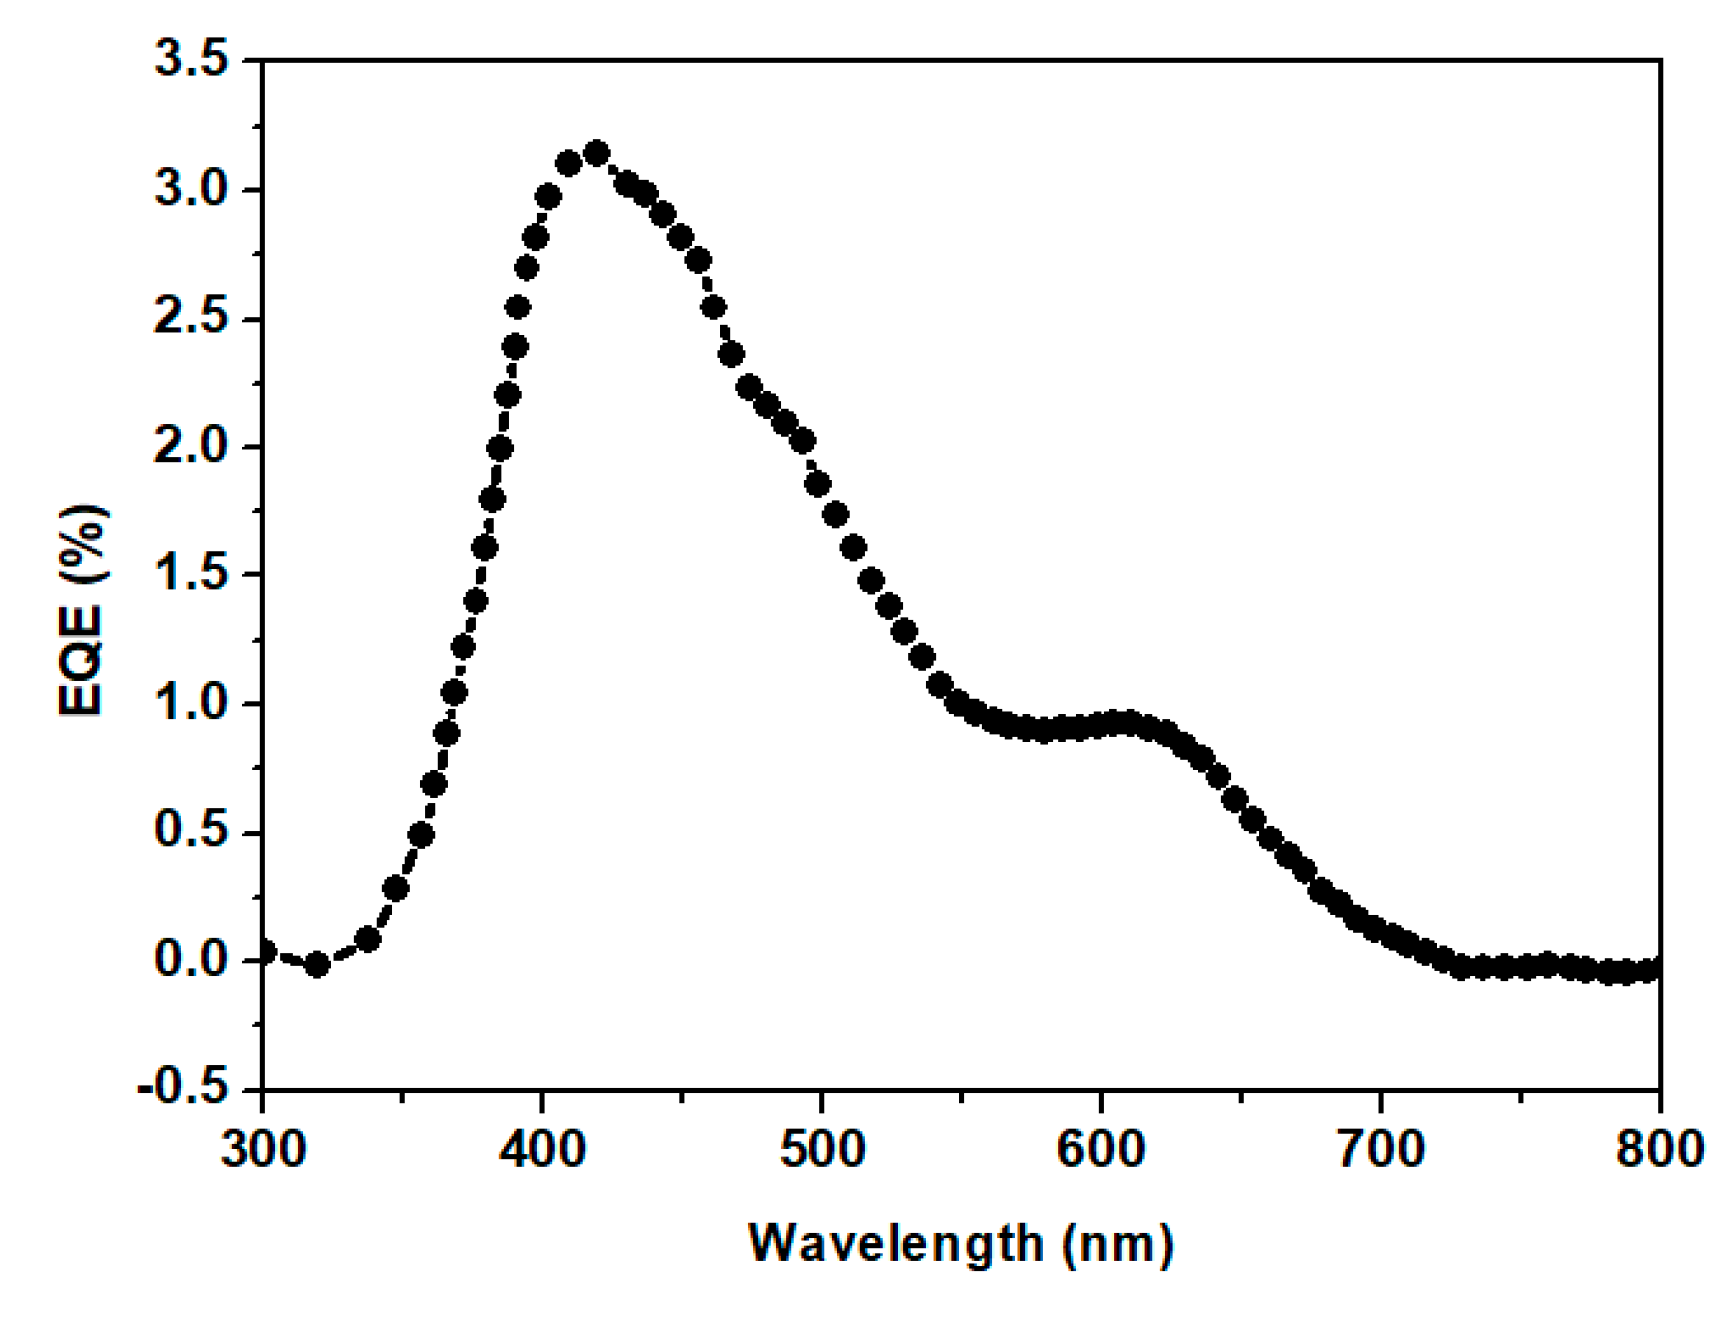
Figure 7 shows the EQE spectrum of ZnPc/PEDOT:PSS device. The peak values in EQE curve at 420 nm and the peak of the neck at 610 nm correspond to ZnPc absorptions. At the highest peak (420 nm), the value of EQE is approximately 3.01%. Apart from the materials’ characteristics, EQE is also influenced by several other factors, such as light absorption, exciton diffusion, exciton dissociation, charge carrier transport, etc.

4. Conclusions

The photovoltaic characteristics of ZnPc are explored for its possible applications as a solar cell active organic material. The I-V properties of Ag/ZnPc/PEDOT:PSS/ITO device are studied in both dark and STC conditions for solar cells to investigate the photovoltaic PCE. In dark conditions, the device exhibited asymmetrical and rectifying I-V curves, which actually confirmed the formation of non-ohmic interface between ITO/PEDOT:PSS and ZnPc. The quality of the junction was quantified by the values of n, ϕ b and Rs, which are measured as 3.2, 0.92 eV and 0.24 kΩ, respectively. The fabricated device demonstrated better photovoltaic behavior at STC conditions with the values of FF and η around of 0.48 and 1.28 ± 0.05%, respectively. The morphological study of ZnPc thin film revealed uniform shape and sizes of grains, which were slightly randomly distributed throughout the surface with small value of roughness Ra 15.48 nm. The low value of Ra, in turn, contributed towards the efficient creation of excitons and their transport to the junction sites where they break into free electrons and holes. The UV-vis spectroscopy of ZnPc exhibited broad absorption in the visible range, which suggests that ZnPc is one of the promising candidates for solar cell applications.

Author Contributions

Conceptualization, M.T. and Z.U.I.; methodology, Z.U.I. and W.A.S.; software, M.R.S.; validation, F.A., F.W., S.M.S. and M.F.M.S.; formal analysis, Z.U.I.; investigation, Z.U.I. and M.T.; resources, M.T.; data curation, F.W. and M.R.S.; writing—original draft preparation, Z.U.I. and F.A.; writing—review and editing, M.T.; visualization, M.T.; supervision, M.T.; project administration, M.T.; funding acquisition, S.H.M.A. All authors have read and agreed to the published version of the manuscript.

Funding

This research was funded by the Higher Education Commission of Pakistan (HEC), grant No.: 10170/KPK/NRPU/R&D/HEC/2017. And the APC was funded by Universiti Kebangsaan, Malaysia, under Grant Code DCP-2017-006/2 (UKM).

Acknowledgments

The authors are thankful to the Abdul Wali Khan University, Mardan, Pakistan; Higher Education Commission of Pakistan (HEC), for funding under grant No.: 10170/KPK/NRPU/R&D/HEC/2017.

Conflicts of Interest

The authors declare no conflict of interest.

References

  1. Wöhrle, D. Phthalocyanines: Properties and Applications; Wiley: Hoboken, NJ, USA, 1989; Volume 1, p. 305. ISBN 3-527-26955-X. [Google Scholar]
  2. Abdullah, S.M.; Ahmad, Z.; Aziz, F.; Sulaiman, K. Investigation of VOPcPhO as an acceptor material for bulk heterojunction solar cells. Org. Electron. 2012, 13, 2532–2537. [Google Scholar] [CrossRef]
  3. Aziz, F.; Ahmad, Z.; Abdullah, S.M.; Sulaiman, K.; Sayyad, M.H. Photovoltaic effect in single-junction organic solar cell fabricated using vanadyl phthalocyanine soluble derivative. Pigment Resin Technol. 2015, 44, 26–32. [Google Scholar] [CrossRef]
  4. Kwong, C.Y.; Djurišiĉ, A.B.; Chui, P.C.; Lam, L.S.M.; Chan, W.K. Improvement of the efficiency of phthalocyanine organic Schottky solar cells with ITO electrode treatment. Appl. Phys. A 2003, 77, 555–560. [Google Scholar] [CrossRef]
  5. Xu, J.; Wang, Y.; Chen, Q.; Lin, Y.; Shan, H.; Roy, V.A.L.; Xu, Z. Enhanced lifetime of organic light-emitting diodes using soluble tetraalkyl-substituted copper phthalocyanines as anode buffer layers. J. Mater. Chem. C 2016, 4, 7377–7382. [Google Scholar] [CrossRef]
  6. Lee, H.; Lee, J.; Yi, Y.; Cho, S.W.; Kim, J.W. Anomalous hole injection deterioration of organic light-emitting diodes with a manganese phthalocyanine layer. J. Appl. Phys. 2015, 117, 035503. [Google Scholar] [CrossRef]
  7. Aziz, F.; Sayyad, M.H.; Sulaiman, K.; Majlis, B.H.; Karimov, K.S.; Ahmad, Z.; Sugandi, G. Influence of humidity conditions on the capacitive and resistive response of an Al/VOPc/Pt co-planar humidity sensor. Meas. Sci. Technol. 2012, 23, 069501. [Google Scholar] [CrossRef]
  8. Aziz, F.; Sayyad, M.H.; Karimov, K.S.; Saleem, M.; Ahmad, Z.; Khan, S.M. Characterization of vanadyl phthalocyanine based surface-type capacitive humidity sensors. J. Semicond. 2010, 31, 114002. [Google Scholar] [CrossRef]
  9. Aziz, F.; Sulaiman, K.; Karimov, K.S.; Muhammad, M.R.; Sayyad, M.H.; Majlis, B.Y. Investigation of Optical and Humidity-Sensing Properties of Vanadyl Phthalocyanine-Derivative Thin Films. Mol. Cryst. Liq. Cryst. 2012, 566, 22–32. [Google Scholar] [CrossRef]
  10. Azmer, M.I.; Zafar, Q.; Ahmad, Z.; Sulaiman, K.; Karimov, K.S. VOPcPhO based organic pressure sensor and displacement transducer. Synth. Met. 2014, 191, 120–125. [Google Scholar] [CrossRef]
  11. Fatima, N.; Aziz, F.; Ahmad, Z.; Najeeb, M.A.; Azmeer, M.I.; Karimov, K.S.; Ahmed, M.M.; Basheer, S.; Shakoor, R.A.; Sulaiman, K. Compositional engineering of the pi-conjugated small molecular VOPcPhO: Alq 3 complex to boost humidity sensing. RSC Adv. 2017, 7, 19780–19786. [Google Scholar] [CrossRef] [Green Version]
  12. Azmer, M.I.; Aziz, F.; Ahmad, Z.; Raza, E.; Najeeb, M.A.; Fatima, N.; Bawazeer, T.M.; Alsoufi, M.S.; Shakoor, R.A.; Sulaiman, K. Compositional engineering of VOPcPhO-TiO2 nano-composite to reduce the absolute threshold value of humidity sensors. Talanta 2017, 174, 279–284. [Google Scholar] [CrossRef] [PubMed]
  13. Ahmad, Z.; Sayyad, M.H.; Wahab, F.; Sulaiman, K.; Shahid, M.; Chaudry, J.A.; Munawar, M.A.; Aziz, F. Enhancement of electronic and charge transport properties of NiPc by potassium-tetrasulpho group. Phys. B Condens. Matter 2013, 413, 21–23. [Google Scholar] [CrossRef]
  14. Wahab, F.; Sayyad, M.H.; Nawaz Khan, D.; Tahir, M.; Aziz, F.; Shahid, M.; Ali Munawar, M.; Anwar Chaudry, J. Electrical characterization of cobalt phthalocyanine/p-silicon heterojunction. Mater. Sci. Semicond. Process. 2014, 26, 101–106. [Google Scholar] [CrossRef]
  15. Wahab, F.; Sayyad, M.H.; Tahir, M.; Khan, D.N.; Aziz, F.; Shahid, M.; Munawar, M.A.; Chaudry, J.A.; Khan, G. Electrical characterization of cobalt phthalocyanine/n-Si heterojunction. Synth. Met. 2014, 198, 175–180. [Google Scholar] [CrossRef]
  16. Aziz, F.; Sulaiman, K.; Al-Rawi, W.K.; Ahmad, Z.; Sayyad, M.H.; Karimov, K.S.; Wei, L.L.; Tahir, M. Enhancement of electrical properties of vanadyl phthalocyanine derivative by PCBM. Pigment Resin Technol. 2015, 44, 148–156. [Google Scholar] [CrossRef]
  17. Peumans, P.; Bulović, V.; Forrest, S.R. Efficient photon harvesting at high optical intensities in ultrathin organic double-heterostructure photovoltaic diodes. Appl. Phys. Lett. 2000, 76, 2650–2652. [Google Scholar] [CrossRef]
  18. Pfeiffer, M.; Beyer, A.; Plönnigs, B.; Nollau, A.; Fritz, T.; Leo, K.; Schlettwein, D.; Hiller, S.; Wöhrle, D. Controlled p-doping of pigment layers by cosublimation: Basic mechanisms and implications for their use in organic photovoltaic cells. Sol. Energy Mater. Sol. Cells 2000, 63, 83–99. [Google Scholar] [CrossRef]
  19. Yoon, S.M.; Lou, S.J.; Loser, S.; Smith, J.; Chen, L.X.; Facchetti, A.; Marks, T. Fluorinated Copper Phthalocyanine Nanowires for Enhancing Interfacial Electron Transport in Organic Solar Cells. Nano Lett. 2012, 12, 6315–6321. [Google Scholar] [CrossRef]
  20. Kaur, N.; Singh, M.; Pathak, D.; Wagner, T.; Nunzi, J.M. Organic materials for photovoltaic applications: Review and mechanism. Synth. Met. 2014, 190, 20–26. [Google Scholar] [CrossRef]
  21. Rajaputra, S.; Vallurupalli, S.; Singh, V.P. Copper phthalocyanine based Schottky diode solar cells. J. Mater. Sci. Mater. Electron. 2007, 18, 1147–1150. [Google Scholar] [CrossRef]
  22. Tang, C.W. Two-layer organic photovoltaic cell. Appl. Phys. Lett. 1986, 48, 183–185. [Google Scholar] [CrossRef]
  23. Yakimov, A.; Forrest, S.R. High photovoltage multiple-heterojunction organic solar cells incorporating interfacial metallic nanoclusters. Appl. Phys. Lett. 2002, 80, 1667–1669. [Google Scholar] [CrossRef]
  24. Khalil, S.; Tazarki, H.; Souli, M.; Guasch, C.; Jamoussi, B.; Kamoun, N. Synthesis and characterization of novel 4-Tetra-4-Tolylsulfonyl ZnPc thin films for optoelectronic applications. Appl. Surf. Sci. 2017, 421, 205–212. [Google Scholar] [CrossRef]
  25. Günes, S.; Neugebauer, H.; Sariciftci, N.S. Conjugated Polymer-Based Organic Solar Cells. Chem. Rev. 2007, 107, 1324–1338. [Google Scholar] [CrossRef] [PubMed]
  26. Ramos, T.; Medeiros Júnior, M.F.; Pinheiro, R.; Medeiros, A. Slip Control of a Squirrel Cage Induction Generator Driven by an Electromagnetic Frequency Regulator to Achieve the Maximum Power Point Tracking. Energies 2019, 12, 2100. [Google Scholar] [CrossRef] [Green Version]
  27. Cid, J.-J.; García-Iglesias, M.; Yum, J.-H.; Forneli, A.; Albero, J.; Martínez-Ferrero, E.; Vázquez, P.; Grätzel, M.; Nazeeruddin, M.K.; Palomares, E.; et al. Structure-Function Relationships in Unsymmetrical Zinc Phthalocyanines for Dye-Sensitized Solar Cells. Chem. A Eur. J. 2009, 15, 5130–5137. [Google Scholar] [CrossRef]
  28. Yum, J.-H.; Jang, S.; Humphry-Baker, R.; Grätzel, M.; Cid, J.-J.; Torres, T.; Nazeeruddin, M.K. Effect of Coadsorbent on the Photovoltaic Performance of Zinc Pthalocyanine-Sensitized Solar Cells. Langmuir 2008, 24, 5636–5640. [Google Scholar] [CrossRef]
  29. Li, G.; Tang, J.; Tang, R. Performance and Design Optimization of a One-Axis Multiple Positions Sun-Tracked V-trough for Photovoltaic Applications. Energies 2019, 12, 1141. [Google Scholar] [CrossRef] [Green Version]
  30. Senthilarasu, S.; Velumani, S.; Sathyamoorthy, R.; Subbarayan, A.; Ascencio, J.A.; Canizal, G.; Sebastian, P.J.; Chavez, J.A.; Perez, R. Characterization of zinc phthalocyanine (ZnPc) for photovoltaic applications. Appl. Phys. A 2003, 77, 383–389. [Google Scholar] [CrossRef]
  31. Parthasarathy, B. Fabrication and Characterization Of CuPc Based Organic Solar Cells. Master’s Thesis, University of Kentucky, Lexington, KY, USA, 2005. [Google Scholar]
  32. Loutfy, R.O.; Sharp, J.H.; Hsiao, C.K.; Ho, R. Phthalocyanine organic solar cells: Indium/x-metal free phthalocyanine Schottky barriers. J. Appl. Phys. 1981, 52, 5218–5230. [Google Scholar] [CrossRef]
  33. Chou, C.-T.; Lin, C.-H.; Wu, M.-H.; Cheng, T.-W.; Lee, J.-H.; Liu, C.-H.J.; Tai, Y.; Chattopadhyay, S.; Wang, J.-K.; Chen, K.-H.; et al. Tuning open-circuit voltage in organic solar cells by magnesium modified Alq3. J. Appl. Phys. 2011, 110, 083104. [Google Scholar] [CrossRef] [PubMed] [Green Version]
  34. El-Nahass, M.M.; Zeyada, H.M.; Aziz, M.S.; El-Ghamaz, N.A. Structural and optical properties of thermally evaporated zinc phthalocyanine thin films. Opt. Mater. 2004, 27, 491–498. [Google Scholar] [CrossRef]
  35. Tallapally, V.; Nakagawara, T.A.; Demchenko, D.O.; Özgür, Ü.; Arachchige, I.U. Ge1-:XSnx alloy quantum dots with composition-tunable energy gaps and near-infrared photoluminescence. Nanoscale 2018, 10, 20296–20305. [Google Scholar] [CrossRef] [PubMed]
  36. Novotný, M.; Šebera, J.; Bensalah-Ledoux, A.; Guy, S.; Bulíř, J.; Fitl, P.; Vlček, J.; Zákutná, D.; Marešová, E.; Hubík, P.; et al. The growth of zinc phthalocyanine thin films by pulsed laser deposition. J. Mater. Res. 2016, 31, 163–172. [Google Scholar] [CrossRef]
  37. Tallapally, V.; Esteves, R.J.A.; Nahar, L.; Arachchige, I.U. Multivariate Synthesis of Tin Phosphide Nanoparticles: Temperature, Time, and Ligand Control of Size, Shape, and Crystal Structure. Chem. Mater. 2016, 28, 5406–5414. [Google Scholar] [CrossRef]
  38. Senthilarasu, S.; Hahn, Y.B.; Lee, S.H. Structural analysis of zinc phthalocyanine (ZnPc) thin films: X-ray diffraction study. J. Appl. Phys. 2007, 102, 43512. [Google Scholar] [CrossRef]
  39. Gaffo, L.; Cordeiro, M.R.; Freitas, A.R.; Moreira, W.C.; Girotto, E.M.; Zucolotto, V. The effects of temperature on the molecular orientation of zinc phthalocyanine films. J. Mater. Sci. 2010, 45, 1366–1370. [Google Scholar] [CrossRef]
  40. Zanfolim, A.A.; Volpati, D.; Olivati, C.A.; Job, A.E.; Constantino, C.J.L. Structural and Electric-Optical Properties of Zinc Phthalocyanine Evaporated Thin Films: Temperature and Thickness Effects. J. Phys. Chem. C 2010, 114, 12290–12299. [Google Scholar] [CrossRef]
  41. Tucci, M.; Caputo, D. Study of capacitance in hydrogenated amorphous silicon phototransistors for imaging arrays. J. Non. Cryst. Solids 2004, 338, 780–783. [Google Scholar] [CrossRef]
  42. Sharma, G.D.; Saxena, D.; Roy, M.S. Dark, photoelectrical properties and impedance analysis of organic semiconductor based donor/acceptor device. Thin Solid Film. 2004, 467, 220–226. [Google Scholar] [CrossRef]
  43. Kılıçoğlu, T. Effect of an organic compound (Methyl Red) interfacial layer on the calculation of characteristic parameters of an Al/Methyl Red/p-Si sandwich Schottky barrier diode. Thin Solid Film. 2008, 516, 967–970. [Google Scholar] [CrossRef]
  44. Janardhanam, V.; Ashok Kumar, A.; Rajagopal Reddy, V.; Narasimha Reddy, P. Study of current-voltage-temperature (I–V–T) and capacitance-voltage-temperature (C–V–T) characteristics of molybdenum Schottky contacts on n-InP (1 0 0). J. Alloys Compd. 2009, 485, 467–472. [Google Scholar] [CrossRef]
  45. Varghese, A.C.; Menon, C.S. Electrical Properties of Nickel Phthalocyanine Thin Films Using Gold and Lead Electrodes. J. Mater. Sci. Mater. Electron. 2006, 17, 149–153. [Google Scholar] [CrossRef]
  46. Shah, M.; Sayyad, M.H.; Karimov, K.S.; Maroof-Tahir, M. Investigation of the electrical properties of a surface-type Al/NiPc/Ag Schottky diode using I–V and C–V characteristics. Phys. B Condens. Matter 2010, 405, 1188–1192. [Google Scholar] [CrossRef]
  47. Yakuphanoglu, F. Photovoltaic properties of hybrid organic/inorganic semiconductor photodiode. Synth. Met. 2007, 157, 859–862. [Google Scholar] [CrossRef]
  48. Farag, A.A.M.; Osiris, W.G.; Yahia, I.S. Photovoltaic performance analysis of organic device based on PTCDA/n-Si heterojunction. Synth. Met. 2011, 161, 1805–1812. [Google Scholar] [CrossRef]
  49. Tahir, M.; Sayyad, M.H.; Wahab, F.; Khan, D.N.; Aziz, F. The electrical characterization of Ag/PTCDA/PEDOT:PSS/p-Si Schottky diode by current–voltage characteristics. Phys. B Condens. Matter 2013, 415, 77–81. [Google Scholar] [CrossRef]
  50. Farag, A.A.M.; Yahia, I.S.; Wojtowicz, T.; Karczewski, G. Influence of temperature and illumination on the electrical properties of p-ZnTe/n-CdTe heterojunction grown by molecular beam epitaxy. J. Phys. D Appl. Phys. 2010, 43, 215102. [Google Scholar] [CrossRef]
  51. Nogueira, A.F.; Montanari, I.; Nelson, J.; Durrant, J.R.; Winder, C.; Sariciftci, N.S.; Brabec, C.J. Charge Recombination in Conjugated Polymer/Fullerene Blended Films Studied by Transient Absorption Spectroscopy. J. Phys. Chem. B 2003, 107, 1567–1573. [Google Scholar] [CrossRef]
  52. Yang, H.; Song, Q.; Lu, Z.; Guo, C.; Gong, C.; Hu, W.; Li, C.M. Electrochemically polymerized nanostructured poly(3.4-ethylenedioxythiophene)-poly(styrenesulfonate) buffer layer for a high performance polymer solar cell. Energy Environ. Sci. 2010, 3, 1580. [Google Scholar] [CrossRef]
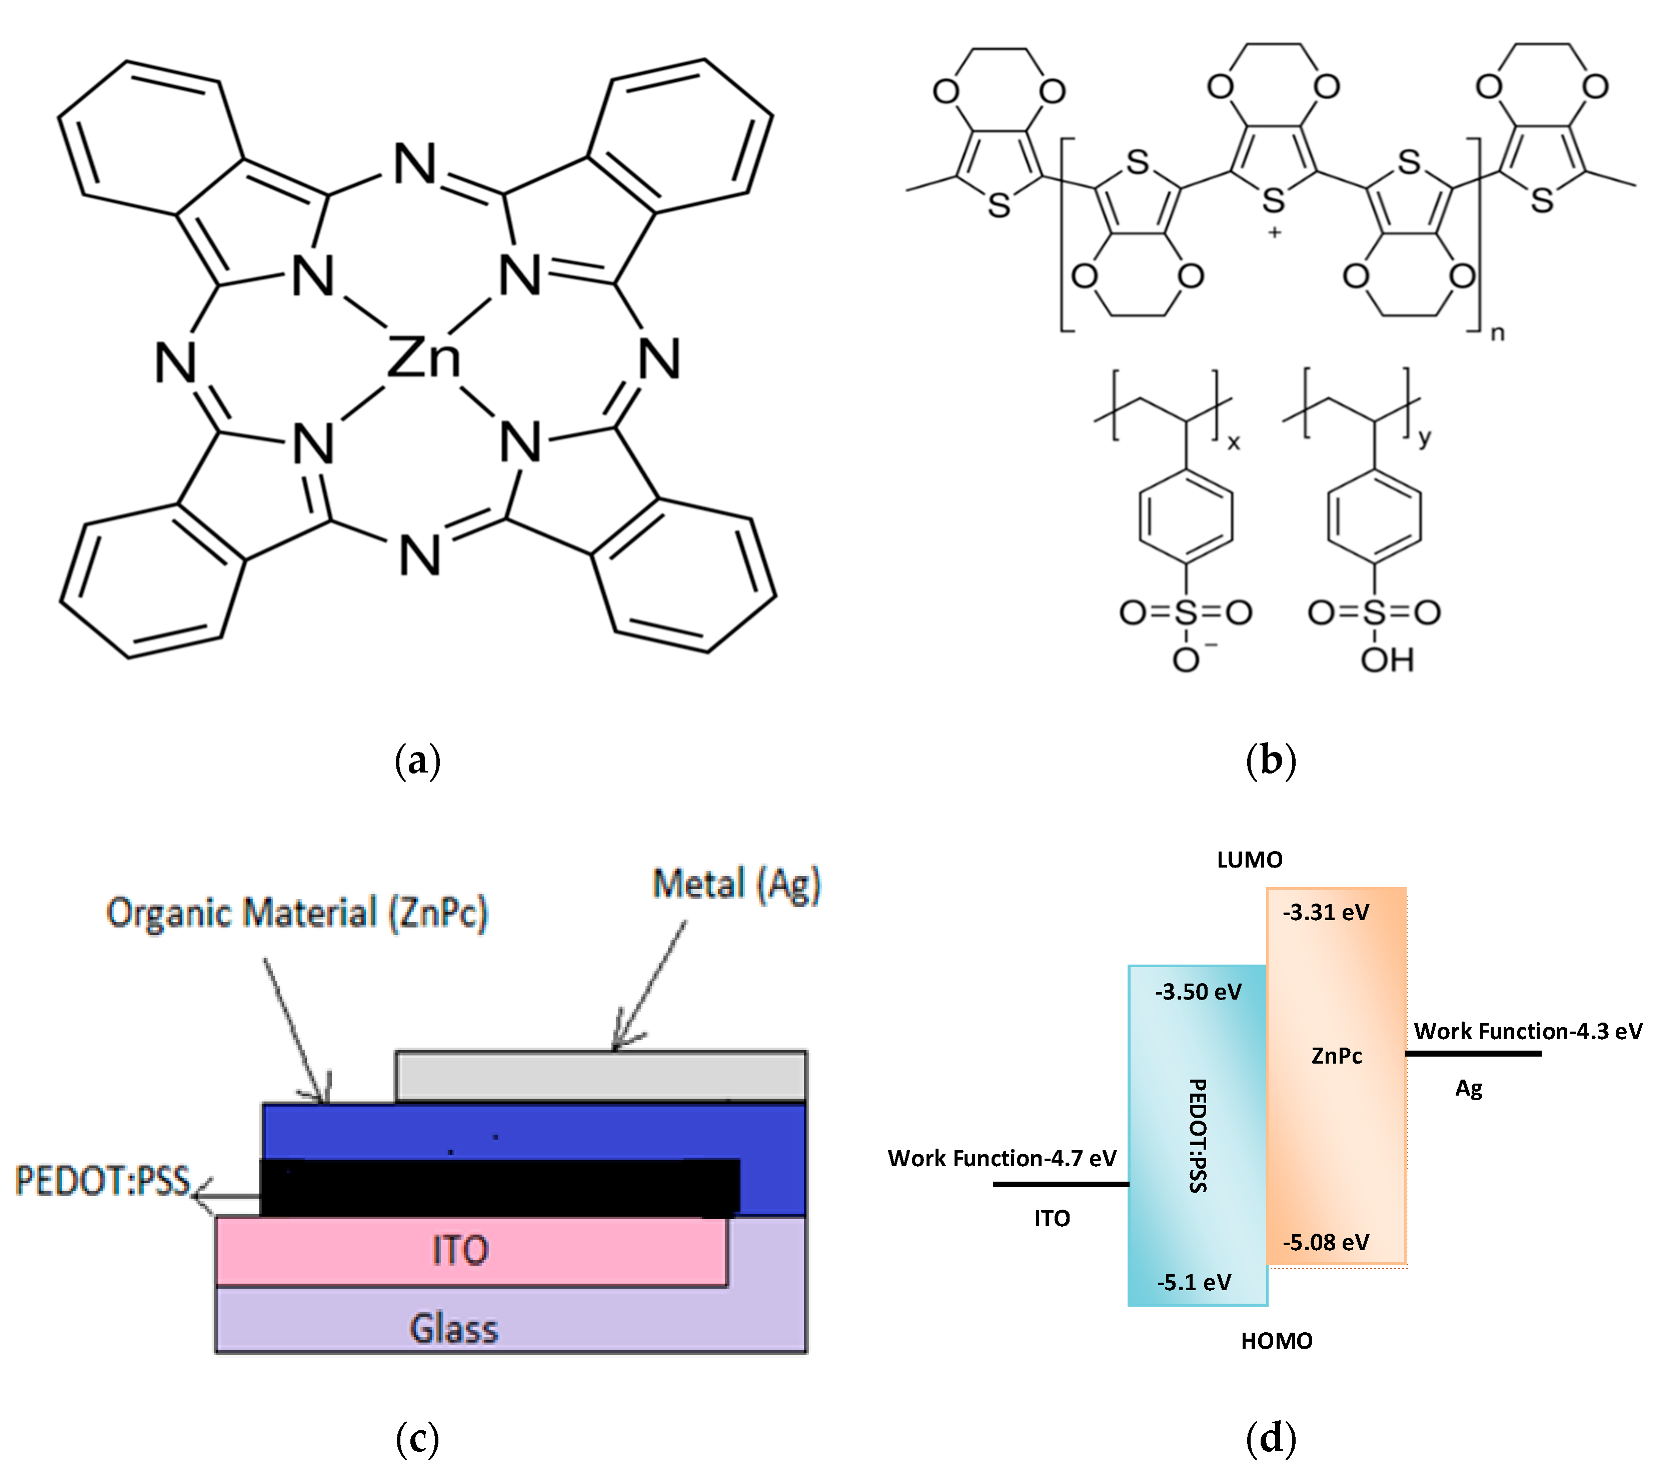
Figure 1. (a) Molecular structure of ZnPc; (b) molecular structure of PEDOT:PSS; (c) ZnPc based solar cell architecture; (d) energy band diagram of ITO/PEDOT:PSS/ZnPc/Ag solar cell.
Energies 13 00962 g001
Figure 2. SEM micrographs of ZnPc thin films at (a) low, (b) high resolutions. (c) EDS of ZnPc thin film.
Energies 13 00962 g002
Figure 3. 3-D AFM image of ZnPc thin film.
Energies 13 00962 g003
Figure 4. (a) UV-vis spectrum, (b) Tauc’s plot for energy bandgap calculation, (c) XRD pattern and (d) FTIR spectrum of ZnPc thin film evaporated at room temperature.
Energies 13 00962 g004aEnergies 13 00962 g004b
Figure 5. (a) I-V characteristics of Ag/ZnPc/PEDOT:PSS/ITO solar cell under dark, (b) semi-log I-V characteristics, (c) Junction resistance, Rs, versus Voltage and (d) log I-log V curve for ZnPc based device.
Energies 13 00962 g005aEnergies 13 00962 g005b
Figure 6. J-V characteristics of ZnPc Schottky solar cell under STC.
Energies 13 00962 g006
Figure 7. EQE characteristics of ZnPc/PEDOT:PSS/ITO device at 0 V.
Energies 13 00962 g007
Table 1. EDS details of ZnPc.
ElementC KO KSi KZn KTotal
Weight %24.7739.2135.730.29100
Atomic %35.6342.3321.970.08
Table 2. Assignments of the Main FTIR Bands for ZnPc thin film.
Peaks (cm−1)Assignment
721Out-of-Plane C-H Bend
751In-Plane C-H Bend
886Out-of-Plane C-H Bend
1057In-Plane C-H Bend
1084In-Plane C-H Bend
1116In-Plane C-H Bend
1165In-Plane C-H Bend
1285In-Plane C-H Bend
1329In-Plane Pyrrole Stretch
1408Isoindole Stretch
1484C-C Benzene Stretch
1522C-C Benzene Stretch
1606C-C Benzene Stretch
1722C-H Stretch
Table 3. Comparison of device parameters of ZnPc Schottky solar cell with previously fabricated single layer solar cells.
Phthalocyanine FilmRRVOC (V)JSC (mA/cm2)(FF)PCE (%)Reference
VOPcPhO3.120.6215.26 × 10−30.331.08 × 10−3[3]
CuPc 0.79 × 10−30.311.93 × 10−3[31]
ZnPc1460.555.010.481.28 ± 0.05Present work