Article

Evaluation of the Potential of Biomass to Energy in Portugal—Conclusions from the CONVERTE Project

1
Unidade de Bioenergia, Laboratório Nacional de Energia e Geologia-LNEG, I.P., 1649-038 Lisboa, Portugal
2
MEtRICs, Departamento de Ciências e Tecnologia da Biomassa, Faculdade de Ciências e Tecnologia, Universidade Nova de Lisboa, 2829-516 Caparica, Portugal
3
Unidade de Informação Geocientífica, Laboratório Nacional de Energia e Geologia-LNEG, I.P., 2610-999 Amadora, Portugal
*
Author to whom correspondence should be addressed.
Energies 2020, 13(4), 937; https://doi.org/10.3390/en13040937
Submission received: 31 December 2019 / Revised: 7 February 2020 / Accepted: 13 February 2020 / Published: 21 February 2020

Abstract

:
The main objective of the Portuguese project “CONVERTE-Biomass Potential for Energy” is to support the transition to a low-carbon economy, identifying biomass typologies in mainland Portugal, namely agri-forest waste, energy crops and microalgae. Therefore, the aim was to design and construct a georeferenced (mapping) database for mainland Portugal, to identify land availability for the implementation of energy crops and microalgae cultures, and to locate agricultural and forestry production areas (including their residues) with potential for sustainable exploitation for energy. The ArcGIS software was used as a Geographic Information System (GIS) tool, introducing the data corresponding to the type of soil, water needs and edaphoclimatic conditions in shapefile and raster data type, to assess the areas for the implantation of the biomass of interest. After analysing the data of interest in each map in ArcGIS, the intersection of all maps is presented, suggesting adequate areas and predicting biomass productions for the implementation of each culture in mainland Portugal. Under the conditions of the study, cardoon (72 kha, 1085 kt), paulownia (81 kha, 26 kt) and microalgae (29 kha, 1616 kt) presented the greater viability to be exploited as biomass to energy in degraded and marginal soils.

Graphical Abstract

1. Introduction

In the past few years, a significant increase in the demand for agricultural species for biofuels production that compete with the food and feed sectors have been reported, such as, starch-rich crops (corn, wheat, barley, oats as well as tubers and roots such as sweet potatoes, yams, cassava and potatoes), sugar-rich crops (sorghum, sugar beet and sugar cane) and oil-rich crops (sunflower, soybean, coconut, palm, sesame and olive), increasing the pressure on suitable soils for agriculture [1]. To avoid the risk of conflicts on land use due to competition for food and feed, it is necessary to limit and even prohibit the use of land presenting high carbon stock for the implementation of non-food crops or directed to the production of energy. The greater relevance is to utilize uncultivated land (or wasteland) and degraded soils that are not implemented in conventional agriculture [2].
Portuguese Decree-Law n. 152-C/2017 (created from European Directive 2015/1513), highlights the need to reduce the use of conventional biofuels obtained from food raw materials and from species grown on agricultural land or land with a high organic load. Another principle is to encourage the promotion, production and use of advanced biofuels for energy production obtained from waste, wood-pulp materials (forest biomass including their waste), non-food cellulosic material such as waste derived from agricultural food species (straw, stover, husks and shells) or grassy species (miscanthus, ryegrass, arundinaria gigantean, panicum), waste from human and animal food sector and, finally, algae [3]. These types of feedstocks can be used in thermochemical conversion technologies such as gasification, combustion, pyrolysis and hydrothermal liquefaction and in biochemical conversion technologies such as fermentation for the production of bioethanol, biogas, biohydrogen or biodiesel.
Portugal is a country characterized by 39% of forests, 26.3% of agriculture-based land, 12.4% of bush and 8% of agroforestry systems, with the remainder corresponding to pastures (6.5%), artificial territories (5.1%) and other (2.7%) (data obtained from the Portuguese Carta de Ocupação do Solo or Land Use Mapping (COS 2015) for the continental territory, developed by the Direção-Geral do Território, DGT) [4]. Considering those values, it can be said that Portugal is a biomass producer because most of its territory (more than 85%) is covered by vegetation, utilized in several economic sectors, including the production of biofuels and others forms of energy such as electricity and heat [4]. In Portugal, the installed power derived from biomass in July 2015, with and without cogeneration, was 474 MW, including those obtained from the use of agricultural waste, forest waste, and pulp and paper industry waste [5]. According to Ferreira and colaborators (2017) [6], the total biomass resources potential estimated for the country in 2017 was of 42,489.7 GW h/year, and Portugal intends to have 60% of its generated electricity coming from renewable resources by 2020, in order to satisfy 31% of its final energy consumption by the same year. However, the current biomass status is not enough to reach this target. Energy crops and microalgae are considered a good option to cover the existing deficit. However, in Portuguese territory the production of dedicated crops for energy is negligible and more studies and investment in R&D are needed, and the same applies for microalgae production for energy.
In order to identify suitable areas for the implementation of energy crops and microalgae, it is necessary to take advantage of geographic information science through the ArcGIS software of the Geographic Information System (GIS), developed by ESRI (Environmental Systems Research Institute). It is characterized by a multiplicity of functions such as the capture, collection, measurement, storage, organization, modeling, editing, analysis, treatment, mapping, sharing and publication of data with relevant information of potential zones for the planting of energy crops and microalgae production according to certain parameters, such as the type of area, soil, water needs and edaphoclimatic conditions. For these reasons, geo-referencing is fundamental and must be integrated in studies that promote the development of biomass for energy, so that productivities can be accurately estimated to help model the potential of bioenergy production.
The main objective of the Portuguese Project “CONVERTE-Biomass Potential for Energy” was to support the transition to a low-carbon economy, identifying the existing and still to be explored biomass typologies in mainland Portugal, namely urban waste, industrial waste (such as agro-food waste including sludge from wastewater treatment plants) and energy crops and microalgae. Therefore, the aim of this work is to present the design and construction of georeferenced databases (mapping) in mainland Portugal to evaluate areas/soils for the implementation of energy crops, areas/soils/waters for microalgae production and areas of cultivated agricultural/silvicultural species (including their residues) with energy potential. To our knowledge, no such studies have merged these three types of biomass in the same work. Moreover, in the construction of those maps, the focus will be on the cultivation of energy crops and microalgae production with low indirect land-use change-risk, taking into account also its sustainable use (environmental, social and economical).

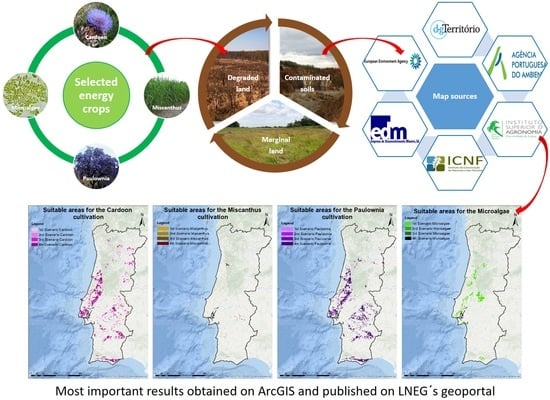
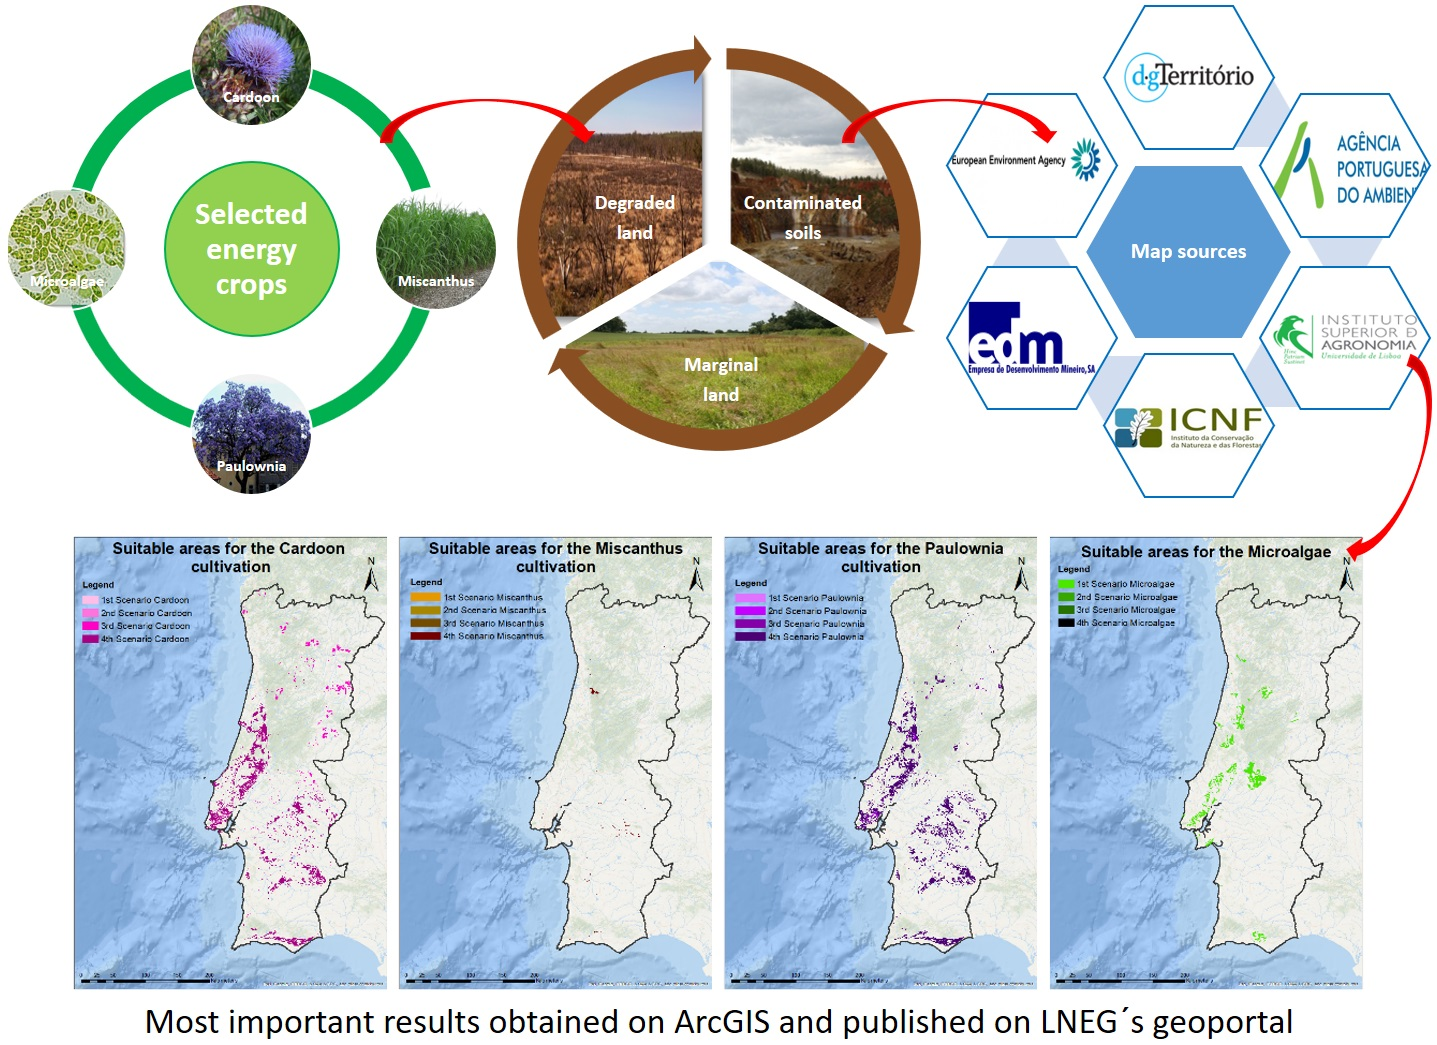
2. Materials and Methods

The database for georeferenced mapping of the mainland territory, to evaluate areas of potential interest for the cultivation of energy crops, microalgae, as well as to map the cultivated agricultural/silvicultural species (including their residues), was created with ArcGIS software, a tool for GIS.
The applied methodology was:
  • To select the energy crops to implement in the mainland Portugal;
  • To search which types of soils are of interest and present a low ILUC (indirect land-use change) risk;
  • To search and download all colletected maps finded in shapefile or raster format from official websites of Portuguese Institutions like Agência Portuguesa do Ambiente (APA), Instituto Superior de Agronomia da Universidade de Lisboa (ISA-UL), Instituto da Conservação da Natureza e das Florestas (ICNF), Empresa de Desenvolvimento Mineiro (EDM) and European Institutions too as the European Environment Agency (EEA);
  • To create the georeferenced databases on ArcGIS, an ArcMAP document (tool of ArcGIS software) has to be created for each chosen culture, introducing only the selected maps for specif properties and/or attributes of interest such as temperature, precipitation, frost, land steepness, soil texture, soil pH, soil thickness, presence of physical obstacles, ecological soil value, current permeability, natural and semi-natural vegetation with conservation value, soil-morphological aptitude to irrigated agriculture and silviculture, soil susceptibility to desertification, protected areas, land use and land cover (COS 2010 and COS 2015), corine land cover (CLC 2012), contaminated soils, wastewater treatment plant capacity, CO2 production in the energy and industrial sectors in mainland Portugal, among others. Bearing in mind the characteristics of growth and adaptation of each culture combined with the intersection of all maps, output data have been obtained suggesting available and appropriate areas for the cultivation of each culture. The productivity forecasting and predicted bioenergy generation are presented and critically discussed;
  • Lastly, the publication on Laboratório Nacional de Energia e Geologia–LNEG´s spatial data infrastructure, i.e., institutional geoportal of energy and geology, to access all the created maps and related information.
Figure 1 represents a summary of the applied methodology.
Each of one the phases specified in Figure 1 are described in more detail in the following sub-chapters.

2.1. Selected Energy Crops and Microalgae Culture

Energy crops are species intended for biomass production for subsequent generation of energy in the form of biofuels, electricity or heat. These are species that should not compete with those used for food and feed (maize, cereals and tubers, among others) and, therefore, should not be cultivated on high carbon or agricultural land. These crops should be mainly non-food and lignocellulosic species for the production of 2nd-generation fuels [7], which can be divided in two groups:
  • Herbaceous crops: perennial crops which can last for 15 years or longer, being usually harvested annualy. Within this category are species such as switchgrass (Panicum virgatum), reed canary grass (Phalaris arundinacea), giant reed (Arundo donax) [7], perennial ryegrass (Lolium perenne) as well as cardoon (Cynara cardunculus) and miscanthus (Miscanthus x giganteus) [8];
  • Short-rotation coppice: fast-growing woody species that have a short cycle, being cut and regenerated every three to five years to a total of 25 years, with the idea of obtaining high yields in a short time for energy production. Among the species classified within this criterion are eucaliptus (Eucaliptus spp.), willow (Salix spp.), poplar (Populus spp.) [7], among others. paulownia (Paulownia tomentosa) may also be included as a short-cycle species.
The energy crops selected (and also microalgae cultures) and evaluated in the frame of the CONVERTE Project are listed below, explaining the rationale for this selection according to their characteristics, advantages and benefits for the bioenergy production.

2.1.1. Cardoon (Cynara cardunculus)

Cardoon is a perennial and herbaceous plant with a productive life of 10 years (in some cases attaining 15 years) and an annual growing cycle. In the Mediterranean region, the crop presents a productivity of 10 t/ha dry matter (DM) in the first year and between 12 to 15 t/ha DM from the second year, being easily adapted to a wide range of climatic variations [9]. The cardoon is a species native of the Mediterranean basin, that support the drought stress, it can be grown in drylands, being defined as a multifunctional crop due to its characteristics that allow its use for several options, e.g., energy production in the form of biofuels, heat and power, cellulose and pulp and paper, phytochemicals and pharmacological products, among others [10,11]. The cardoon seeds composition presents nearly 24% (dry mass basis) of oil and 5.6% of water. Seeds have been traditionally considered a feedstock for biodiesel production [10]. Moreover, cardoon has shown a low impact on the environment, in the marginal soils of the Mediterranean region, particularly in certain parameters such as landscape diversity, cause of the flowering season, and use of water resources, due to the low water requirements [12]. In addition, cardoon can be irrigated with wastewater to avoid yield drop due to water stress, as it has been tested in a plantation located in Alcázar de San Juan in Spain [13]. In this study it was concluded that no effects were perceived on the energy outputs when cardoon was irrigated with wastewater.
Therefore, this crop was chosen for the study, not only because of its multiple uses but also due to its capacity to support the dry characteristics of the Portuguese summers.

2.1.2. Miscanthus (Miscanthus x giganteus)

Miscanthus is an herbaceous perennial C4 plant, native from East Asia, and long-lasting non-food crop. It is able to reach 3 m of height and produces between 20 to 30 t/ha of dry matter, in Portugal, performing best with a precipitation between 500 and 600 mm per year [9]. The following characteristics have promoted this crop as a sustainable energy crop:
  • It can be cropped with the existing machinery;
  • It requires low levels of fertilizers and presents high levels of carbon sequestration rates when compared with other species;
  • The nitrogen and other nutrients are translocated to the roots and rhizomes, when the crop starts to lignify, thus presenting a high nutrient-use efficiency;
  • It is a species that has a low incidence of plant disease and attack of pests, being considered a non-invasive plant, factor that allows plantation and utilization for energy;
  • It is a species that adapt easily to various types of soils including marginal land [14].
In the last few years, miscanthus has shown a high potential concerning its implementation in marginal land and degraded and contaminated soils. A study was reported in which various miscanthus genotypes (M. x giganteus, M. sinensis and M. floridulus) were evaluated in a soil contaminated with 450 and 900 mg de zinc (Zn)/kg, over two years. In the contaminated soil, the M. sinensis and M. floridulus did not present changes in yields but in the case of M. x giganteus, the production was 20% lower. However, this last genotype presented, even in the contaminated soils, higher yields than the other two species [15]. Moreover, the deep and extensive rooting system of the plant allows this crop to be irrigated with wastewater with success, since the growth and productivity of the species were not affected and the polluting elements were removed from the wastewater by the plants, indicating that this might represent a solution for its cultivation in semi-arid regions with a high scarcity of water [16], such as those of the Mediterranean Region.
Several technologies can be applied to the miscanthus for energy production: heat, electricity or both (combined heat and power, CHP) through combustion in cogeneration systems (its most widespread application in Europe); biogas and bioethanol production [17].
Consequently, miscanthus can be considered a promising crop in mainland Portugal, not only due to the high yields but also due to the lower fertilizer and pesticide requirements. Moreover, the crop presents a good tolerance to a variety of soils, including marginal, contaminated and degraded areas. The major drawback of this crop is the annual water demand which is above 500 mm per year [18,19].

2.1.3. Paulownia (Paulownia tomentosa)

Paulownia tomentosa is a large deciduous hardwood and fast growing tree that is native from China [20]. Paulownia species are found naturally growing and under cultivated conditions at several regions of the world. It quickly spreaded to other parts of Asia, being cultivated in particular in Japan and Korea. Presently, it can also be found mainly in central Europe, north and central America, and Australia. Its main uses are industrial applications of the wood, due to its high ignition point, as well as to its dimensional stability and life time maintenance its characteristics [21].
Paulownia tomentosa is widely studied and utilized for the rehabilitation of contaminated soils and abandoned agricultural soils with low water needs, adapting itself to a great variety of climatic conditions and diversity of soils. It helps, too, in soil recuperation and stabilization including erosion control [22]. In Portugal, the Government recommends its afforestation in “Annex II-Non-indigenous species with interest for afforestation” of Decree-Law n. ° 565/99, being a non-indigenous species, with non-invasive character [23]. Concerning the growth, it was found that in a period of only 5–7 years after planting 2000 trees/ha under favorable conditions a significant annual production of 150–300 tons of wood was achieved [24]. Due to its high cellulose content, paulownia has shown its feasibility for use in the pulp industry and in lignin applications, combining both delignification and auto hydrolysis processes [25,26]. A wood analysis showed a composition of 50.55% cellulose, 13.6% hemicellulose, 21.36% lignin, 14% extractable and only 0.49% ash [27]. The energetic valorization of paulownia may be through its direct use as solid biomass for the production of heat and electricity or as a raw material to second generation advanced biofuels, such as bioethanol [28,29]. For those reasons, paulownia was included in this list of options for bioenergy in Portugal.

2.1.4. Microalgae Culture

Microalgae are single-cell photosynthetic micro-organisms mainly found (but not only) in aquatic environments. These organisms are able to synthetise important amounts of lipids, proteins, carbohydrates as well as other compounds with biological activity in a very short timeframe from three basic ingredients: solar radiation, carbon dioxide (CO2) and fertilizers/nutrient-rich water. Microalgae have been reported over a long time to be very important in the biofixation and storage of CO2, as a way to neutralize the huge production and release of greenhouse gases (GHG) worldwide, derived from the enormous use of fossil fuels at various scales, including the industrial sector. The several benefits of microalgae biomass as a feedstock for biofuel production compared to traditional biomass resources are listed as follows:
  • Microalgae have a fast growth rate (short biomass duplication time) compared to land-based crops and could be harvested the whole year, even daily. They are able to double their biomass in less than 24 h. Remarkably, some species can even double their biomass in periods shorter than 3.5 h [30];
  • The photosynthetic machinery in microalgae is analogous to higher plants, but present a higher photosynthetic efficiency (about 4–7.5%) compared to 0.5% for land-based cultures [31];
  • Microalgae cultivation requires less water and land resources than terrestrial crops. Water quality and salinity do not create any problems, it being possible to use brackish, sea or freshwater and non-arable land (even rocky and/or sandy areas) minimizing the environmental impacts, while not compromising the production of food crops [32], even very steep land is not a problem as photobioreactors can be tilted at any angle or even placed vertically;
  • Microalgae can obtain nutrients (such as nitrogen and phosphorus) from wastewater, while providing treatment to domestic, food and agro-industrial effluents among others [32];
  • Microalgae are able of biofixing CO2 from the atmosphere, but may also utilize anthropogenic CO2 emissions from power stations and other industries. Typically, 1 kg of microalgae is produced from the biofixation of, at least, 1.83 kg of CO2 [31];
  • Microalgae biomass can be converted into a wide range of valued products such as food, feed, nutraceuticals, cosmetics, and fuels such as biodiesel, gasoline, jet fuel, hydrogen, aviation gas, and bioethanol, among others. The leftover biomass may be recycled to be further used as feed or fertilizer [31];
  • The microalgal biochemical composition can be changed simply through the variation (manipulation) of culture conditions [32].
Different microalgae were previously studied concerning their biofuel production potential. The conversion route and technology depend on different parameters such as the biomass composition, selected biofuel product, operating conditions, process time and production cost, in order to assure either economically viability or environmental sustainability.
Table 1 and Table 2 resumes the main characteristics of each type of selected and studied biomass (including microalgae).
The use of energy crops and microalgae for bioenergy presents some opportunities for rural areas, such as employment generation, land recuperation from an abandonment state, rural development especially of isolated regions, increased income for farmers and economic benefits for companies or entities with an interest in developing or using these species for the production of bioenergy. Yet, implementation of these biomasses can also lead to some constraints. For this reason, some steps have to be taken before implementation of such projects:
  • To study the areas where the species will be cultivated, so as not to generate negative impacts;
  • To analyze specific areas considered sensitive within the zones of interest as a form of protection;
To study the possibility of the implementation of crops in an intercalated form of species with different ages or of several other typologies, given the rotation of these, and avoid extensive use and massive soil damage.

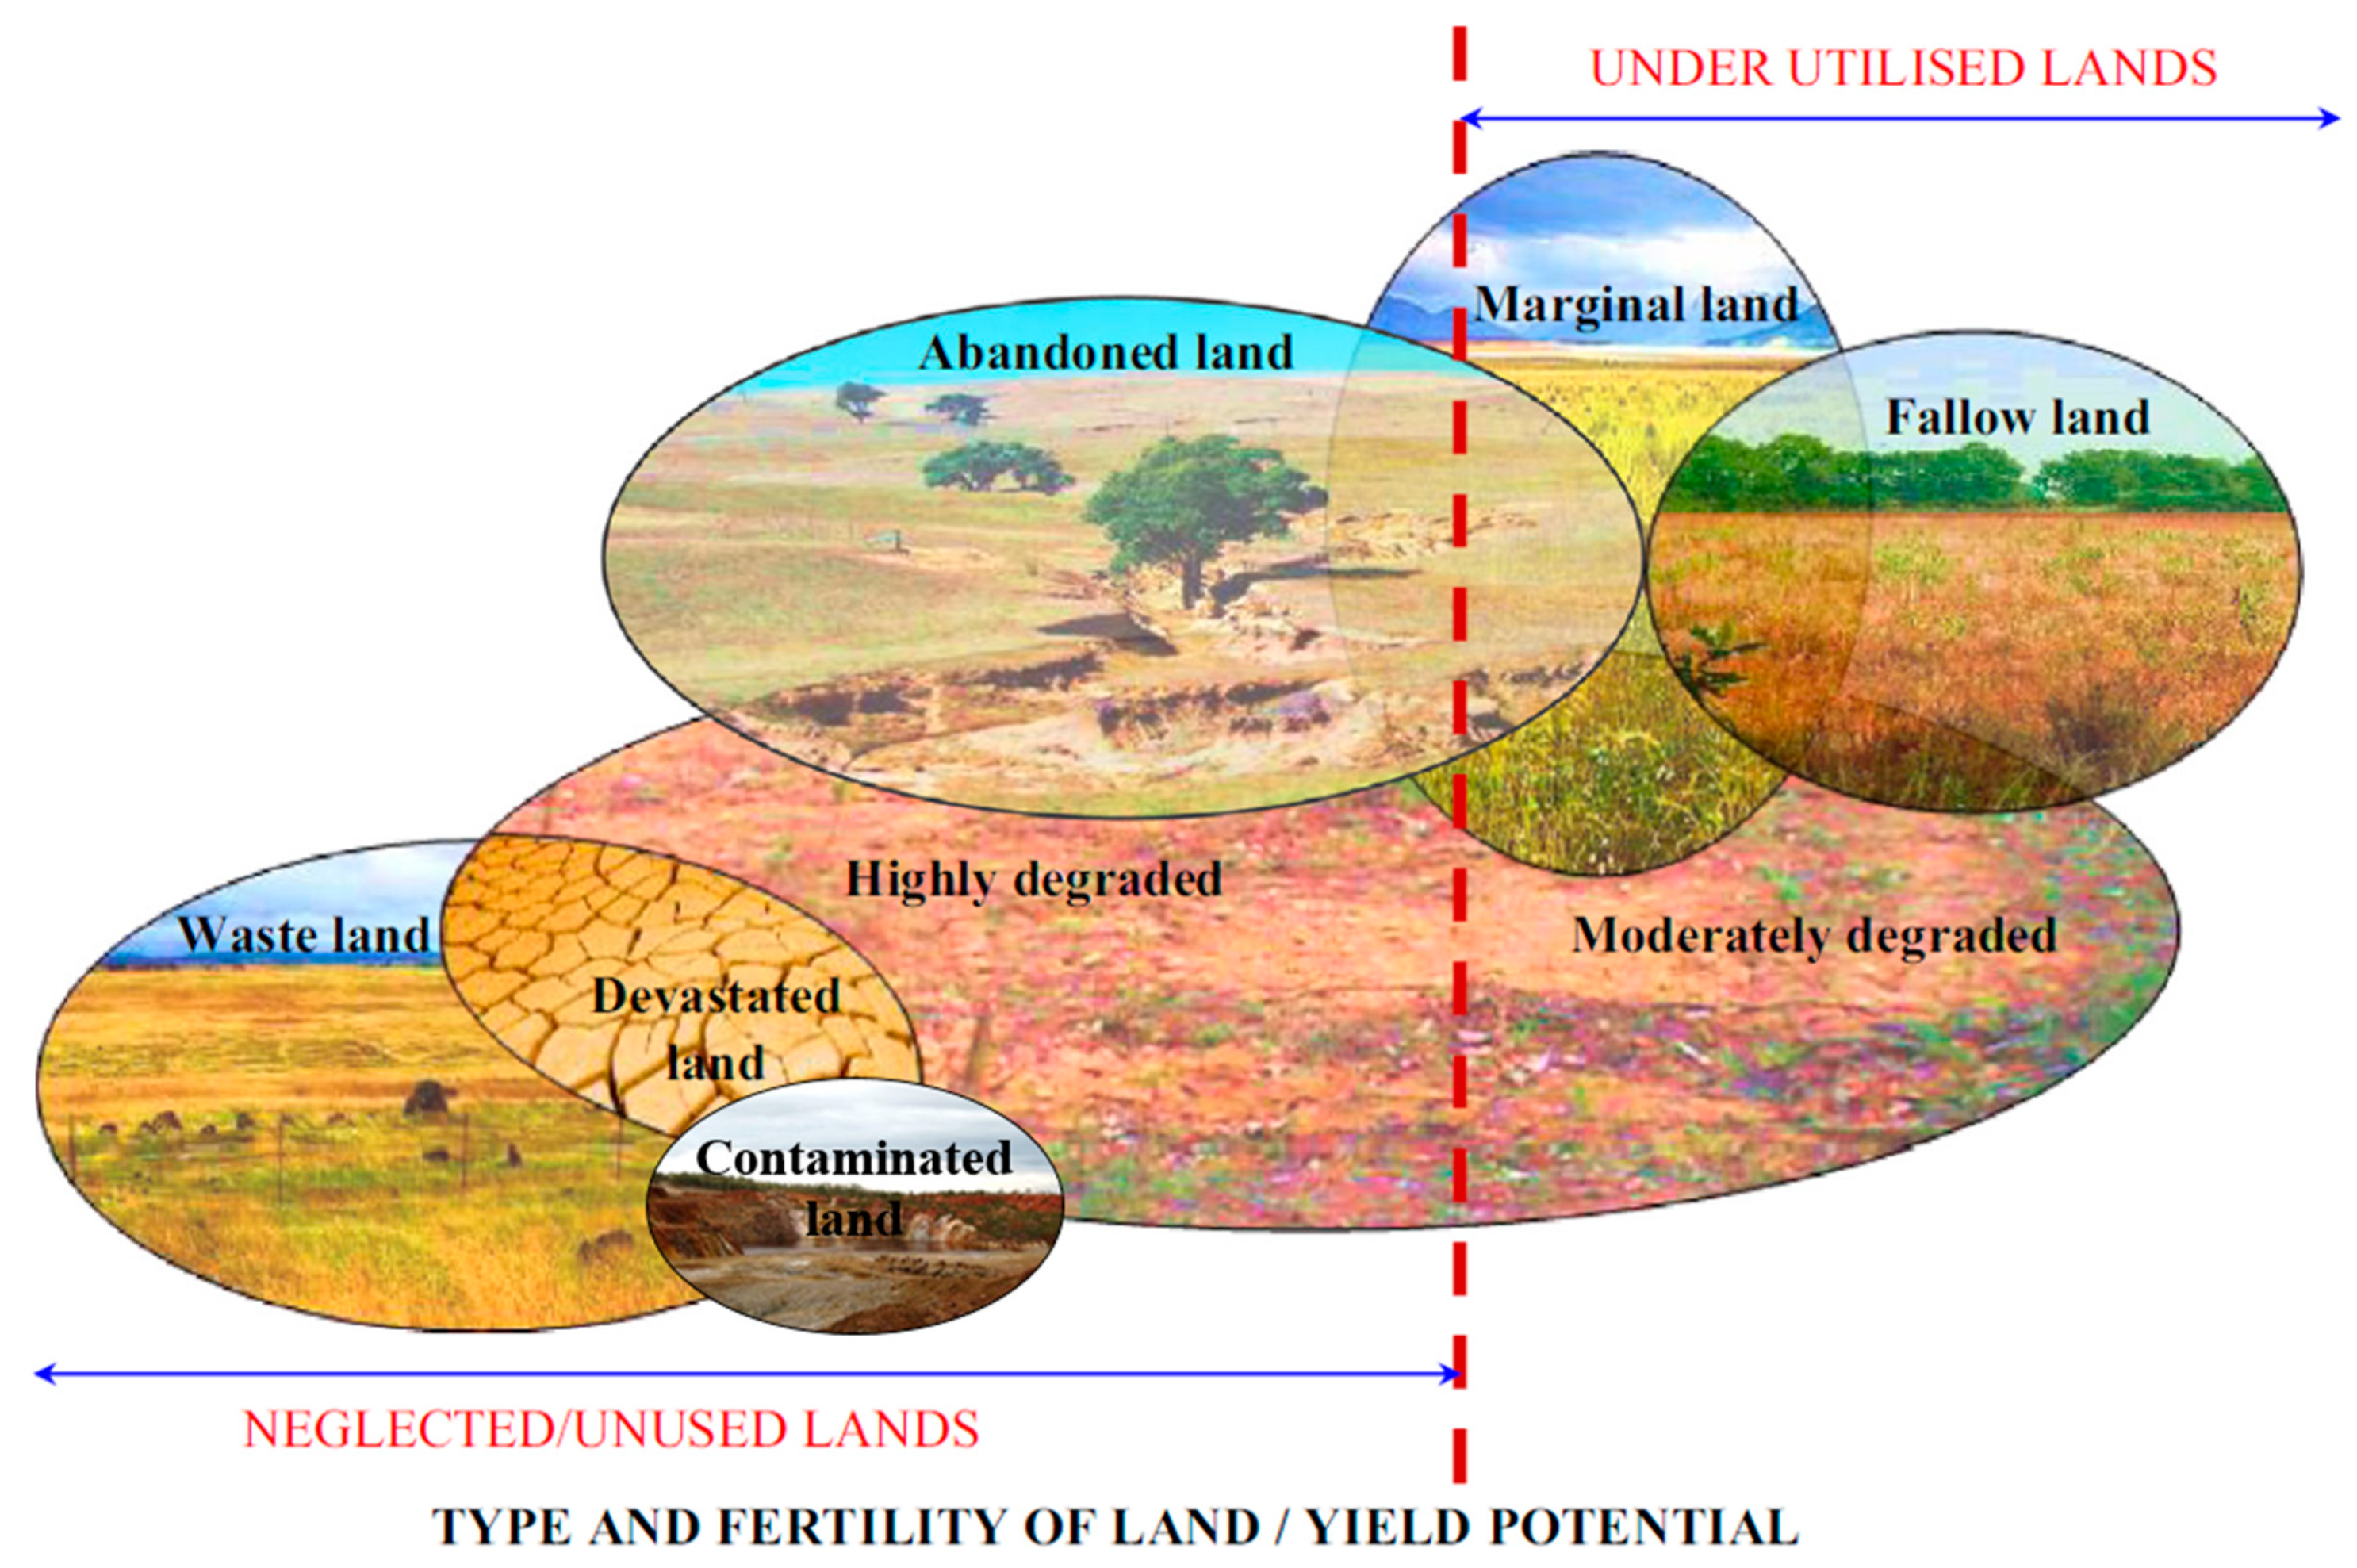
2.2. Low Indirect Land-Use Change (ILUC) Risk Soils

Low indirect land-use change (ILUC) risk soils refers to areas that can be considered for the implementation of dedicated energy crops [7], once the soils present a low quality for food and feed species, caused by a multitude of natural or human factors. There is a wide diversity of soils considered to be at low ILUC risk such as contaminated soils, wasted land, devastated land, moderate and highly degraded soils, abandoned land such as pasture or arable soils, marginal and fallow lands [37], all of which are suitable for the implementation of energy crops or microalgae for bioenergy production. Wastes from farmland species and from food and feed species can also be harnessed for energy production. Fertility and productivity are different for each soil type, as shown in Figure 2.
Based on the literature, the more studied soils that represent low ILUC risk are the degraded, marginal and contaminated soils, which according to their properties meet the sustainability requirements. With the objective of implementing the energy crops previously mentioned in this type of soils for to reduce the risk of land use conflicts due to competition for food and feed, that they can bring additional revenue to land owners, thus contributing positively to economic growth. These three types of soils were then evaluated and selected in this study, being described below:
• Degraded land: areas that suffer from a continuous deterioration process that can be caused naturally where lands with high carbon-laden are converted to dry land, causing changes in the physical, chemical and biological characteristics of the soil, reducing soil quality and causing severe erosion, namely, nutrient loss, soil infiltration problems [7] and wind erosion. Degradation can also occur by human action that generates progressive and continuous soil depletion causing biological and economic loss by decreasing the value of the land [38].
Considering the aforementioned definition, it can be confirmed that desertification is a state of the soil that is associated with degraded land and is characterized by very dry areas (dry sub-humid, arid and semi-arid) that reach this state for environmental or human reasons [39], being a factor that depending on the zone, is gradually increasing. Desertification causes alteration and destruction of ecosystems and increases the presence of invasive species, with loss of suitable areas for agriculture and decreased groundwater [40].
In this study, soil affected by natural factors that cause desertification [41] of these areas will be considered degraded;
• Contaminated soil: land with high concentrations of pollutants such as asbestos, gold, tin and tungsten, polymetallic, coal, base metals, iron and manganese, radioactive, among others [42], caused by human action, namely, in industrialized areas, intensively applied agriculture [7] and in areas where mining has occurred for a certain period of time.
Currently, in Portugal, two types of situations are identified in contaminated areas. In the first case the area remains contaminated without any possible use, becoming an abandoned area and in the second case, the recovery and valorization of this area is being accomplished, by companies, such as EDM, that have to monitor and control the recovery process along and after the application of gradual remediation methods [8]. The recovery process may take years to complete land reclamation, either for agriculture, recreational areas or residential areas.
Contaminated soils are also considered degraded soils [7]. However, in this study, degraded (desertified) and contaminated areas will be assessed separately. The areas massively exploited by human activity as mining areas characterized by the presence of heavy metals [42] were considered as contaminated soils;
• Marginal areas: although there is no clear and accurate concept of this type of soil [8], the APEC (Asia-Pacific Economic) Energy Working Group report presents a very broad definition of these areas which are characterized by poor weather conditions (low rainfall and high temperatures) and very poor soil physical-chemical characteristics (low quality and with physical constraints such as mountainous, extremely dry areas, saline, drenched, glacial and rocky areas) [43].
Based on data found in the literature, the saline soils are considered marginal, therefore, areas with moderate and high concentrations of saline elements are inadequate for the implementation of food crops [7]. The term salinization refers to areas with low precipitation and high evapotranspiration that causes salt accumulation making it impossible to wash on the soil surface. These areas can be found in the coastal part of the territory [8]. Much of the marginal land could be used for agriculture due to the quality and type of soil, however, many of them, are found in high zones, with high slopes, hard-to-reach areas or abandoned land, that are no longer used for this purpose [8] and now are considered suitable for other purposes such as the implementation of energy crops. For these reasons, in this study, we consider as marginal lands the pasture areas such as natural herbaceous vegetation, areas with dense, light dense undergrowth, dense and dense sclerophyte vegetation, other woody formations and, lastly, areas related to uncovered spaces or with sparse vegetation [44].
Based on a report by the 2014 Joint Research Center that presents an analysis of the extent of degraded areas in European Union (EU) countries, it can be stated that in the case of Portugal, the contaminated land has the largest area of the three types of soils presented above. The total extent of these areas is 2318 kha of which 12.3% represents highly saline soils (marginal land); 33.8% are areas with severe erosion (degraded areas) and the remaining, 53.9%, are contaminated soils. This document also identifies an area of 93 kha that will be available in Portugal by 2050 for the implementation of energy crops, but this implies the conversion of 19% arable and 44% forested areas in these lands [7]. According to the European Court of Auditors of 2018, 8% of EU territory which includes countries such as Bulgaria, Cyprus, Greece, Italy, Spain and Portugal, have areas with very high values highly sensitive to desertification (degraded soils), causing a decrease in land use for the agricultural sector [45].

2.3. Colleted Maps

In order to obtain the appropriate areas for the crops implementation, it was necessary to compile as many data or factors as possible, according to information available from various sources, mainly on official websites of Portuguese and European institutions. The administrative maps of the territory and those related to land use and occupation provided by DGT have been considered; environmental aspects such as temperature, precipitation, sunshine and frost provided by APA, including the map created with CO2 production in each municipality; various ecological factors of soil and subsoil and the edapho-morphological aptitude for agriculture and forestry of the Ecological Planning, Investigation and Cartography - EPIC WebGIS platform (ISA-UL); protected areas and soils susceptible to desertification from ICNF; contaminated soils based on the mining areas managed by EDM and the capacity and treatment applied in the wastewater treatment plants (WWTPs) in mainland Portugal, according to the EEA platform, each factor being considered a spatial thematic layer.
In the Supplementary Materials, each considered map will be described as well as the selected data for every species, considering the listed characteristics in Table 1 and Table 2.

3. Results and Discussions

Figure 3 shows a scheme summarizing the results that are of interest in this study.

3.1. Georreferenced Databases on ArcGIS

An infrastructure of spatial data was developed in order to facilitate the exchange and the use of the information among all of the beneficiary agents, with visualization and consultation through the web.
Several maps were created corresponding to scenarios from the most restrictive to the most comprehensive for each species, being these related to the suitable areas for the implementation of the respectives crops, detailed below.

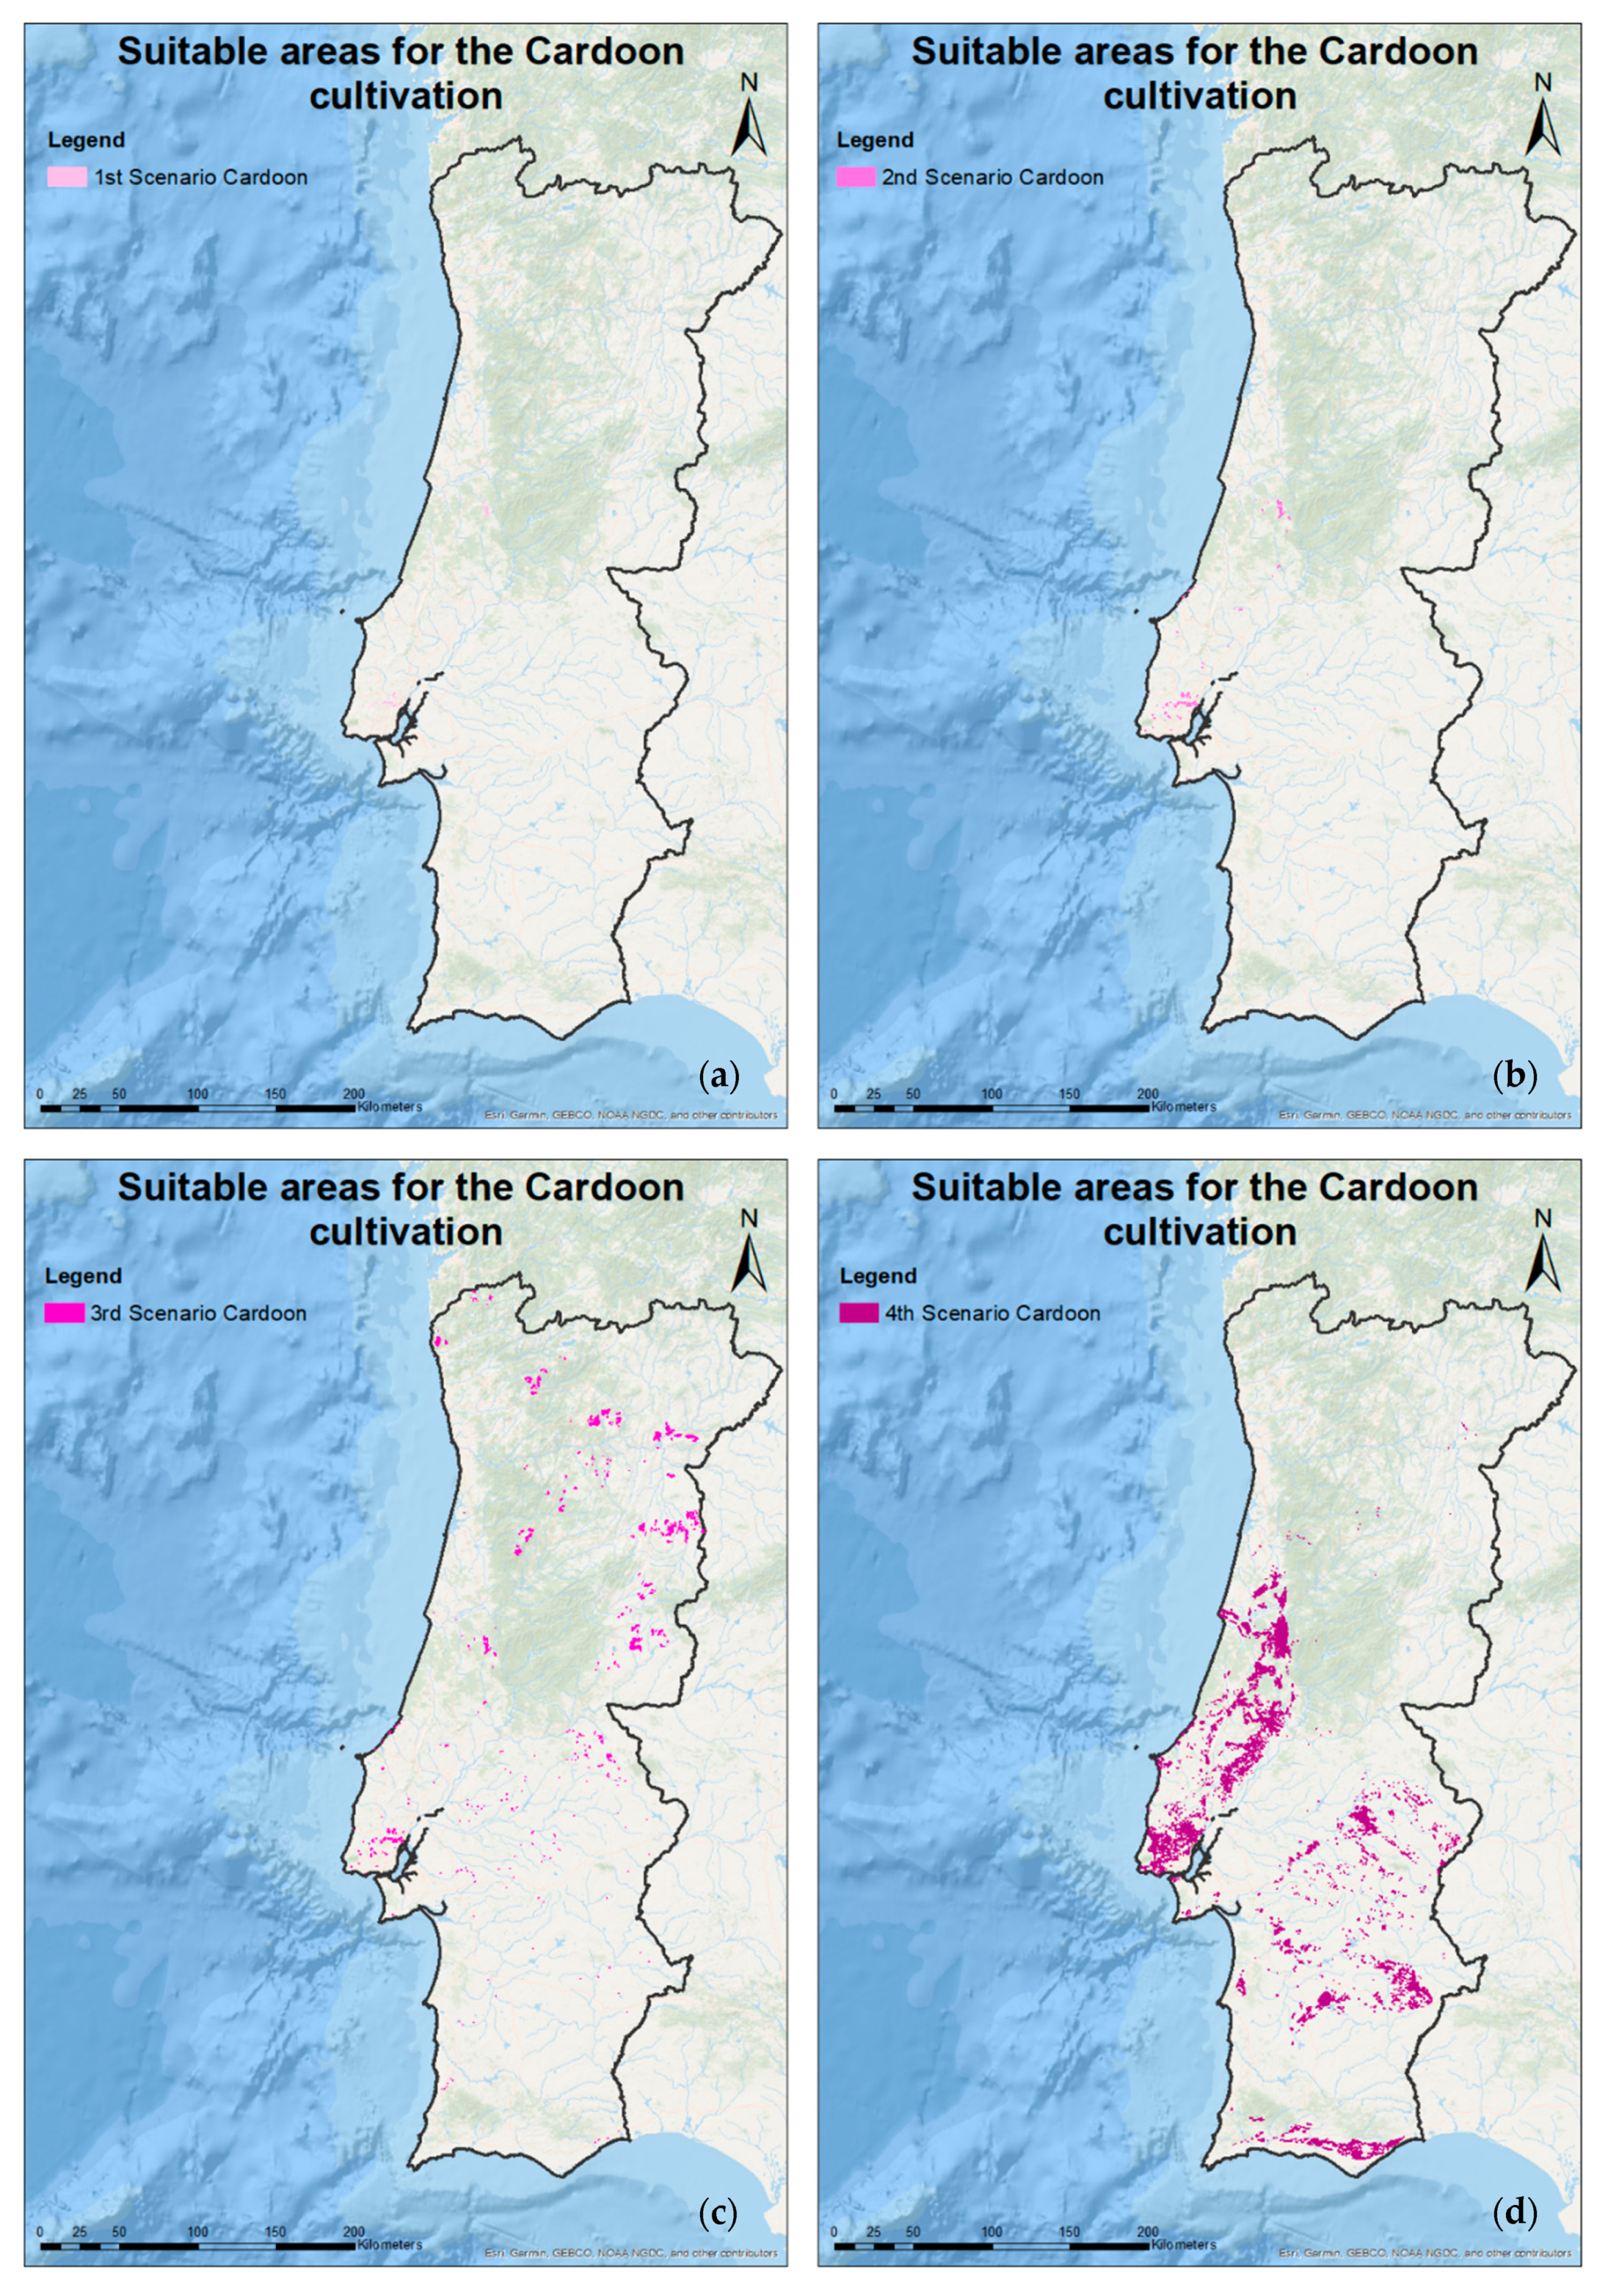
3.1.1. Suitable Areas/Soils to the Cardoon, Miscanthus and Paulownia Cultivation

• 1st Scenario
The map presents the smallest suitable area for cardoon, miscanthus and paulownia in mainland Portugal, since it corresponds to the more restrictive data selection, namely, conditions and characteristics of the less appropriate soil or more penalizing in the maps of “Ecological Soil Value”, “Current Permeability”, “Natural and semi-natural vegetation with conservation value” and “Soil susceptibility to desertification”. The map of “Soil-morphological aptitude to irrigated agriculture” was applied only to cardoon and miscanthus and in the case of paulowinia, it utilized the data of “Soil-morphological aptitude to silviculture”. All these maps represents in consequence, inadequate areas for the cultivation of agricultural species.
For the cardoon, miscanthus and paulownia, the parameters related to “Temperature”, “Precipitation (total amount)”, “Frost (number of days of the year)”, “Land steepness” (to the miscanthus were not considered due to the low area that was obtained), “Soil texture”, “Soil pH” and “Soil thickness” were obtained from several sources.
Concerning the data of the “COS 2010”, “CLC 2012” and “COS 2015”, the areas that have not been identified as artificialized territories, cultivated areas for agricultural and forestry species, wetlands and water bodies were selected, with the areas considered as marginal soils, due to their suitability for non-food crops, remaining of interest.
• 2nd Scenario
Cardoon: the same maps identified in the 1st Scenario were considered, being added only one more parameter in the following maps (in brackets the value added is specified): “Ecological Soil Value” [Variable (E.V 3)], “Current Permeability” (Moderate-Class 3), “Natural and semi-natural vegetation with conservation value” (Moderate), “Soil-morphological aptitude to irrigated agriculture” (Moderate-4.5%) and “Soil susceptibility to desertification” (2-Moderate), in order to guarantee a wider area compared to the area previously obtained in the 1st Scenario.
Miscanthus: the same maps identified in the 1st Scenario, but incorporating a few parameters in the following maps (in brackets the added valueis specified): “Ecological Soil Value” [Variable (E.V 3)], “Current Permeability” (Low to Moderate-Class 2 and Moderate-Class 3), “Natural and semi-natural vegetation with conservation value” (Moderate), “Soil-morphological aptitude to irrigated agriculture” (Moderate-4.5%) and “Soil susceptibility to desertification” (2-Moderate), to obtain a wider area than the 1st Scenario.
Paulownia: the same maps identified for the 1st Scenario were considered, adding only one more parameter in the following maps (in brackets is specified the added value): “Ecological Soil Value” [Variable (E.V 3)], “Current Permeability” (Moderate-Class 3), “Natural and semi-natural vegetation with conservation value” (Moderate), “Soil-morphological aptitude to silviculture” (Undifferentiated silviculture-20.3%)] and “Soil susceptibility to desertification” (2-Moderate), in order to ensure a wider area when compared to that obtained for the 1st Scenario.
• 3rd Scenario
Cardoon: the same maps of the 2nd Scenario were considered, adding only a few values in the “Temperature” map (equal or superior to 0 °C), “Precipitation” (equal or superior to 400 mm/year), “Soil texture” [Coarse (more than 35% clay, or less 35% clay and less than 15% sand)] and “Soil pH” (4.5 to 5.0; 5.0 to 5.5; 5.5 to 6.0; 4.5 to 6.0).
This methodology was applied in order to compare the edapho-climatic characteristics previously consulted and initially selected as adequate for the cardoon growth, with other data presented on the website www.cabi.org that corresponds to a “Directory of Invasive Species” with detailed information about the most important characteristics of the cardoon [46].
Miscanthus: the same maps of the 2nd Scenario were considered, adding only one value in the map of “Soil pH” (4.5 to 5.0) and “Soil thickness” (25–50 cm) to evaluate how they can affect the areas suggested for miscanthus cultivation.
Paulownia: the same maps of the 2nd Scenario were considered, changing only the “Soil pH” map, being added the next values 4.5 to 5.0; 5.0 to 5.5 and removed the following 7.5 to 8.0; ≥7.5, therefore, the pH parameters on the map are between 4.5 and 7.5.
This scenario was established to compare initially selected and consulted edapho-climatic characteristics for the paulownia planting, with other data presented on the Centre for Agriculture and Bioscience International—CABI website [47].
• 4th Scenario
For the cardoon and miscanthus the same maps of the 2nd Scenario were considered, with the exception of the “Natural and semi-natural vegetation with conservation value” map and those related to the “COS 2010”, “CLC 2012” and “COS 2015” not considered at the intersection as it presents a smaller number of data, limiting the area obtained as suitable for the cultivation of this crops. In the case of paulownia, the same as the two crops occurs but with the difference that the map of “Natural and semi-natural vegetation with conservation value” was considered.
In Table 3 all the data considered to obtain the adequate areas for the implementation of cardoon, miscanthus and paulownia in mainland Portugal are presented.
In Figure 4 the 4 scenarios created for the cardoon are shown, being visible the evolution and difference of the area obtained in each case.
The 4 scenarios created for miscanthus are identified in Figure 5, showing the evolution and difference of the area obtained in each case.
In Figure 6, the 4 scenarios created from paulownia are identified, showing the evolution and difference of the area obtained in each case.

3.1.2. Suitable Areas/Soils for Microalgae Cultivation

• 1st Scenario
Only for the microalgae case the map designated as “Presence of physical obstacles” was considered, with mostly stony areas, which means unsuitable areas for cultures of other species besides microalgae. This map, as well as those relating to “Insolation”, “Temperature” and “Land steepness” (obtained from the same source) and those of “Municipalities of mainland Portugal with CO2 production in the energy and industrial sector” were considered for all scenarios.
Regarding the “COS 2010” and “CLC 2012”, only those areas identified as bare rock were selected. The “COS 2015” was not included because this criterion was not considered on the map.
The protected areas were considered, since it is unknown if it is possible or not to use these zones for the development of microalgae.
• 2nd Scenario
The same maps identified in the 1st Scenario were considered, not including the protected areas, to verify in what extent this factor can affect the appropriate area for the development of microalgae.
• 3rd Scenario
The same maps identified in the 2nd Scenario were considered, without the parameter’s integration of the “COS 2010” and “CLC 2012”.
• 4th Scenario
The same maps identified in the 3rd Scenario were considered, without including the protected areas, to verify how the suggested area for the development of microalgae could be affected.
All considered maps and data to obtain the appropriate areas for the implementation of microalgae in mainland Portugal are shown in Table 4.
The 4 created scenarios for the microalgae culture are identified in Figure 7, showing the similarity of the area obtained in all cases.

3.1.3. Cultivated Crops (Agricultural/Silviculture) and their Residues with Potential Interest for Portuguese Inland Territory

• 1st Scenario
The map presents the areas constituted by the cultivated species identified in the “COS 2010”, the “CLC 2012” and the “COS 2015”, which do not belong to the categories of artificialized territories, pastures, open spaces or sparse vegetation, wetlands and water bodies. Also, the protected areas were not considered, with the entire obtained area being presented in a single map.
• 2nd Scenario
The same maps identified in the 1st Scenario were considered, including protected areas, to evaluate the effect of alteration of the area occupied by cultivated species, with all parameters being represented in one map.
• 3rd Scenario
Three maps with the same data identified in the 2nd Scenario have been created: a map with all the cultivated areas of the “COS 2010”, another map with the represented parameters in “CLC 2012” and a last map, with the identified data in the “COS 2015”. These maps are only for know of cultivated area with agricultural and silvicultural species in each map of mainland Portugal.
Table 5 presents all the maps and data considered to obtain the areas with agricultural and forestry species cultivated in mainland Portugal.
In Figure 8, the first and second scenario created for agricultural and forestry species grown in mainland Portugal are identified.
Figure 9 represents the third scenario with the 3 created maps, namely, with the agricultural and forestry species grown only for “COS 2010”, “CLC 2012” and “COS 2015”.

3.1.4. Estimated Production of Energy Crops

Considering the areas obtained for each created scenario with the suggested zones for the cultivation of energy crops and the implementation of microalgae crops, and bearing in mind the realistic yield data found in the literature, it is possible to estimate the production values theoretically for each species and scenario. From this starting point, Table 6 presents the value of the areas obtained (according to ArcGIS software), as well as the percentage of these areas out of the whole Portugal mainland area of 89,015 km2, the minimum and maximum productivity (according to Table 1) and the estimated minimum and maximum production for each crop. It is important to specify that the calculated productivity values are overestimated, considering a productivity of 100%.
The following text is a guideline for the calculation of either minimum or maximum production, including the percentage of the land area based on the mainland territory, all of this related to the cardoon 4th scenario, for example.
M i n i m u m   y i e l d   ( t ) = A r e a ( h a ) × M i n i m u m   p r o d u c t i v i t y   ( t / h a )
M i n i m u m   p r o d u c t i o n = 72 , 312.73 h a × 10   t / h a
M i n i m u m   p r o d u c t i o n = 723 , 127   t   723   k t
M a x i m u m   y i e l d   ( t ) = A r e a ( h a ) × M a x i m u m   p r o d u c t i v i t y   ( t / h a )
M a x i m u m   p r o d u c t i o n = 72 , 312.73 h a × 15   t / h a
M a x i m u m   p r o d u c t i o n = 1 , 084 , 691   t   1085   k t  
89 , 015   k m 2   100 %   d a   á r e a
723.13   k m 2   X
X =   0.81 %   o f   t h e   a r e a   o b t a i n e d   f o r   t h e   C a r d o o n   4 t h   s c e n a r i o  
Based on the results presented in Table 6, the scenarios with the largest proposed area for each species are the 4th scenario for the cardoon, miscanthus and paulownia crops, with it being very limited by the selected data in “COS 2010”, “CLC 2012”, “COS 2015” and by the map of “Natural and semi-natural vegetation with conservation value”.
In the case of microalgae cultures, there is not a significant difference among the 4 obtained scenarios, so it can be guaranteed that the areas would not diverge too much if new scenarios were created. However, the largest area identified was obtained in the 1st and 4th scenarios.
For the last case, the use of waste for bioenergy, approximately 73% of the area corresponds to land with already cultivated species, thus ensuring the existence of residual material that can be used in biomass for further energy conversion systems.
It should be pointed out that the yielded area from the 4th scenario for either cardoon or paulownia is around half the area of the previously reported unproductive soils (2% of mainland Portugal).

3.2. Publication on Laboratório Nacional de Energia e Geologia – LNEG´s geoportal

After obtaining all maps of interest, all the created maps were compiled and published in the LNEG´s geoportal [48], on a dedicated theme for the CONVERTE project.

4. Conclusions and Recommendations

The aforementioned 4th scenario represents the largest proposed area for cardoon, miscanthus and paulownia cultures: 72,313 ha (0.81% of the total area of mainland Portugal), identified in the Regions of Estremadura and Ribatejo, Lisbon, Algarve and part of Beira Litoral and Alentejo, 874 ha (0.01% of the total area of the continent) being located in the Beira Litoral and Alentejo Regions and 80,975 ha (0.91% of the mainland Portugal total area), identified in the Beira Litoral, Estremadura and Ribatejo, Lisbon, Alentejo, Algarve and part of Trás-os-Montes and Alto Douro and Beira Interior, respectively.
Concerning microalgae cultures, the 1st and 4th scenario represent the largest proposed area for its implementation with approximately 29,395 ha in both cases (0.33% of the total area of mainland Portugal) identified in the Beira Litoral, Estremadura and Ribatejo Regions, Lisbon and Setúbal, Algarve and part of Beira Interior.
Concerning cultivated species, the most significant value of the agricultural-forestry area is 6,531,613 ha (73.38% of the total continent) from COS 2015, identified in all regions, anticipating a huge potential for waste generation and recovery.
The previously identified areas for energy crops production correspond only to marginal and degraded soils. The scenarios created yielded very restricted areas which fulfill all predefined parameters for each species.
The GIS is a powerful tool for predicting areas for biomass production to feed energy-based biorefineries and geographical availability of the feedstock. It is an instrument for technicians, beneficiaries and decision-makers regarding the optimal location of future biomass power plants.
The implementation of energy crops in degraded and contaminated soils presents also a dual purpose: it allows the sustainable production of energy and soils can also be recovered for agriculture or forestry. This study combines GIS and a multiplicity of data in order to predict the availability of biomass for bioenergy, acting as support guidelines for further implementation elsewhere, as the methodology can be implemented in other countries or regions.

Supplementary Materials

The following are available online at https://www.mdpi.com/1996-1073/13/4/937/s1: S.1 Maps obtained from Direção Geral do Território (DGT); S.1.1 Districts of the Official Administrative Charter of Portugal-CAOP; S.1.2 Land Use and Land Cover; S.1.3 Corine Land Cover; Figure S1. Maps obtained from the DGT website: (a) Districts of mainland Portugal from CAOP; (b) COS 2010; (c) CLC 2012; (d) COS 2015; S.2 Maps consulted from Agência Portuguesa do Ambiente (APA); S.2.1 Insolation; S.2.2 Temperature; S.2.3 Precipitation; S.2.4 Frost; Figure S2. Maps presenting APA data (annual basis): (a) Insolation level measured in number of hours; (b) Average daily air temperature in °C; (c) Precipitation measured as the total amount (average values) in mm; (d) Map of frost in number of days; S.2.5 Municipalities of mainland Portugal with CO2 production in the energy and industrial sectors; S.2.6 Pollutant Release and Transfer Register—PRTR; Figure S3. Consulted maps from APA (annual basis): (a) Municipalities vs the quantity produced CO2 (emitted and released) in the energy sector; (b) Produced (emitted) CO2 (kt) in the industrial sector vs Municipalities; (c) Location of the companies by subsector identified in the Pollutant Release and Transfer Register—PRTR, that represents the GHG emission sources in mainland Portugal; S.3 Maps obtained from EPIC WebGIS platform (Instituto Superior de Agronomia, Universidade de Lisboa, ISA-UL); S.3.1 Land steepness; S.3.2 Soil texture; S.3.3 Soil pH; S.3.4 Soil thickness; Figure S4. Maps obtained from EPIC WebGIS platform (ISA-UL): (a) Land steepness map measured in %; (b) Soil texture represented as the surface layer up to 30 cm; (c) Soil pH map from soils considered high acid up to very alkaline; (d) Soil thickness in cm; S.3.5 Presence of physical obstacles; S.3.6 Ecological Soil Value; S.3.7 Current Permeability; Figure S5. Maps according to EPIC WebGIS platform (ISA-UL): (a) Map of the presence of physical obstacles; (b) Ecological soil value map; (c) Current permeability; S.3.8 Natural and semi-natural vegetation with conservation value; S.3.9 Soil-morphological aptitude to irrigated agriculture and silviculture; Figure S6. Consulted maps from EPIC WebGIS platform (ISA-UL): (a) Natural and semi-natural vegetation with conservation value map; (b) Soil-morphological aptitude to irrigated agriculture; (c) Soil-morphological aptitude to silviculture; S.4 Consulted maps from Instituto da Conservação da Natureza e das Florestas (ICNF); S.4.1 Protected areas; S.4.2 Unprotected areas; S.4.3 Soil susceptibility to desertification; Figure S7. Maps obtained from ICNF: (a) Protected areas in mainland Portugal corresponding to areas not permitted for cultivation; (b) Unprotected areas, corresponding to zones where cultivation is allowed; (c) Soil susceptibility to desertification; S.5 Maps from Empresa de Desenvolvimento Mineiro (EDM)-Classification of soils according to each mine group (Contaminated soils); S.6 Maps obtained from European Environment Agency (EEA); S.6.1 Wastewater Treatment Plant (WWTP) capacity; S.6.2 Applied treatments to Wastewater Facilities; Figure S8. Maps according to EDM and EEA data: (a) Mines that are being recovered by EDM (contaminated soils); (b) WWTP capacity in mainland Portugal; (c) Treatment applied in WWTPs.

Author Contributions

Conceptualization, A.R., P.M. and L.Q.; Methodology, A.R., L.Q., P.P. and P.M.; Validation, A.R., P.M., and L.Q.; Formal analysis, M.A., A.R. and P.P.; Investigation, M.A. and A.R.; Resources, all authors; Data curation, M.A. and A.R.; Writing—Original draft preparation, M.A., A.L.F. and A.R.; Writing—Review and editing, M.A., A.L.F. and A.R.; Supervision, P.M.; Project administration, F.G. and P.M.; Funding acquisition, P.M. All authors have read and agreed to the published version of the manuscript.

Funding

This work was integrated in the project CONVERTE, supported by POSEUR (POSEUR-01-1001-FC-000001) under the PORTUGAL 2020 Partnership Agreement. This research has been carried out at the Biomass and Bioenergy Research Infrastructure (BBRI)- LISBOA-01-0145-FEDER-022059, supported by Operational Programme for Competitiveness and Internationalization (PORTUGAL2020), by Lisbon Portugal Regional Operational Programme (Lisboa 2020) and by North Portugal Regional Operational Programme (Norte 2020) under the Portugal 2020 Partnership Agreement, through the European Regional Development Fund (ERDF). This work has also been supported by FCT – Fundação para a Ciência e Tecnologia within the R&D Unit Project Scope: UIDP/04077/2020 and UIDB/04077/2020.

Conflicts of Interest

The authors declare no conflict of interest. The funders had no role in the design of the study; in the collection, treatment analyses, or interpretation of data; in the writing of the manuscript; or in the decision to publish the results.

References and Notes

  1. The European Parliament and the Council of the European Union. Directive (EU) 2015/1513 of the European Parliament and of the Council of 9 September 2015; Official Journal of the European Union: Brussels, Belgium, 2015; pp. L239/1–L239/29. [Google Scholar]
  2. Barbosa, B.J.; Fernando, A.L. Production of Energy Crops in Heavy Metals Contaminated Land: Opportunities and Risks. In Land Allocation for Biomass Crops; Li, R., Monti, A., Eds.; Springer: Cham, Switzerland, 2018; pp. 83–102. ISBN 978-3-319-74536-7. [Google Scholar]
  3. Decreto-Lei n. 152-C/2017; Diário da República n.° 236/2017, 2° Suplemento, Série I de 2017-12-11. pp. 6584-(73)–6584-(88). Available online: https://dre.pt/application/file/a/114336874 (accessed on 26 August 2019).
  4. Caetano, M.; Marcelino, F.; Igreja, C.; Girão, I. Estatísticas e Dinâmicas Territoriais em Portugal Continental 1995–2007–2010–2015 com Base na Carta de Uso e Ocupação do Solo (COS); Direção-Geral do Território (DGT) Lisboa: Lisboa, Portugal, 2018. [Google Scholar]
  5. Nunes, L.J.R.; Matias, J.C.O.; Catalão, J.P.S. Biomass in the generation of electricity in Portugal: A review. Renew. Sustain. Energy Rev. 2017, 71, 373–378. [Google Scholar] [CrossRef]
  6. Ferreira, S.; Monteiro, E.; Brito, P.; Vilarinho, C. Biomass resources in Portugal: Current status and prospects. Renew. Sustain. Energy Rev. 2017, 78, 1221–1235. [Google Scholar] [CrossRef]
  7. Castillo, C.; Baranzelli, C.; Maes, J.; Zulian, G.; Barbosa, A.; Vandecasteele, I.; Mari-Rivero, I.; Vallecillo, S.; Batista e Silva, F.; Jacobs-Crisioni, C.; et al. An Assessment of Dedicated Energy Crops in Europe under the EU Energy Reference Scenario 2013. Application of the LUISA Modelling Platform-Updated Configuration 2014; EUR 27644; European Union: Brussels, Belgium, 2016. [Google Scholar] [CrossRef]
  8. Allen, B.; Kretschmer, B.; Baldock, D.; Menadue, H.; Nanni, S.; Tucker, G. Space for Energy Crops–Assessing the Potential Contribution to Europe’s Energy Future; IEEP: London, UK, 2014. [Google Scholar]
  9. SilvaPlus Espécies Energéticas Herbáceas e Arbustivas. Available online: http://www.silvaplus.com/pt/culturas-energeticas-florestais/especies-energeticas-herbaceas-e-arbustivas/ (accessed on 16 November 2018).
  10. Gominho, J.; Dolores, M.; Lourenço, A.; Fernández, J.; Pereira, H. Cynara cardunculus L. as a biomass and multi-purpose crop: A review of 30 years of research. Biomass Bioenergy 2018, 109, 257–275. [Google Scholar] [CrossRef]
  11. Mancini, M.; Lanza Volpe, M.; Gatti, B.; Malik, Y.; Moreno, A.C.; Leskovar, D.; Cravero, V. Characterization of cardoon accessions as feedstock for biodiesel production. Fuel 2019, 235, 1287–1293. [Google Scholar] [CrossRef]
  12. Fernando, A.L.; Costa, J.; Barbosa, B.; Monti, A.; Rettenmaier, N. Environmental impact assessment of perennial crops cultivation on marginal soils in the Mediterranean Region. Biomass Bioenergy 2018, 111, 174–186. [Google Scholar] [CrossRef]
  13. Mañas, P.; Castro, E.; de las Heras, J. Application of treated wastewater and digested sewage sludge to obtain biomass from Cynara cardunculus L. J. Clean. Prod. 2014, 67, 72–78. [Google Scholar] [CrossRef]
  14. Chung, J.; Kim, D. Miscanthus as a Potential Bioenergy Crop in East Asia. J. Crop Sci. Biotechnol. 2012, 15, 65–77. [Google Scholar] [CrossRef]
  15. Barbosa, B.; Boléo, S.; Sidella, S.; Costa, J.; Duarte, M.P.; Mendes, B.; Cosentino, S.L.; Fernando, A.L.; Fernando, A.L. Phytoremediation of Heavy Metal-Contaminated Soils Using the Perennial Energy Crops Miscanthus spp. and Arundo donax L. Bioenergy Res. 2015, 8, 1500–1511. [Google Scholar] [CrossRef]
  16. Barbosa, B.; Costa, J.; Fernando, A.L.; Papazoglou, E.G. Wastewater reuse for fiber crops cultivation as a strategy to mitigate desertification. Ind. Crop. Prod. 2015, 68, 17–23. [Google Scholar] [CrossRef]
  17. Alexopoulou, E.; Casler, M.D.; Christou, M.; Clifton-Brown, J.; Copani, V.; Cosentino, S.L.; Montaño, C.M.D.; Donnison, I.S.; Elbersen, H.W.; Farrar, K.; et al. Perennial Grasses for Bioenergy and Bioproducts; Academic Press: London, UK, 2018; ISBN 9780128129005. [Google Scholar]
  18. Fernando, A.L.; Godovikova, V.; Oliveira, J.F.S. Miscanthus x giganteus: Contribution to a Sustainable Agriculture of a Future/Present-Oriented Biomaterial. Mater. Sci. Forum Adv. Mater. Forum II 2004, 455, 437–441. [Google Scholar] [CrossRef]
  19. Oliveira, J.; Duarte, M.; Christian, D.; Eppel-Hotz, A.; Fernando, A.L. Environmental aspects of Miscanthus production. In Miscanthus: For Energy and Fibre; Jones, M.B., Walsh, M., Eds.; James & James (Science Publishers): London, UK, 2001; pp. 172–178. ISBN 9781849710978. [Google Scholar]
  20. Zhu, Z.H.; Chao, C.J.; Lu, X.Y.; Xiong, Y.G. Paulownia in China: Cultivation and Utilization; Chinese Academy of Forestry Staff, Ed.; Asian Network for Biological Sciences and International Development Research Centre: Singapore, 1986; ISBN 9971845466. [Google Scholar]
  21. El-Showk, N.; El-Showk, S. The Paulownia Tree an Alternative for Sustainable Forestry; The Farm—Crop Development.org: Rabat, Morocco, 2003. [Google Scholar]
  22. Direção Nacional das Fileiras Florestais Culturas Energéticas Florestais-Primeira Abordagem do Levantamento da Situação Actual. Available online: http://www2.icnf.pt/portal/florestas/fileiras/resource/doc/biom/biomass-gtce-jun10 (accessed on 16 November 2018).
  23. Decreto-Lei n. 565/99; Diário da República n.º 295/1999, Série I-A de 1999-12-21; pp. 9100–9115.
  24. Jiménez, L.; Rodriguez, A.; Ferrer, J.L.; Pérez, A.; Angulo, V. Paulownia, a fast-growing plant, as a raw material for paper manufacturing. Afinidad Barcelona 2005, 62, 100–105. [Google Scholar]
  25. López, F.; Pérez, A.; Zamudio, M.A.M.; De Alva, H.E.; García, J.C. Paulownia as raw material for solid biofuel and cellulose pulp. Biomass Bioenergy 2012, 45, 77–86. [Google Scholar] [CrossRef]
  26. Zamudio, M.A.M.; Alfaro, A.; de Alva, H.E.; García, J.C.; García-Morales, M.; López, F. Biorefinery of paulownia by autohydrolysis and soda-anthraquinone delignification process. Characterization and application of lignin. J. Chem. Technol. Biotechnol. 2015, 90, 534–542. [Google Scholar] [CrossRef] [Green Version]
  27. Yadav, N.K.; Vaidya, B.N.; Henderson, K.; Lee, J.F.; Stewart, W.M.; Dhekney, S.A.; Joshee, N. A Review of Paulownia Biotechnology: A Short Rotation, Fast Growing Multipurpose Bioenergy Tree. Am. J. Plant Sci. 2013, 4, 2070–2082. [Google Scholar] [CrossRef] [Green Version]
  28. Domínguez, E.; Romaní, A.; Domingues, L.; Garrote, G. Evaluation of strategies for second generation bioethanol production from fast growing biomass Paulownia within a biorefinery scheme. Appl. Energy 2017, 187, 777–789. [Google Scholar] [CrossRef] [Green Version]
  29. Vega, D.J.; Dopazo, R.; Ortiz, L. Manual de Cultivos Energéticos; Vigo University: Vigo, Spain, 2010. [Google Scholar]
  30. Rawat, I.; Kumar, R.R.; Mutanda, T.; Bux, F. Biodiesel from microalgae: A critical evaluation from laboratory to large scale production. Appl. Energy 2013, 103, 444–467. [Google Scholar] [CrossRef]
  31. Raheem, A.; Azlina, W.A.K.G.W.; Tau, Y.H.; Danquah, M.K. Thermochemical conversion of microalgal biomass for biofuel production. Renew. Sustain. Energy Rev. 2015, 49, 990–999. [Google Scholar] [CrossRef]
  32. Brennan, L.; Owende, P. Biofuels from microalgae-A review of technologies for production, processing, and extractions of biofuels and co-products. Renew. Sustain. Energy Rev. 2010, 14, 557–577. [Google Scholar] [CrossRef]
  33. El Bassam, N. Handbook of Bioenergy Crops: A Complete Reference to Species, Development and Applications, 1st ed.; Earthcan Ltd.: London, UK, 2010; ISBN 9781138975712. [Google Scholar]
  34. Gonçalves, M. Aproveitamento da Biomassa Florestal para Fins Energéticos (o início de um novo ciclo para a floresta portuguesa)—Potencial das Culturas Energéticas. Feira Nac. Agric. 2007. [Google Scholar]
  35. AFG-Asociación Forestal de Galicia ECAS-Cultivos Energéticos en el Espacio Atlántico. Available online: http://enersilva.navegantes.info/areasubir/libros/FolletoECAS.pdf (accessed on 17 October 2017).
  36. Almeida, A.R. Avaliação do potencial ecológico para a influência do perímetro de rega do Alqueva. Master’s Thesis, Engenharia Agronómica—Agro-pecuária, Universidade Técnica de Lisboa, Lisboa, Portugal, 2009. [Google Scholar]
  37. Edrisi, S.A.; Abhilash, P.C. Exploring marginal and degraded lands for biomass and bioenergy production: An Indian scenario. Renew. Sustain. Energy Rev. 2016, 54, 1537–1551. [Google Scholar] [CrossRef]
  38. Olsson, L.; Barbosa, H.; Bhadwal, S.; Cowie, A.; Delusca, K.; Flores-Renteria, D.; Hermans, K.; Jobbagy, E.; Kurz, W.; Li, D.; et al. Chapter 4: Land Degradation; Special Report on Climate Change and Land of Intergovernmental Panel on Climate Change (IPCC); IPCC: Geneva, Switzerland, 2019. [Google Scholar]
  39. United Nations Convention to Combat Desertification (UNCCD). United Nations Convention to Combat Desertification in Those Countries Experiencing Serious Drought and/or Desertification, Particularly in Africa; UNCCD: Paris, France, 1994. [Google Scholar]
  40. Mirzabaev, A.; Wu, J.; Evans, J.; Garcia-Oliva, F.; Hussein, I.A.G.; Iqbal, M.M.; Kimutai, J.; Knowles, T.; Meza, F.; Nedjraoui, D.; et al. Chapter 3: Desertification; Special Report on Climate Change and Land of Intergovernmental Panel on Climate Change (IPCC); IPCC: Geneva, Switzerland, 2019; Volume 21. [Google Scholar]
  41. ICNF Cartografia de Apoio ao PDR 2020-Suscetibilidade dos Solos à Desertificação. Available online: http://www2.icnf.pt/portal/pn/biodiversidade/ei/unccd-PT/pancd/o-pancd-2014-2020/cartografia-apoio-pdr2020 (accessed on 7 October 2018).
  42. Empresa de Desenvolvimento Mineiro (EDM) Shapefiles sent by email with contaminated areas from EDM 2018.
  43. Milbrandt, A.; Overend, R.P. Assessment of Biomass Resources from Marginal Lands in APEC Economies; Asia-Pacific Economic Cooperation (APEC): Singapore, 2009. [Google Scholar]
  44. Direção-Geral do Território Carta de Uso e Ocupação do Solo de Portugal Continental Para 2010–(COS2010v1.0). Available online: mapas.dgterritorio.pt/inspire/atom/CDG_COS2015v1_Continente_Atom.xml (accessed on 7 January 2019).
  45. ECA. Desertification in the EU. Background Paper; European Court of Auditors (ECA)—Guardians of the EU Finances: Luxembourg, 2018. [Google Scholar]
  46. CABI Invasive Species Compendium-Cynara Cardunculus (Cardoon). Available online: https://www.cabi.org/isc/datasheet/17584 (accessed on 7 March 2019).
  47. CABI Invasive Species Compendium-Paulownia Tomentosa (Paulownia). Available online: https://www.cabi.org/isc/datasheet/39100 (accessed on 7 March 2019).
  48. Laboratório Nacional de Energia e Geologia—LNEG Projeto Converte. Available online: http://geoportal.lneg.pt/geoportal/mapas/index.html?mapa=converte (accessed on 25 September 2019).
Figure 1. Applied methodology to determine suitable areas for the implementation of energy crops.
Energies 13 00937 g001
Figure 2. Low indirect land-use change (ILUC) risk soils for biomass and biofuels production. X axis refers to increasing biomass (bioenergy) productivity potential. The red vertical dash line separates bad (low) and fairly good (moderately high) quality lands (Adapted from [37]).
Energies 13 00937 g002
Figure 3. Summary of the results that are of interest in this study.
Energies 13 00937 g003
Figure 4. Scenarios displaying the adequate areas for cardoon cultivation: (a) 1st scenario; (b) 2nd scenario; (c) 3rd scenario; (d) 4th scenario.
Energies 13 00937 g004
Figure 5. Scenarios presenting the suggested areas for miscanthus cultivation: (a) 1st scenario; (b) 2nd scenario; (c) 3rd scenario; (d) 4th scenario.
Energies 13 00937 g005
Figure 6. Scenarios with the suitable areas for paulownia cultivation: (a) 1st scenario; (b) 2nd scenario; (c) 3rd scenario; (d) 4th scenario.
Energies 13 00937 g006
Figure 7. Scenarios with the appropriate areas for the microalgae: (a) 1st scenario; (b) 2nd scenario; (c) 3rd scenario; (d) 4th scenario.
Energies 13 00937 g007
Figure 8. Scenarios displaying suggested areas for cultivated agricultural and forestry species: (a) 1st scenario; (b) 2nd scenario.
Energies 13 00937 g008
Figure 9. 3rd scenario exhibiting areas from cultivated agricultural and forestry species according to: (a) COS 2010; (b) CLC 2012; (c) COS 2015.
Energies 13 00937 g009
Table 1. Cultivation parameters of the selected and studied biomasses (including microalgae).
BiomassBinomial NameSpecies and Culture TypeProductivity/YieldGrowth RateHarvestNumber of Harvests/Year
CardoonCynara cardunculusHerbaceous (lignocellulosic and oleaginous type)10 to 25 t/year, with 500 mm/year rainfall in the Mediterranean Region [33]. In the 1st year, it is possible to obtain 10 t (dry matter)/ha and in the 2nd year, 12–15 t (dry matter)/ha with 400 and 550 mm/year of rainfall during the vegetative period [9]Life span from 10 to 15 years [33] and crop height up to 2 m [9]Harvest occurs between July and September, with moisture in between 10% and 15% and before seed dissemination [33]1 [33]
MiscanthusMiscanthus x giganteusHerbaceous (lignocellulosic type)From 15 [34] to 30 t/ha of dry matter, with precipitation higher than 500 mm/year [18] Life span between 10 and 15 years (in some cases can reach up to 20 years [9]) achieving maturity after 2 or 3 years. The stems in the 1st year, with favorable summer temperatures, reach a height of 1.5 to 2 m (sometimes up to 3 m [9]), with higher yields in Southern Europe (water cannot be a limiting factor) [18]Rhizomes are planted between march and may (in Europe and depending on the weather). Harvesting is performed when the dry matter content is high [18] (usually in autumn [34] or end of winter) [18]1 [18]
PaulowniaPaulownia tomentosaWoody (lignocellulosic type)35 to 45 t/ha/year (30% moisture) with minimum precipitation of 500 mm/year. Planting density is on average 1600 trees/ha [22]It is possible to reach a height of 20 m in rotation cycles of 4 and 5 years [22]--
Microalgae-Aqueous medium55 t/ha year (conservative)Achievable biomass doubling time of 7h for mass cultureDaily365
Table 2. Optimal conditions for the cultivation of the selected and studied biomasses (including microalgae).
BiomassInsolationPrecipitationTemperatureLand SteepnessSoil TypeWeather Limitations or other Aspects
Cardoon-The highest demand of water (precipitation higher than 450 mm) is from autumn until early spring [35], therefore, it can growth in dry areas [34]. However, with lower rainfall, a decrease in productivity is observed [35]It supports temperatures down to −5 °C, as long as it has developed four leaves [33]The maximum value between 8 and 15% [36]It supports pH above 6 in the soil. Preference for well drained deep soils, with water retention in the subsoil between 1 and 3 m [33]. It is a little sensitive to stony conditions [35]Winter frost causes leaf death, however, it survives and recovers as soon this period ends. Requires water (in the Mediterranean) in the late spring [33]. It isn´t very exigent in relation to the type of soil and water. It requires high temperature climate [34]
Miscanthus-It presents moderate needs, therefore, rainfall has to exceed 500 mm [18]It can grow with soil temperature above 8 °C. Negative temperatures can cause rhizomes death [18]The maximum value between 8 and 15% [36]Optimum pH between 5.5 and 7.5. Sandy soils: maximum productivity attained in 3 years. Loamy or clay soils: higher yields obtained after 5 years. Preference for loamy-sandy soils (up to 10% clay, well-aerated and with high water retention capacity) with high organic matter content [18] -
Paulownia-It requires minimum average precipitation of 500 mm [22]It supports cold very well (down to −17 °C) and heat (up to 45 °C) [22]It stands slope up to 25% [22]It requires a soil pH of 5.5 to 8. Prefers well-drained soils, with water table higher than 2 or 2.5 m and not very clayey. It adapts to a great variety of climates and soils and resists moderately periods of dryness between the 1st and 2nd year [22]It resists fires very well, being a species free from pests and diseases [22]
MicroalgaeElevatedNot relevant aFrom 10 to 40 °C-Not relevant aNot relevant a
a The microalgae are able to be mass produced at confined photobioreactors placed over land with any water regardless the quality.
Table 3. Data considered in each scenario of the cardoon, miscanthus and paulownia.
MapsCrops1st Scenario2nd Scenario3rd Scenario4th Scenario
Districts3 speciesAveiro; Beja; Braga; Bragança; Castelo Branco; Coimbra; Évora; Faro; Guarda; Leiria; Lisboa; Portalegre; Porto; Santarém; Setúbal; Viana do Castelo; Vila Real; Viseu
Land Use and Land Cover - COS 20103 species3.2.1.01.1 Natural herbaceous vegetation; 3.2.2.01.1 Dense bushes; 3.2.2.02.1 Low dense bushes; 3.2.3.01.1 Dense sclerophyte vegetation; 3.2.3.02.1 Sclerophyte vegetation not very dense; 3.2.4.07.1 Other woody formations; 3.3.3.01.1 Vegetation sparse×
Corine Land Cover - CLC 20123 speciesBushes; Sclerophyllic vegetation; Sparse vegetation; Natural herbaceous vegetation×
COS 20153 speciesNatural herbaceous vegetation; Bushes; Spaces discovered or with little vegetation×
TemperatureCardoonEqual or superior than 7.5 °CEqual or superior than 0 °CEqual or superior than 7.5 °C
MiscanthusEqual or superior than 10 °C
PaulowniaEqual or superior than 0 °C
PrecipitationCardoonEqual or superior than 500 mm/yearEqual or superior than 400 mm/yearEqual or superior than 500 mm/year
MiscanthusEqual or superior than 500 mm/year
Paulownia
FrostCardoonUp to 60 days
Miscanthus
PaulowniaUp to 80 days
Land steepnessCardoon0–3%; 3–5%; 5–8%; 8–12%; 12–16%
Miscanthus×0–3%; 3–5%; 5–8%; 8–12%; 12–16%
Paulownia0–3%; 3–5%; 5–8%; 8–12%; 12–16%; 16–25%
Soil textureCardoonFine; MedianFine; Median; CoarseFine; Median
MiscanthusCoarse
PaulowniaFine; Median
Soil pHCardoon6.0–6.5; 6.5–7.0; 7.0–7.5; 6.0–7.5; 7.5–8.0; 8.0–8.5; ≥ 7.54.5–5.0; 5.0–5.5; 5.5–6.0; 4.5–6.0; 6.0–6.5; 6.5–7.0; 7.0–7.5; 6.0–7.5; 7.5–8.0; 8.0–8.5; ≥7.56.0–6.5; 6.5–7.0; 7.0–7.5; 6.0–7.5; 7.5–8.0; 8.0–8.5; ≥7.5
Miscanthus5.5–6.0; 6.0–6.5; 6.5–7.0; 7.0–7.5; 6.0–7.55.5–6.0; 4.5–6.0; 6.0–6.5; 6.5–7.0; 7.0–7.5; 6.0–7.55.5–6.0; 6.0–6.5; 6.5–7.0; 7.0–7.5; 6.0–7.5
Paulownia5.5–6.0; 6.0–6.5; 6.5–7.0; 7.0–7.5; 6.0–7.5; 7.5–8.0; ≥7.54.5–5.0; 5.0–5.5; 5.5–6.0; 4.5–6.0; 6.0–6.5; 6.5–7.0; 7.0–7.5; 6.0–7.55.5–6.0; 6.0–6.5; 6.5–7.0; 7.0–7.5; 6.0–7.5; 7.5–8.0; ≥7.5
Soil thickness (cm)Cardoon0–10; 0–25; 0–30; 10–25; 25–50; 30–50; 50–100; >100
Miscanthus0–10; 0–25; 0–30; 10–250–10; 0–25; 0–30; 10–25; 25–500–10; 0–25; 0–30; 10–25
Paulownia0–10; 0–25; 0–30; 10–25; 25–50; 30–50; 50–100; >100
Ecological Soil Value3 speciesVery reduced (E.V 1); Reduced (E.V 2)Very reduced (E.V 1); Reduced (E.V 2); Variable (E.V 3)
Current PermeabilityCardoonModerate to High-Class 4; High-Class 5Very reduced (E.V 1); Reduced (E.V 2); Variable (E.V 3)
MiscanthusLow-Class 1Moderate-Class 3; Moderate to High-Class 4; High-Class 5
PaulowniaModerate to High-Class 4; High-Class 5Low-Class 1; Low to Moderate-Class 2; Moderate-Class 3
Natural and semi-natural vegetation with conservation valueCardoonVery low; LowVery low; Low; Moderate×
Miscanthus
PaulowniaVery low; Low
Soil-morphological aptitude to irrigated agricultureCardoonWithout aptitude-25.3%; Low-34.7%Without aptitude-25.3%; Low-34.7%; Moderate-4.5%
Miscanthus
Soil-morphological aptitude to silviculturePaulowniaForestry not recommended-15.7%Forestry not recommended-15.7%; Undifferentiated silviculture-20.3%
Unprotected areas3 speciesZones that not included the protected areas, namely, Important Community Sites (SIC); Protected Special Zones (ZPE); Protected Areas National Network (RNAP); Ramsar Sites (wetlands) and Biosphere Reserve
Soil susceptibility to desertificationCardoon3-High; 4-Very High2-Moderate; 3-High; 4-Very High
Miscanthus
Paulownia3-High; 4-Very High
Classification of soils according to each mine group3 speciesAs (Others); Asbestos (Asbestos); Au (Gold); Au, Ag (Gold); Ba, Pb, W, Sn (Tin and Wolfram); Barium (Polymetallic); Coal (Coal); Cu (Basic Metals); Cu, Pb, Ag (Basic Metals); Cu, Pb, Zn (Polymetallic); Fe (Iron and Manganese); Fe, Cu, Pb, Zn (Iron and Manganese); Mn (Iron and Manganese); Pb (Basic Metals); Pb, Au (Basic Metals); Pb, Zn (Basic Metals); Pb, Zn, Ag (Basic Metals); Pb, Zn, Ag (Polymetallic); Qz, Felds (Others); Ra (Radioactive); Ra, U (Radioactive); Sb (Others); Sb, Au (Gold); Sn (Tin and Wolfram); Sn, Nb, Ta, W (Tin and Wolfram); Sn, W (Tin and Wolfram); Sn, W, Ti (Tin and Volphamium); Sn, W, Ti (Tin and Volphamium); W (Tin and Wolfram); W, As (Tin and Wolfram); W, Mo (Tin and Wolfram); W, Sb, Au (Gold); W, Sn (Tin and Wolfram); W, Sn, Li (Tin and Wolfram); W, Sn, Qz (Tin and Wolfram); Zn, Pb (Basic Metals)
Wastewater Treatment Plant - WWTP capacity (p.e—population equivalent)3 species400–31,500; 31,500–97,200; 97,200–216,000; 216,000–400,000; 400,000–920,000
Treatments applied to wastewater facilities3 speciesPrimary; Secondary; Tertiary
Table 4. Data considered in each scenario for the microalgae culture.
Maps1st Scenario2nd Scenario3rd Scenario4th Scenario
DistrictsAveiro; Beja; Braga; Bragança; Castelo Branco; Coimbra; Évora; Faro; Guarda; Leiria; Lisboa; Portalegre; Porto; Santarém; Setúbal; Viana do Castelo; Vila Real; Viseu
Land Use and Land Cover - COS 20103.3.2.01.1 bare rock×
Corine Land Cover - CLC 2012Bare rock×
InsolationSuperior than 2500 h
TemperatureEqual or superior than 10 °C
Municipalities with CO2 production in the energy sector28.184080–224.886097; 224.886098–345.873456; 345.873457–974.625606; 974.625607–3602.772540; 3602.772541–8665.540705
Municipalities with CO2 production in the industrial sector26.595721–82.594012; 82.594013–226.494754; 226.494755–551.636051; 551.636052–1481.167615; 1481.167616–2788.265732
Pollutant Release and Transfer Register (PRTR)Steel; Biomass; Hydraulic lime; Non-hydraulic lime; Coal; Iron; Fuel oil; Natural gas; Kraft with bleaching; Unbleached Kraft; No specific (are just of interest the identified as Paste production, Manufacture of refined petroleum products; Manufacture of industrial gases; Manufacture of cement and iron and steel industry and manufacture of ferro-alloys); Other [it is only of interest Paste production, Manufacture of paper and paperboard (except corrugated paper); Manufacture of paper and paper products for domestic and sanitary purposes; Manufacture of refined petroleum products; Manufacture of petroleum products from waste; Manufacture of cement and production of thermal origin electricity)]; Other-Biofuels; Other-Biodiesel; Other-Co-incineration; Other-Incineration of hazardous waste; Other-Fuel Treatment; Printing and writing paper; Paper, cardboard and packaging; Bleached sulphite; Tissue (paper mills); Glass packaging; Domestic glass and Oils (Biodiesel Manufacturing Only)
Land steepnessSuperior than 25%
Presence of physical obstaclesP-Stony phase; R2-Rock outcrops exceeding 25–40% of the area; R3-Rock outcrops exceeding 50–70% of the area
Unprotected areas×Zones that not included the protected areas, namely, Important Community Sites (SIC); Protected Special Zones (ZPE); Protected Areas National Network (RNAP); Ramsar Sites (wetlands) and Biosphere Reserves×
Wastewater Treatment Plant - WWTP capacity (p.e—population equivalent)400–31,500; 31,500–97,200; 97,200–216,000; 216,000–400,000; 400,000–920,000
Treatments applied to Wastewater FacilitiesPrimary; Secondary; Tertiary
Table 5. Data considered in each scenario for cultivated agricultural-silvicultural species.
Maps1st Scenario2nd Scenario3rd Scenario
COS 2010CLC 2012COS 2015
DistrictsAveiro; Beja; Braga; Bragança; Castelo Branco; Coimbra; Évora; Faro; Guarda; Leiria; Lisboa; Portalegre; Porto; Santarém; Setúbal; Viana do Castelo; Vila Real; Viseu
Land Use and Land Cover - COS 2010All the parameters that correspond to the Agriculture (except 2.1.1.02 Greenhouses and nurseries), the areas classified as Forest (without the criteria that include aspects related to burned areas) and all the lands that correspond the agroforestry systems (SAF)××
Corine Land Cover - CLC 2012Agriculture with natural and semi-natural spaces; Rice paddies; Temporary irrigated crops; Temporary rainfed crops; Temporary crops and/or pastures associated with permanent crops; Open forests, cuts and new plantations; Hardwood forests; Softwood forests; Mixed forests; Olive groves; Orchards; Agro-forestry systems; Cultural systems and complex parcel and Vineyards.×Agriculture with natural and semi-natural spaces; Rice paddies; Temporary irrigated crops; Temporary rainfed crops; Temporary crops and/or pastures associated with permanent crops; Open forests, cuts and new plantations; Hardwood forests; Softwood forests; Mixed forests; Olive groves; Orchards; Agro-forestry systems; Cultural systems and complex parcel and Vineyards.×
COS 2015Criteria relating to agriculture as rainfed and irrigated temporary crops were considered; Rice paddies; Vineyards; Orchards; Olive groves; Temporary crops and/or pastures associated with permanent crops; Cultural systems and complex parcel and lastly, Agriculture with natural and semi-natural spaces. The SAFs of Cork oak; Holm oak; Other oaks; Stone pine; Other species; Cork oak with holm oak and Other mixed. The forest areas of Cork oak; Holm oak; Other oaks; Chestnut; Eucalyptus; Invasive species; Other hardwood; Maritime pine; Stone pine and Other××Criteria relating to agriculture as rainfed and irrigated temporary crops were considered; Rice paddies; Vineyards; Orchards; Olive groves; Temporary crops and/or pastures associated with permanent crops; Cultural systems and complex parcel and lastly, Agriculture with natural and semi-natural spaces. The SAFs of Cork oak; Holm oak; Other oaks; Stone pine; Other species; Cork oak with holm oak and Other mixed. The forest areas of Cork oak; Holm oak; Other oaks; Chestnut; Eucalyptus; Invasive species; Other hardwood; Maritime pine; Stone pine and Other
Unprotected areasZones that not included the protected areas, namely, Important Community Sites (SIC); Protected Special Zones (ZPE); Protected Areas National Network (RNAP); Ramsar Sites (wetlands) and Biosphere ReservesZones that included the protected areas, namely, Important Community Sites (SIC); Protected Special Zones (ZPE); Protected Areas National Network (RNAP); Ramsar Sites (wetlands) and Biosphere Reserves
Table 6. Estimated production of each species and scenario.
Energy Crops/SpeciesScenarioArea (km2)Area (kha)% of the Obtained Area in Mainland PortugalMinimum Productivity (t/ha)Maximum Productivity (t/ha)Minimum Production (kt)Maximum Production (kt)
🌷 Cardoon1st5.210.5210.01101558
2nd13.8210.021421
3rd128.84130.14129193
4th723.13720.817231085
🌾 Miscanthus1st0.0000.0015300.0010.002
2nd0.040.0040.000.0540.109
3rd0.170.0170.000.2620.523
4th8.740.8740.011326
🌳 Paulownia1st0.030.0030.0035450.1050.134
2nd7.640.7640.012734
3rd9.710.9710.013444
4th80.75810.9128343644
Energies 13 00937 i001 Microalgae1st293.95290.33551617
2nd234.77230.261291
3rd234.69230.261291
4th293.87290.331616
🌄 Cultivated agricultural/silvicultural species1st40,280.43402845.25
2nd55,734.56557362.61
3rdCOS 201064,761.63647672.75
CLC 201273,664.68736682.76
COS 201565,316.13653273.38

