Article

How to Select the Optimal Electrochemical Energy Storage Planning Program? A Hybrid MCDM Method

1
College of Electrical Engineering, Zhejiang University, Hangzhou 310027, Zhejiang, China
2
Green Energy Development Research Institute (Qinghai), Xining 810008, Qinghai, China
3
State Grid Qinghai Economic Research Institute, Xining 810008, Qinghai, China
4
School of Economics and Management, North China Electric Power University, Beijing 102206, China
*
Authors to whom correspondence should be addressed.
Energies 2020, 13(4), 931; https://doi.org/10.3390/en13040931
Submission received: 2 December 2019 / Revised: 9 February 2020 / Accepted: 14 February 2020 / Published: 19 February 2020

Abstract

:
Electrochemical energy storage (EES) is a promising kind of energy storage and has developed rapidly in recent years in many countries. EES planning is an important topic that can impact the earnings of EES investors and sustainable industrial development. Current studies only consider the profit or cost of the EES planning program, without considering other economic criteria such as payback period and return on investment (ROI), which are also important for determining an optimal EES planning program. In this paper, a new hybrid multi-criteria decision-making (MCDM) method integrating the Bayesian best-worst method (BBWM), the entropy weighting approach, and grey cumulative prospect theory is proposed for the optimal EES planning program selection with the consideration of multiple economic criteria. The BBWM and entropy weighting approach are jointly employed for determining the weightings of criteria, and the grey cumulative prospect theory was utilized for the performance rankings of different EES planning programs. Five EES planning programs were selected for empirical analysis, including 9MW PbC battery EES, 2MW LiFePO lithium ion battery EES, 3MW LiFePO lithium ion battery EES, 2MW vanadium redox flow battery EES, and 3MW vanadium redox flow battery EES. The empirical results indicate the 2MW LiFePO lithium ion battery EES is the optimal one. The sensitivity analysis related to different risk preferences of decision-makers also shows the 2MW LiFePO lithium ion battery EES is always the optimal EES planning program. The proposed MCDM method for the optimal EES planning program selection in this paper is effective and robust, and can provide certain references for EES investors and decision-makers.

1. Introduction

With socio-economic development and the high penetration of intermittent and uncertain renewable energy power into electric power systems, the contradiction between electric power supply and demand has become more prominent [1]. Energy storage, which can charge electric energy when the electricity supply exceeds electricity demand and can discharge electric energy when the electricity demand exceeds electricity supply, can relieve this supply and demand contradiction and contribute to the stable operation of the electric power system [2]. Therefore, energy storage has attracted increasing attention around the world, and many countries such as China and the USA have deployed energy storage in their electric power systems along with the penetration of renewable energy power [3,4,5].
There are several kinds of energy storage, including mechanical energy storage, chemical energy storage, and so on [2]. With the development of R&D and pilot applications, electrochemical energy storage (hereinafter referred to as EES) has been gradually employed in electric power systems under the current electricity market [6,7]. EES, with long lifetime, high energy conversion efficiency and low cost, has shown great advantages compared with other kinds of energy storage, and has been configured and deployed by renewable energy generation companies and power grid companies [8,9]. Currently, some kinds of EES such as lithium-ion EES meet the conditions for commercial application [10]. However, different kinds of EES hold different technological and economic characteristics in terms of aspects such as lifetime, investment cost, payback period, return on investment (hereinafter referred to as ROI), and so on. For example, the lithium-ion battery has a lower investment cost and shorter payback period compared with the vanadium flow battery, but it has a shorter lifetime. That is to say, some EESs have better performances with respect to some criteria, while showing worse performances with respect to other criteria. Therefore, confronted with conflicting criteria, the decision-maker needs to employ a method to select the optimal EES planning program, which is an important concern for commercial application and sustainable development of the EES industry. In this paper, a new hybrid multi-criteria decision-making (MCDM) method which incorporates the entropy weighting approach, the Bayesian best worst method, and grey cumulative prospect theory, is proposed in order to determine the optimal EES planning program.
Currently, there is some research focusing on the EES planning. Han et al. proposed a new optimization method and model for the planning of hybrid battery energy storage systems by employing a cooperative game model, and the Nash equilibrium solutions were obtained by using genetic algorithm for the planning of hybrid lead-acid battery, lithium ion battery and vanadium redox flow battery energy storage systems [11]. Dicoraco et al. proposed an approach for wind farm energy storage system planning and operation, and the economic feasibility was also analyzed for the combined wind-storage system [12]. Shi et al. proposed a convex cycle-based degradation model for the battery energy storage planning and operation, and used a subgradient algorithm for model solving with the objective of maximizing the battery operating profits [13]. Saboori et al. proposed an optimal method for determining the location and capacity of ESS in distribution networks with the objective of maximizing the profit of the distribution company by using mixed integer non-linear programming, and then a particle swarm optimization algorithm was used to find the optimal solution [14]. Sauhats et al. proposed a long-term investment planning and short-term scheduling method for storage power plants using a stochastic approach, and the cost–benefit analysis was performed for hydrogen storage combined with pumped storage for hydropower [15]. Kittner et al. proposed a two-factor-based model for energy storage deployment, combining the investment values in technology deployment and materials innovation covering battery storage technology [16]. Korpas et al. proposed a method and model for the operation planning of hydrogen storage combined with a wind power plant over short, medium and long periods, which takes the expected profit maximization from electric power exchange as the objective [17]. Aguado et al. proposed a method for the expansion of a power grid transmission network in consideration of energy storage systems, which was verified using an IEEE 24-bus system and modified Garver’s system [18]. Dvorkin et al. proposed a tri-level model for merchant electrochemical storage siting and sizing with centralized transmission expansion planning, which was solved by using the column-and-constraint generation technique by taking the Western Electricity Coordinating Council interconnection system [19]. Abed et al. proposed a planning and operation method for a power-electronic-based storage device combining the Battery Energy Storage System and STATCOM, taking the operational and economic benefits as the objective, and also carried out a sensitivity analysis related to battery size and capacity [20]. Xu et al. proposed a bilevel formulation method for the location and capacity optimization of energy storage systems, which can consider energy arbitrage and investments profitability, and this method was verified by using the Western Electricity Coordinating Council system [21].
Based on the current research, it can be learned that there are some researchers who have proposed some models and methods for EES planning from different perspectives, mainly using objective optimization algorithms, and who have provided valuable references for this research topic. However, current research mainly takes profit maximization or cost minimization as the objective function of the optimization model for EES planning. In fact, for an EES planning program, its economy can be reflected by many criteria; in addition to profit or cost, payback period, ROI, and so on also play a role. For an ESS planning program, although its performance with respect to profit or cost is good, the performance with respect to other economic criteria such as ROI and payback period may not be good. Therefore, the decision-maker should determine the optimal ESS planning program based on multiple views in consideration of multiple criteria. In this paper, a new hybrid method is proposed for the optimal determination of EES planning program by using a MCDM method, which considers several economic criteria including investment cost, payback period, net earnings, ROI, and battery economic lifetime.
One contribution of this paper is to propose a new hybrid MCDM method for the optimal EES planning program selection, combining the entropy weighting approach, Bayesian best worst method (BBWM) and grey cumulative prospect theory. Of these, the BBWM and entropy weighting approach are jointly used to determine the overall weights of different decision-making criteria, and can comprehensively consider the subjective weight and objective weight for each criterion, while the grey cumulative prospect theory is used for ranking the overall performances of different ESS planning programs. The BBWM is a recent MCDM method proposed in 2019, which is an extension of BWM [22] and can consider the different preferences of multiple decision-makers by using the probability distribution method [23]. The BBWM method can be used to determine the subjective weights of different decision-making criteria based on the different preferences of multiple decision-makers, and the entropy weighting approach can be used to determine the objective weights of different decision-making criteria based on the actual performance values of those criteria. Therefore, these two kinds of criteria weighting methods are jointly employed in this paper in order to consider the objective and subjective characteristics of criteria with respect to their weights. Meanwhile, the grey cumulative prospect theory is used to rank the overall performances of EES planning program alternatives, which combines the cumulative prospect theory and grey system theory in consideration of uncertainties in decision-making issues [24,25]. Although the entropy weighting approach and grey cumulative prospect theory have been employed for some issues, it can safely be said that this is the first time they and the BBWM have been employed in the field of ESS planning. Another contribution of this paper is to provide a new perspective on optimal EES planning program selection, which not only focuses on the profit and cost of the EES planning program, but also considers its other economic criteria, such as payback period, ROI, and battery economic lifetime.
The rest of this paper is structured as follows: Section 2 introduces the basic theory of the proposed MDCM method for the optimal EES planning program selection in this paper; the framework and procedure of the optimal EES planning program selection employing the proposed MCDM method is elaborated in Section 3; the empirical analysis is conducted in Section 4; the further discussion and sensitivity analysis are conducted in Section 5; Section 6 concludes this paper.

2. Basic Theory of the Proposed MCDM Method for the Optimal EES Planning Program Selection

In this paper, the optimal EES planning program is selected considering multiple criteria such as investment cost, payback period, net earnings, return on investment and battery lifetime. In fact, some economic criteria of one kind of EES planning program have better performances compared with other kinds of EES planning programs, but other economic criteria have worst performances. Therefore, these economic criteria may be conflicting, which need to be considered for decision-makers to select the optimal EES planning program. The MCDM method is a decision-making method which can consider multiple and conflicting criteria. In this paper, the proposed MCDM method for the optimal EES planning program selection includes entropy weighting approach, BBWM and grey cumulative prospect theory. The BBWM and entropy weighting approach are jointly used to determine the weights of multiple and conflicting criteria, and the grey cumulative prospect theory is utilized to rank the overall performances of EES planning program alternatives. The detailed theories of these three methods are introduced in the followings.

2.1. The BBWM

The BBWM is an extension of BWM, and can consider different preferences and opinions of multiple decision-makers. The BWM was proposed in 2015, and is a new pairwise comparison-based MCDM method. Compared with the popular and widely used pairwise comparison-based MCDM method AHP, which requires n(n−1)/2 pairwise comparisons, the BMW only needs 2n−3 pairwise comparisons, and can thus greatly reduce the number of pairwise comparisons required [22,26,27]. Different from the AHP, the decision-maker only needs to select the best and worst criteria, and then conduct comparisons between them and other criteria in the BWM. This reduced frequency of pairwise comparisons in the BWM compared with the AHP can aid decision-makers in providing more reliable comparisons among different criteria [28,29]. The detailed steps of BWM for weighting determination of decision-making criteria are elaborated as follows.
Step 1: Build a decision-making index system containing a set of decision-making criteria. The decision-making index system of the research object firstly needs to be built, including multiple decision-making criteria, embodying the performances of different alternatives from different perspectives. The decision-making index system supposes that are n criteria c 1 , c 2 , , c n .
Step 2: Identify the best criterion, represented by c B , and the worst criterion, represented by c W , from all the decision-making criteria. In this step, the decision-maker needs to select the best criterion c B and the worst ctiterion c W aaccording to his/her preference and judgement. The best criterion c B is the most significant criterion among all of the criteria, and the worst criterion is the least significant criterion among all of the other criteria in the decision-making index system.
Step 3: Conduct pairwise comparisons between the best criterion and all the criteria in the decision-making index system. The decision-maker calibrates his/her preference and subjective judgement for the best criterion compared with all other criteria in the decision-making index system, which can be expressed by an integer in the interval of [1,9]. The larger the integer value, the more important of the best criterion compared to the other criteria. After the decision-maker has conducted the pairwise comparisons between the best criterion selected from the decision-making index system and the other criteria, it is possible to obtain the ‘Best-to-Others’ vector A B , which is:
A B = a B 1 , a B 2 , , a B n
where a B j ( j = 1 , 2 , , n ) stands for the significance of the best criterion c B to criterion c j .
Step 4: Conduct pairwise comparisons between all the criteria and the worst criterion selected from the decision-making index system. The decision-maker calibrates his/her preferences and subjective judgement for the worst criterion compared with all other criteria in the decision-making index system, which can be expressed by an integer in the interval of [1,9]. The larger the integer value, the more important the criterion is compared to the worst criterion. After the decision-maker has conducted the pairwise comparisons between the worst criterion selected from the decision-making index system and all of the other criteria, it is possible to obtain the ‘Others-to-Worst’ vector A W , which is:
A W = a 1 W , a 2 W , , a n W
where a j W ( j = 1 , 2 , , n ) stands for the significance of criterion c j to the worst criterion c W .
Step 5: Calculate the optimal weights w 1 * , w 2 * , , w n * of all the decision-making criteria. According to the criteria weight determination rule of the BWM, the maximum absolute differences w B w j a B j and w j w W a j W needs to be minimized, namely:
min max j w B w j a B j , w j w W a j W s . t . j = 1 n w j = 1 w j 0 , j = 1 , 2 , , n
Equation (3) can also be transformed into Equation (4), and then the optimal weights of all the decision-making criteria can be obtained.
min ξ s . t . w B w j a B j ξ w j w W a j W ξ j = 1 n w j = 1 w j 0 , j = 1 , 2 , , n
Although the BWM has some merits, it can only determine the weights of different decision-making criteria according to the subjective judgement of only one decision-maker, and it cannot consider multiple decision-makers at the same time. If there are several decision-makers giving preferences and judgements, the BWM needs to be used several times, and each time only accounts for one decision-maker. The weights of different decision-making criteria in the case of multiple decision-makers can finally be calculated by using the arithmetic or geometric mean operator methods, which average the different weights of criteria obtained from different decision-makers using the BWM. However, this mean operator method for the case of multiple decision-makers has drawbacks such as outlier sensitivity and restricted information provision [23]. In fact, the best criteria and worst criteria selected by different decision-makers are usually different, and the pairwise comparisons between two criteria are also different. Therefore, when the BWM is used to determine the weights of different decision-making criteria, considering the fact that there are usually multiple decision-makers, the BWM needs to be extended to the group decision-making environment in consideration of the preferences and judgements of multiple decision-makers at one time. In 2019, a new group MCDM method named Bayesian best-worst method (BBWM) was proposed by researchers Mohammadi and Rezaei, and it can weight different decision-making criteria in the case of multiple decision-makers at the same time without using the mean operator method.
For the detailed computation, the BWM and BBWM have similar inputs, namely the ‘Best-to-Others’ vector A B and ‘Others-to-Worst’ vector A W , but the output of the BBWM is more than that of the BWM, and includes not only the optimal aggregated weights of different decision-making criteria that comprehensively consider the preferences and subjective judgements of different decision-makers, but also includes the confidence levels of the weighting results of different criteria.
For the BBWM, there are probabilistic interpretations for the inputs and outputs. From the perspective of probability, the decision-making criterion in the decision-making index system can be treated as a random event, and then the optimal weight of the decision-making criteria weights can be treated as its likelihood of occurrence. Therefore, after the ‘Best-to-Others’ vector A B and ‘Others-to-Worst’ vector A W are determined, they are implemented as probability distributions with multinomial distribution, and the outputs are also implemented as probability distributions with multinomial distribution [23]. The probability mass function for the multinomial distribution related to the worst criterion A W is:
P A W w = j = 1 n a j W ! j = 1 n a j W ! j = 1 n w j a j W
where w stands for the probability distribution.
The probability of event j is proportional to the frequency of the event’s occurrence and the total frequency of trials according to the multinomial distribution, namely:
w j α a j W j = 1 n a j W
Then, it can be obtained:
w j w W α a j W
Meanwhile, the best criterion A B can also be modeled by employing multinomial distribution. It should be known that the modelling for the best criterion A B is different from that of the worst criterion A W because the situation is totally the reverse for the pairwise comparisons between the best criterion A B and all of the other criteria compared to the worst criterion A W with all other criteria, namely:
A B α m u l t i n o m i a l ( 1 / w )
where / stands for the element-wise division operator.
Then, it can be obtained as:
w B w j α a B j
Therefore, the determination of the weights of all of the decision-making criteria in the BWM is transformed to an estimation of probability distribution. In the BBWM, the statistical inference technique is used for determining w in the multinomial distribution. Currently, the maximum likelihood estimation method is arguably the most popular inference technique, and is employed in the BBWM. Meanwhile, the Dirichlet distribution is used to weight all the decision-making criteria in the Bayesian inference. However, the maximum likelihood estimation inference, including both A B and A W , is hard to solve due to its complexity, and the simple Dirichlet–multinomial conjugate fails to encompass both A B and A W . Under this consideration, it is necessary to build a Bayesian hierarchical model.
Suppose there are n criteria evaluated by k decision-makers using vectors A B k and A W k . The optimal weight of the decision-making criteria is represented by w a g g , which can be obtained according to the optimal weights w k of decision-making criteria deduced from k decision-makers. A B 1 : k and A W 1 : k are known in the BBWM, but it is necessary to calculate w 1 : k and w a g g . The joint probability distribution can be obtained as:
P w a g g , w 1 : k A B 1 : k , A W 1 : k
Then, the probability of each individual variable can be calculated by utilizing the following probability rule:
P x = y P x , y
where x and y are arbitrary random variables.
For more information on the development of the Bayesian hierarchical model in the BBWM, consult Ref. [23]. The Markov-chain Monte Carlo method is utilized to determine the posterior distribution of the Bayesian hierarchical model. Compared with the BWM, the optimization problems represented by Equations (3) and (4) are replaced by the probabilistic model in the BBWM. In the meantime, the credal orderings of decision-making criteria weights are also introduced, and interested readers can consult Ref. [23].

2.2. Entropy Weighting Method

Different from the subjective weighting method BBWM, the entropy weighting method is an objective weighting method, which calculates the weights of criteria based on the actual performance data of those criteria [25]. The detailed steps are as follows.
Step 1: The original performance values of the decision-making criteria are normalized according to Equation (12).
p i j = x i j j = 1 m x i j
where x i j is the original performance value of the ith decision-making criterion for the jth alternative j, p i j is the normalized performance value of the ith decision-making criterion for the jth alternative, and m is the total number of alternatives.
Step 2: The entropy value e i can be calculated according to Equation (13).
e i = 1 ln m j = 1 m p i j ln ( p i j )
Step 3: The deviation degree g i of the i-th decision-making criterion can be computed according to Equation (14).
g i = 1 e i
Step 4: The weight λ i of criterion i can be computed as:
λ i = g i i = 1 n g i

2.3. Grey Cumulative Prospect Theory

Grey cumulative prospect theory is an extension of cumulative prospect theory through grey system theory. Cumulative prospect theory was proposed by researchers Kahneman and Tversky [30], and can consider risk and uncertainty for decision-making. In cumulative prospect theory, the prospect value V can be calculated by combining the value function v x and the weight function π w , as follows:
V j = i = 1 n π w i v x i j
where v ( x i j ) represents risk preference for the ith decision-making criterion of the jth alternative, and π ( w i ) represents the weight of the ith decision-making criterion, which can be calculated as:
v x i j = x i j α x i j 0 λ ( x i j ) β x i j < 0
π w i = w i η ( w i η + ( 1 w i ) η ) 1 / η x i j 0 w i δ ( w i δ + ( 1 w i ) δ ) 1 / δ x i j < 0
where x i j stands for the gains ( x i j 0 ) and losses ( x i j < 0 ), λ is the coefficient of risk aversion, which is equal to 2.25, α and β are concavity and convexity parameters, respectively, and α = β = 0.88 , η and δ represent the attitude of decision-maker towards gains and losses, respectively, and η = 0.61 , and δ = 0.69 [30].
Integrating grey system theory into cumulative prospect theory, the value function can be reformulated as:
v x i j = ( 1 ξ i j ) α x i j r λ [ ξ i j 1 ] β x i j < r
where r is the reference solution, and ξ i j is the grey correlation degree between x i j and r, which is computed according to Equation (20).
ξ i j = m i n i m i n j x i j r + ρ m a x i m a x j x i j r x i j r + ρ m a x i m a x j x i j r
where ρ represents the identification coefficient, which lies in the interval of [0, 1].

3. The MCDM-Based Framework and Procedure of the Optimal EES Planning Program Selection

The proposed MCDM method for the selection of an optimal EES planning program comprehensively combines the BBWM, the entropy weighting method, and grey cumulative prospect theory. The framework and procedure of the proposed MCDM model for the selection of the optimal EES planning program used in this paper is introduced in detail below.
Step 1: Build the evaluation index system for the selection of the optimal EES planning program. In the first step, the evaluation index system for the selection of the optimal EES planning program firstly needs to be built. The detailed determination process for the evaluation index system for the selection of the optimal EES planning program is as follows. Firstly, the initial criteria for the selection of the optimal of EES planning program are determined on the basis of related industrial reports and academic literature [12,15,16,17,22]. Secondly, five experts, including academic professors and enterprise practitioners in the fields of electric power systems and energy storage planning are invited to review the initial selected criteria, and then the most important criteria are determined based on their professional knowledge and practical experience. Finally, the least important criteria are deleted based on the comments from the invited experts, determining the final criteria for the selection of the optimal of EES planning program. The evaluation index system for the selection of the optimal of EES planning program includes investment cost, payback period, net earnings, battery lifetime and return on investment (ROI), which are represented by C1, C2, C3, C4, and C5, respectively, in this paper.
(1) Investment cost
The investment cost of an EES planning program includes the cost of the battery pack and battery management system, and the bidirectional converter and monitoring system, and is calculated according to Equation (21).
C 0 = γ p P r p + γ E E r c
where γ p is the unit cost of the bidirectional converter and monitoring system, γ E is the unit cost of the battery pack and battery management system, P r p is the rated power of the EES, and E r c is the rated capacity of the EES.
(2) Payback period
Payback period refers to the duration over which the cost of the EES planning program is recovered. Suppose f ( k ) 0 at the year of k and f ( k 1 ) < 0 , then the payback period of EES planning program can be calculated according to Equation (22).
T = k 1 + N P V ( k 1 ) f ( k ) ( 1 + i 0 ) k
where N P V ( k 1 ) is the net present value of EES planning program at year k-1, and f ( k ) is the net cash flow at year k.
(3) Net earnings
Net earnings are the total profit minus the total cost of the EES planning program. The profit of the EES planning program includes arbitrage income and ancillary service income through charging and discharging electric energy at different times within a certain period. The cost of the EES planning program includes discounted investment costs and operation and maintenance costs.
(4) Battery lifetime
Battery lifetime is the amount of time the battery can be used. The battery lifetime can be calculated using the battery health assessment method proposed in Ref. [31]. When the battery health assessment reaches a threshold value, the battery’s life comes to the end.
(5) ROI
The ROI is a performance measure used to evaluate the efficiency of an EES planning program, and corresponds to the average annual earnings of the EES planning program divided by discounted investment cost, namely:
R O I = N P V i 0 ( 1 + i 0 ) N ( 1 + i 0 ) N 1 C 0 × 100 %
where NPV is the net present value of the EES planning program, i 0 is the discounted rate, and N is the total number of years.
Step 2: Standardize the original performance values of the five criteria. Before ranking the performances of the EES planning programs, the original performance values of the five criteria need to be standardized in order to eliminate the impacts of units and dimensions. The ‘MAX-MIN’ standardization method is used to normalize the performance values of five decision-making criteria in this paper. The maximum attribute criteria (the larger the better, namely net earnings, battery lifetime, and ROI in this paper) can be standardized according to Equation (24).
e i j = x i j min j x i j max j x i j min j x i j
where e i j stands for the standardized performance value of the ith decision-making criterion for the jth EES planning program.
The minimum attribute criteria (the smaller the better, namely investment cost and payback period in this paper) can be standardized by
e i j = max j x i j x i j max j x i j min j x i j
Step 3: Determine the positive reference value and negative reference value for each criterion. The positive and negative reference values are important in the decision-making process, because the decision-maker usually pays more attention to the gap between the real situation and expectation. With reference to the TOPSIS method [32], the positive ideal solution (PIS) and the negative ideal solution (NIS) are employed as reference values that can embody the attitude of decision-makers when they are confronted with risks. If the reference value sequence is PIS, the decision-maker is a risk seeker, because he/she is facing loss. Meanwhile, if the reference value sequence is NIS, the decision-maker is risk averse, because he/she can obtain benefit.
The PIS can be expressed as:
R + = r 1 + , r 2 + , , r n +
where r i + = m a x j e i j .
The NIS can be represented by:
R = r 1 , r 2 , , r n
where r i = m i n j e i j .
Step 4: Compute the values based on the value function. Based on the selected PIS and NIS in step 3, the value function can be computed as:
v e i j = ( 1 ξ i j ) α i f R is the reference point λ [ ξ i j + 1 ] β i f R + is the reference point
where ξ i j and ξ i j + can be respectively calculated as:
ξ i j = m i n i m i n j e i j r i + ρ m a x i m a x j e i j r i e i j r i + ρ m a x i m a x j e i j r i
ξ i j + = m i n i m i n j e i j r i + + ρ m a x i m a x j e i j r i + e i j r i + + ρ m a x i m a x j e i j r i +
where ρ = 0.5 .
Therefore, the positive prospect value can be calculated by:
V + = ( v i j + ) n × m = ( 1 ξ i j ) α
The negative prospect values can be calculated by:
V = ( v i j ) n × m = λ [ ξ i j + 1 ] β
Step 5: Determine the weights of five criteria by employing the BBWM and entropy weighting methods. To comprehensively take the preference of decision-maker and actual performance data of criteria into consideration, the subjective weights of the five criteria are determined by using BBWM with five decision-makers by comparing the preferences of the best criterion with all of the other criteria, and between all of the other criteria and the worst one, and the objective weights of the five criteria are calculated using the entropy weighting method based on the real performance data of the five criteria. The final weights of the five criteria can be obtained by calculating the average values of the subjective weights and the objective weights of the five criteria.
Step 6: Calculate the grey cumulative prospect weights. According to Equation (18) and the calculated weights of the five criteria obtained in Step 5, the grey cumulative prospect weights π + w i and π w i can be calculated.
Step 7: Calculate the integrated grey prospect values of the EES planning programs and rank them. After the grey cumulative prospect weights of the five criteria are obtained, the integrated grey prospect values for EES planning programs can be calculated by:
V j = i = 1 n v i j + π + w i + i = 1 n v i j π w i
On the basis of the obtained integrated grey prospect values of different EES planning programs, the EES planning program with the largest integrated grey prospect value can be selected as the optimal EES planning program.
The procedure of the proposed MCDM method for selecting the optimal EES planning program in this paper is elaborated in Figure 1.

4. Empirical Analysis

In this section, the empirical analysis is performed to rank several EES planning programs and to select the optimal one by employing the proposed MCDM model, including the BBWM, the entropy weighting method, and grey cumulative prospect theory. To obtain the performance values of the five criteria selected in this paper, an optimization model for EES planning is built by an objective optimization algorithm ub consideration of several constraints such as power balance, state of charge of EES, and charge and discharge power; for a detailed elaboration of this, refer to Ref. [33]. Five EES planning programs are selected in this paper for empirical analysis, including 9MW PbC battery EES (A1), 2MW LiFePO lithium ion battery EES (A2), 3MW LiFePO lithium ion battery EES (A3), 2MW vanadium redox flow battery EES (A4), and 3MW vanadium redox flow battery EES (A5). The performance values of the five criteria for these five EES planning programs are listed in Table 1 [33].

4.1. Standardize the Original Performance Values of Five Criteria

To eliminate the impacts of the dimensions and units of decision-making criteria on the final ranking results, the original performance values of the five criteria for the five EES planning programs should be standardized according to Equations (24)–(25). The calculated normalization decision matrix E is:
E = 0 1 0.96 0.94 0.86 0.80 1 0.93 0.21 0 1 0 0.03 0.18 0.25 0.08 0 0.01 0.93 1 0.54 1 0.66 0.31 0 .

4.2. Identify the NIS and PIS Reference Values of Five Criteria

To select the optimal EES planning program from all of the alternatives by using grey cumulative prospect theory, it is very important to determine the NIS and PIS reference sequences of the five criteria. Based on the obtained normalization decision matrix E, the R + and R can be determined according to Equations (26)–(27), as follows:
R + = [ 1 , 1 , 1 , 1 , 1 ] ,   R = [ 0 , 0 , 0 , 0 , 0 ] .

4.3. Calculate the Prospect Values Based on the Value Function

Based on the obtained R + and R , the prospect values of the value functions for the five EES planning programs can be calculated. The grey correlation degree ξ i j + between e i j and R + as well as ξ i j between e i j and R can be calculated according to Equations (29)–(30), as follows:
ξ i j + = 1 0.33 0.34 0.35 0.37 0.38 0.33 0.35 0.70 1 0.33 1 0.95 0.73 0.66 0.87 1 0.98 0.35 0.33 0.48 0.33 0.43 0.62 1 ;
ξ i j = 0.33 1 0.92 0.89 0.78 0.72 1 0.87 0.39 0.33 1 0.33 0.34 0.38 0.40 0.35 0.33 0.34 0.88 1 0.52 1 0.60 0.42 0.33 .
Then, the prospective values V + and V can be calculated according to Equations (31)–(32), as follows:
V + = 0 0.70 0.69 0.69 0.67 0.65 0.70 0.68 0.34 0 0.70 0 0.07 0.31 0.38 0.17 0 0.03 0.69 0.70 0.56 0.70 0.61 0.43 0 ; V = 1.57 0 0.25 0.32 0.58 0.74 0 0.36 1.46 1.57 0 1.57 1.56 1.48 1.43 1.54 1.57 1.57 0.34 0 1.18 0 1.01 1.39 1.57 .

4.4. Calculate the Grey Cumulative Prospect Weights for the Five Criteria

To calculate the grey cumulative prospect weights of the five criteria, the integrated weights of five criteria combining the subjective weights of the five criteria determined by the BBWM and objective weights of five criteria determined by the entropy weighting approach need to firstly be calculated.

4.4.1. Calculate Subjective Weights Determined by the BBWM

In this paper, five experts in the fields of electric power systems and energy storage planning were invited to contribute. Firstly, the best criterion and the worst criterion were determined by these five experts, as listed in Table 2.
Then, the pairwise comparisons between the best criterion and all other criteria were performed by these five invited experts, and the results are tabulated in Table 3. Meanwhile, the pairwise comparisons between the worst criterion and all other criteria were also performed by these five invited experts, and the results are listed in Table 4.
Therefore, the ‘Best-to-Others’ vector A B can be obtained, namely
A B = 4 3 1 6 2 5 3 2 5 1 1 3 3 4 2 6 4 6 5 1 5 1 3 4 2 .
Meanwhile, the ‘Others-to-Worst’ vector A W can also be obtained, namely
A W = 3 1 5 1 1 4 4 2 3 5 5 5 3 2 3 1 2 1 2 2 5 6 3 6 4 .
Then, the averages of the Dirichlet distribution of w a g g can be computed by employing the MATLAB software, and these represent the optimal values of the weightings of the five decision-making criteria, namely 0.1832, 0.2257, 0.1949, 0.1478, and 0.2484. It can be seen that the ROI is the most important criterion among the five, followed by payback period, net earnings, investment cost and battery lifetime.
Figure 2 shows the credal ranking of five criteria for the optimal EES planning program selection, which shows the degree of certainty with respect to the relation of the five criteria. For example, it can be seen that the ROI is certainly more important than battery lifetime, with a confidence of 0.96, and it is more desirable than payback period, with the confidence of 0.63; the payback period is certainly more important than battery lifetime, with the confidence of 0.92, and it is more desirable than net earnings, with the confidence of 0.7.

4.4.2. Calculate Objective Weights Calculated by the Entropy Weighting Method

Based on the actual performance values of the five criteria, the objective weights of the five criteria can be calculated by using the entropy weighting method according to Equations (12)–(15), and the results are 0.4050, 0.0572, 0.3236, 0.2012, and 0.0130. From the objective weighting result, it can be seen that the investment cost is the most important, and the ROI is the least important, which is quite different from the subjective weighting results obtained from the BBWM.

4.4.3. Calculate the Grey Cumulative Prospect Weights

After the subjective weights and objective weights of the five criteria are obtained, the final hybrid weights of the five criteria can be computed considering equal significance for the subjective weights and objective weights. The integrated weights of the five decision-making criteria are:
w * = ( 0.2941 , 0.1414 , 0.2592 , 0.1746 , 0.1307 ) .
Then, according to Equation (18), the grey cumulative prospect weights π + w i and π w i can be calculated, namely:
π + ( w i ) = ( 0.3152 , 0.2206 , 0.2960 , 0.2442 , 0.2123 ) ; π ( w i ) = ( 0.3236 , 0.2093 , 0.3 , 0.2371 , 0.1997 ) .

4.5. Calculate the Integrated Grey Prospect Values for the Five EES Planning Programs

Based on the calculated prospective values V+ and V and the calculated grey cumulative prospect weights π + w i and π w i , the integrated grey prospect values of the five EES planning programs can be obtained according to Equation (16). The integrated grey prospect values of the five EES planning programs and the final ranking for these five EES planning programs are listed in Table 5. It indicates that the 2MW LiFePO lithium ion battery EES is the optimal EES planning program, followed by 2MW vanadium redox flow battery EES, 3MW LiFePO lithium ion battery EES, 9MW PbC battery EES, and 3MW vanadium redox flow battery EES.

5. Discussions

In this section, the obtained ranking results are analyzed, and a sensitivity analysis is also performed.

5.1. Discussion of Ranking Results

In this paper, a new hybrid MCDM method is proposed for the selection of the optimal EES planning program, by combining the BBWM, the entropy weighting method, and grey cumulative prospect theory. Five EES planning programs are treated as empirical analysis objects, and the empirical results show that, by employing the proposed MCDM method, the 2MW LiFePO lithium ion battery EES can be identified as the optimal EES planning program. This finding will be further discussed from the perspectives of criteria weights and criteria performance values.
According to the subjective weights of five criteria determined by the BBWM, the invited experts paid more attention to ROI, payback period, and net earnings, and less attention to investment cost and battery lifetime. According to the objective weights of the five criteria obtained from the entropy weighting approach, the investment cost, net earnings and battery lifetime were emphasized, but the payback period and ROI were not emphasized. According to the integrated weights of the five criteria obtained by combining the subjective weights and objective weights, net earnings and investment cost were the most significant criteria.
The performance of the 2MW LiFePO lithium ion battery EES with respect to the investment cost criterion is much better than the other alternatives, and the integrated weight of this criterion is large. Meanwhile, the payback period and ROI of 2MW LiFePO lithium ion battery EES have the best performances. Although the net earnings of 2MW LiFePO lithium ion battery EES has poor performance, there is only a narrow gap between it and the other EES planning program alternatives. Therefore, considering the above points, the 2MW LiFePO lithium ion battery EES was finally selected as the optimal EES planning program.

5.2. Sensitivity Analysis

For grey cumulative prospect theory, the risk preferences of decision-makers for the optimal EES planning program selection are reflected by the parameters α, β and λ in Equation (19), respectively. α and β are sensitivity reduction parameters located in the interval of (0, 1). The α represents the concavity degree of value function in the gain interval, and the β stands for the convexity degree of value function in the loss interval. The λ is a risk aversion coefficient, and the larger the value, the more sensitive the decision-maker is to risk. For α and β, the larger the values, the less likely the decision-maker will be to avoid risk. The risk preferences of decision-makers may impact the ranking results. Therefore, a sensitivity analysis is conducted with respect to these three parameters in this paper.
The values of α, β and λ are assumed to vary in the following three scenarios to stand for various risk preferences of decision-makers:
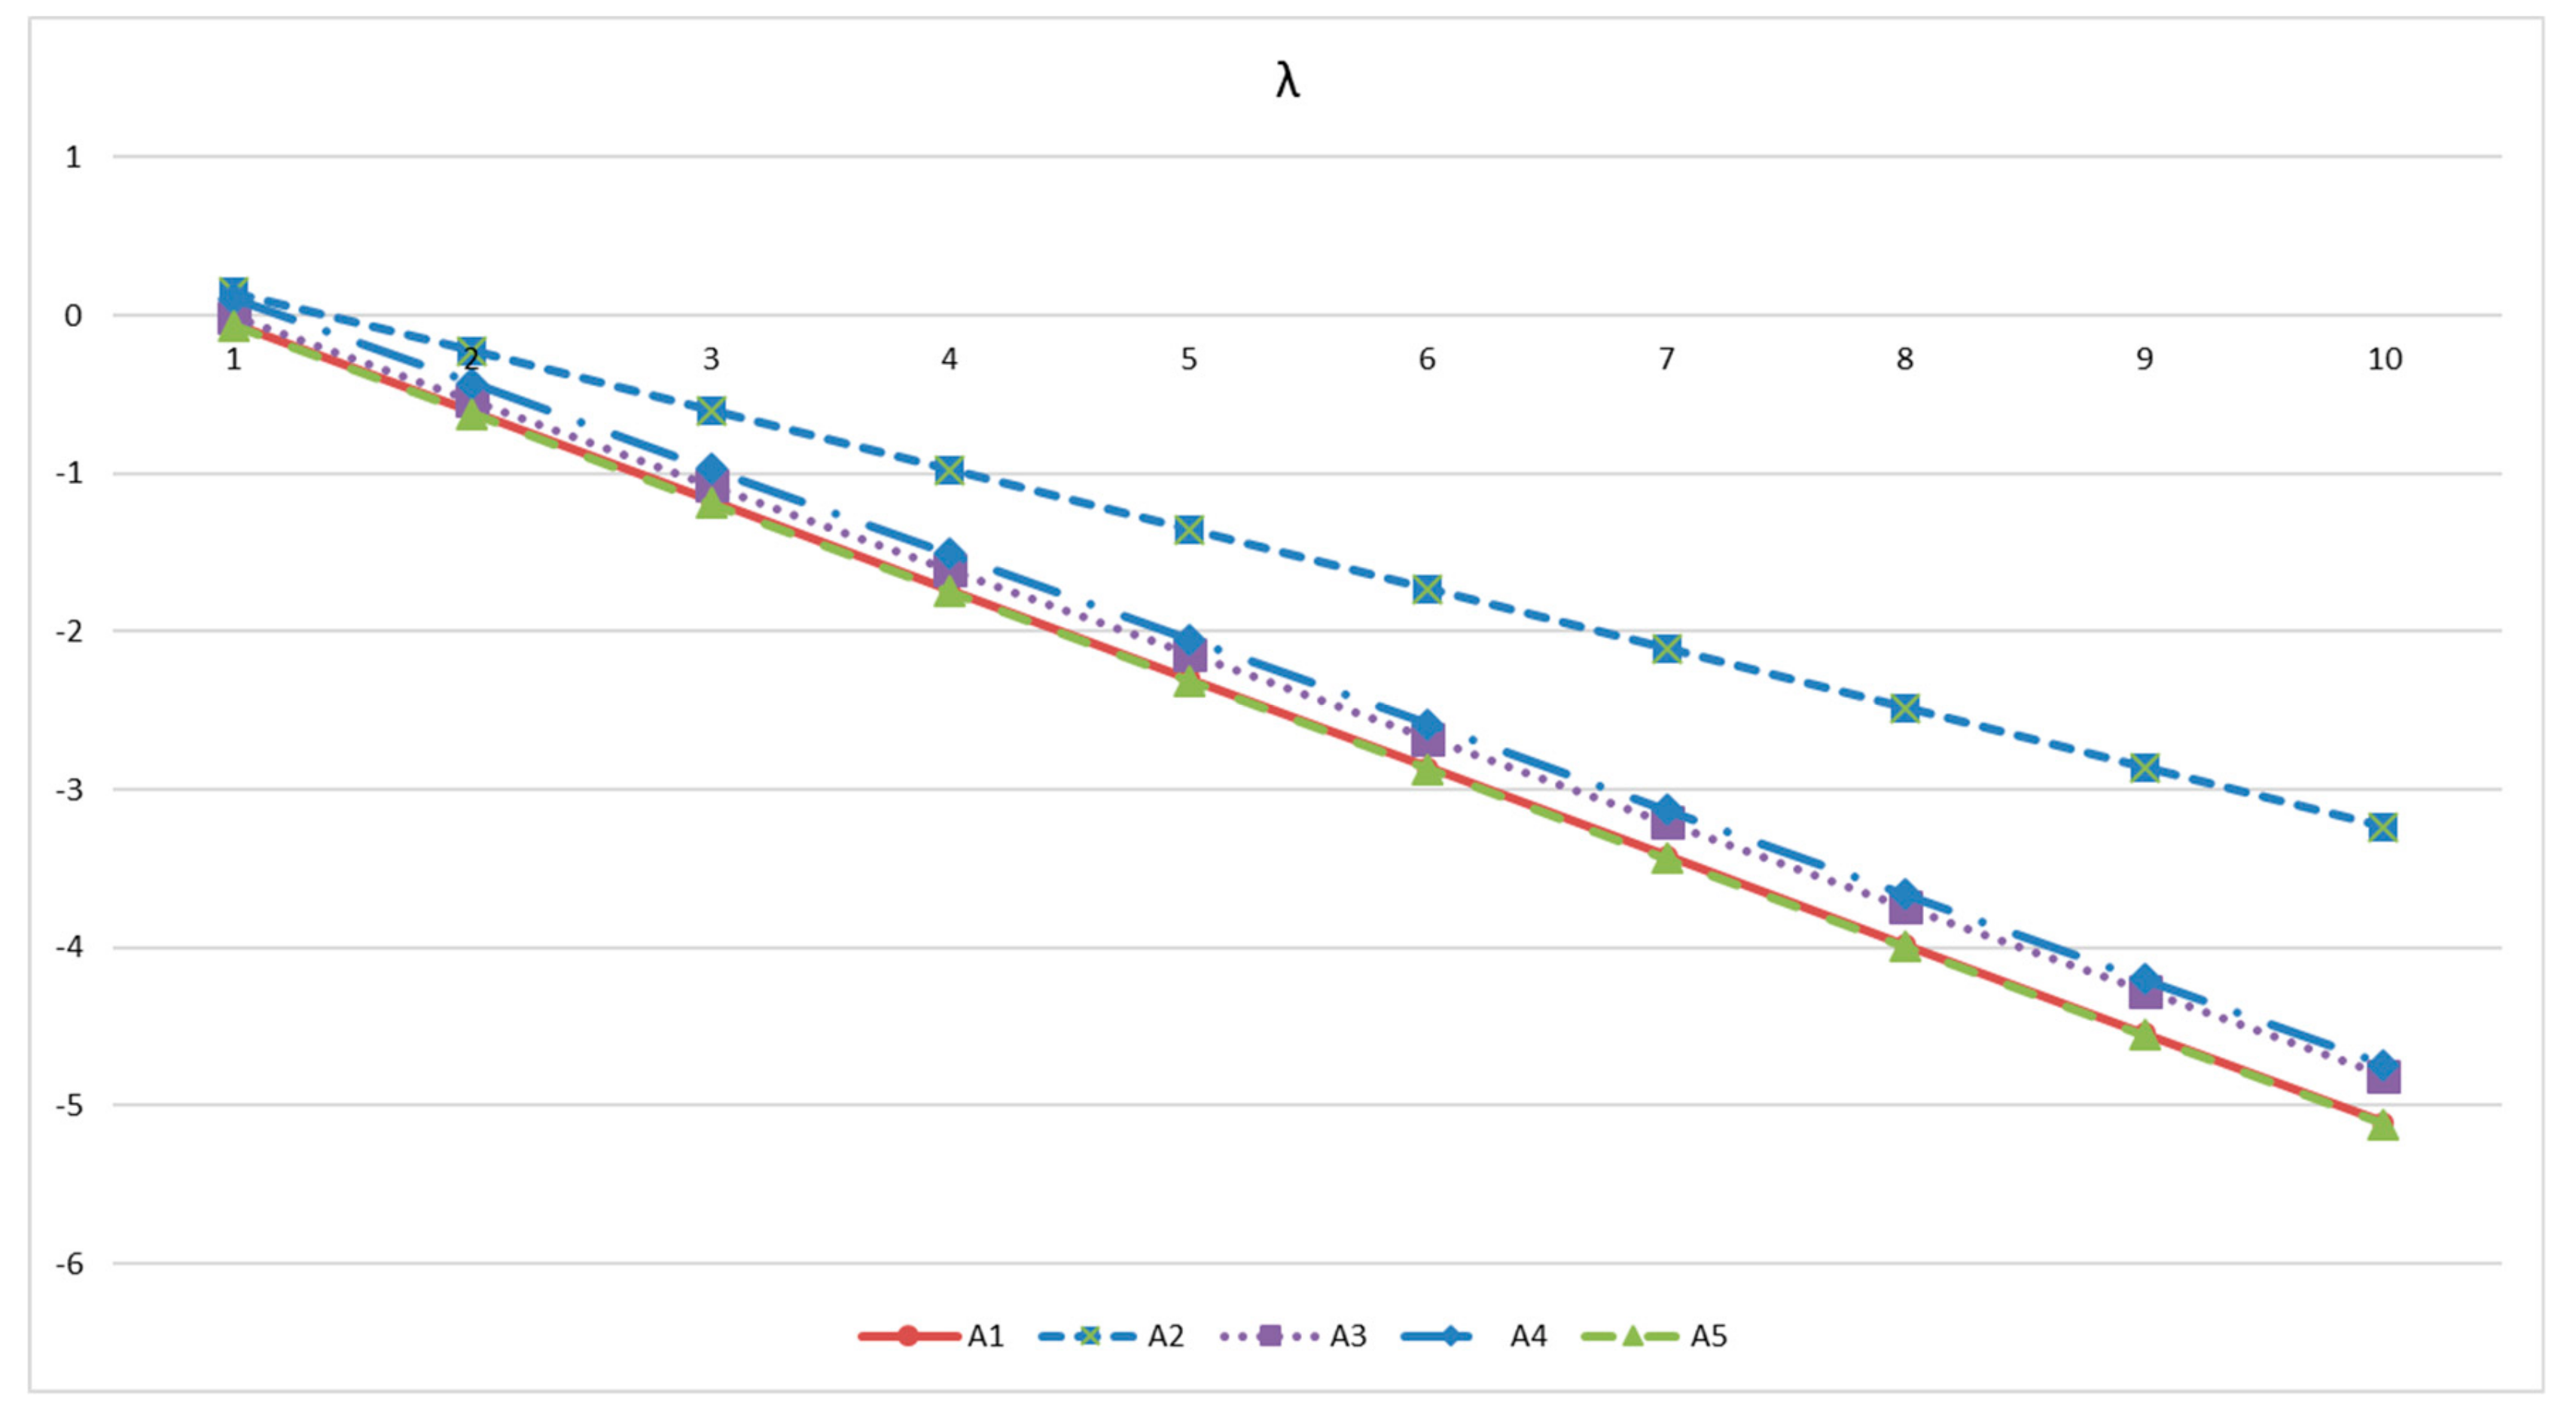
Scenario 1: λ value will vary from 1 to 10.
Scenario 2: α value will vary from 0 to 1.
Scenario 3: β value will vary from 0 to 1.
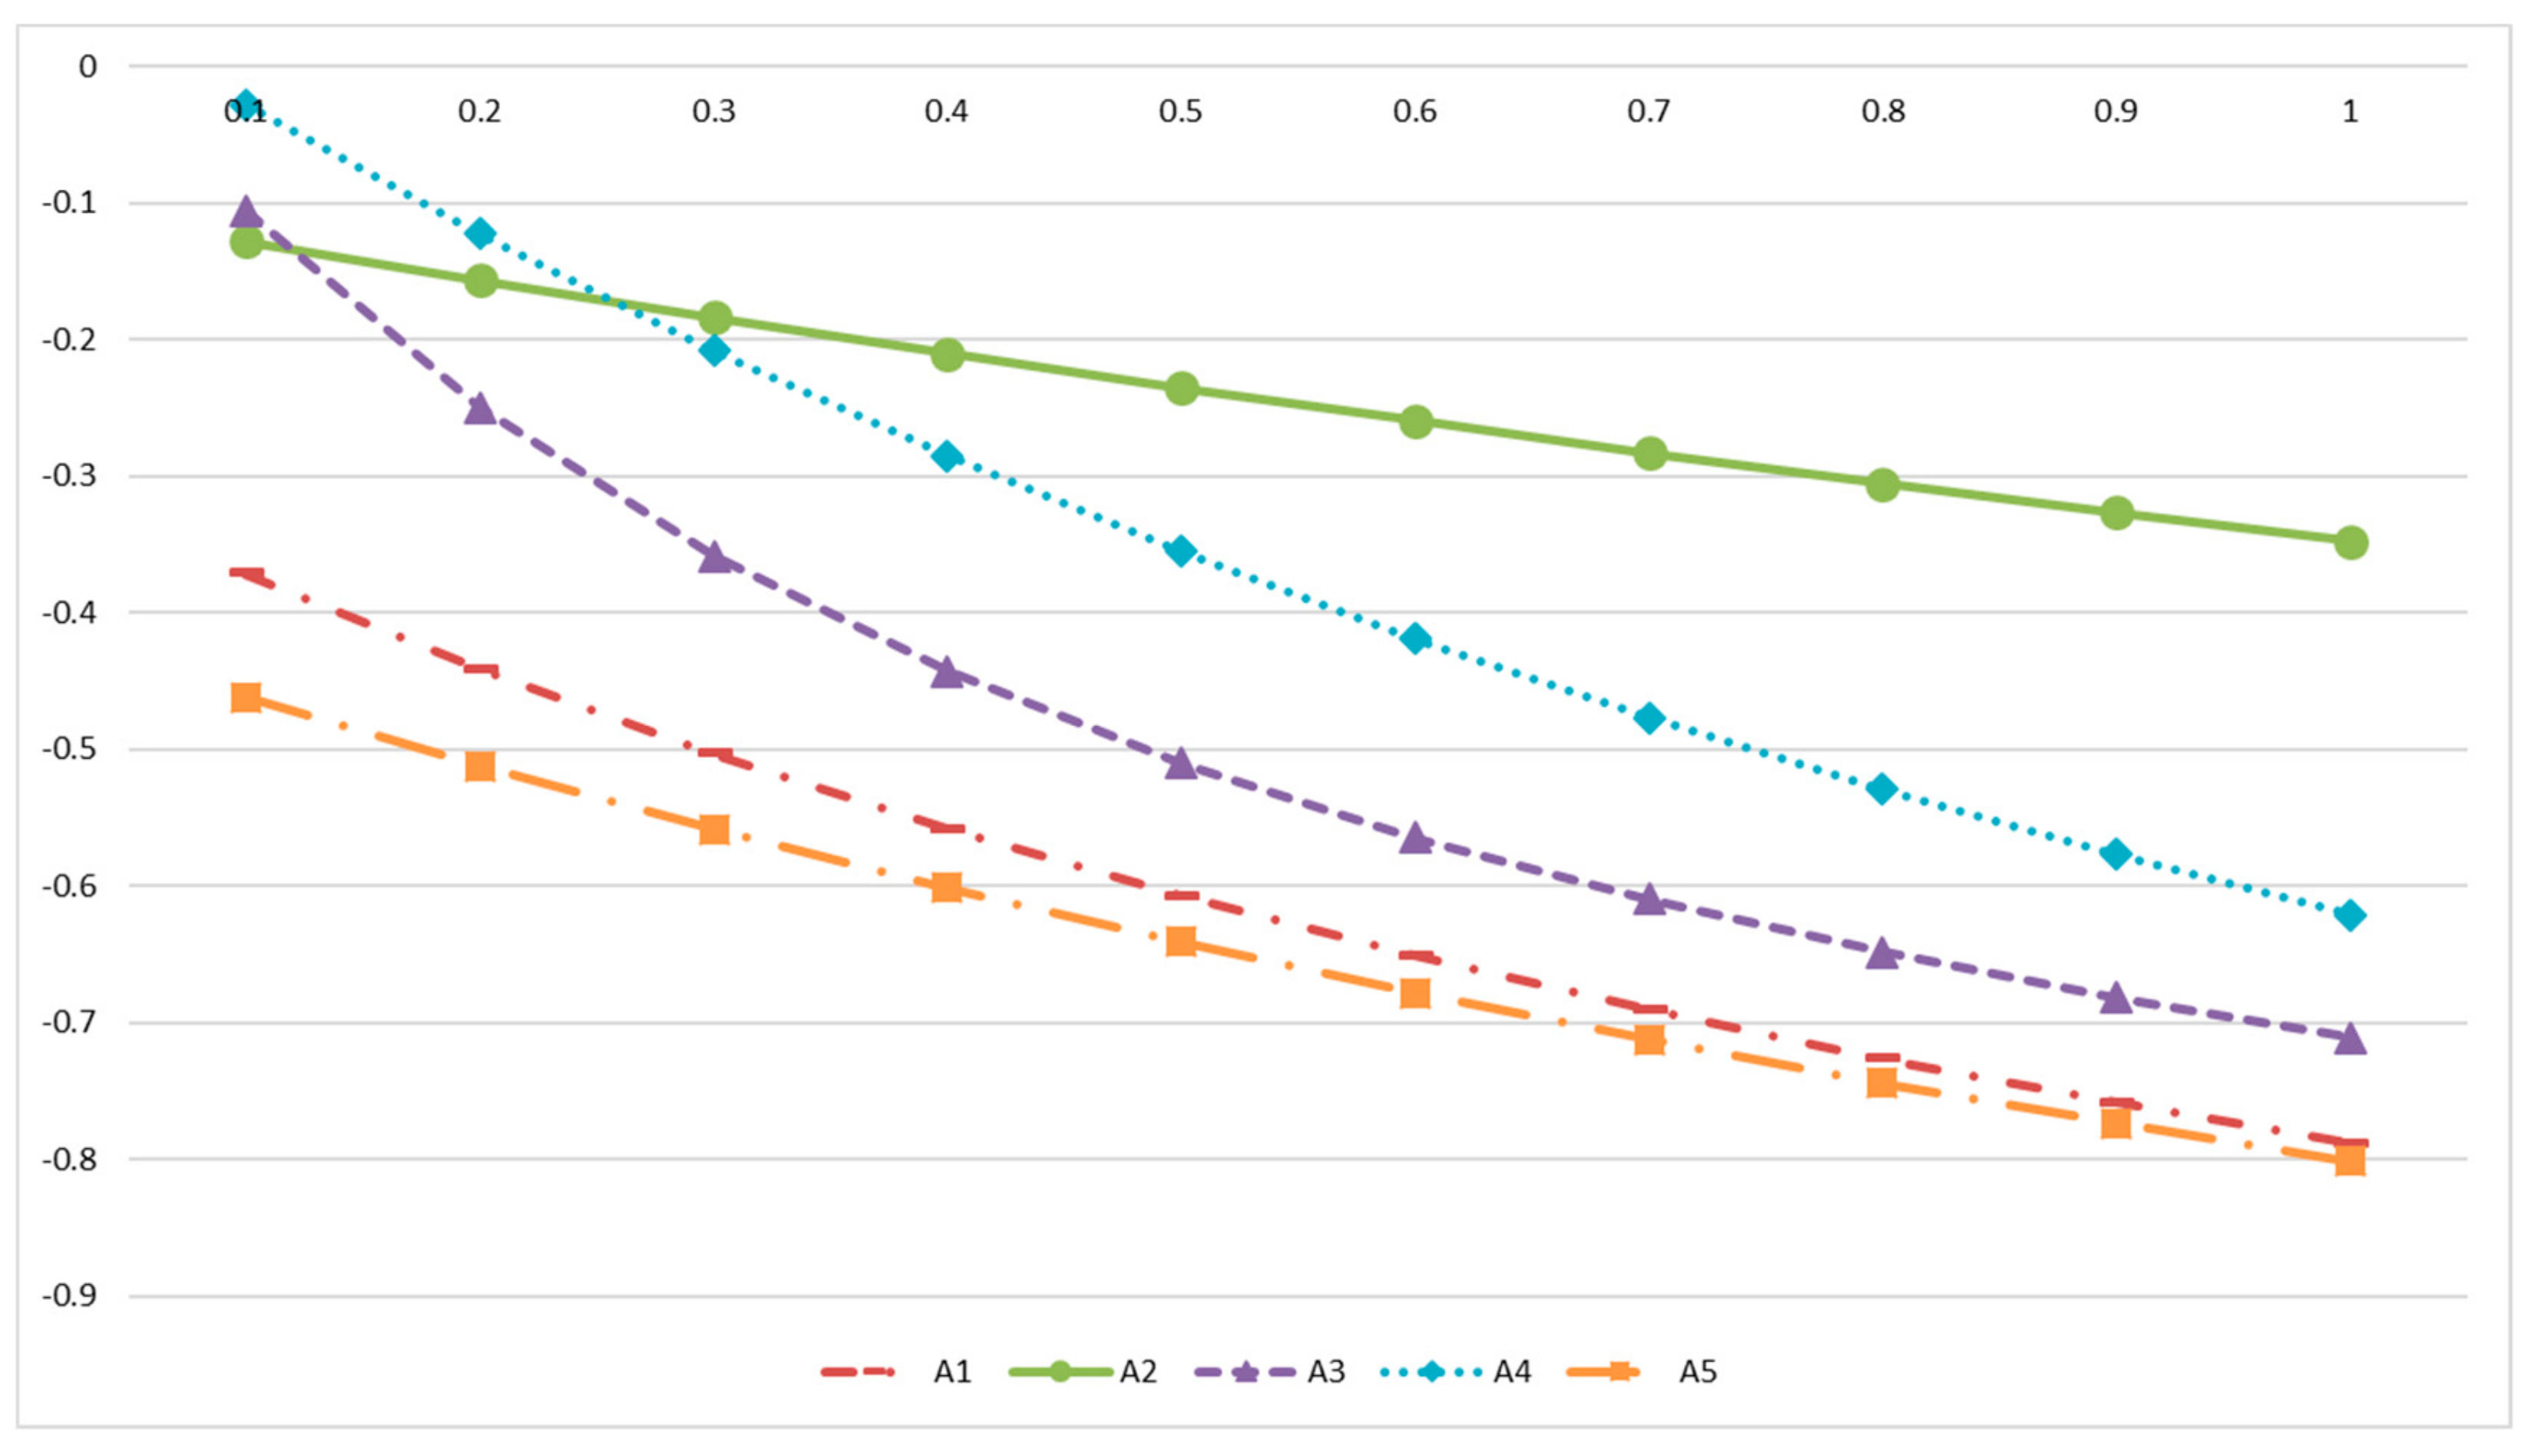
The change trajectories of the integrated prospect values of five EES planning programs obtained from the sensitivity analysis under different risk preferences (three scenario) are shown in Figure 3, Figure 4 and Figure 5. It can be seen that the rankings of the five EES planning programs are basically not sensitive to the value change of α and λ, but they are sensitive to the value change of β. In Figure 3, it can be seen that the change trajectories of the integrated prospect values of five EES planning programs are the same, and that the 2MW LiFePO lithium ion battery EES is always the optimal EES planning program. In Figure 4, it can be seen that the change trajectories of the integrated prospect values of the five EES planning programs are basically the same, except for α = 0.1 and α = 0.2, and based on the whole view, the 2MW LiFePO lithium ion battery EES is still the optimal EES planning program. In Figure 5, it can be seen that the change trajectories of the integrated prospect values of the five EES planning programs are different, especially for the 2MW vanadium redox flow battery EES, 3MW LiFePO lithium ion battery EES, 9MW PbC battery EES, and 3MW vanadium redox flow battery EES, and the ranking order for these four alternatives changes after β > 0.5, but the 2MW LiFePO lithium ion battery EES is still the optimal EES planning program.

6. Conclusions

The EES is a promising kind of energy storage that has developed rapidly in China and many other countries. Currently, the cost of EES is still high, and investors pay a great deal of attention to the economy of EES planning programs. However, the economy of an EES planning program may be uncertain, and is dependent on the economic criteria employed. For example, the investment cost of the lithium ion battery EES is lower compared with other EESs, but the net earnings are also lower than those of other EESs. This means that the economic criteria of EES planning programs may be conflicting. Therefore, it is very important to propose a method for optimizing EES planning program selection with consideration of conflicting economic criteria, and that can provide a valuable point of reference for EES investors and decision-makers. In this paper, a new hybrid MCDM method is proposed in order to determine optimal EES planning program selection, combining the BBWM, entropy weighting method, and grey cumulative prospect theory. The empirical analysis is conducted in relation to five EES planning programs, including 9MW PbC battery EES, 2MW LiFePO lithium ion battery EES, 3MW LiFePO lithium ion battery EES, 2MW vanadium redox flow battery EES and 3MW vanadium redox flow battery EES. The empirical results show the 2MW LiFePO lithium ion battery EES to be the optimal EES planning program among those five EES planning programs. Meanwhile, this finding is also further discussed from two perspectives, namely criteria weights and performance values, and sensitivity analysis. The sensitivity analysis with respect to risk preferences of decision-makers indicates that the 2MW LiFePO lithium ion battery EES is the optimal EES planning program in most cases, which verifies the robustness of the findings obtained from the proposed MCDM method for the optimal EES planning program selection in this paper.
Although it is verified that the proposed new hybrid MCDM model is feasible and applicable for optimal EES planning program selection, considering the complexity and uncertainty of EES planning, with the development of EES program, the economic criteria can be improved in the future. Meanwhile, it can also be attempted to use the new hybrid MCDM method proposed in this paper for other issues, such as electricity generation planning and power grid planning.

Author Contributions

Conceptualization, S.G.; Data curation, H.Z., X.Z. and X.M.; Formal analysis, H.Z., X.Z. and X.M.; Investigation, H.Z. and S.G.; Methodology, N.L. and S.G.; Project administration, S.G.; Resources, H.Z., X.Z. and X.M.; Software, X.Z. and X.M.; Writing—original draft, N.L.; Writing—review & editing, S.G. All authors have read and agreed to the published version of the manuscript.

Funding

This paper is supported by the project “Policy research and application on electricity retail price under the model of electricity retail side degradation” of the Science and Technology Project of the State Grid Corporation of China (SGNY0000CSJS1800046), the project “Research on the operation mode of electricity market under the background of massive delivery of clean energy—Energy storage market” of the Green Energy Development Research Institute (Qinghai) and the State Grid Qinghai Economic Research Institute, and the Natural Science Foundation of China under Grant No. 71801092.

Conflicts of Interest

The authors declare no conflict of interest.

Nomenclature

EESelectrochemical energy storage
ROIreturn on investment
MCDMmulti-criteria decision-making
BBWMBayesian best worst method
BWMbest worst method
AHPAnalytic Hierarchy Process
NPVnet present value
TOPSISTechnique for Order Preference by Similarity to an Ideal Solution
PISpositive ideal solution
NISnegative ideal solution
c B the best criterion
c W the worst ctiterion
A B ‘Best-to-Others’ vector
A W ‘Others-to-Worst’ vector
w agg optimal weight of decision-making criteria
x ij original performance value of the ith decision-making criterion for the jth alternative j,
p ij normalized performance value of the ith decision-making criterion for the jth alternative
mtotal amount of alternatives
e i entropy value
g i deviation degree
Vprospect value
v ( x i j ) risk preference for the ith decision-making criterion of the jth alternative
π ( w i ) the weight of the ith decision-making criterion
α concavity parameter
β convexity parameter
ξ ij grey correlation degree
ρ identification coefficient
γ p unit cost of bidirectional converter and monitoring system
γ E unit cost of battery pack and battery management system
P r p rated power of EES
E r c rated capacity of EES
N P V ( k 1 ) net present value of EES planning program at the year of k-1
f ( k ) net cash flow at the year of k
NPVnet present value of EES planning program
i 0 discounted rate
e i j standardized performance value of the ith decision-making criterion for the jth EES planning program

References

  1. Zhao, H.; Guo, S.; Zhao, H. Provincial energy efficiency of China quantified by three-stage data envelopment analysis. Energy 2019, 166, 96–107. [Google Scholar] [CrossRef]
  2. Ibrahim, H.; Ilinca, A.; Perron, J. Energy storage systems—Characteristics and comparisons. Renew. Sustain. Energy Rev. 2008, 12, 1221–1250. [Google Scholar] [CrossRef]
  3. Zhang, N.; Lu, X.; McElroy, M.B.; Nielsen, C.P.; Chen, X.; Deng, Y.; Kang, C. Reducing curtailment of wind electricity in China by employing electric boilers for heat and pumped hydro for energy storage. Appl. Energy 2016, 184, 987–994. [Google Scholar] [CrossRef] [Green Version]
  4. Beaudin, M.; Zareipour, H.; Schellenberglabe, A.; Rosehart, W. Energy storage for mitigating the variability of renewable electricity sources: An updated review. Energy Sustain. Dev. 2010, 14, 302–314. [Google Scholar] [CrossRef]
  5. Yu, H.; Duan, J.; Du, W.; Xue, S.; Sun, J. China’s energy storage industry: Develop status, existing problems and countermeasures. Renew. Sustain. Energy Rev. 2017, 71, 767–784. [Google Scholar] [CrossRef]
  6. Dunn, B.; Kamath, H.; Tarascon, J.-M. Electrical energy storage for the grid: A battery of choices. Science 2011, 334, 928–935. [Google Scholar] [CrossRef] [PubMed] [Green Version]
  7. Yang, Z.; Zhang, J.; Kintner-Meyer, M.C.; Lu, X.; Choi, D.; Lemmon, J.P.; Liu, J. Electrochemical energy storage for green grid. Chem. Rev. 2011, 111, 3577–3613. [Google Scholar] [CrossRef]
  8. Gogotsi, Y.; Simon, P. True performance metrics in electrochemical energy storage. Science 2011, 334, 917–918. [Google Scholar] [CrossRef] [Green Version]
  9. Goodenough, J.B. Electrochemical energy storage in a sustainable modern society. Energy Environ. Sci. 2014, 7, 14–18. [Google Scholar] [CrossRef]
  10. Zhang, Y.; Gevorgian, V.; Wang, C.; Lei, X.; Chou, E.; Yang, R.; Li, Q.; Jiang, L. Grid-level application of electrical energy storage: Example use cases in the United States and China. IEEE Power Energy Mag. 2017, 15, 51–58. [Google Scholar] [CrossRef]
  11. Han, X.; Ji, T.; Zhao, Z.; Zhang, H. Economic evaluation of batteries planning in energy storage power stations for load shifting. Renew. Energy 2015, 78, 643–647. [Google Scholar] [CrossRef]
  12. Dicorato, M.; Forte, G.; Pisani, M.; Trovato, M. Planning and operating combined wind-storage system in electricity market. IEEE Trans. Sustain. Energy 2012, 3, 209–217. [Google Scholar] [CrossRef]
  13. Shi, Y.; Xu, B.; Tan, Y.; Zhang, B. A convex cycle-based degradation model for battery energy storage planning and operation. In Proceedings of the 2018 Annual American Control Conference (ACC), Milwaukee, WI, USA, 27–29 June 2018; pp. 4590–4596. [Google Scholar]
  14. Saboori, H.; Hemmati, R. Optimal management and planning of storage systems based on particle swarm optimization technique. J. Renew. Sustain. Energy 2016, 8, 024105. [Google Scholar] [CrossRef]
  15. Sauhats, A.; Coban, H.H.; Baltputnis, K.; Broka, Z.; Petrichenko, R.; Varfolomejeva, R. Optimal investment and operational planning of a storage power plant. Int. J. Hydrogen Energy 2016, 41, 12443–12453. [Google Scholar] [CrossRef]
  16. Kittner, N.; Lill, F.; Kammen, D.M. Energy storage deployment and innovation for the clean energy transition. Nat. Energy 2017, 2, 17125. [Google Scholar] [CrossRef]
  17. Korpas, M.; Holen, A.T. Operation planning of hydrogen storage connected to wind power operating in a power market. IEEE Trans. Energy Convers. 2006, 21, 742–749. [Google Scholar] [CrossRef]
  18. Aguado, J.; de la Torre, S.; Triviño, A. Battery energy storage systems in transmission network expansion planning. Electr. Power Syst. Res. 2017, 145, 63–72. [Google Scholar] [CrossRef]
  19. Dvorkin, Y.; Fernandez-Blanco, R.; Wang, Y.; Xu, B.; Kirschen, D.S.; Pandžić, H.; Watson, J.-P.; Silva-Monroy, C.A. Co-planning of investments in transmission and merchant energy storage. IEEE Trans. Power Syst. 2017, 33, 245–256. [Google Scholar] [CrossRef]
  20. Abed, N.; Teleke, S.; Castaneda, J. Planning and operation of dynamic energy storage for improved integration of wind energy. In Proceedings of the 2011 IEEE Power and Energy Society General Meeting, Detroit, MI, USA, 24–28 July 2011; pp. 1–7. [Google Scholar]
  21. Xu, B.; Wang, Y.; Dvorkin, Y.; Fernández-Blanco, R.; Silva-Monroy, C.A.; Watson, J.-P.; Kirschen, D.S. Scalable planning for energy storage in energy and reserve markets. IEEE Trans. Power Syst. 2017, 32, 4515–4527. [Google Scholar] [CrossRef]
  22. Rezaei, J. Best-worst multi-criteria decision-making method. Omega 2015, 53, 49–57. [Google Scholar] [CrossRef]
  23. Mohammadi, M.; Rezaei, J. Bayesian Best-Worst Method: A Probabilistic Group Decision Making Model. Omega 2019. [Google Scholar] [CrossRef]
  24. Klein, M.; Deissenroth, M. When do households invest in solar photovoltaics? An application of prospect theory. Energy Policy 2017, 109, 270–278. [Google Scholar] [CrossRef] [Green Version]
  25. Zhao, H.; Guo, S.; Zhao, H. Selecting the optimal micro-grid planning program using a novel multi-criteria decision making model based on grey cumulative prospect theory. Energies 2018, 11, 1840. [Google Scholar] [CrossRef] [Green Version]
  26. Guo, S.; Zhao, H. Fuzzy best-worst multi-criteria decision-making method and its applications. Knowl.-Based Syst. 2017, 121, 23–31. [Google Scholar] [CrossRef]
  27. Zhao, H.; Guo, S.; Zhao, H. Comprehensive benefit evaluation of eco-industrial parks by employing the best-worst method based on circular economy and sustainability. Environ. Dev. Sustain. 2018, 20, 1229–1253. [Google Scholar] [CrossRef]
  28. Rezaei, J. Best-worst multi-criteria decision-making method: Some properties and a linear model. Omega 2016, 64, 126–130. [Google Scholar] [CrossRef]
  29. Zhao, H.; Guo, S.; Zhao, H. Comprehensive assessment for battery energy storage systems based on fuzzy-MCDM considering risk preferences. Energy 2019, 168, 450–461. [Google Scholar] [CrossRef]
  30. Tversky, A.; Kahneman, D. Advances in prospect theory: Cumulative representation of uncertainty. J. Risk Uncertain. 1992, 5, 297–323. [Google Scholar] [CrossRef]
  31. Xiu, X.; Tang, W.; Li, J.; Tian, C. Collaborative optimization method for geenration-storage-load considering battery healthy assessment. High Volt. Eng. 2017, 43, 3118–3126. [Google Scholar]
  32. Behzadian, M.; Otaghsara, S.K.; Yazdani, M.; Ignatius, J. A state-of the-art survey of TOPSIS applications. Expert Syst. Appl. 2012, 39, 13051–13069. [Google Scholar] [CrossRef]
  33. Xiu, X. Research on Capacity Optimization Configuration and Life Cycle Economic Evaluation Method of Energy Storage System. Ph.D. Thesis, China Agricultural University, Beijing, China, 2018. [Google Scholar]
Figure 1. The procedure of the proposed MCDM model for selecting the optimal MCDM planning program.
Energies 13 00931 g001
Figure 2. The credal ranking of five criteria for the optimal EES planning program.
Energies 13 00931 g002
Figure 3. The integrated prospect values of five EES planning programs with different λ values.
Energies 13 00931 g003
Figure 4. The integrated prospect values of five EES planning programs with different α values.
Energies 13 00931 g004
Figure 5. The integrated prospect values of five EES planning programs with different β values.
Energies 13 00931 g005
Table 1. Five EES planning programs and the criteria values.
AlternativeA1A2A3A4A5
Program name9MW PbC battery EES2MW LiFePO lithium ion battery EES3MW LiFePO lithium ion battery EES2MW vanadium redox flow battery EES3MW vanadium redox flow battery EES
C163005207808751312.5
C25.214.034.468.7610.03
C3592.0349.5763.91148.8186.65
C48.76.76.9130.932.61
C56.91%8.54%7.34%6.10%5.00%
Table 2. The best criterion and the worst criterion determined by five invited experts.
Expert NumberThe Best CriteriaThe Worst Criteria
1net earningsbattery lifetime
2ROIinvestment cost
3investment costbattery lifetime
4ROIinvestment cost
5payback periodinvestment cost
Table 3. Pairwise comparisons between the best criterion and all other criteria for five experts.
Expert Number12345
The Best CriteriaC3C5C1C5C2
C145165
C233341
C312363
C465454
C521212
Table 4. Pairwise comparisons between the worst criterion and all other criteria for five experts.
Expert Number12345
The Worst Sub-CriteriaC4C1C4C1C1
C131511
C244235
C355323
C412122
C556364
Table 5. The integrated grey prospect values and rankings of five EES planning programs.
The Evaluated EES Planning ProgramsA1A2A3A4A5
The integrated grey prospect values−0.7522−0.3222−0.6748−0.5676−0.7676
RankingA2 > A4 > A3 > A1 > A5