Abstract
A modified computational fluid dynamic (CFD) model has been developed to obtain oil removal efficiency for oily wastewater treatment in large-scale flotation tanks. According to the investigation of oil droplet/bubble interactions in a flotation tank, a modified Bloom–Heindel model is used to calculate the collision and attachment efficiencies between oil droplets and bubbles. Effects of the gas flow rate, oil diameter and oil concentration on oil removal efficiency of flotation tank were analyzed experimentally. The application scope of this modified CFD model is evaluated using experimental results. In addition, the comparison between the existing model and the modified model demonstrates that this modified CFD model can make a good prediction for the separation performance of the flotation tank.
1. Introduction
The production and processing of crude oil can generate oily wastewater. This water contains oil, chemicals, organics, salts and other components, which can seriously impact the environment and the human health [1]. Therefore, environmental agencies have established stringent discharge limits. For example, the Oslo Paris Convention requires that the discharge limit of oil and grease in produced water coming from petroleum plants in the northeast Atlantic Ocean should be 30 mg L−1 [2]. In order to meet the environmental protection requirements, many separation technologies have been used to improve water quality and oil recovery. The offshore oil platform is small in space. Many oilfields have entered a high water cut stage. Large quantities of produced waters are generated every day. Because of the short retention time, high loading rate, small footprint and good separation efficiency, gas flotation has been widely practiced as an accelerated gravitational separation technique [3].
A number of experimental investigations on the gas flotation system have been reported. Qi et al. [4] used loop-flow flotation technology to treat emulsion alkali/surfactant/polymer (ASP) wastewater. The impact of temperature, gas flow rate, and concentrations of chemicals on oil removal efficiency was investigated. The influences of operating parameters (feed rate, underflow split ratio, aeration rate, frother consumption and circulating pressure) on the efficiency of the oil removal from a flotation column were experimentally studied by Xu et al. [1]. Aliff et al. [5] used dissolved air flotation to investigate the effects of several operational parameters on oil removal efficiency. Therefore, oil removal efficiency is influenced by various factors. An experimental investigation is an effective approach for analyzing oil removal efficiency of gas flotation tanks. However, experimental investigation of oil flotation is time consuming and expensive, hence the need to resort to modelling studies.
Since computer technology and calculation models have been improved, computational fluid dynamic (CFD) simulation techniques have been a useful method to model physical processes [6]. Kwon et al. [7] amalgamated CFD models with Acoustic Doppler Velocimetry techniques to investigate the influence of aspect ratio on the flow characteristics and bubble distribution in a full-scale dissolved air flotation system. Behin and Bahrami [8] applied a CFD model to simulate a dissolved air flotation tank and obtain the fluid flow regime. Basavarajappa and Miskovic [9] gave a good summarization on most prominent studies and proposed a corrected QMOM model. They used a corrected CFD-PBM model to study the gas characteristics of a flotation cell. However, these studies emphasized the hydrodynamic characteristics of the flotation tank, and research on oil removal efficiency is relatively rare. He et al. [10] used CFD software to analyze the volume fraction distribution of oil, gas and water in a flotation tank. Based on the simulated results, oil removal efficiency was obtained. However, the effect of the interaction between bubbles and oil droplets on removal efficiency was not evaluated.
The process of bubble–oil droplet interaction includes collision and adhesion. This important process is not considered in the current CFD models for calculating oil removal efficiency of flotation tanks. This is because there is no detailed analysis of the interaction between bubbles and oil droplets [11]. Nevertheless, several CFD models involving the process of bubble-mineral particle interaction were applied to simulate flotation cells used in mineral processing. Koh and coworkers completed the modelling of a Denver-type flotation tank by using a CFD model including efficiencies of the bubble–particle collision, attachment, and detachment [12,13]. The predicted flotation rate constants obtained by numerical simulation were in good agreement with the measurements [14]. The expressions of the collision, attachment, and detachment efficiencies were also derived by Bloom–Heindel [15]. Based on the available microprocessing probabilities, a CFD model for a semi-batch flotation process was proposed. In addition, the model has been proven to be effective for predicting the removal efficiency of mineral particles. Karimi et al. [14] combined flotation kinetic expressions in a CFD model to obtain the performance of a Rushton turbine flotation tank. However, these CFD models are applicable for mineral processing. There are some differences between oil flotation and mineral processing. The key difference is that the density of mineral particles is larger than that of water, whereas the density of oil droplets is smaller than that of water [11]. Therefore, it is necessary to investigate the impact of the physical property differences between oil droplets and mineral particles on the separation result. Furthermore, on the basis of the existing models for mineral flotation systems, a modified model for de-oiling flotation systems can be developed.
In this paper, based on the Bloom–Heindel model, a modified CFD model has been developed. This modified model was used to evaluate oil removal efficiency in large-scale flotation tanks for oily wastewater treatment. In addition, an experimental facility was applied to test oil removal efficiency of a flotation tank. Selected operating parameters that impact separation were investigated. The applicable scope of the model was obtained by comparison between experimental data and simulation results.
2. Experimental
Figure 1 presents a water-treatment facility, which includes a gas skimmer, gas injector, micro-bubble generator and flotation tank. Bubbles can be generated when the gas is injected into liquid flow in a vertical tube with many small holes drilled. In addition, there were swirl tubes used for bubble disintegration in the micro-bubble generator. Oily wastewater entered the flotation tank through the bottom of the riser at the inlet. The size of the oil droplet in the wastewater at the entrance was controlled by the shear action of the upstream device. The microbubbles rising from the tank bottom made continuous collisions with oil droplets. An oil recycling unit was used to collect the oil leaving the flotation tank. Turbine flowmeters and temperature and pressure transducers were connected to a data logger for real-time data recording to obtain flow rate, temperature and pressure of this system. Furthermore, there were three sample points on the experimental equipment. Oil concentrations at point A and point C were determined though applying a partition infrared method. Tetrachloroethene was used as extraction solvent. The particle image velocimetry technique was used to measure the oil droplet size at point A and the bubble size at point B.
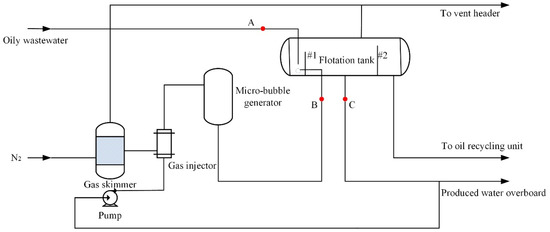
Figure 1.
Experimental process flow chart.
The physical properties of the oil phase were described as follows: an API (American Petroleum Institute) gravity of 18.84° (at 15.6 °C), a viscosity of 117.1 mPa·s (at 53 °C), an asphaltene content of 2.73%, and a resin content of 12.93%. The physical properties of the mineralized water were as follows: a pH value of 7.19 (at 15.56 °C), a specific gravity of 1.024 (at 15.6 °C).
The main device investigated in this study was the flotation tank, which is presented in Figure 2. The flotation tank was designed with a length of 9.2 m and a diameter of 4.9 m. The heights of baffles #1 and #2 were 3 m and 3.5 m, respectively. The standard operating conditions were as follows: a temperature of 53 °C, a residence time of 3 min, a liquid flow rate of 25.48 m3/min and a recycle ratio of 10%. The values of gas flow rate, oil droplet size and oil concentration at the inlet position were variable, which depended on the analyzed experimental conditions.
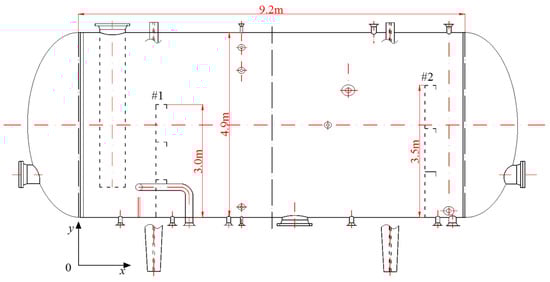
Figure 2.
Flotation tank geometry.
Oil removal efficiency of the gas flotation can be calculated according to Equation (1) [16].
where CI is the oil concentration in the inlet fluid and CO is the oil concentration in the outlet fluid.
3. The Flotation Process
The oily-water flotation is a series of complex processes that depend upon thermodynamic and hydrodynamic forces with physical–chemical interactions [17,18]. For attachment to occur between an oil droplet and a bubble, they need to experience an adequately close encounter.
When two particles approach each other quite closely, the intervening liquid film will drain, resulting in a critical thickness at which a breakage can occur. In addition, for successful flotation, after the oil drop stably adheres to the gas bubble, spreading of the oil drop onto the gas bubble occurs. Figure 3 illustrates the attachment process of the oil droplets and microbubbles.
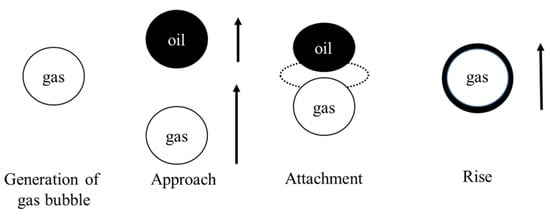
Figure 3.
The attachment process of oil droplet and micro-bubble.
The capture efficiency (pt) of a particle and a bubble can be defined as follows [19]:
where pc is the collision efficiency, pa is the attachment efficiency, and ps is the stability efficiency.
In this study, for the oil-water separation process in the flotation tank, the oil can create a continuous film around the bubble, and the stability efficiency is 1. Therefore, Equation (2) can be simplified to Equation (3).
3.1. Collision Efficiency
Gravity action, inertial impaction, interception and turbulent motions are major mechanisms that are responsible for the effective collision between a particle and a bubble. The density of oil droplets is smaller than that of water. However, mineral particles have a greater density than that of water.
Therefore, the efficiency of collisions by gravity action and inertial impaction can be ignored, and the overall efficiency involving interception and turbulent terms can be estimated from Equation (4) [11]:
where pci is the collision efficiency by interception, and pct is the collision efficiency by turbulent motions.
Combined with an arbitrary size ratio and particle settling, the Yoon–Luttrell model is expanded by Heindel and Bloom [20]. Therefore, the collision efficiency can be written as [21]:
where L is the arbitrary size ratio of particle to bubble and G represents the dimensionless particle rise velocity, which can be calculated by Equations (6) and (7).
where u is the rise velocity and d is the diameter. The subscripts p and b identify the particle and bubble, respectively.
Mineral particles have a higher density than that of oil droplets. Thus, the movement of oil droplets in the flotation tank should be analyzed. The balance equation for the forces acting on the bubbles and droplets can be expressed as:
where the subscript k represents bubble (b) or oil droplet (o). Here, Fb, Fd, Fa, FB, and Fg are buoyancy, drag, added mass, Basset and gravity forces, respectively, which can be calculated by using the following equations.
where CDk is the drag coefficient related to the Reynolds number (), which can be given as:
According to Equation (8), the velocities of the bubble and oil droplet are obtained. Therefore, the modified dimensionless velocity of the oil droplet can be obtained by the following equation.
The effect of turbulent motions on the collision efficiency is not involved in most available models. Kostoglou et al. [22] analyzed collisions due to turbulence. Based on the analysis, the turbulent velocity was introduced into the term of turbulent collision efficiency. According to the approach of the Kostoglou and Bloom–Heindel model, the collision efficiency for the turbulent mechanism can be defined as:
where is the ratio of oil droplet size to bubble size, which can be expressed as:
Wtr is the average relative velocity between the droplet and bubble due to fluctuations in the fluid flow, which can be estimated using Equation (18) based on the phenomenological statistical theories for homogeneous turbulence.
where ε is the turbulent dissipation rate, and ν is the kinematic viscosity of the water phase.
Therefore, a modified model of the collision efficiency between oil droplets and gas bubbles is developed.
3.2. Attachment Efficiency
Based on the approach of Bloom and Heindel, and by introducing the modified dimensionless velocity of oil droplets, a new method for estimating the attachment efficiency can be proposed. The theoretical expression of attachment efficiency can be written as follows [23]:
where
where f is the fluid friction factor. Cb is a parameter that varies between 1 and 4. Cb value is 1 for a rigid surface. Cb value is 4 for an unrestrained bubble surface. hi is the initial film thickness, which is set to 0.1mm. hcrit is the film thickness at which spontaneous rupture of the film occurs [15]. There is a report that oil droplet–gas bubble adhesion occurs when a film thickness approaches to 0.1 μm [3].
4. Model Description
4.1. Governing Equation
The Eulerian–Eulerian method was used to simulate multiphase flow in the gas flotation tank during the study [24]. The continuity equation and the momentum equation for phase k can be written as follows [25].
where α is the volume fraction, ρ is the density, p is the pressure, u is the velocity, g is the acceleration owing to gravity, τ is the stress tensor, and F is the external force.
In addition, the turbulent flow was simulated by using the standard k-ε model. The population balance equation (PBE) combined with the multiphase flow and turbulent equations to obtain the bubble size distribution in water. The population balance equation can be described as:
where nbi is the number of bubbles. Bb and Db are birth and death owing to breakage, and Bc and Dc are birth and death owing to coalescence of bubbles. Bb, Db, Bc and Dc can be written as below [26]:
where v and v’ are values of bubble size, c(v, v’) is the coalescence rate, b(v) is the breakup rate, β(v, v’) is the probability density function, n(v, t) is the number density function of bubble with size v.
The breakup rate was obtained by using the Luo model [27], which can be described as follows.
where λ is the size of turbulent eddy, fB is the breakage ratio, ω(d) is the collision frequency, Pb(v:vfB, λ) is the probability of breakup.
Luo model [27] was also applied to calculate the coalescence rate.
where is the collision frequency, which can be expressed as follows:
where is the characteristic velocity of collision between bubbles. n and n’ are the number densities of two bubbles with diameters d and d′.
is the coalescence probability.
where c’ is a constant, We is the Weber number, ρbw is the density ratio between bubble and water, xr is the diameter ratio of to .
For modeling flotation kinetics, the transfer of oil droplets between the water phase and gas bubbles can be obtained by using the source and sink term for the number concentration of oil droplets in the PBE model, which can be given by
where nw is the concentration of oil droplet number in the water phase, ng is the concentration of oil droplet number in the gas phase, αw is the water volume fraction, and αg is the gas volume fraction. is the source or sink specifying the attachment rate, which can be written as follows:
where zob is related to the bubble–droplet collision frequency.
is the effective bubble concentration, which can be calculated by Equation (39).
where α is the maximum number of oil droplets per bubble. Based on Bloom and Heindel’s results, the value of α is taken to be 1 [15].
4.2. CFD Simulation
4.2.1. Solution for PBE Model
The PBE model was solved by employing the homogeneous discrete method, which can calculate the bubble size distribution directly. According to the method proposed by Hagesather [28], the birth rates of Bb and Bc, and death rates of Db and Dc can be discretized as follows:
where
In order to make the equation closed, bubble size distribution at the inlet as the boundary condition was provided.
4.2.2. Numerical Solution Method
The transport equations for unsteady-state conditions were solved by using the Fluent package (version 17.0). Bubble–droplet collision and attachment were modeled through user-defined mass source terms. Boundary conditions were placed at the entry, exit and walls. The velocity at the entry and the pressure at the exit were specified. The no-slip condition was set on the wall. Both the phase transport equations and the face fluxes in the momentums were calculated by a first-order upwind discretization scheme. The phase-coupled SIMPLE algorithm was applied to solve the velocity-pressure coupling.
All equations were simultaneously solved with a step size of 0.01 s. The convergence was checked by monitoring the residuals of all equations discussed and the gas phase fraction average. The evaluation of mesh independency is performed. In addition, mesh densities of 450,000, 800,000 and 1,200,000 were examined. Based on the grid independence analysis, the mesh density of 800,000 was selected as the optimal value for the gas flotation in this study.
5. Results and Discussion
5.1. Gas Flow Rate
During the experiment, the liquid flow rate remained 25.48 m3/min, and the recycle ratio remained 10%. For the gas flow rate changes from 15 m3/h to 30 m3/h, the bubble size distribution measured at point B is presented in Figure 4. When the gas flow rate increased from 15 m3/h to 30 m3/h, the bubble particle size gradually increased from 20 μm to 48 μm.
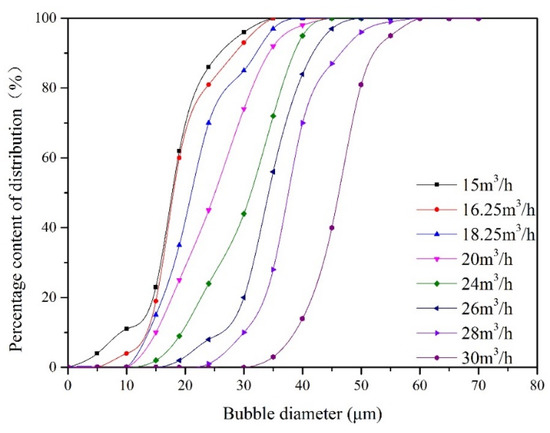
Figure 4.
The distribution of bubble size at inlet under different gas flow rates.
Oil removal efficiency at different gas flow rates is obtained by measuring the oil concentration at point A and point C. The impact of the gas flow rate on oil removal efficiency is illustrated in Figure 5. The corresponding experimental conditions are as follows: the oil droplet size is 30 μm, and the oil concentration at point A is 100 mg/L. With increasing gas flow rate, oil removal efficiency attains a maximum and begins to decrease. For gas flow rates of 15 and 16.25 m3/h, the bubble size distribution at inlet remains fairly constant as shown in Figure 4. For these gas velocities, the bubble surface area and the quantity of bubbles will increase with gas flow rate. Therefore, the increasing gas flow rate within this range promotes the flotation process. This is because a large amount of microbubbles can improve the probability of collisions and adhesions between bubble and oil droplet. As the gas flow rate is above the optimum value (16.25 m3/h), the bubble size at inlet increases with gas flow rate. The bubble coalescence process promotes formation of large bubbles in the flotation tank. Therefore, the bubble size increases and the number of bubbles decreases with gas flow rate, which leads to a decrease in oil removal efficiency.
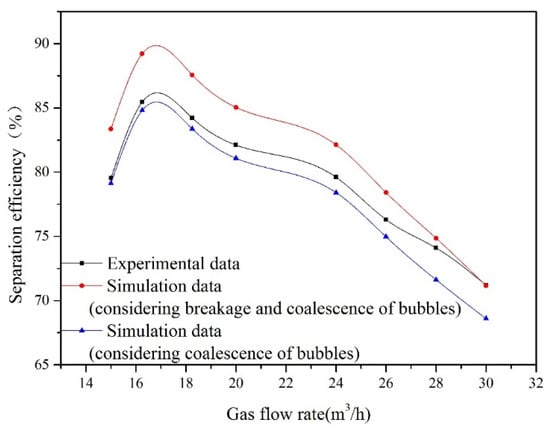
Figure 5.
The influence of gas flow rate on oil removal efficiency.
In the established CFD model, the breakup and coalescence of bubbles are considered, which is reflected in Equation (26). In theory, when the Weber number (We) is over a critical value (Wecri = 1.2), bubble breakage takes place [26]. Therefore, if the bubble size in the flotation tank is smaller than the critical value, the bubble will not undergo breakage. To evaluate the influence of the breakup process on calculation results, the established CFD model is divided into two categories: considering or disregarding the breakup of bubbles. When bubble breakage is not considered, the values of parameters Bb and Db in Equation (26) are set to 0.
Figure 5 shows the comparison between the simulation results and the experimental data. When the gas flow rate is lower than the critical value of 28 m3/h, the bubble is too small to break. Therefore, compared with the experimental results in this range of the gas flow rate, the predictions obtained by the model considering bubble breakage are relatively higher. When the bubble size at inlet is 20 μm, bubble size distributions with different cross-sections (x = 0 mm, x = 700 mm, x = 1300 mm, x = 1720 mm) in the contact zone of flotation tank are presented in Figure 6. Figure 6 shows that coalescence between bubbles can lead to form larger ones in the flotation tank. In addition, the bubble size at inlet increases with the gas flow rate. Large bubbles formed by coalescence will break under the action of the flow field. When the gas flow rate exceeds 28 m3/h, the predicted results of the model considering breakage and coalescence of bubbles agree well with the observed data. In conclusion, to enhance the precision of this established CFD model, the process of bubble breakage is disregarded when the gas flow rate is below a critical value (28 m3/h).
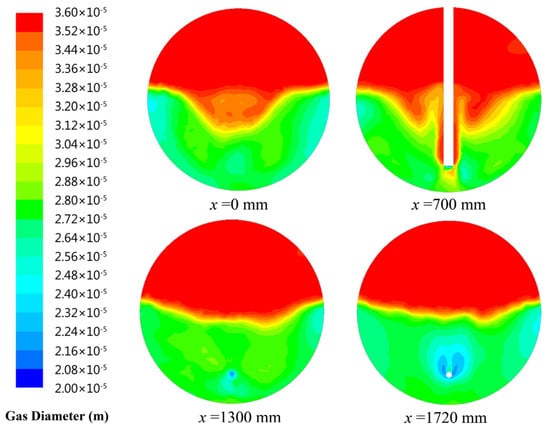
Figure 6.
Bubble size distribution in the contact zone of flotation tank.
5.2. Oil Concentration and Size of Oil Droplet
According to the experimental observations, the influence of the oil concentration and oil droplet size on oil removal efficiency is presented in Figure 7. These results are obtained under special experimental conditions. The liquid flow rate remains at 25.48 m3/min, and the recycling ratio is fixed at 10%. The gas flow rates are 15 m3/h and 16.25 m3/h. The oil droplet sizes at point A are 22 μm and 41 μm. The oil concentration at the inlet varies from 40 mg/L to 400 mg/L.
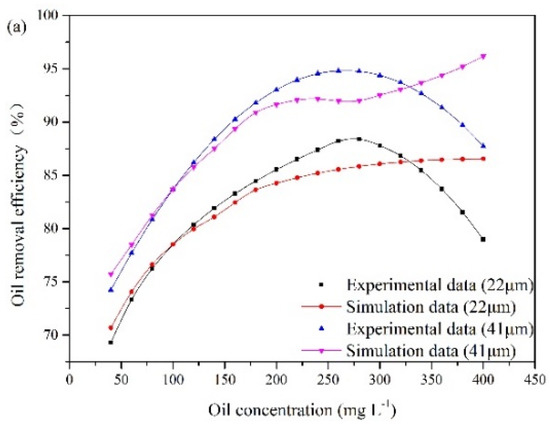
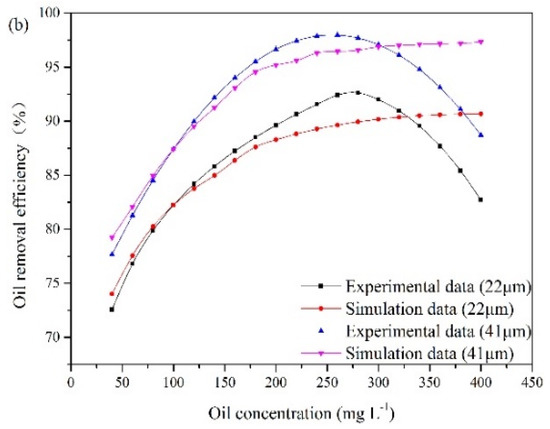
Figure 7.
The influence of oil concentration and oil droplet size on oil removal efficiency: (a) gas flow rate of 15 m3/h, (b) gas flow rate of 16.25 m3/h.
The experimental results illustrate that oil removal efficiency increases at first and decreases later with oil concentration. An optimum value of oil concentration (280 mg/L) is obtained. The number of oil droplets increases with oil concentration, which results in a high probability of oil collisions between bubble and oil droplet. However, with increasing oil concentration, the collision between bubbles and oil droplets can be affected by the surrounding oil droplets, which can lead to invalid collisions. When invalid collisions occur, it is difficult for bubbles and droplets in collision to form stable bubble-droplet aggregates. Furthermore, as the gas flow rate remains unchanged, the capacity of gas bubble to carry oil droplet is fixed. The amount of bubbles relative to that of oil droplets gradually decreases with the increase in oil concentration. As a result, when the oil concentration is above 280 mg/L, oil removal efficiency decreases gradually. In addition, Figure 7 also illustrates that the average removal efficiency is increased by 7% as the diameter of the oil droplet increases from 22 μm to 41 μm. Based on Equation (8), the rise velocity of oil droplet and bubble-droplet aggregate in water can be obtained. The average rise velocities of oil droplets with diameters of 22 μm and 41 μm are 0.045 cm/min and 0.17 cm/min, respectively. A fine droplet itself has a very low velocity. If these oil droplets attach to bubbles with diameters of 40 μm respectively, two sizes of bubble-droplet aggregates are formed. The average rise velocity of the aggregate composed of a 22 µm oil droplet and a 40 µm bubble is 1.1 cm/min. The average rise velocity of the aggregate composed of a 41 µm oil droplet and a 40 µm bubble is 1.97 cm/min. Attaching oil droplet to gas bubble can reduce the oil density and make oil droplet have a faster rise velocity. However, the aggregate with small oil droplet has a lower rise velocity than that with large oil droplet. Therefore, it is more difficult to remove fine oil droplets than large ones.
The experimental results are used to analyze the applicable scope of the established CFD model. The simulation results shown in Figure 7 demonstrate that oil removal efficiency increases as the oil concentration increases up to 400 mg/L. When the oil concentration is below 280 mg/L, the simulation results agree with the experimental data. However, the established CFD model cannot provide a good description of the invalid collisions between oil droplets and bubbles at high oil concentrations. The collision efficiency predicted by the model increases with oil concentration. However, experimental analysis indicates that the number ratio of gas bubble to oil droplet and bubble flotation ability decrease with the further increase of oil concentration, when the treatment capacity and the gas flow rate are fixed. Therefore, when the oil concentration exceeds 280 mg/L, the computational error increases. In other words, oil removal efficiency can be effectively predicted by the modified model under the oil concentration of 280 mg/L.
Oil droplet/bubble interaction is often overlooked in the previous numerical simulation of gas flotation. If Equations (35)–(39) are removed from governing equations, the modified model can be translated into the existing model. As the oil concentration is under 280 mg/L, the size of oil droplet varies from 22 μm to 41 μm, and the gas flow rate is in the range of 15–30 m3/h, the comparison between experimental results and simulation results obtained by the modified model and the existing model is presented in Figure 8. Figure 8a illustrates that the predicted values of the existing model are smaller than experimental data. This is because the promotion of flotation to the oil-water separation is not considered in the existing model. The average relative error of the modified CFD model is 7.22%. The average relative error of the existing model is 15.12%. Therefore, compared with the existing model, the modified model can obtain a better prediction of oil removal efficiency.
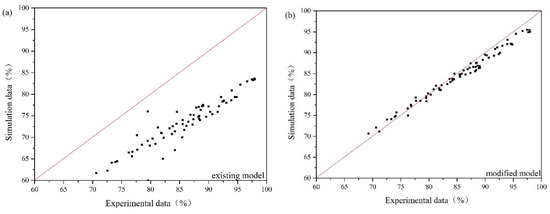
Figure 8.
Experimental data vs. simulation data: (a) the existing model, (b) the modified model.
6. Conclusions
- (1)
- The effects of the gas flow rate, oil concentration, and size of oil droplet on oil removal efficiency are analyzed experimentally. The experimental results demonstrate that oil removal efficiency can be reduced if the oil concentration and gas flow rate are too large or too small. Furthermore, oil removal efficiency increases with oil droplet size.
- (2)
- A CFD model that enables the calculation of oil removal efficiency for a large-scale flotation tank is developed. According to the analysis of the microprocesses occurring in the flotation tank, a modified Bloom–Heindel model is derived, which can be used to describe the oil droplet/bubble collision and attachment.
- (3)
- Comparisons of the experimental results and simulation results illustrate that the CFD model has a certain scope of application. When the gas flow rate is lower than 16.25 m3/h, bubble breakage is disregarded in this model. When the oil concentration is lower than 280 mg/L, this model can make a good prediction for the separation performance of the flotation tank. In addition, compared with experimental data, the modified model can improve the prediction accuracy of the existing model.
Author Contributions
Q.H. helped to design the study, build the modified model, analyze the data, and write the manuscript. X.L. helped to analyze the experimental data and edit the manuscript. All authors have agreed to the published version of the manuscript.
Funding
This research was supported by the National Natural Science Foundation of China (No. 51904051), the Natural Science Foundation of Chongqing, China (No. cstc2019jcyj-msxmX0745 and No. cstc2018jcyjAX0484) and the Science and Technology Research Program of Chongqing Municipal Education Commission (No. KJQN201801512 and No. KJZD-K201901505).
Conflicts of Interest
The authors declare no conflict of interest.
References
- Xu, H.; Liu, J.; Wang, Y.; Cheng, G.; Deng, X.; Li, X. Oil removing efficiency in oil–water separation flotation column. Desalin. Water. Treat. 2014, 53, 1–8. [Google Scholar] [CrossRef]
- Angelova, D.; Uzunov, I.; Uzunova, S.; Gigova, A.; Minchev, L. Kinetics of oil and oil products adsorption by carbonized rice husks. Chem. Eng. J. 2011, 172, 306–311. [Google Scholar] [CrossRef]
- Saththasivam, J.; Loganathan, K.; Sarp, S. An overview of oil–water separation using gas flotation systems. Chemosphere 2016, 144, 671–680. [Google Scholar] [CrossRef] [PubMed]
- Qi, W.K.; Yu, Z.C.; Liu, Y.Y.; Li, Y.Y. Removal of emulsion oil from oilfield ASP wastewater by internal circulation flotation and kinetic models. Chem. Eng. Sci. 2013, 91, 122–129. [Google Scholar] [CrossRef]
- Radzuan, M.A.; Belope MA, B.; Thorpe, R.B. Removal of Fine Oil Droplets from Oil-in-Water Mixtures by Dissolved Air Flotation. Chem. Eng. Res. Des. 2016, 115, 19–33. [Google Scholar] [CrossRef]
- Wang, Y.L.; Wang, N.; Jia, R.; Zhang, K.; Liu, B.; Song, W.; Jia, J. Research on CFD numerical simulation and flow field characteristics of countercurrent-cocurrent dissolved Air flotation. Water. Sci. Technol. 2018, 77, 1280–1292. [Google Scholar] [CrossRef]
- Kwon, S.B.; Park, N.S.; Lee, S.J.; Ahn, H.W.; Wang, C.K. Examining the effect of length/width ratio on the hydro-dynamic behaviour in a DAF system using CFD and ADV techniques. Water. Sci. Technol. 2006, 53, 141–149. [Google Scholar] [CrossRef]
- Behin, J.; Bahrami, S. Modeling an industrial dissolved air flotation tank used for separating oil from wastewater. Chem. Eng. Process. 2012, 59, 1–8. [Google Scholar] [CrossRef]
- Basavarajappa, M.; Miskovic, S. Investigation of gas dispersion characteristics in stirred tank and flotation cell using a corrected CFD-PBM quadrature-based moment method approach. Miner. Eng. 2016, 95, 161–184. [Google Scholar] [CrossRef]
- He, W.; Li, Z.K.; Tang, A.R.; Liu, A.; He, B.G. Simulation Study of Three-Phase Flow Field Based on Microbubble Flotation. Appl. Mech. Mater. 2014, 477–478, 226–231. [Google Scholar] [CrossRef]
- Niewiadomski, M. Air bubble and oil droplet interactions in centrifugal fields during air-sparged hydrocyclone flotation. Int. J. Environ. Pollut. 2007, 30, 313–331. [Google Scholar] [CrossRef]
- Koh, P.T.L.; Schwarz, M.P. Modelling attachment rates of multi-sized bubbles with particles in a flotation cell. Miner. Eng. 2008, 21, 989–993. [Google Scholar] [CrossRef]
- Koh, P.T.L.; Smith, L.K. The effect of stirring speed and induction time on flotation. Miner. Eng. 2011, 24, 442–448. [Google Scholar] [CrossRef]
- Karimi, M.; Akdogan, G.; Bradshaw, S.M. A computational fluid dynamics model for the flotation rate constant, Part I: Model development. Miner. Eng. 2014, 69, 214–222. [Google Scholar] [CrossRef]
- Bloom, F.; Heindel, T.J. Modeling flotation separation in a semi-batch process. Chem. Eng. Sci. 2003, 58, 353–365. [Google Scholar] [CrossRef]
- Li, X.; Xu, H.; Liu, J.; Zhang, J.; Li, J.; Gui, Z. Cyclonic state micro-bubble flotation column in oil-in-water emulsion separation. Sep. Purif. Technol. 2016, 165, 101–106. [Google Scholar] [CrossRef]
- Grattoni, C.; Moosai, R.; Dawe, R.A. Photographic observations showing spreading and non-spreading of oil on gas bubbles of relevance to gas flotation for oily wastewater cleanup. Colloid Surface. A 2003, 214, 151–155. [Google Scholar] [CrossRef]
- Bai, Z.S.; Wang, H.L.; Tu, S.T. Oil–water separation using hydrocyclones enhanced by air bubbles. Chem. Eng. Res. Des. 2011, 89, 55–59. [Google Scholar] [CrossRef]
- Pyke, B.; Fornasiero, D.; Ralston, J. Bubble particle heterocoagulation under turbulent conditions. J. Colloid Interf. Sci. 2003, 265, 141–151. [Google Scholar] [CrossRef]
- Yoon, R.H.; Luttrell, G.H. The Effect of Bubble Size on Fine Coal Flotation. Coal. Prep. 1986, 2, 179–192. [Google Scholar] [CrossRef]
- Heindel, T.J.; Bloom, F. Exact and Approximate Expressions for Bubble–Particle Collision. J. Colloid Interf. Sci. 1999, 213, 101–111. [Google Scholar] [CrossRef]
- Kostoglou, M.; And, T.D.K.; Matis, K.A. CFD Model for the Design of Large Scale Flotation Tanks for Water and Wastewater Treatment. Ind. Eng. Chem. Res. 2007, 46, 6590–6599. [Google Scholar] [CrossRef]
- Bloom, F.; Heindel, T.J. An Approximate Analytical Expression for the Probability of Attachment by Sliding. J. Colloid Interf. Sci. 1999, 218, 564–577. [Google Scholar] [CrossRef] [PubMed]
- Roudsari, S.F.; Turcotte, G.; Dhib, R.; Ein-Mozaffari, F. CFD modeling of the mixing of water in oil emulsions. Comput. Chem. Eng. 2012, 45, 124–136. [Google Scholar] [CrossRef]
- Evans, G.M.; Doroodchi, E.; Lane, G.L.; Koh, P.T.L.; Schwarz, M.P. Mixing and gas dispersion in mineral flotation cells. Chem. Eng. Res. Des. 2008, 86, 1350–1362. [Google Scholar] [CrossRef]
- Li, C.; Huang, Q. Analysis of Droplet Behavior in a De-Oiling Hydrocyclone. J. Disper. Sci. Technol. 2016, 38, 317–327. [Google Scholar] [CrossRef]
- Luo, H. Coalescence, Break-Up and Liquid Circulation in Bubble Column Reactors. Ph.D. Thesis, The Norwegian Institute of Technology, Trondheim, Norway, 1993. [Google Scholar]
- Hagesaether, L.; Jakobsen, H.A.; Svendsen, H.F. A model for turbulent binary breakup of dispersed fluid particles. Chem. Eng. Sci. 2002, 57, 3251–3267. [Google Scholar] [CrossRef]


© 2020 by the authors. Licensee MDPI, Basel, Switzerland. This article is an open access article distributed under the terms and conditions of the Creative Commons Attribution (CC BY) license (http://creativecommons.org/licenses/by/4.0/).