Article

Modeling and Experimental Study on Motion States of Laboratory-Scale Bottom Hole Assembly in Horizontal Wells

1
School of Petroleum Engineering, China University of Petroleum (East China), Qingdao 266580, China
2
Key Laboratory of Unconventional Oil & Gas Development, China University of Petroleum (East China), Ministry of Education, Qingdao 266580, China
*
Authors to whom correspondence should be addressed.
Energies 2020, 13(4), 925; https://doi.org/10.3390/en13040925
Submission received: 10 December 2019 / Revised: 13 February 2020 / Accepted: 14 February 2020 / Published: 19 February 2020
(This article belongs to the Section L: Energy Sources)

Abstract

:
Motion states of bottom hole assembly (BHA) have a great effect on the trajectory control and drilling efficiency while rotary drilling. In order to study the motion states of BHA in horizontal wells, a BHA dynamic model with the finite element method was established. Meanwhile, an indoor experimental setup based on similarity criterion was designed and built to verify the numerical simulation results. Finally, the effects of measuring positions, rotate speeds, weight on bit (WOB), and friction coefficients on the motion states were analyzed in numerical simulation and experiment. The results show that the experimental results can match well with the numerical simulation results. The motion states of BHA in horizontal wells can be divided into three kinds, including circular arc swing, "8" shape swing, and dot-like circular motion. The circular arc swing mainly appears at middle section of BHA and occurs through the collective result of gravity and tangential friction. The dot-like circular motion mainly appears at near-bit or near-stabilizer area because drill bit and stabilizer can steady the BHA at the center part of the wellbore. The "8" shape swing mainly appears at the crossed area and occurs through collective disturbance of the other two motions. Moreover, rotate speed and friction coefficient have promotions on the lateral vibration while WOB have a much smaller effect. Through analyses, related suggestions are given for the drilling engineering. The related conclusions and suggestions in this paper can help to further understand the lateral dynamic characteristics of BHA in horizontal wells and select suitable parameters for drilling engineering.

1. Introduction

With the development of drilling technology, horizontal wells have been widely used in the development of oil and gas fields [1]. As a widely applied technique, the horizontal well technique can effectively increase reservoir discovery, enlarge drainage area, and improve production, especially in shale gas wells [2]. However, while rotary drilling, the BHA is under the collective action of axial force, lateral force, normal force, frictional force and torque, and its motion is strictly constrained by narrow wellbore [3,4,5]. Meanwhile, it is usually subjected to a coupled vibrations including axial, lateral, torsional vibration [6]. These problems seriously restrict the effect of trajectory control and rate of penetration (ROP), and even lead to drill string damage and downhole accidents. Especially, lateral vibration is considered the main reason for the BHA fatigue failure, damage, and borehole enlargements [7]. Thus it is particularly necessary to research the lateral vibration of drill string in horizontal wells.
Experts and scholars had conducted different models [8,9], numerical simulations [10,11,12], and laboratory experiments [13,14] to analyze the dynamic characteristics. Baumgart established an axial vibration model and analyzed the WOB fluctuation phenomenon of drill bit [15]. Liao et al. established a reduced-order models of a drill-string system in consideration of radial, bending, torsion, and stick-slip motions and qualitative changes in the system motions were studied with respect to rotation speeds of drill string and friction coefficients between drill string and wellbore [16]. Omojuwa et al. established a dynamic model for friction, torque, buckling, and vibration of drill string in horizontal wells and he pointed the distribution of axial force and torque along the drill string [17]. Liu et al. presented a discrete system model to study the coupled axial-torsional dynamics of drilling string and the model was developed taking into account the state-dependent time delay and nonlinearities because of dry friction and loss of contact [18]. Wilson and Heisig presented an analysis of dynamic characteristics of drill string in horizontal wells [19]. Unquestionably, these studies had a great propelling effect on revealing the dynamic characteristics of drilling string.
As for lateral vibration, the motion states of BHA were clear and obvious in vertical or slightly inclined wells, including forward rotation, backward whirl, and intermediate transition phase [20,21,22]. However, the motion states of BHA in horizontal wells was different from that of vertical wells, because the drilling string extended several meters and it lies on the wellbore. In horizontal wells, different kind of motion states are proposed in the existing literature. Shao et al. and Guan et al. presented that bottom drilling string exhibits three kinds of motion states in horizontal wells, including circular arc swing, "8" shape swing, and flat "8" shape swing [23,24]. Xie presented that bottom drilling string exhibits five kinds of motion states in horizontal wells, including circular arc swing, "8" shape swing, and "∞" shape swing, flat circular motion and irregular motion [25]. There were different versions of these motion states and they distinguished these motion states just through the trajectory shape. Obviously, there was not a basis to distinguish these motion states, and the occurrence mechanism had not been revealed.
In order to distinguish the different kinds of motion states of BHA in horizontal wells and explain the mechanism, a full-dimensional continuous dynamic model is established with finite element method. Meanwhile, an indoor experimental setup based on similarity criterion is designed to verify the dynamic model. Then the numerical simulation and experiment are carried out to simulate the motion states of BHA in horizontal wells under different measuring positions, rotate speeds, WOB and friction coefficients. Finally, some related suggestions for parametric selection are obtained through the analyses. Thus, the study can help to further understand the lateral vibration characteristics of BHA in horizontal wells and select suitable parameters for drilling engineering.

2. Dynamic Model

Considering the superiority of beam-column theory and finite element method, a full-dimensional continuous dynamic model is established. The model can consider the contact between BHA and wellbore, mass eccentricity, internal damping from structure, external damping from drill mud and buoyant weight.

2.1. Basic Assumptions

(1)
The inner wall of wellbore is regarded as a continuous and uniform circular cross section;
(2)
The BHA is regarded as an elastic beam with homogeneous geometric characteristics and material properties and its deformation is within the linear elastic range;
(3)
Neglect the effect of bit-rock interaction, and the drill bit is used to bear the WOB and steady the BHA at the center part of the wellbore.

2.2. Dynamic Equations

BHA comprises different sizes and numbers of drill bits, drill collars, stabilizers, and downhole tools for different drilling methods in oil and gas wells. Compared to the cross section with length of BHA, a large slenderness ratio is suitable for a series of segmented and uniform beams. According to finite element method, three dimensional beam elements with 2 nodes and 12 degrees of freedom (DOF) are chosen to disperse the whole BHA. A simplified beam element is shown in Figure 1.
In the finite element method, nodal displacements are the independent variables. The nodal displacement vector of beam elements can be expressed as:
{ q } = [ x i , y i , z i , θ x i , θ y i , θ z i , x j , y j , z j , θ x j , θ y j , θ z j ] T
where, {q} is the nodal displacement vector of beam elements; x, y, z are the displacements of nodes in X, Y, Z direction respectively; θx, θy, θz are the rotation angles of nodes in X, Y, Z direction respectively. The variables with subscripts represent the node numbers.
The nodal force vector of beam elements can be expressed as:
{ F e } = [ P x i , Q y i , Q z i , M x i , M y i , M z i , P x j , Q y j , Q z j , M x j , M y j , M z j ] T
where, {Fe} is the nodal force vector of beam elements; Px is the axial force of nodes; Qy and Qz are the shear force of nodes in Y and Z direction respectively; Mx is the torque of nodes; My and Mz are the bend moments of nodes in the X-Y and X-Z plane respectively.
Drill string dynamics theory is based on Lagrange equation [26,27] and the equation can be expressed as:
d d t [ ( T U ) q · ] ( T U ) q = F
where, T is the kinetic energy; U is the potential energy; F is the total external force. The dot above generalized variable represents derivative of the variable with respect to time.
The kinetic energy of beam elements can be written as:
T = 1 2 V { q · } T { q · } ρ d V
where, ρ is the density.
The potential energy of beam elements can be written as:
U = 1 2 V [ D ] { ε } T { ε }   d V V { q } T { P V } d V A { q } T { P A } d A 1 2 c q { q · } T { q · }
where, {ε} is the strain vector; [D] is the elasticity matrix; {PV} is the body force vector; {PA} is the surface force vector; cq is damping coefficient.
The external force of beam elements can be calculated with virtual work principle:
F = F e d q
where, F e ˜ is the external force in each directions of displacement vector.
Substituting Equations (4)–(6) into Equation (3), the whole BHA dynamic equation can be obtained by assembling all the beam elements [28,29]:
[ M ] { q · · } + [ C ] { q · } + [ K ] { q } = { F }
where, q represents the generalized variables; [M] is the global mass matrix; [K] is the global stiffness matrix; {F} is the external force vector; [C] is the Rayleigh damping matrix, which considers the structural damping caused by energy loss of internal friction of material:
[ C ] = α [ M ] + β [ K ]
where, α and β are constant coefficients.
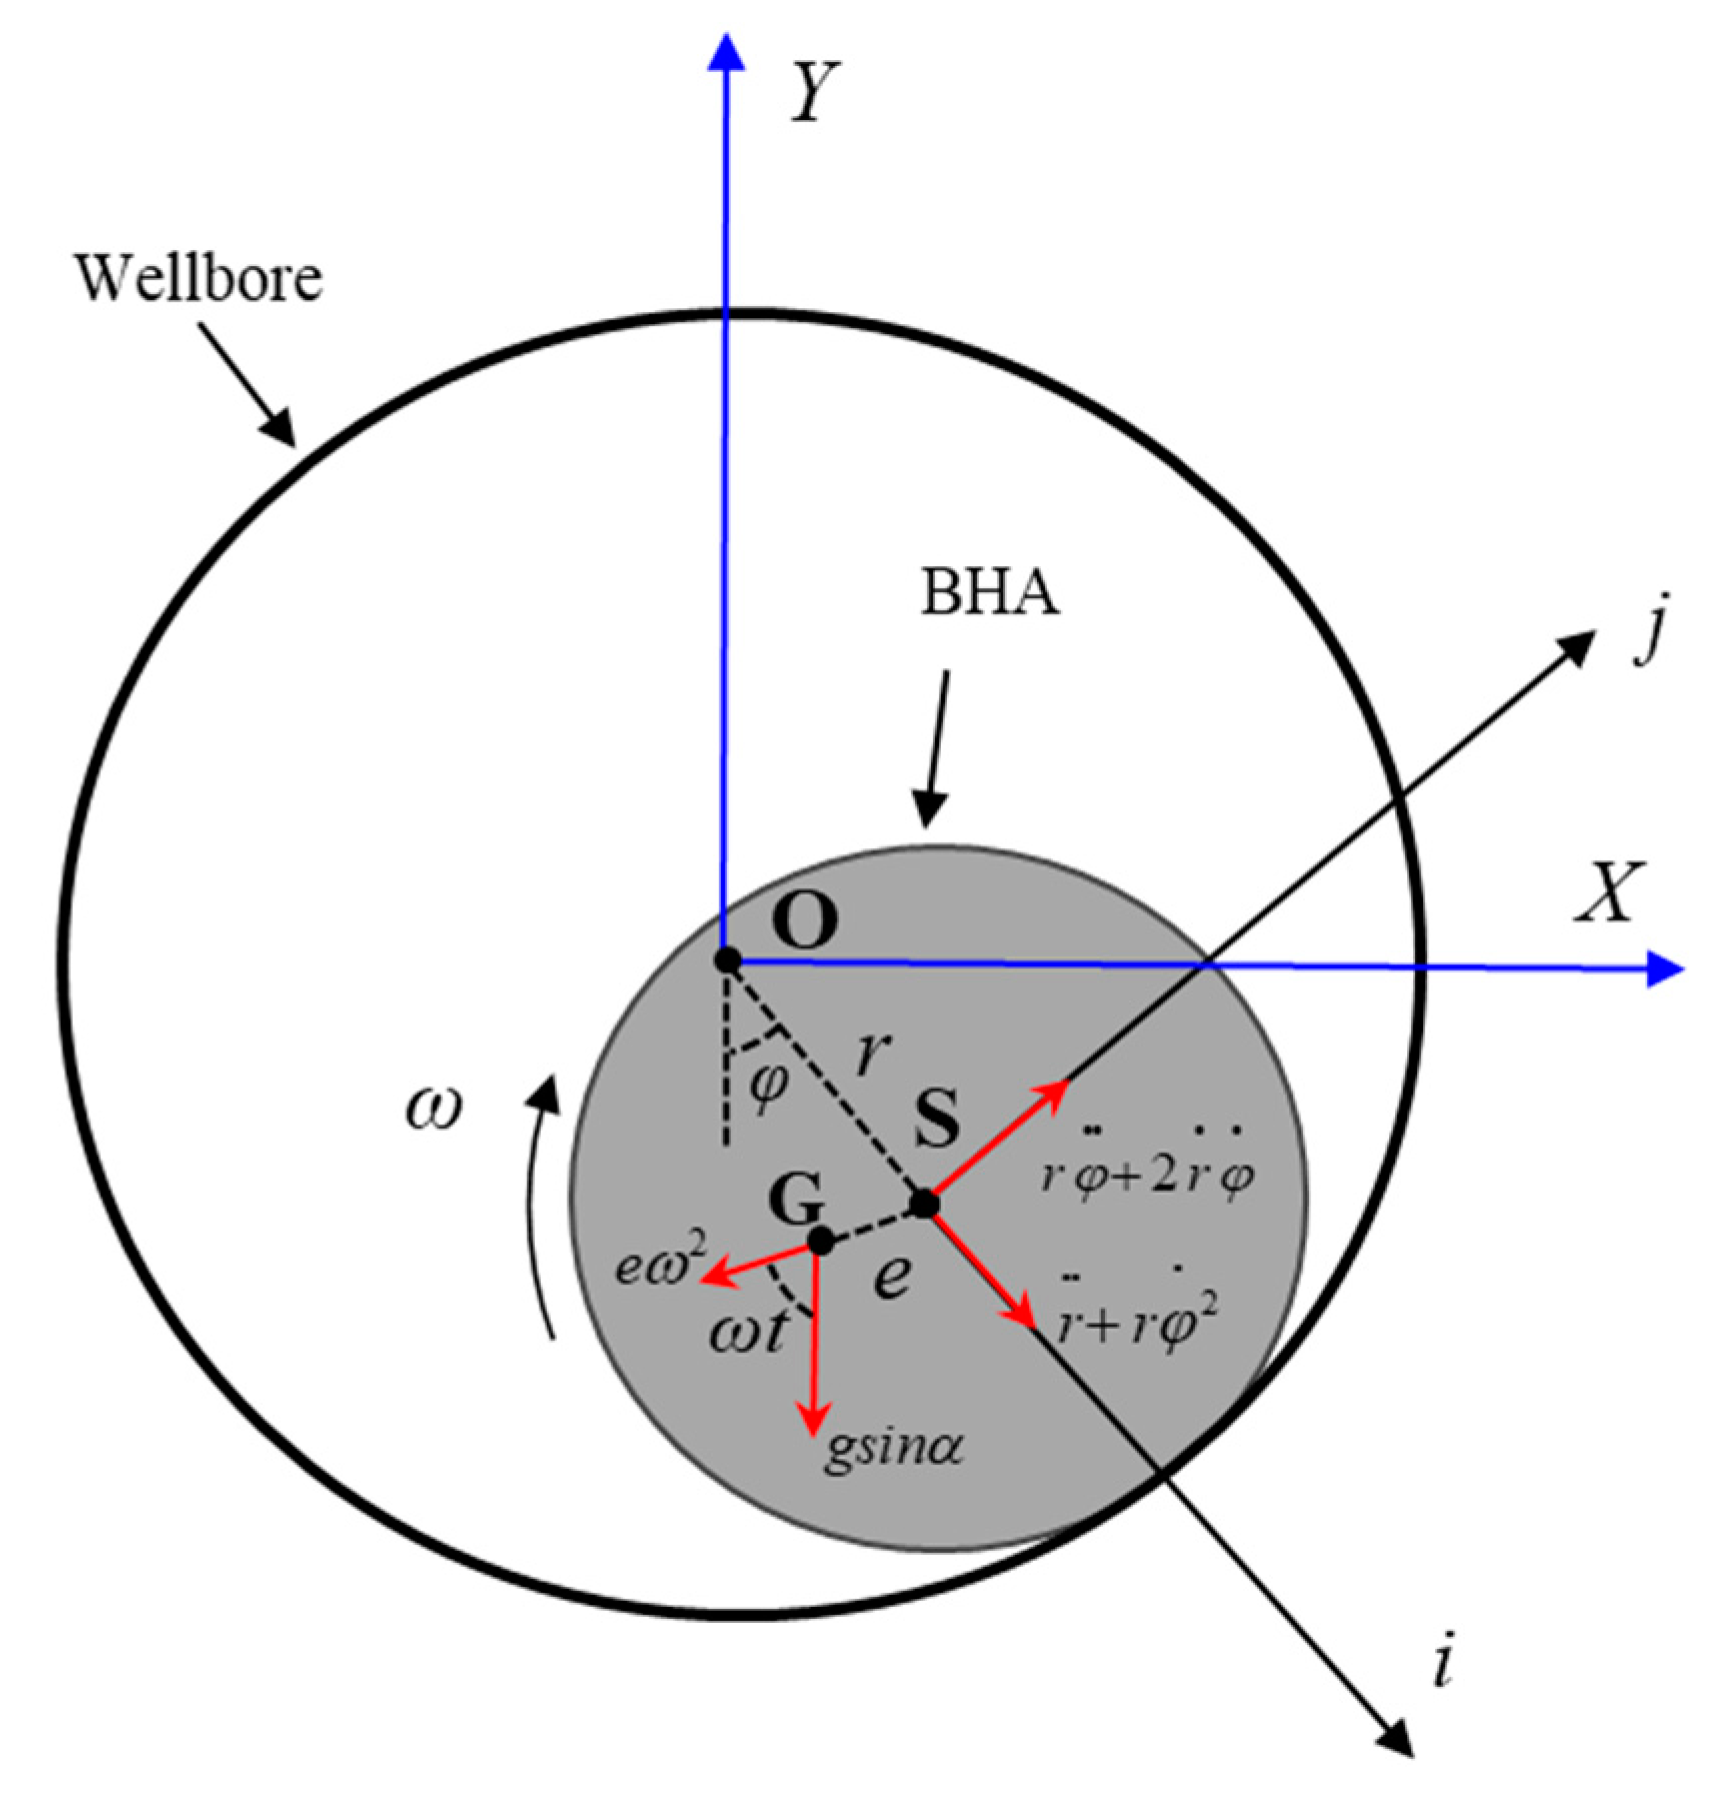
In addition, it is crucial to deduce the acceleration equations in the cross section of BHA in order to get the BHA dynamic equation. Thus, these acceleration equations are exhibited as follows, which have been included in Equation (7). The component of accelerations in the cross section are shown in Figure 2. Point G is the mass center and point S is the geometric center.
The accelerations contain radial, tangential, centrifugal, and Coriolis accelerations because BHA rotates around the axis of wellbore, centrifugal acceleration because BHA rotates around its own axis, and gravitational acceleration [30,31]. In other word, accelerations of mass center G = accelerations of geometric center S + accelerations of G relative to S + gravitational acceleration. Thus the accelerations can be written as:
a G = [ ( r · · + r φ · 2 ) e ω 2 cos ( ω t φ ) ] i + [ ( r φ · · + 2 r · φ · ) e ω 2 sin ( ω t φ ) ] j ( g sin α ) Y
where, r = sqrt(x2 + y2); r ¨ is the radial acceleration; r φ ¨ is the tangential acceleration (Euler acceleration); r φ 2 ˙ is the centrifugal acceleration of revolution; 2 r ˙ φ ˙ is the Coriolis acceleration; 2 is the centrifugal acceleration of self-rotation; gsinα is the gravitational acceleration in the cross section of BHA; r is the radial displacement; φ is the revolution angle; ω is the rotate speed; α is the well inclination; e is the eccentric distance; g is the gravitational acceleration.
Equation (7) can be solved through implicit solution method to simulate the motion states of BHA. However, if BHA contacts wellbore, the nodal force and nodal displacement will be changed. Thus a contact model between BHA and wellbore needs to be taken into consideration.

2.3. Contact Model

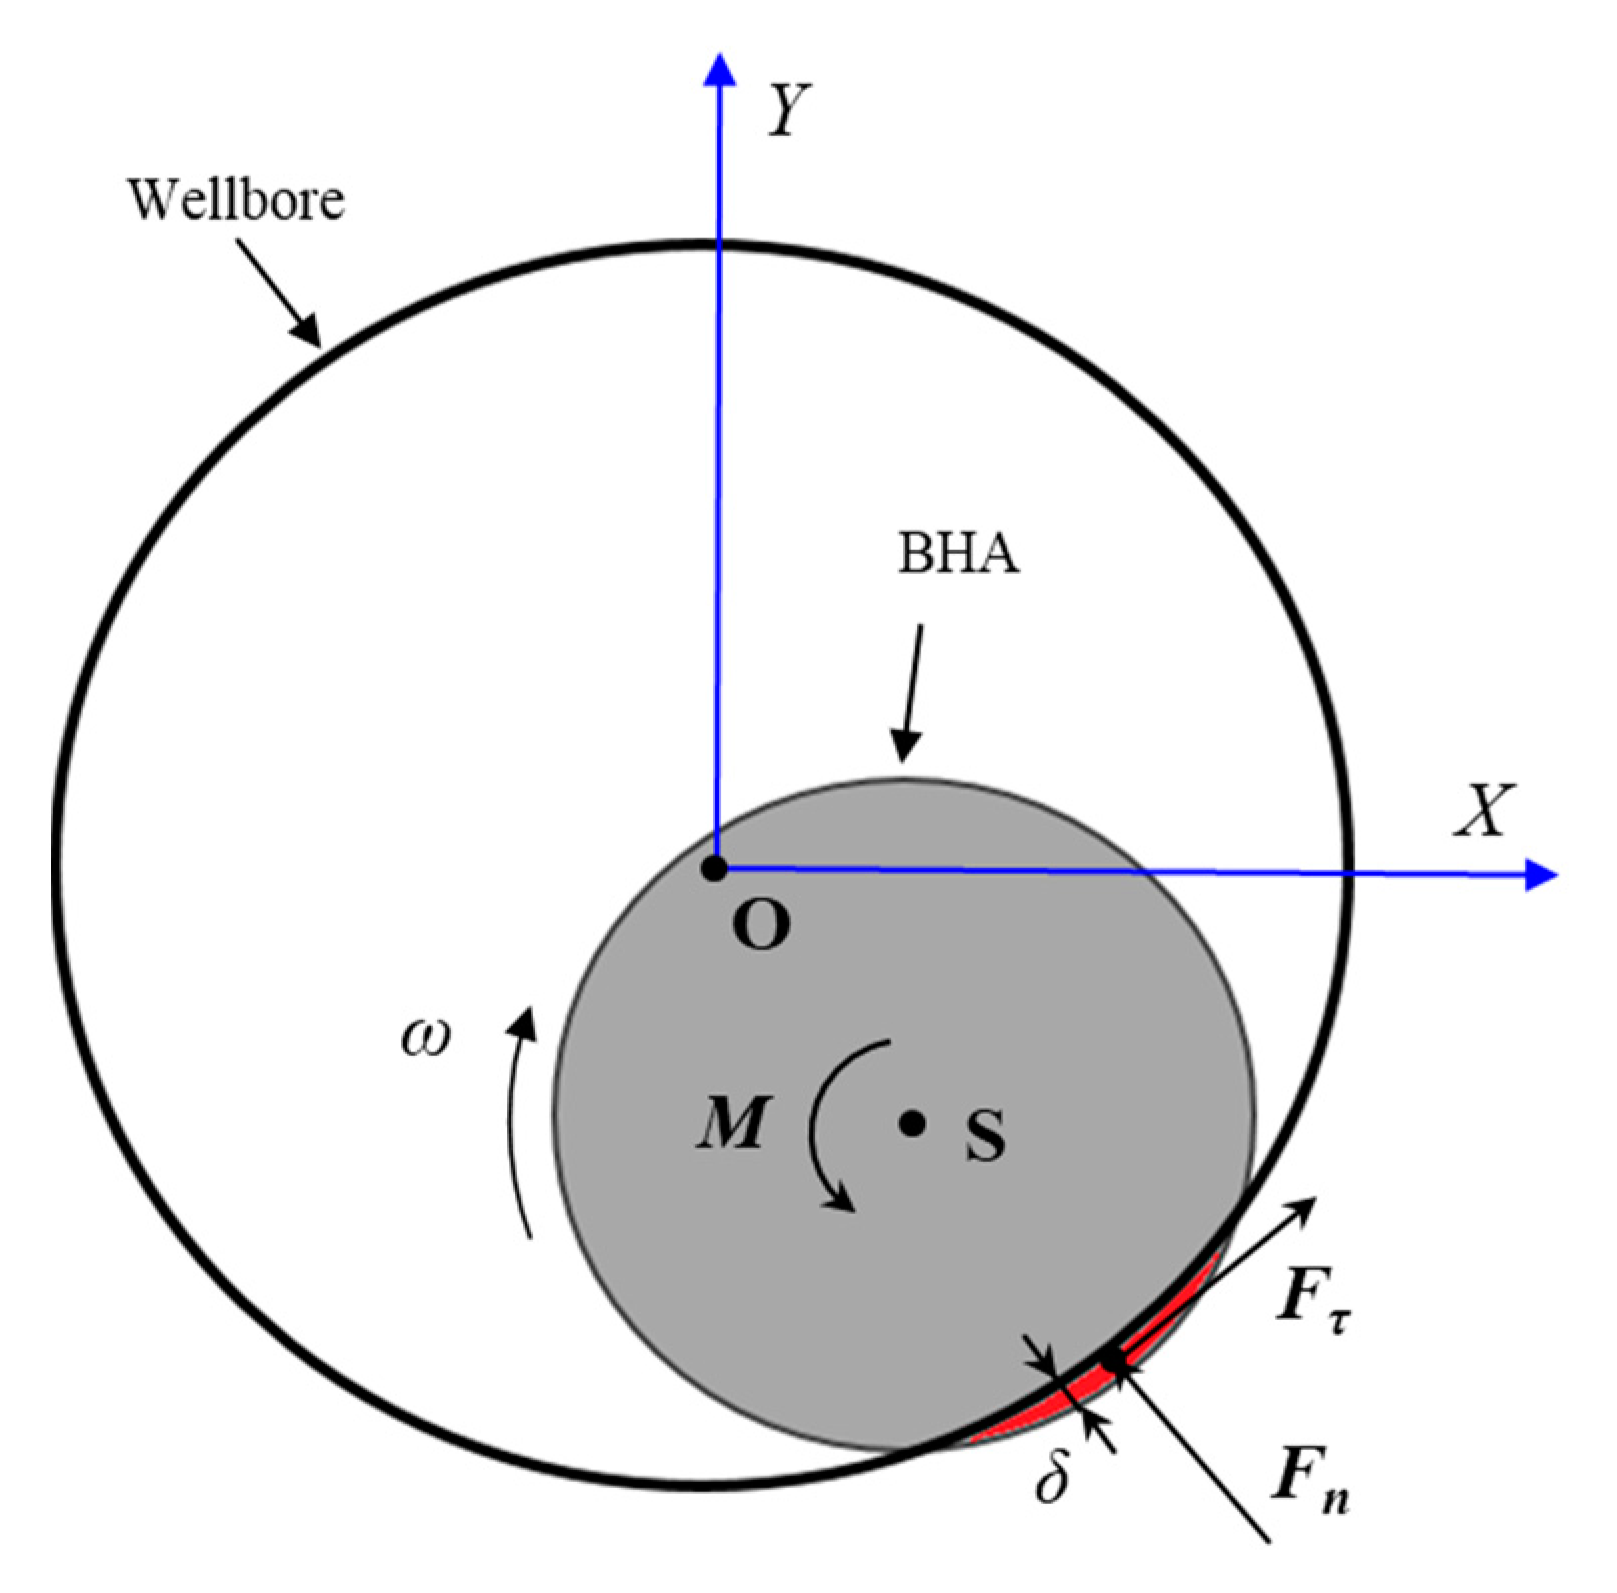
When a BHA node contacts the wellbore and extends further, a radial reaction force will act through wellbore and restrain the node penetration movement [26]. Then its radial velocity will decrease and turn around following the recovery of wellbore elastic deformation. Figure 3 shows the contact between BHA and wellbore.
The radial displacement of BHA r and the clearance between BHA and wellbore δ can be used to be expressed as:
δ = r ( D d ) / 2
where, δ is the clearance between BHA and wellbore; D is the inner diameter of wellbore; d is the outer diameter of BHA.
The contact normal force can be described as:
F n = { 0 ,   δ 0 K c δ ,   δ > 0
where, Fn is the normal force; Kc is the contact stiffness coefficient.
The tangential friction force can be written as:
F τ = μ F n
where, Fτ is the tangential friction force; μ is the friction coefficient.
When BHA contacts wellbore, additional friction torque occurs. It can be written as:
M = 1 2 F τ d
where, M is the additional friction torque.
If BHA contacts wellbore: (1) Calculate equivalent load vector {F} considering the contact model; (2) assemble global mass matrix [M], global stiffness matrix [K], Rayleigh damping matrix[C]; (3) calculate nodal displacements, velocities, and accelerations; (4) judge whether the new nodal displacements and the previous are the same. If it is, save the nodal displacements, velocities, and accelerations. If not, recalculate the first three steps until it is satisfied; (5) recalculate the previous four steps for the next time increment until set time is reached.

3. Indoor Experiment

3.1. Experimental Setup

In order to verify the given model, an indoor experimental setup based on similarity criterion is designed and built instead of field experiment. The schematic diagram and top view of the setup are shown in Figure 4 and Figure 5.
Each component is as follows: 1—test support; 2—test bench; 3—wellbore support; 4—displacement sensor support; 5—servo motor; 6—simulative BHA; 7—simulative wellbore; 8—simulative downhole; 9—force sensor; 10—loading screw; 11—displacement sensor; 12—turbine reducer; 13—fixed pulley; 14—wirerope.
The deflection of BHA should be large enough to contact simulative wellbore at least two-thirds of the length in horizontal wells. BHA should be a single and straight pole, which can eliminate the influence of threaded connection [32]. To satisfy the aforementioned and limit the total length of the setup, a single pole with 2 m length and 5 mm outer diameter (OD) are chosen as BHA, whose material is polymethyl methacrylate (PMMA). A PMMA tube with 8 mm inner diameter (ID) is used to simulate the wellbore.
The test bench is installed on the test support and the change of well inclination can be simulated by changing the installed position of the test bench on the test support. The wellbore is constrained on wellbore supports. Meanwhile, the top of BHA is fixed on the drive shaft of the servo motor through a clamp. Thus the motor can drive the BHA to rotate synchronously and a torque sensor is inside the motor. Downhole can provide pressure on the bit and a force sensor is installed to monitor the axial pressure value, which can simulate WOB. Moreover, laser displacement sensors are used to capture the lateral displacement of BHA. Then the sensor data can be saved and displayed on the computer.
In order to calibrate the actual friction coefficient of the experimental setup, a torque sensor is inside the servo motor. When BHA rotate steadily with a small rotate speed, the normal force is equivalent to the self-weight of BHA in horizontal wells. Thus the torque value can represent the friction torque derived from self-weight of BHA. Then we can get the friction coefficient according to M = μGd/2. Through multiple trials, the value of friction coefficient is about 0.2 with some machine oil in the wellbore.

3.2. Similarity Criterion

In the paper, the BHA of experimental model is 8 mm Bit + 5 mm Collar × 2 m in experiment and the BHA of engineering prototype is 347.6 mm Bit + 215.9 mm Collar × 86 m. Thus the geometric similarity ratio of model and prototype is about 1:43 and all the length parameters will follow this ratio, such as the length and lateral displacement of BHA. In experimental model, the material of BHA is PMMA, whose density is 1200 kg/m3 and elasticity modulus is 3 GPa. In engineering prototype, the material of BHA is steel, whose density is 7850 kg/m3 and elasticity modulus is 210 GPa. Thus the similarity ratio of WOB, rotate speed, and friction coefficient can be determined as [33]:
{ c W = l p 2 E p l m 2 E m = 130 × 10 3   c ω = l m l p E p ρ m E m ρ p = 0.25 c μ = μ m μ p = 1
where, c is similarity ratio of parameters; W is the WOB; l is the length of BHA; E is the elasticity modulus; ρ is the density; μ is the friction coefficient.
Therefore, the similarity ratio of rotate speed is 4:1, that is to say, 1 r/min of model rotate speed is equal to 0.25 r/min of prototype rotate speed. The similarity ratio of WOB is 1:130 × 103, that is to say, 1 N of model WOB is equal to 130 kN of prototype WOB. Finally, the similarity ratio of friction coefficient is 1:1.

3.3. Parameter Selection

The numerical simulation and experiment are carried out to simulate the motion states of BHA under different measuring positions, rotate speeds, WOB, and friction coefficients. The measuring position is the distance from the bit. The data selection of these parameters are shown in Table 1, Table 2, Table 3 and Table 4. Meanwhile, the main purpose of the paper is using the experimental results to verify those of the given model. Thus the parameters of experiment and numerical simulation are exactly the same. Moreover, the parameters of engineering prototype are shown here in order to prove the suitability of parameter selection for experiment and numerical simulation.

4. Result and Discussion

The research object of experiment is a slick assembly 8 mm Bit + 5 mm Collar × 2 m. In order to verify the dynamic model, the research object and parameters of numerical simulation is the same as that of the experiment, as shown in Figure 6. Because of the limitation of the experimental setup, the effects of bit-rock interaction, downhole motors, and drill mud are not studied in the paper. Thus the functions of bit in the experiment are bearing WOB and steadying BHA at the center part of the wellbore. Meanwhile, the engineering prototype is more close to gas drilling. The detailed parameters are shown in Table 5. Moreover, the numerical simulation and experiment are carried out to simulate the motion states of BHA under different measuring positions, rotate speeds, WOB and friction coefficients.

4.1. Effects of Measuring Position

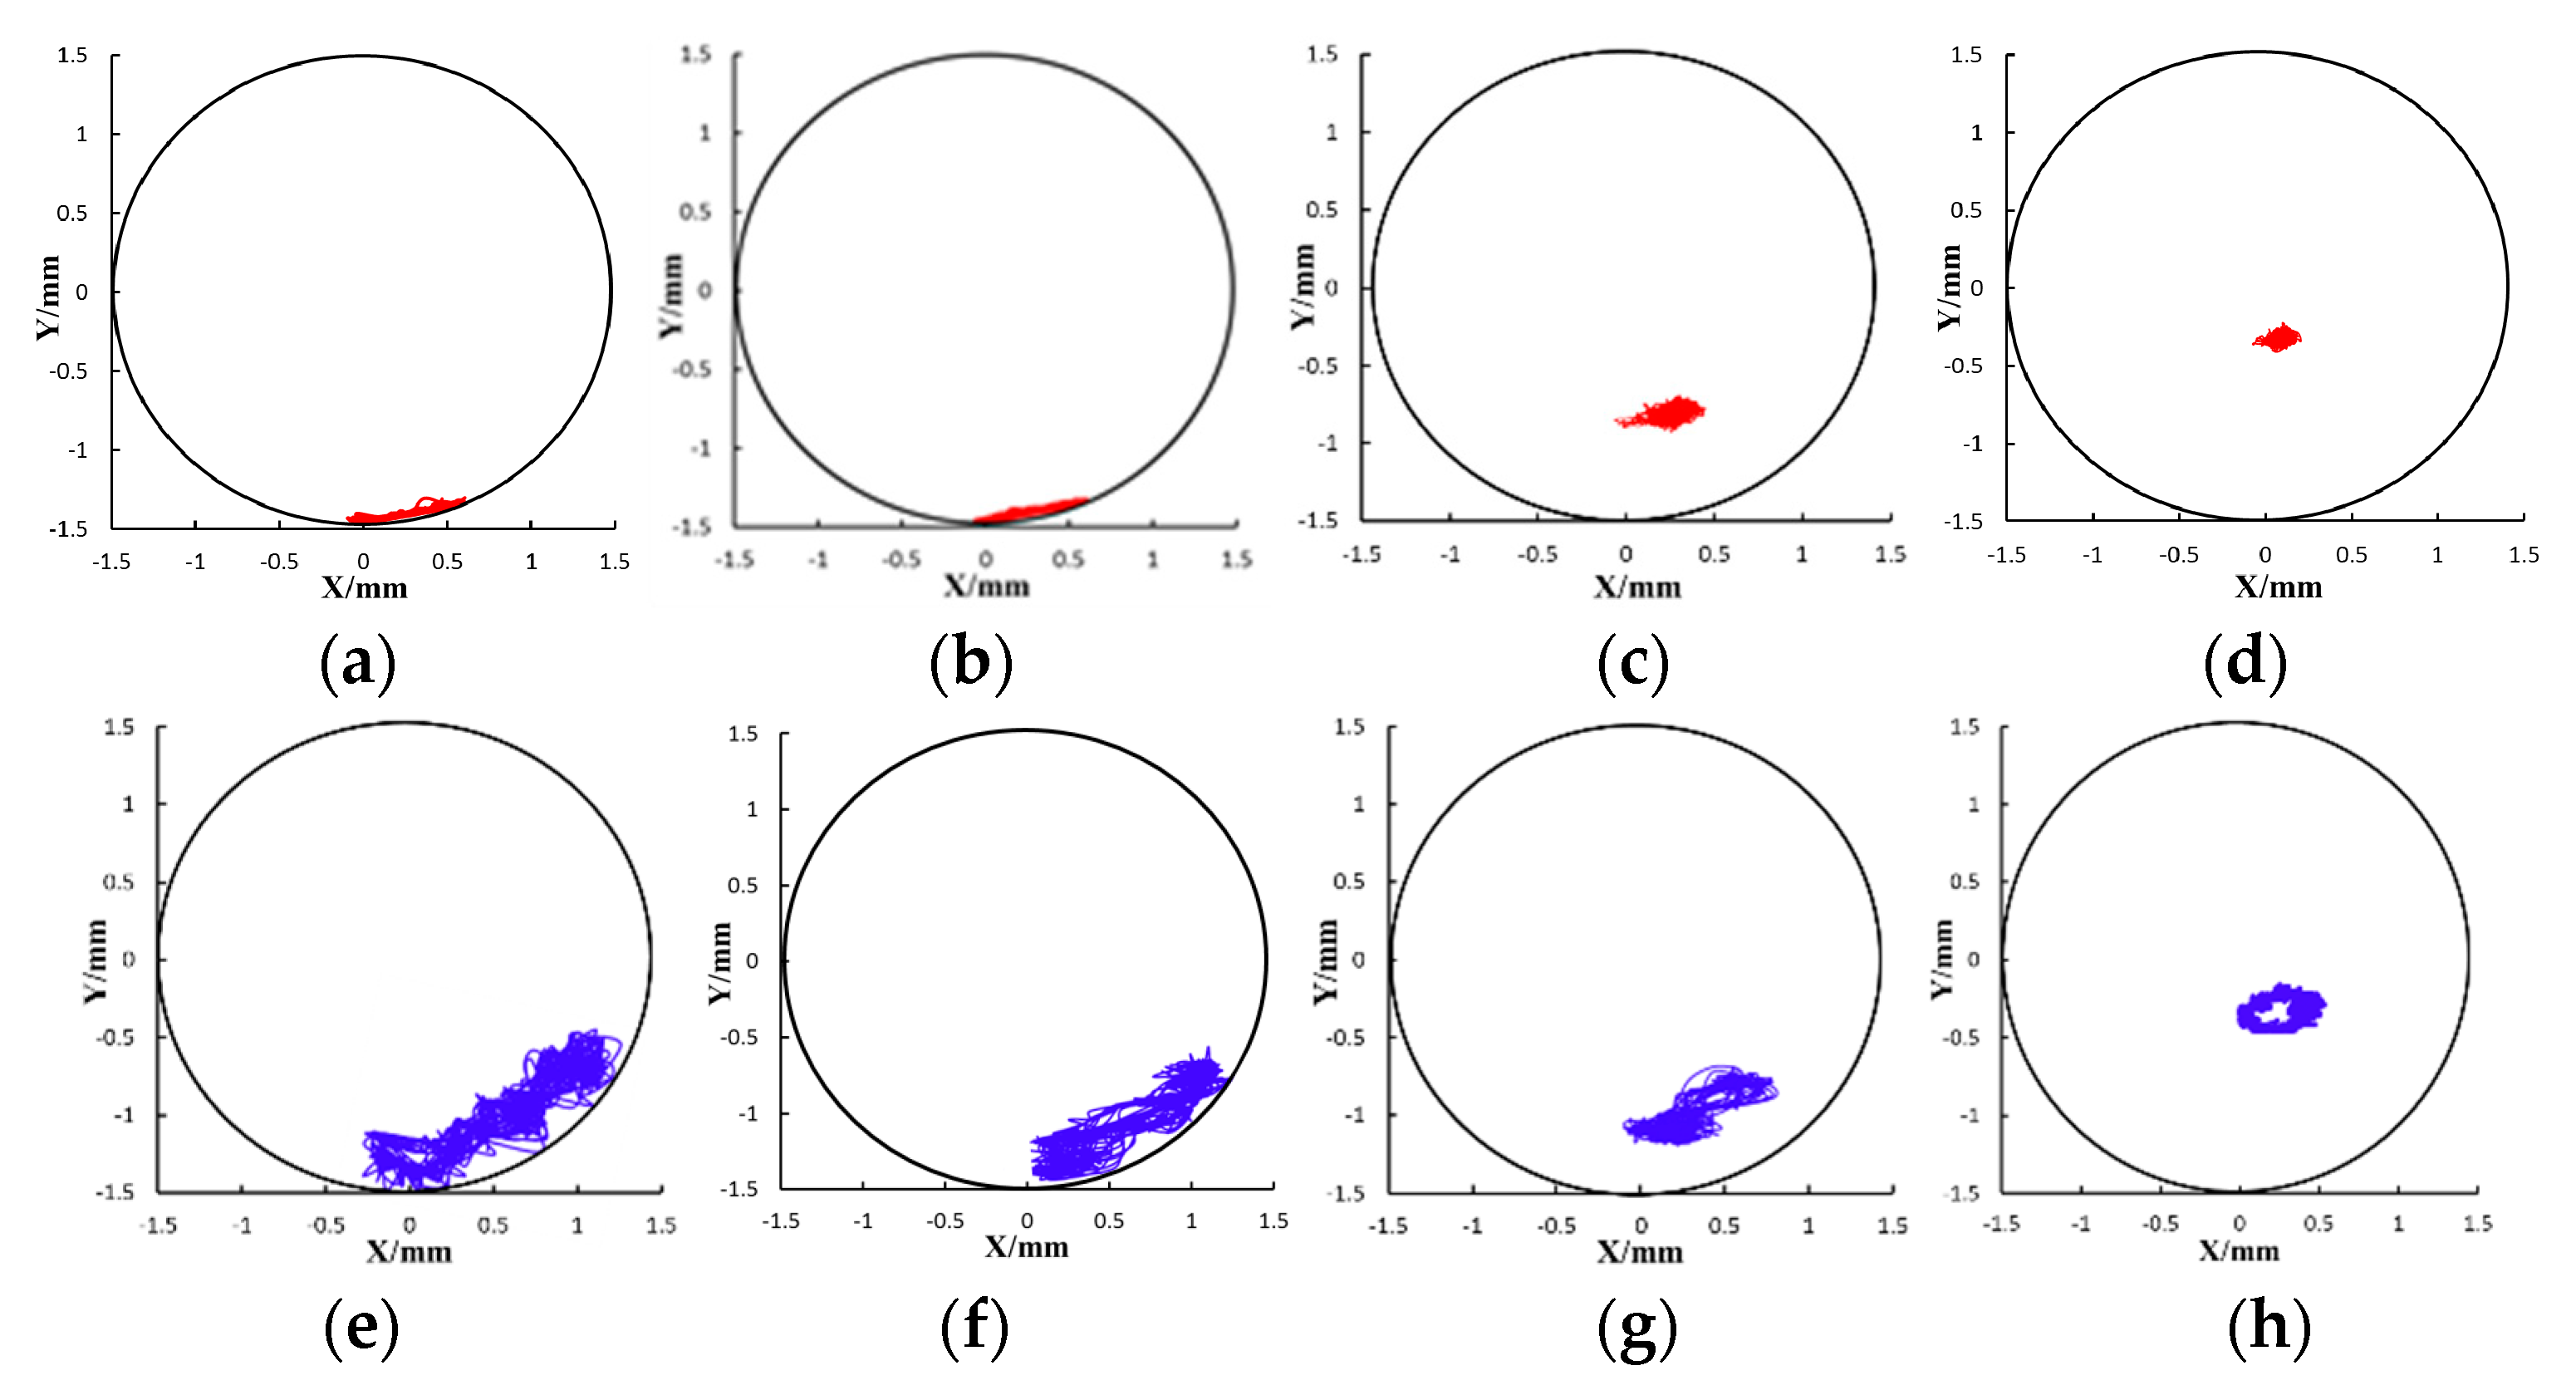
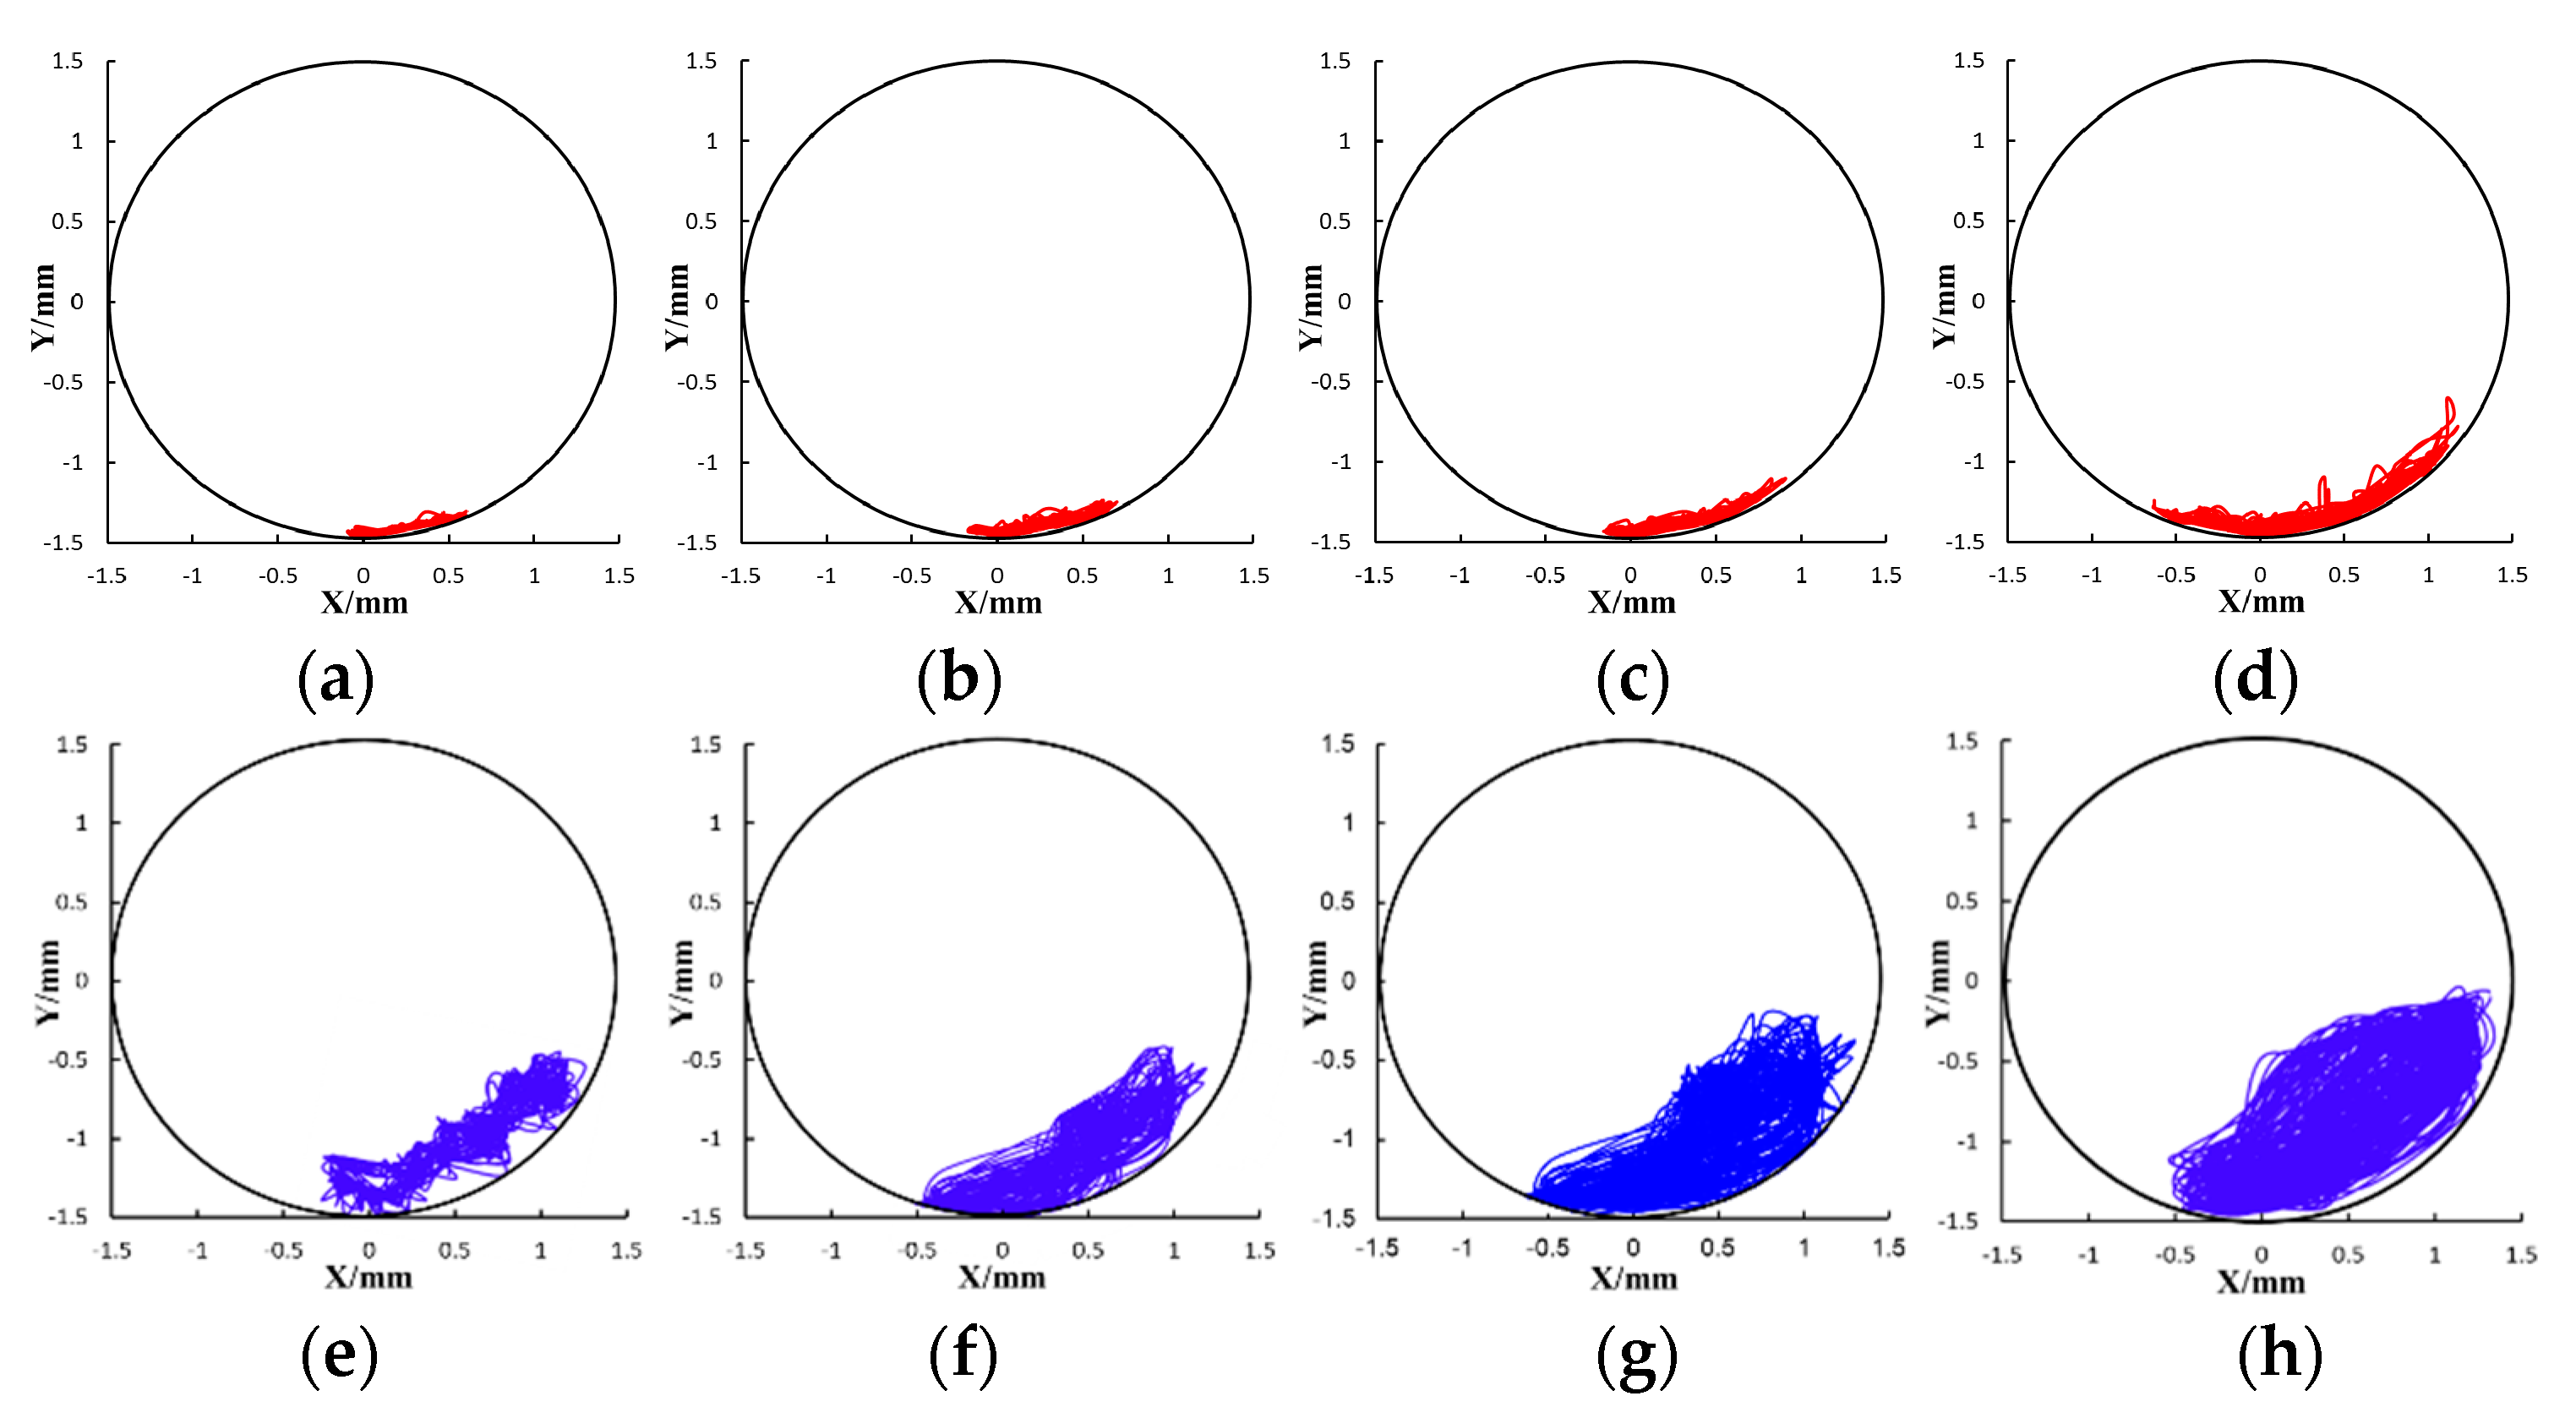
In the numerical simulation and experiment, the measuring position is taken as 0.05 m, 0.1 m, 0.3 m, and 1.0 m from the drill bit respectively, which equals to 2.15 m, 4.3 m, 12.9 m, and 43.0 m from drill bit in engineering scale according to the similarity ratio of geometry. The rotate speed is 100 r/min and the WOB is 0. Figure 7 shows the trajectory curve of BHA center under different measuring positions. The radius of the circle is equal to the clearance between BHA and wellbore. The lateral displacements of BHA under different positions in numerical simulation and experiment is shown in Table 6 and Table 7.
At the measuring position of 1.0 m, the BHA mainly locates at the lower right part of wellbore and the trajectory curve is similar to a circular arc along the wellbore, as shown in Figure 7a,e. The lateral displacement is 0.70 mm in the X-direction and 0.20 mm in the Y-direction in numerical simulation, and 1.29 mm in the X-direction and 1.10 mm in the Y-direction in the experiment. Therefore, the motion state can be named as circular arc swing, whose trajectory is similar to a circular arc at the lower right part of the wellbore and swings forward and backward with a large amplitude along the wellbore.
At the measuring position of 0.3 m, the BHA mainly locates at the lower right part of wellbore and the trajectory curve is similar to a circular arc along the wellbore too, as shown in Figure 7b,f. The lateral displacement is 0.49 mm in the X-direction and 0.17 mm in the Y-direction in numerical simulation, and 1.13 mm in X-direction and 0.87 mm in Y-direction in the experiment. They are similar to that of 1.0 m position. Therefore, the motion state is circular arc swing too.
At the measuring position of 0.1 m, the BHA mainly locates at the lower right part of the wellbore and the trajectory curve is similar to a shape of “8”, as shown in Figure 7c,g. The lateral displacement is 0.35 mm in the X-direction and 0.143 mm in the Y-direction in numerical simulation, and 0.78 mm in the X-direction and 0.55 mm in the Y-direction in the experiment. The magnitude is smaller than that of circular arc swing and the lateral displacement has large fluctuations which means that the BHA swings unstably. Therefore, the motion state can be named as “8” shape swing, whose trajectory is similar to a shape of “8” at the lower right part of wellbore and swings forward and backward with a medium and unstable amplitude.
At the measuring position of 0.05 m, the BHA mainly locates at the center right part of the wellbore and the trajectory curve is similar to a small circle or a large point, as shown in Figure 7d,h. The lateral displacement is 0.13 mm in the X-direction and 0.10 mm in the Y-direction in numerical simulation, and 0.48 mm in the X-direction and 0.32 mm in the Y-direction in the experiment. Therefore, the motion state can be named as dot-like circular motion, whose trajectory is similar to a small circle or a large point at the center right part of wellbore and is always in the clockwise direction with a small amplitude.
In the study, the near-bit area of BHA represents the near-bit area and near-stabilizer area in field scale. The middle section of BHA represents the positions of drill string without the disturbance from other downhole tools in field scale. Through analyses, the motion state of BHA in horizontal wells can be divided into three kinds, including circular arc swing, “8” shape swing, and dot-like circular motion. The circular arc swing mainly appears at the middle section of BHA and it occurs through the collective result of gravity and tangential friction. The dot-like circular motion mainly appears at the near-bit or near-stabilizer area because the drill bit and stabilizer can steady BHA at the center part of wellbore, thus BHA has to revolute with a small amplitude around the axis of wellbore. The “8” shape swing mainly appears at the crossed area of the other two motion states, which occurs through the collective disturbance of circular arc swing and dot-like circular motion.
In addition, the experimental results can match well with the numerical simulation results, which can prove that the continuous dynamic model is reasonable for analysing the motion states of BHA in horizontal wells. Meanwhile, the discrepancies between the two results always exist because of the interference from experimental conditions. In the numerical simulation, the collar is completely straight and it swing along the wellbore without disturbance. However, the collar is not completely straight in the experiment and the collar exhibits little initial bends. When collar swings along the wellbore, the motion may be disturbed by the initial bends. Thus, the swing area of experiment is larger than that of the numerical simulation. Moreover, the discrepancies between the two results can decrease gradually with the increasing of rotate speed.
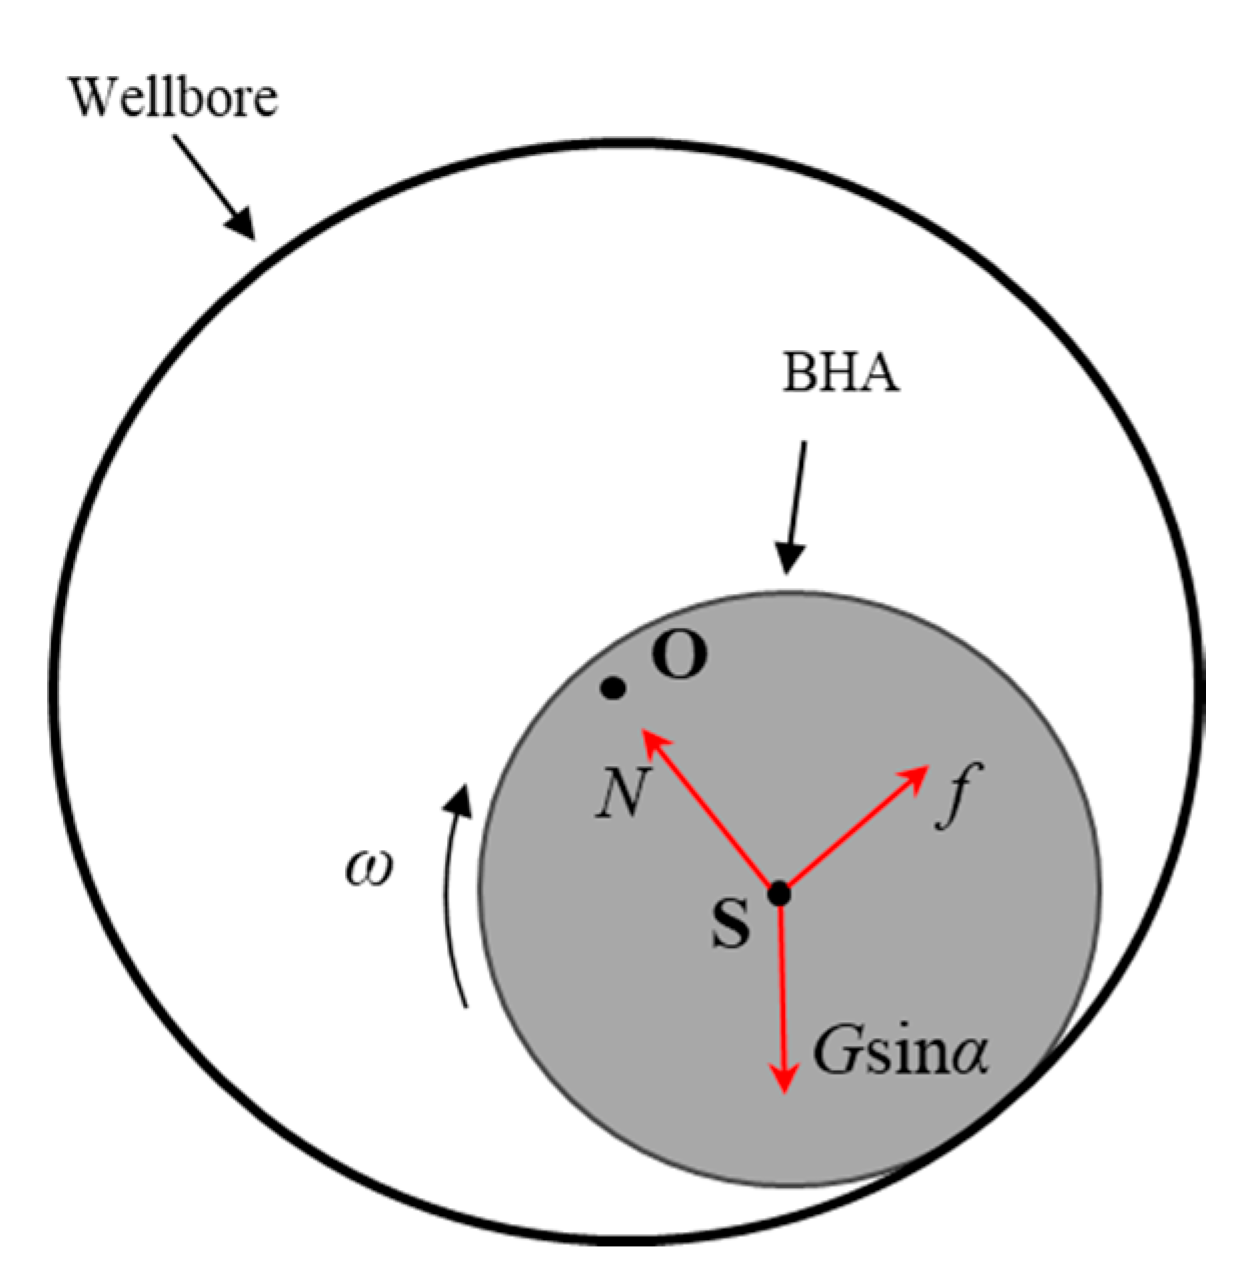
As shown in Figure 8, when the BHA starts to rotate clockwise with rotate speed ω in the horizontal wellbore, the wellbore exerts tangential friction f and normal force N on the BHA. At this time, the BHA climbs along the wellbore in the right direction. In the process of upward “climbing”, the tangential friction will decrease with the decrease of normal force. At a certain position, if the tangential friction is not enough to push the BHA climb, the BHA starts to move downward and drops to the bottom. Then a cycle completes. Thus, the gravity makes BHA down to lower part of wellbore and the tangential friction makes BHA rotate along the right part of wellbore. Thus BHA always rotate at the lower right part of wellbore and the phenomenon just proves the situation of azimuth right drift in drilling field.

4.2. Effects of Rotate Speed

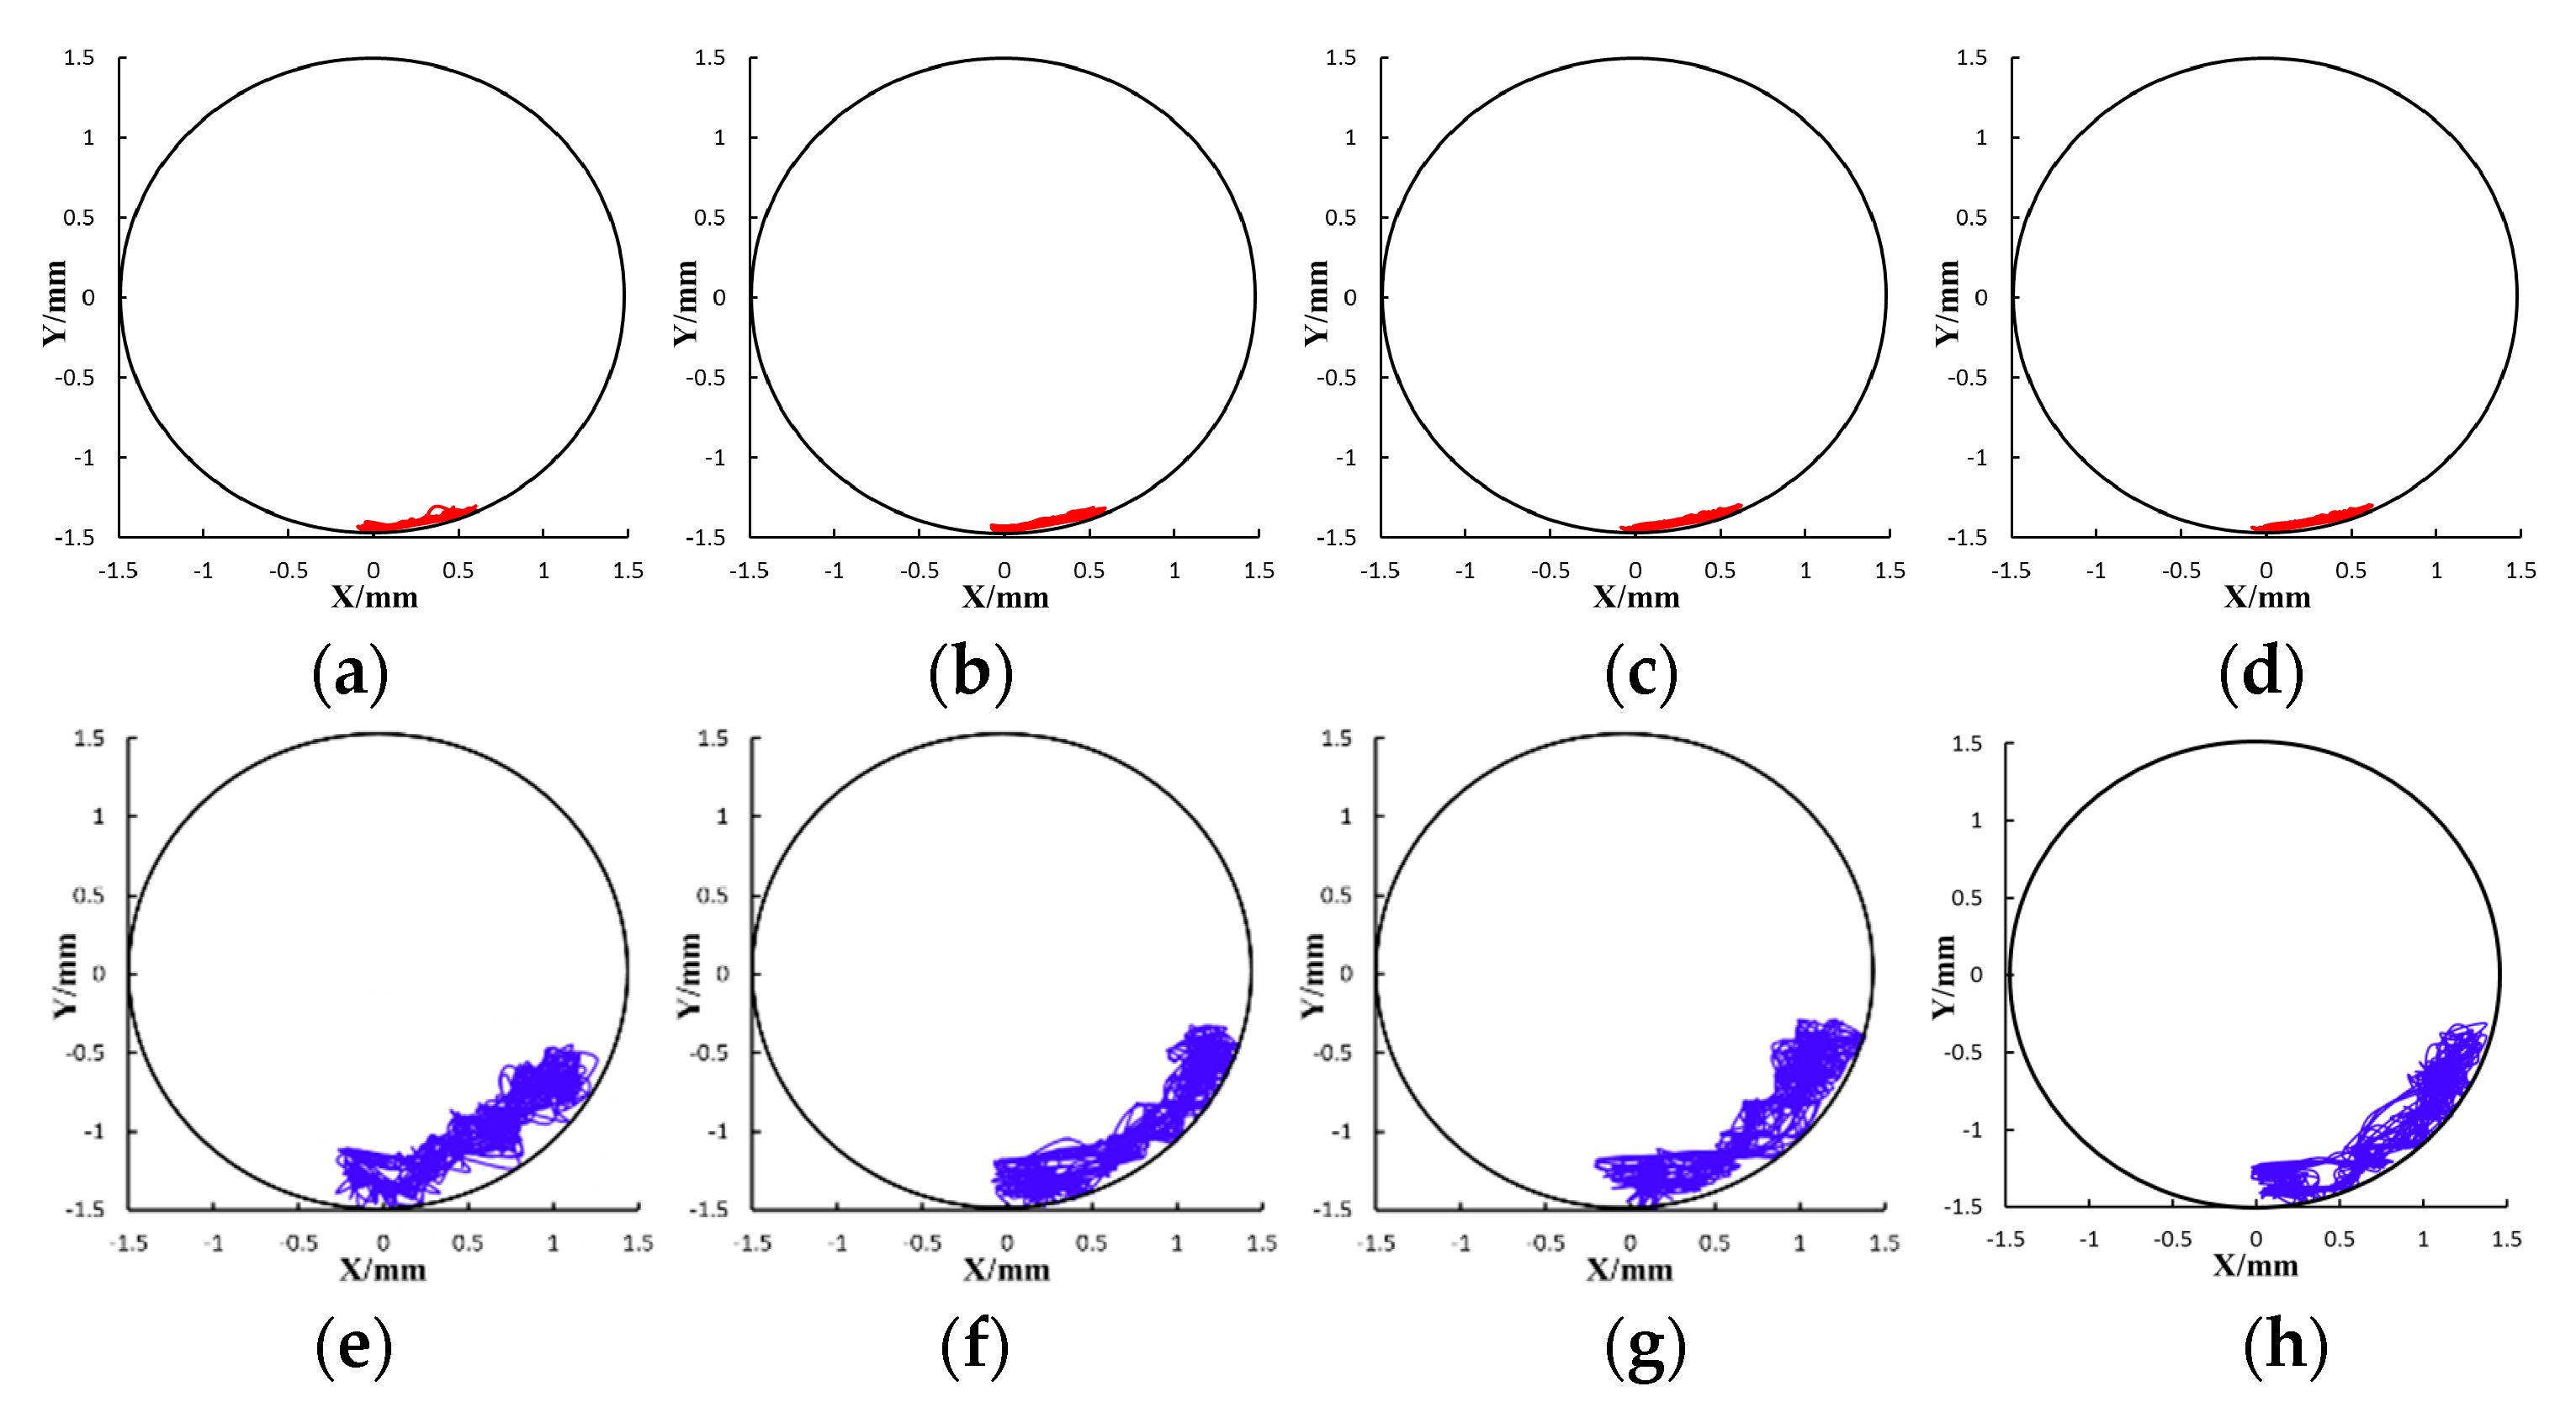
In the numerical simulation and experiment, the rotate speed is taken as 100 r/min, 300 r/min, 500 r/min, and 700 r/min respectively, which equals to 25 r/min, 75 r/min, 125 r/min, and 175 r/min in engineering scale according to the similarity ratio of rotate speed. The WOB is 0 and the measuring position is 1.0 m from the drill bit. Figure 9 shows the trajectory curve of BHA center under different rotate speeds. The lateral displacements of BHA under different rotate speeds in numerical simulation and experiment is shown in Table 8 and Table 9.
In numerical simulation, the lateral displacement is 0.70 mm, 0.86 mm, 1.12 mm, and 1.76 mm respectively in X-direction and 0.20 mm, 0.27 mm, 0.50 mm, and 0.84 mm respectively in Y-direction, which means that the lateral displacement increases with the increase of rotate speed. In the experiment, the results also show that the lateral displacement increases with the increase of rotate speed.
The larger the rotate speed is, the larger the centrifugal force of self-rotation is. Thus the normal force and tangential friction increase with the increase of rotate speed. The BHA can climb higher and the lateral displacement is larger. Meanwhile, the increase of rotate speed means a shorter time in finishing a single swing. Thus the frequency of frictional contact between BHA and wellbore will be correspondingly improved, which can also lead to the increase of tangential friction. Therefore, rotate speed has a promotion on the lateral vibration. In drilling field, in order to keep a small lateral vibration of BHA and protect downhole tools from fatigue failure or damage, a lower rotate speed is recommended as long as it can meet the requirement of ROP.

4.3. Effects of WOB

In the numerical simulation and experiment, the WOB is taken as 0 N, 0.23 N, 0.46 N, and 0.69 N respectively, which equals to 0 N, 30 kN, 60 kN, and 90 kN in engineering scale according to the similarity ratio of WOB. The rotate speed is 100 r/min and the measuring position is 1.0 m from the drill bit. Figure 10 shows the trajectory curve of BHA center under different WOB. The lateral displacements of BHA under different WOB in numerical simulation and experiment is shown in Table 10 and Table 11.
In numerical simulation, the lateral displacement is 0.70 mm, 0.67 mm, 0.70 mm, and 0.72 mm respectively in X-direction and 0.20 mm, 0.19 mm, 0.20 mm, and 0.22 mm respectively in Y-direction, which means that WOB has nearly no effect on the lateral displacement. In the experiment, the results also show that WOB have nearly no effect on the lateral displacement. Therefore, the increase of WOB cannot effect lateral vibration of BHA under the given condition. Thus WOB have a much smaller effect compared to the rotate speed. In drilling field, a slightly large WOB is recommended in order to improve the ROP.

4.4. Effects of Friction Coefficient

In the numerical simulation, the friction coefficient is taken as 0.1, 0.2, 0.3, and 0.4 respectively. The rotate speed is 300 r/min, the WOB is 0, and the measuring position is 1.0 m from the drill bit. Figure 11 shows the trajectory curve of BHA center under different friction coefficients. The lateral displacements of BHA under different friction coefficients in numerical simulation can be shown in Table 12. Moreover, it is difficult to get a clear friction coefficient in the experiment, thus here just shows the numerical simulation results.
In numerical simulation, the lateral displacement is 0.15 mm, 0.86 mm, 0.89 mm, and 1.08 mm respectively in X-direction and 0.12 mm, 0.27 mm, 0.38 mm, and 0.48 mm respectively in Y-direction, which means that the lateral displacement increases with the increase of friction coefficient. The increase of friction coefficient means a larger tangential friction, thus drilling string can climb higher. Therefore, a large friction coefficient has a promotion on lateral vibration. In drilling field, the rock stratum with a larger friction coefficient can make lateral vibration more violent and the drilling construction needs more attention, such as shale stratum [34,35].

5. Conclusions

In the paper, a full-dimensional continuous dynamic model is established and an indoor experimental setup based on the similarity criterion is designed and built to verify the dynamic model. Some useful conclusions and suggestions are as follows:
(1)
The experimental results can match well with the numerical simulation results and it can prove that the BHA dynamic model is reasonable for analysing the motion states of BHA in horizontal wells.
(2)
The motion states of BHA in horizontal wells can be divided into three kinds, including circular arc swing, “8” shape swing, and dot-like circular motion. The circular arc swing mainly appears at the middle section of BHA and occurs through the collective result of gravity and friction. The dot-like circular motion mainly appears at the near-bit or near-stabilizer area because bit and stabilizer can steady the BHA at the center part of the wellbore. The “8” shape swing mainly appears at the crossed area and occurs through collective disturbance of the other two motions.
(3)
The rotate speed and friction coefficient have promotions on the lateral vibration, while WOB have a much smaller effect compared with the other two parameters. From the drilling engineering standpoint, a lower rotate speed is recommended as long as rotate speed can meet the requirement of ROP and thus it can protect downhole tools from fatigue failure or damage. A slightly large WOB is recommended in order to improve the ROP. Moreover, the rock stratum with a larger friction coefficient can make lateral vibration more violent and the drilling construction needs more attention.
(4)
The main purpose of the paper is to verify the full-dimensional continuous model. Thus, all the results are based on the small-scale model, instead of field-scale prototype. It is important to verify the given model and then the field-scale researches will be carried out in further study with the verified model. The effects of stabilizer will be studied in further study.

Author Contributions

Conceptualization, W.L. and G.H.; methodology, W.L.; software, W.L.; validation, G.H.; formal analysis, W.L.; investigation, G.H.; resources, G.H.; data curation, W.J.; writing—original draft preparation, W.L.; writing—review and editing, G.H.; visualization, F.Y.; supervision, H.N.; project administration, H.N.; funding acquisition, G.H. All authors have read and agreed to the published version of the manuscript.

Funding

This research was funded by National Science & Technology Major Project of China, grant number: 2016ZX05060-014.

Conflicts of Interest

The authors declare no conflict of interest.

References

  1. Huang, G.L.; Li, W.; Ni, H.J.; Meng, X.W.; Yu, F.; Wang, S.C. Mechanism analysis of pull-up and quick release technique during casing running process. J. China Univ. Pet. (Ed. Nat. Sci.) 2017, 41, 85–90. [Google Scholar]
  2. Li, W.; Liu, W.C.; Zhou, X.H.; Ni, H.J.; Yu, F.; Zang, Y.B. Three dimensional horizontal wellbore trajectory optimization design method in Fuling shale gas field. Pet. Drill. Tech. 2018, 46, 17–23. [Google Scholar]
  3. Chen, P.J.; Gao, D.L.; Shi, Y.C.; Wang, Z.H.; Huang, W.J. Study on aggressively working casing string in extended-reach well. J. Pet. Sci. Eng. 2017, 157, 604–616. [Google Scholar] [CrossRef]
  4. Albdiry, M.T.; Almensory, M.F. Failure analysis of drillstring in petroleum industry: A review. Eng. Fail. Anal. 2016, 65, 74–85. [Google Scholar] [CrossRef]
  5. Li, W.; Huang, G.L.; Jing, Y.H.; Yu, F.; Ni, H.J. Modeling and mechanism analyzing of casing running with pick-up and release technique. J. Pet. Sci. Eng. 2019, 172, 538–546. [Google Scholar] [CrossRef]
  6. Tian, J.L.; Yang, Y.L.; Yang, L. Vibration characteristics analysis and experimental study of horizontal drill string with wellbore random friction force. Arch. Appl. Mech. 2017, 87, 1439–1451. [Google Scholar] [CrossRef]
  7. Zhu, W.P.; Di, Q.F. Effect of prebent deflection on lateral vibration of stabilized drill collars. SPE J. 2011, 16, 200–216. [Google Scholar] [CrossRef]
  8. Zhu, X.H.; Liu, Q.Y.; Tong, H. Research on dynamics model of full hole drilling-string system with three-dimensional trajectory. Acta Pet. Sin. 2008, 29, 288–291, 295. [Google Scholar]
  9. Cheng, Z.B.; Jiang, W.; Ren, G.X.; Zhou, J.L.; Jiang, S.Q.; Yang, C.J.; He, B.S. A multibody dynamical model of full-hole drillstring system. Acta Pet. Sin. 2013, 34, 753–758. [Google Scholar]
  10. Dong, G.J.; Chen, P. 3D Numerical simulation and experiment validation of dynamic damage characteristics of anisotropic shale for percussive-rotary drilling with a full-scale PDC bit. Energies 2018, 11, 1326. [Google Scholar] [CrossRef] [Green Version]
  11. Chen, Y.J.; Fu, J.H.; Ma, T.S.; Tong, A.P.; Guo, Z.X.; Wang, X.D. Numerical modeling of dynamic behavior and steering ability of a bottom hole assembly with a bent-housing positive displacement motor under rotary drilling conditions. Energies 2018, 11, 2568. [Google Scholar] [CrossRef] [Green Version]
  12. Sarker, M.; Rideout, D.G.; Butt, S.D. Dynamic model for 3D motions of a horizontal oil well BHA with wellbore stick-slip whirl interaction. J. Pet. Sci. Eng. 2017, 157, 482–506. [Google Scholar] [CrossRef]
  13. Ambrus, A.; Skadsem, H.J.; Mihai, R.G. Similarity analysis for downscaling a full size drill string to a laboratory scale test drilling rig. In Proceedings of the ASME 2018 37th International Conference on Ocean, Offshore and Arctic Engineering, Madrid, Spain, 17–22 June 2018. [Google Scholar]
  14. Fan, Y.T.; Gao, D.L.; Zhang, H.; Fang, J. Simulation and experimental research on mechanical properties of bottom hole assembly. Pet. Drill. Tech. 2013, 41, 80–84. [Google Scholar]
  15. Baumgart, A. Stick-slip and bit-bounce of deep-hole drillstrings. J. Energy Resour. Technol. 2000, 122, 78–82. [Google Scholar] [CrossRef]
  16. Liao, C.M.; Vlajic, N.; Karki, H.; Balachandran, B. Parametric studies on drill-string motions. Int. J. Mech. Sci. 2012, 54, 260–268. [Google Scholar] [CrossRef]
  17. Omojuwa, E.; Osisanya, S.; Ahmed, R. Computation of axial load and torque distribution in tubulars used for extended-reach horizontal wells using a holistic design philosophy. In Proceedings of the International Petroleum Conference and Exhibition, Abu Dhabi, UAE, 11–14 November 2012. [Google Scholar]
  18. Liu, X.B.; Vlajic, N.; Long, X.H.; Meng, G.; Balachandran, B. State-dependent delay influenced drill-string oscillations and stability analysis. J. Vib. Acoust. 2014, 136, 051008. [Google Scholar] [CrossRef]
  19. Wilson, J.K.; Heisig, G. Investigating the benefits of induced vibrations in unconventional horizontals via nonlinear drill string dynamics modeling. In Proceedings of the SPE/IADC Drilling Conference and Exhibition, London, UK, 17–19 March 2015. [Google Scholar]
  20. Guan, Z.C.; Jin, Y.X.; Wang, Y.F. Experimental research on motion behavior of bottom drill string in straight hole. Acta Pet. Sin. 2003, 24, 102–106. [Google Scholar]
  21. Liu, X.B.; Vlajic, N.; Long, X.H.; Meng, G.; Balachandran, B. Nonlinear motions of a flexible rotor with a drill bit: Stick-slip and delay effects. Nonlinear Dyn. 2013, 72, 61–77. [Google Scholar] [CrossRef]
  22. Popp, T.; Stibbe, H.; Heinisch, D.; Reckman, H.; Spanos, P. Backward whirl testing and modeling with realistic borehole contacts for enhanced drilling tool reliability. In Proceedings of the IADC/SPE Drilling Conference and Exhibition, Fort Worth, TX, USA, 6–8 March 2018. [Google Scholar]
  23. Shao, D.D.; Cuan, Z.C.; Wen, X.; Shi, Y.C. Experiment on lateral vibration characteristics of horizontal rotary drilling string. J. China Univ. Pet. (Ed. Nat. Sci.) 2013, 37, 100–103. [Google Scholar]
  24. Guan, Z.C.; Shao, D.D.; Wen, X.; Shi, Y.C. Experimental research on motion states of bottom drilling string in horizontal well. Eng. Mech. 2013, 30, 340–345. [Google Scholar]
  25. Xie, Q. Research on Characteristics of the Simulation BHA in Different State of Motion; China University of Petroleum (East China): Dongying, China, 2016. [Google Scholar]
  26. Liu, Y.S.; Gao, D.L. A nonlinear dynamic model for characterizing downhole motions of drill-string in a deviated well. J. Nat. Gas Sci. Eng. 2017, 38, 466–474. [Google Scholar] [CrossRef]
  27. Guan, Z.C.; Wang, H.; Shi, Y.C.; Chen, W.Q.; Zhao, G.S.; Wang, J.Y.; Cao, G.Q. Dynamic behavior analysis of push-the-bit rotary steerable bottom hole assembly. J. Mech. Sci. Technol. 2019, 33, 1501–1511. [Google Scholar] [CrossRef]
  28. Wang, H.; Guan, Z.C.; Shi, Y.C.; Chen, W.Q.; Liu, Y.W.; Zhang, B.; Liang, D.Y.; Wang, X.H. Modeling and analyzing the motion state of bottom hole assembly in highly deviated wells. J. Pet. Sci. Eng. 2018, 170, 763–771. [Google Scholar] [CrossRef]
  29. Lian, Z.H.; Zhang, Q.; Lin, T.J.; Wang, F.H. Experimental and numerical study of drill string dynamics in gas drilling of horizontal wells. J. Nat. Gas Sci. Eng. 2015, 27, 1412–1420. [Google Scholar] [CrossRef]
  30. Stroud, D.R.H.; Minett-Smith, D.J. Analytical and experimental backward whirl simulations for rotary steerable bottom hole assemblies. In Proceedings of the SPE/IADC Drilling Conference and Exhibition, Amsterdam, The Netherlands, 1–3 March 2011. [Google Scholar]
  31. Mongkolcheep, K.; Ruimi, A.; Palazzolo, A. Modal reduction technique for predicting the onset of chaotic behavior due to lateral vibrations in drillstrings. J. Vib. Acoust. 2015, 137, 021003. [Google Scholar] [CrossRef]
  32. Wen, X.; Guan, Z.C.; Shao, D.D.; Zhou, Y.C. Experimental study of dynamic characteristics of drillstring in highly deviated well. J. China Univ. Pet. (Ed. Nat. Sci.) 2018, 42, 79–86. [Google Scholar]
  33. Shi, Y.C.; Wan, Y.Y.; Wu, C.F. Setting up a simulate device on motion behavior of bottom-hole assembly according to similitude principles. J. Guangxi Univ. (Ed. Nat. Sci.) 2006, 31, 159–162. [Google Scholar]
  34. Chen, P.J.; Gao, D.L.; Shi, Y.C.; Wang, Z.H.; Huang, W.J. Study on multi-segment friction factors inversion in extended-reach well based on an enhanced PSO model. J. Nat. Gas Sci. Eng. 2015, 27, 1780–1787. [Google Scholar] [CrossRef]
  35. Wang, P.; Ni, H.J.; Wang, R.H.; Li, Z.N.; Wang, Y. Experimental investigation of the effect of in-plane vibrations on friction for different materials. Tribol. Int. 2016, 99, 237–247. [Google Scholar] [CrossRef]
Figure 1. Nodal displacement vector of drill string element.
Energies 13 00925 g001
Figure 2. Accelerations acting on cross section of bottom hole assembly (BHA).
Energies 13 00925 g002
Figure 3. The contact between BHA and wellbore.
Energies 13 00925 g003
Figure 4. Schematic diagram of the experimental setup.
Energies 13 00925 g004
Figure 5. Top view of the experimental setup.
Energies 13 00925 g005
Figure 6. Research object of numerical simulation and experiment.
Energies 13 00925 g006
Figure 7. Trajectory curve of BHA center under different positions: (a–d) are the numerical simulation results with 1.0 m, 0.3 m, 0.1 m, and 0.05 m respectively; (e–h) are the experimental results with 1.0 m, 0.3 m, 0.1 m, and 0.05 m respectively.
Energies 13 00925 g007
Figure 8. Schematic diagram of lateral force.
Energies 13 00925 g008
Figure 9. Trajectory curve of BHA center under different rotating speeds: (ad) are the numerical simulation results with 100 r/min, 300 r/min, 500 r/min, and 700 r/min respectively; (eh) are the experimental results with 100 r/min, 300 r/min, 500 r/min, and 700 r/min respectively.
Energies 13 00925 g009
Figure 10. Trajectory curve of BHA center under different WOB: (a–d) are the numerical simulation results with 0 N, 0.23 N, 0.46 N, and 0.69 N respectively; (e–h) are the experimental results with 0 N, 0.23 N, 0.46 N, and 0.69 N respectively.
Energies 13 00925 g010
Figure 11. Trajectory curve of BHA center under different friction coefficients: (a–d) are the numerical simulation results with 0.1, 0.2, 0.3, and 0.4 respectively.
Energies 13 00925 g011
Table 1. The parameter selection of measuring position.
Measuring Positionm1m2m3m4
Numerical model (m)0.050.10.31.0
Experimental model (m)0.050.10.31.0
Engineering prototype (m)2.154.312.943.0
Table 2. The parameter selection of rotate speed.
Rotate Speedω1ω2ω3ω4
Numerical model (r/min)100300500700
Experimental model (r/min)100300500700
Engineering prototype (r/min)2575125175
Table 3. The parameter selection of weight on bit (WOB).
WOBW1W2W3W4
Numerical model (N)00.230.460.69
Experimental model (N)00.230.460.69
Engineering prototype (kN)0306090
Table 4. The parameter selection of friction coefficient.
Friction Coefficientμ1μ2μ3μ4
Numerical model0.10.20.30.4
Engineering prototype 0.10.20.30.4
Table 5. Detailed parameters used in numerical simulation and experiment.
PropertyValueUnits
Length of collar2m
Outer diameter of collar5mm
Outer diameter of bit8mm
Inner diameter of wellbore8mm
Density of collar1200kg/m3
Elasticity modulus of collar3GPa
Poisson ratio of collar0.47-
Table 6. Lateral displacement of BHA under different positions in numerical simulation.
Measuring PositionX-DirectionY-Direction
1.0 m from the drill bit0.70 mm0.20 mm
0.3 m from the drill bit0.49 mm0.17 mm
0.1 m from the drill bit0.35 mm0.14 mm
0.05 m from the drill bit0.13 mm0.10 mm
Table 7. Lateral displacement of BHA under different positions in experiment.
Measuring PositionX-DirectionY-Direction
1.0 m from the drill bit1.29 mm1.10 mm
0.3 m from the drill bit1.13 mm0.87 mm
0.1 m from the drill bit0.78 mm0.55 mm
0.05 m from the drill bit0.48 mm0.32 mm
Table 8. Lateral displacement of BHA under different rotate speeds in numerical simulation.
Rotate SpeedX-DirectionY-Direction
100 r/min0.70 mm0.20 mm
300 r/min0.86 mm0.27 mm
500 r/min1.12 mm0.50 mm
700 r/min1.76 mm0.84 mm
Table 9. Lateral displacement of BHA under different rotate speeds in experiment.
Rotate SpeedX-DirectionY-Direction
100 r/min1.29 mm1.10 mm
300 r/min1.35 mm1.21 mm
500 r/min1.45 mm1.28 mm
700 r/min1.70 mm1.35 mm
Table 10. Lateral displacement of BHA under different WOB in numerical simulation.
WOBX-DirectionY-Direction
0 N0.70 mm0.20 mm
0.23 N0.67 mm0.19 mm
0.46 N0.70 mm0.20 mm
0.69 N0.72 mm0.22 mm
Table 11. Lateral displacement of BHA under different WOB in experiment.
WOBX-DirectionY-Direction
0 N1.29 mm1.10 mm
0.23 N1.31 mm1.13 mm
0.46 N1.30 mm1.15 mm
0.69 N1.29 mm1.11 mm
Table 12. Lateral displacement of BHA under different friction coefficients in numerical simulation.
Friction CoefficientX-DirectionY-Direction
0.10.15 mm0.12 mm
0.20.86 mm0.27 mm
0.30.89 mm0.38 mm
0.41.08 mm0.48 mm