Abstract
Electrochemical impedance spectroscopy (EIS) is a powerful tool for investigating electrochemical systems, such as lithium-ion batteries or fuel cells, given its high frequency resolution. The distribution of relaxation times (DRT) method offers a model-free approach for a deeper understanding of EIS data. However, in lithium-ion batteries, the differential capacity caused by diffusion processes is non-negligible and cannot be decomposed by the DRT method, which limits the applicability of the DRT method to lithium-ion batteries. In this study, a joint estimation method with Tikhonov regularization is proposed to estimate the differential capacity and the DRT simultaneously. Moreover, the equivalence of the differential capacity and the incremental capacity is proven. Different types of commercial lithium-ion batteries are tested to validate the joint estimation method and to verify the equivalence. The differential capacity is shown to be a promising approach to the evaluation of the state-of-health (SOH) of lithium-ion batteries based on its equivalence with the incremental capacity.
1. Introduction
Electrochemical impedance spectroscopy (EIS) has been proven to be a powerful tool for the diagnosis of complex electrochemical systems, including lithium-ion batteries [1,2,3,4,5,6], fuel cells [7,8], and supercapacitors [9,10]. Electrochemical impedance spectroscopy has been widely used to characterize the polarization processes of lithium-ion batteries [11,12,13,14] and to investigate various prognostics and health management (PHM) methods [15,16,17,18,19]. Electrochemical impedance spectrum is generally analyzed by a carefully chosen equivalent-circuit model (ECM), which requires knowledge about the electrochemical processes that take place at the individual electrodes within the cell [20,21,22,23]. Comparison between EIS-based ECM and incremental capacity has been presented to identify and quantify the effects of degradation modes [24]. However, some non-ideal processes and the overlapping effects lead to a certain level of ambiguity of the ECM during the model identification [25,26,27]. This problem needs to be settled by the deconvolution of the EIS data with respect to the distribution of relaxation times (DRT) [28,29,30,31,32].
Considering the DRT offers an approach that does not rely on any prior knowledge of the investigated electrochemical system [33,34]. Therefore, the use of the DRT is regarded as a model-free approach for system identifications. The DRT method attempts to decompose the impedance of a capacitive electrochemical system into a continuous distribution of resistor-capacitor (RC) elements in the domain of relaxation times [35]. Good practices were reported in the context of the analysis of the impedance of solid oxide fuel cells (SOFCs) and high-frequency impedance of lithium-ion batteries [7,31,32,36]. For low frequencies, however, the differential capacity caused by diffusion processes is non-negligible, and thus, cannot be decomposed by DRT. Consequently, low frequencies limit the application of the DRT method to lithium-ion batteries [5,37,38,39].
For lithium-ion batteries, the differential capacitive tail, as shown in Figure 1, has to be considered at low frequencies. Consequently, the DRT method needs to be modified as it cannot characterize a pure capacitive behavior. Some amending methods have been proposed to estimate the differential capacity, such as the preprocessing method [12,28], the distribution function of differential capacity (DDC) method [39], the distribution of diffusion times (DDT) method [40], and the differential impedance analysis (DIA) method [41,42]. However, the differential capacity and the DRT are estimated separately, resulting in accumulative errors, thereby limiting the applicability of the DRT method to lithium-ion batteries.
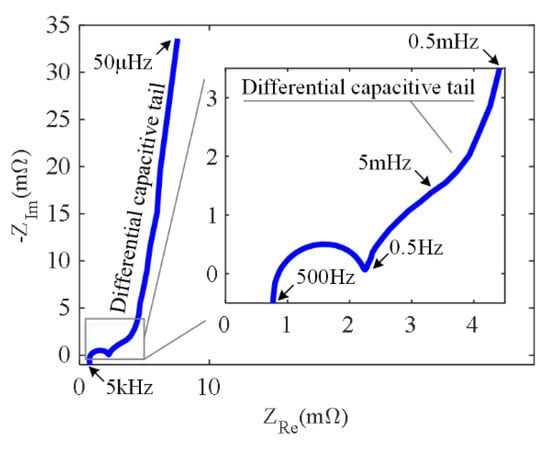
Figure 1.
Electrochemical impedance spectrum of a lithium-ion battery with a differential capacitive tail, measured from 5 kHz to 50 μHz.
In this paper:
- (1)
- A joint estimation method with Tikhonov regularization is proposed to simultaneously estimate the differential capacity and the DRT with the aim of minimizing the estimation errors and to obtain more information about the diffusion processes by EIS.
- (2)
- Moreover, the equivalence of the differential capacity CDC and the incremental capacity CIC is proven in Section 2.
- (3)
- Four types of commercial lithium-ion batteries are tested in Section 3 to validate the joint estimation method and to verify the equivalence of the CDC and CIC.
- (4)
- Subsequently, the estimation results of the DRT and the CDC are discussed in Section 4.
- (5)
- In addition, an efficient state-of-health (SOH) evaluation method is demonstrated based on the relationship between the CDC and the cell capacity in Section 4.
- (6)
- The conclusions of the work are summarized in Section 5.
2. Theoretical
2.1. The Relationship between EIS and ICA
This section derives the relationship between the differential capacity CDC identified by EIS and the incremental capacity CIC obtained by ICA.
A typical EIS involves sweeping the excitation frequency with a sinusoidal voltage or current. In the EIS data, the complex impedance can be described by a frequency-dependent function:
where is the angular frequency, is the excitation voltage, is the current response, j is the imaginary unit, is the ohmic resistance, and is the polarization resistance. The differential capacity CDC can be extracted theoretically by processing the limit at extremely low frequencies:
where is the incremental capacity [43,44], denoted as CIC. The equivalence of the CDC and CIC can be proved by Equation (2). The detailed derivation is given in Appendix A. Figure 2 gives a graphical interpretation of the relationship between CDC and CIC for a better understanding of the equivalence. This equivalence relationship expands the applicability of EIS to lithium-ion batteries, given that CDC and CIC are equal. This is highly beneficial, since estimating CDC by EIS in certain cases is more straightforward and time-efficient compared with the use of ICA to measure CIC.
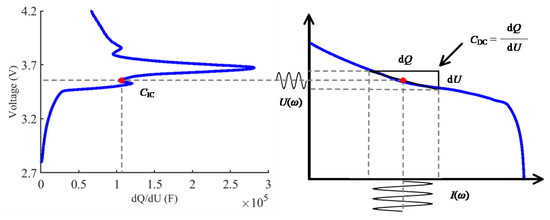
Figure 2.
Relationship between CDC and CIC.
2.2. The Joint Estimation Method with Tikhonov Regularization
The value of the CDC cannot be directly calculated by Equation (2) because the sweeping frequencies are discrete and have a lower limit. Therefore, the DRT method must be modified. The experimental data measured at several sweeping frequencies were fitted by a model as follows [12,28,29,32]:
where represents the characteristic time constants and g represents the distribution of the polarization resistance. Furthermore, the differential capacity is non-negligible for lithium-ion batteries as it contains information about the diffusion processes. Consequently, considering the differential capacity of lithium-ion batteries, the model was modified to obtain the following expression:
where represents the DRT model considering the differential capacity CDC. Subsequently, the discretized DRT model derived for Equation (3) in Ref. [29] can be reformulated into:
where ω is a column vector with n entries equal to the sweeping frequencies, represents the approximation matrix of the DRT of the real part of the EIS data, represents the approximation matrix of the DRT of the imaginary part of the EIS, and x represents the parameter vector for the DRT approximation. Then, the joint estimation function can be obtained by fitting the data with the improved discretized DRT model , which implies the minimization of the following sum of squares:
where and represent the frequency matrices of the DRT, 1 is a column vector with n entries all equal to 1, is the real part of the experimental data, and is the imaginary part of the experimental data. Implementation of the traditional DRT method is well established in the literature [7,12,28,29,38]. Hence, in the present work, we extend the traditional DRT to cover the CDC part of the curve and perform a joint estimation. So, we only provide the modified optimization function to account for the CDC based on Equation (6) as follows:
where λ is the regularization coefficient and M is the regularization matrix, which is derived in Ref. [29]. The problem stated in Equation (7) is the well-known Tikhonov regularization problem whose solution can be obtained by various numeric algorithms [29,38,45,46]. Then, the ohmic resistance , the differential capacity CDC, and the parameter x of the DRT can be simultaneously estimated by minimizing J(x) in Equation (7).
3. Experimental
3.1. The Test Conditions
Table 1 lists the specifications of the four types of commercial lithium-ion batteries that were tested. The batteries will be henceforth referred to by the capitals A, B, C, and D for convenience. Two batteries had LiNixCoyMnzO2 (NCM) cathodes, one had a LiFePO4 (LFP) cathode, and one had a mixed cathode consisting of NCM and LiMn2O4 (LMO). Each battery had graphite anodes, marked as G in Table 1.

Table 1.
Specifications of the tested lithium-ion batteries.
The battery test platform is shown in Figure 3. The test platform consisted of a CT-4008-5V100A-NTFA tester (Neware, Shenzhen, China) a BTH-150C thermal chamber (DGBELL, Dongguan, China) an Autolab PGSTAT302N electrochemical workstation (Metrohm AG, Herisau, Switzerland) and a host computer. The Neware tester was used to charge and discharge the tested cells. The sampling frequency of the Neware tester was 1 Hz and its measurement accuracy was ±0.05% of its full scale. The thermal chamber provided the required ambient temperature with an accuracy of ±0.5 °C. The electrochemical workstation was used for EIS tests with a sampling frequency of 10 MHz. The host computer was used to control the tests and for data storage.
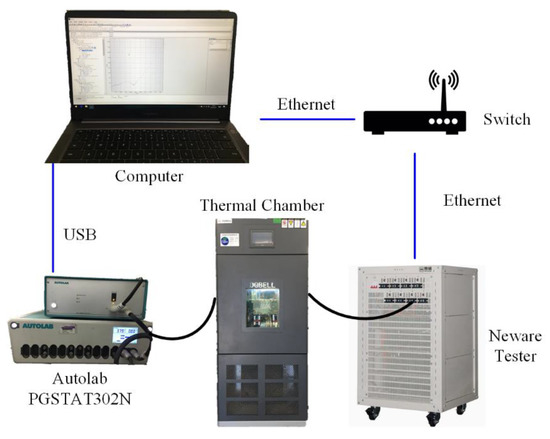
Figure 3.
Configuration of the battery test platform.
3.2. The Test Profiles
Two test profiles were designed to verify the equivalence of the CDC and CIC. The profile for the EIS is described in Table 2 and the profile for the ICA is described in Table 3. EIS tests were conducted at 10% SOC intervals ranging from 100% to 0% SOC. The amplitude of the applied voltage in the EIS tests was 5 mV, and the frequency range is 2 kHz–2 mHz (60 points). For the ICA, the charging data of 1/20 C was adopted and processed by the probability density function (PDF) method [44].
Table 2.
Test profile 1 for the EIS measurements.
Table 3.
Test profile 2 for the ICA measurements.
3.3. Aging Characterization of the Cells
Several D-type cells (denoted as D1–D7) were subject to cycling at 45 °C with a charge/discharge rate of 1 °C. D1 was a fresh cell, while D2 to D7 have been exposed to varying cycling, and hence, possessed varying SOH. In this paper, SOH is defined by assessing the actual capacity divided by the nominal capacity as follows [47,48,49,50,51]:
where is the actual capacity in the cell’s present condition and represents the nominal capacity of the cell.
Detailed information about the aging cells and their testing procedures are listed in Table 4 and Table 5, respectively. The SOH of the batteries ranged from 100% to 63.9% (Table 4), which covers the whole life cycle of commercially available lithium-ion batteries. The characterization procedures given in Table 5 mainly consist of EIS tests at a certain open-circuit voltage (OCV).
Table 4.
Capacity and SOH of aging D-type cells.
Table 5.
Characterization procedures of the aging D-type cells.
4. Results and Discussion
In this section, the test results are given, the estimation results using the joint estimation method are provided, and a comparison of the CDC and the CIC is conducted. CDC values of the cells with different capacities were estimated, and their relationship with the SOH of the cells was evaluated.
4.1. The Estimation Results of the DRT and the CDC
Figure 4 shows the EIS results of Cells A, B, C and D. The EIS results are shifted in the y-direction for better visualization.
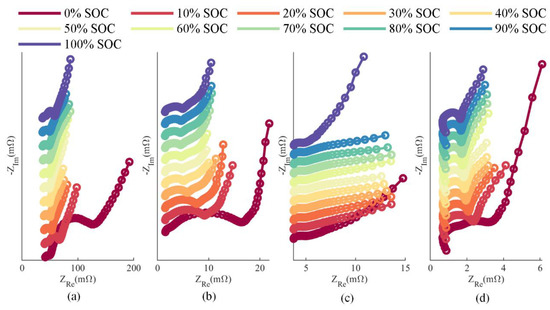
Figure 4.
EIS results of (a) Cell A; (b) Cell B; (c) Cell C; and (d) Cell D at every 10% SOC.
The CDC and the DRT were simultaneously estimated by the joint estimation method based on the shown EIS results. A comparison of the traditional DRT method and the proposed joint estimation method is shown in Figure 5, where the blue line shows the results obtained by the traditional DRT method, and the red one shows the results obtained by the proposed joint estimation method. The solid and dotted lines are the EIS results in different frequency bands. The frequency range of the solid lines was 2 kHz–2 mHz while the frequency range of the dotted lines was 2 kHz–20 mHz, which means that the solid line contains the low frequency (LF) and the dotted line does not. The CDC cannot be accurately determined by the traditional DRT method, which can be seen from the highest peak in Figure 5. This peak is caused by the CDC, and its height and position are affected by the frequency range of the EIS. The results of the proposed joint estimation method are hardly affected by the frequency range of the EIS. Therefore, the proposed joint estimation method can effectively solve the problem of determining the CDC compared with the traditional DRT method.
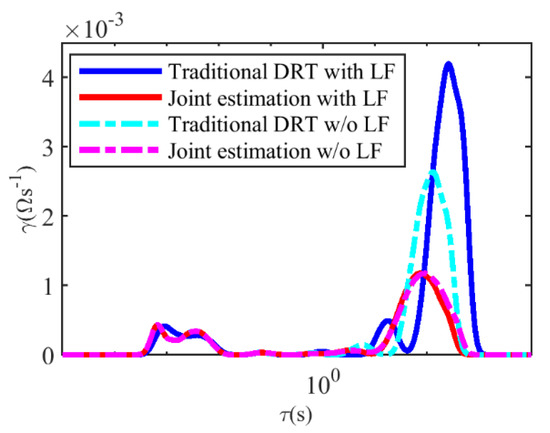
Figure 5.
Joint estimation method compared with the traditional DRT method.
Figure 6 shows the results of the CDC estimated by the joint estimation method (red crosses) and the ICA curves (blue lines). Here, the CDC values estimated by the joint estimation method are compared with CIC values obtained by ICA at the corresponding voltage according to Equation (2), as the traditional DRT method cannot provide the CDC. The estimation CDC values are close to the CIC values at the corresponding voltage, indicating that the joint estimation method exhibits adequate accuracy. The relative errors of the CDC and CIC values are shown in Figure 7. The relative errors are below 10% except for the individual points, indicating the method’s sufficient accuracy.
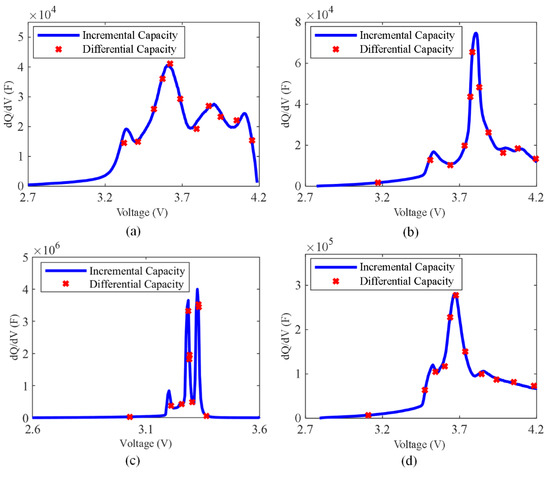
Figure 6.
Identification results of the differential capacity CDC compared with ICA for (a) Cell A; (b) Cell B; (c) Cell C; and (d) Cell D.
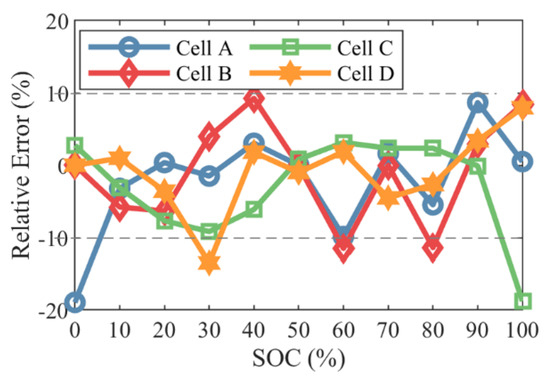
Figure 7.
Relative errors between CDCs and CICs.
4.2. SOH Evaluation Based on the Relationship between the CDC and the Cell Capacity
The CDC values of the aging D-type cells were estimated (Table 6). The red crosses shown in Figure 8 are the estimated CDC values at different cell capacities. The relationship between CDC and the cell capacity can be described by Equation (9):
where Q is the capacity of the cell; a1, a2, b1, and b2 are fitting coefficients. In this paper, cftool provided by MATLAB is utilized for the fast parameter identification of Equation (9) as it can realize many types of linear and nonlinear curve fitting. The nonlinear least square (NLR) method is set, and the Levenberg-Marquardt algorithm is adopted to identify the fitting coefficients. The values of the fitting coefficients are listed in Table 7 for the D-type cells. The blue line shown in Figure 8 is the fitting curve of the CDC values described by Equation (9), which provides an accurate fit. Subsequently, the SOH can be evaluated by combining Equations (8) and (9):
Table 6.
Differential capacity CDC of the aging D-type cells.
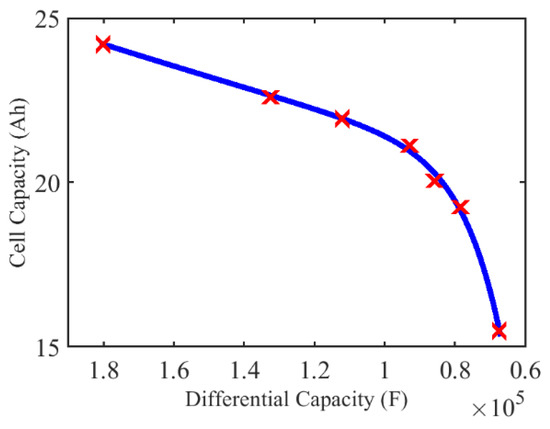
Figure 8.
Relationship between CDC and cell capacity.
Table 7.
Fitting coefficients of the aging D-type cells.
The estimated SOH of the aging D-type cells given by Equation (10) and the relative errors between the real SOH and the estimated SOH are given in Table 8. These results show that the demonstrated SOH evaluation method exhibits adequate accuracy along the whole life cycle of the cells.
Table 8.
SOH evaluation results of the aging D-type cells.
Hence, the SOH of batteries of the same type can be evaluated only by EIS at a specific potential when a1, a2, b1 and b2 are obtained. It is worth noting that this study chose 3.68 V as the measured equilibrium potential for EIS, simply because the highest peak of the ICA is located at approximately 3.68 V. One can select this equilibrium potential arbitrarily as long as its corresponding ICA value changes with the aging of the battery. If the measured equilibrium potential for EIS changes, the fitting coefficients of Equation (9) will change, but the structure of Equation (9) will not.
The EIS based SOH evaluation method is more efficient compared with the ICA based SOH evaluation method, which only needs impedance spectra rather than charging/discharging data of the battery.
5. Conclusions
The present work proposed a joint estimation method to estimate the differential capacity CDC and the DRT simultaneously based on the EIS of lithium-ion batteries. Four types of commercially available lithium-ion batteries were tested to evaluate the joint estimation method and to verify the equivalence. Experimental data showed that the proposed joint estimation method outperforms the traditional method in the estimation of the CDC. Moreover, the estimated CDC values are consistent with the CIC values obtained by ICA. Key points of this study are summarized as follows:
- (1)
- A joint estimation method with Tikhonov regularization is proposed to simultaneously estimate the differential capacity CDC and the DRT with the aim of minimizing the estimation errors and to obtain more information about the diffusion processes by EIS.
- (2)
- The equivalence of the differential capacity CDC and the incremental capacity CIC was shown.
- (3)
- An efficient state-of-health (SOH) evaluation method is demonstrated based on the relationship between the CDC and the cell capacity.
The proposed joint estimation method can provide an intuitive understanding of the capacitive characteristics of lithium-ion batteries and can be used for SOH evaluation. Further research is being conducted to estimate the differential capacity CDC from time-domain data for online applications.
Author Contributions
Conceptualization, G.Y. and X.F.; Data curation, M.Y. and X.H.; Investigation, D.G.; Methodology, D.G. and X.H.; Project administration, G.Y. and X.F.; Resources, G.Z.; Supervision, M.O.; Validation, L.L.; Writing-original draft, D.G.; Writing-review & editing, X.F. All authors have read and agreed to the published version of the manuscript.
Funding
This work was supported by the Ministry of Science and Technology of China [Grant No. 2016YFE0102200]; the National Key R&D Program of China [Grant No. 2016YFB0900302]; the National Natural Science Foundation of China [Grant No. 51706117 and U1564205]; the Science Program of State Grid Corporation of China [Grant No. 521702180003].
Conflicts of Interest
The authors declare no conflict of interest.
Nomenclature
| A′ | approximation matrix of the DRT for the real part of the EIS |
| A″ | approximation matrix of the DRT for the imaginary part of the EIS |
| a, b | fitting coefficient of CDC and Q |
| CDC | differential capacity |
| CIC | incremental capacity |
| g | distribution of the polarization resistance |
| j | imaginary unit |
| J | modified Tikhonov regularization function |
| current response | |
| M | regularization matrix |
| Q | capacity of the cell |
| actual capacity of the present condition | |
| nominal capacity of the cell | |
| ohmic resistance | |
| polarization resistance | |
| voltage excitation | |
| x | vector of the parameter for DRT approximation |
| impedance model of the DRT | |
| DRT model considering differential capacity | |
| experimental data of the EIS | |
| real part of the experimental data | |
| imaginary part of the experimental data | |
| 1 | column vector with n entries all equal to 1 |
| λ | regularization coefficient |
| characteristic time constants | |
| angular frequency | |
| frequency matrix of the DRT |
Abbreviations
| DDC | distribution function of the differential capacity |
| DDT | distribution of the diffusion times |
| DIA | differential impedance analysis |
| DRT | distribution of the relaxation times |
| ECM | equivalent-circuit model |
| EIS | electrochemical impedance spectroscopy |
| FS | full-scale |
| ICA | incremental capacity analysis |
| LFP | LiFePO4 |
| LMO | LiMn2O4 |
| NCM | LiNixCoyMnzO2 |
| OCV | open-circuit voltage |
| probability density function | |
| PHM | prognostics and health management |
| RC | resistor-capacitor |
| SOC | state of charge |
| SOFC | solid oxide fuel cell |
| SOH | state-of-health |
Appendix A
The theoretical solution of the CDC is:
Equation (A1) can be written as Equation (A2) applying certain mathematical transformations:
Then, the limit of the first term in Equation (A2) can be found as:
Equation (A3) can be simplified to Equation (A4) by substituting , which is the Laplace Transformation of the Unit Step Function 1(t):
The limits of the second and third terms in Equation (A2) are zero:
In conclusion, Equation (A2) can be approximated as:
which is equivalent to the incremental capacity CIC.
References
- Andre, D.; Meiler, M.; Steiner, K.; Wimmer, C.; Soczka-Guth, T.; Sauer, D. Characterization of high-power lithium-ion batteries by electrochemical impedance spectroscopy. I. Experimental investigation. J. Power Sources 2011, 196, 5334–5341. [Google Scholar] [CrossRef]
- Andre, D.; Meiler, M.; Steiner, K.; Walz, H.; Soczka-Guth, T.; Sauer, D. Characterization of high-power lithium-ion batteries by electrochemical impedance spectroscopy. II: Modelling. J. Power Sources 2011, 196, 5349–5356. [Google Scholar] [CrossRef]
- Nara, H.; Mukoyama, D.; Shimizu, R.; Momma, T.; Osaka, T. Systematic analysis of interfacial resistance between the cathode layer and the current collector in lithium-ion batteries by electrochemical impedance spectroscopy. J. Power Sources 2019, 409, 139–147. [Google Scholar] [CrossRef]
- Gruet, D.; Delobel, B.; Sicsic, D.; Lucas, I.T.; Vivier, V. On the electrochemical impedance response of composite insertion electrodes–Toward a better understanding of porous electrodes. Electrochim. Acta 2019, 295, 787–800. [Google Scholar] [CrossRef]
- Li, W.; Huang, Q.-A.; Yang, C.; Chen, J.; Tang, Z.; Zhang, F.; Li, A.; Zhang, L.; Zhang, J. A fast measurement of Warburg-like impedance spectra with Morlet wavelet transform for electrochemical energy devices. Electrochim. Acta 2019, 322, 134760. [Google Scholar] [CrossRef]
- Rodríguez, A.; Plett, G.L.; Trimboli, M.S. Comparing four model-order reduction techniques, applied to lithium-ion battery-cell internal electrochemical transfer functions. eTransportation 2019, 1, 100009. [Google Scholar] [CrossRef]
- Schichlein, H.; Müller, A.C.; Voigts, M.; Krügel, A.; Ivers-Tiffée, E. Deconvolution of electrochemical impedance spectra for the identification of electrode reaction mechanisms in solid oxide fuel cells. J. Appl. Electrochem. 2002, 32, 875–882. [Google Scholar] [CrossRef]
- Klotz, D.; Schmidt, J.P.; Kromp, A.; Weber, A.; Ivers-Tiffée, E. The distribution of relaxation times as beneficial tool for equivalent circuit modeling of fuel cells and batteries. ECS Trans. 2012, 41, 25–33. [Google Scholar]
- Oz, A.; Hershkovitz, S.; Belman, N.; Tal-Gutelmacher, E.; Tsur, Y. Analysis of impedance spectroscopy of aqueous supercapacitors by evolutionary programming: Finding DFRT from complex capacitance. Solid State Ionics 2016, 288, 311–314. [Google Scholar] [CrossRef]
- Helseth, L. Modelling supercapacitors using a dynamic equivalent circuit with a distribution of relaxation times. J. Energy Storage 2019, 25, 100912. [Google Scholar] [CrossRef]
- Illig, J.; Ender, M.; Chrobak, T.; Schmidt, J.P.; Klotz, D.; Ivers-Tiffée, E. Separation of charge transfer and contact resistance in LiFePO4-cathodes by impedance modeling. J. Electrochem. Soc. 2012, 159, A952–A960. [Google Scholar] [CrossRef]
- Illig, J.; Schmidt, J.P.; Weiss, M.; Weber, A.; Ivers-Tiffée, E. Understanding the impedance spectrum of 18650 LiFePO4-cells. J. Power Sources 2013, 239, 670–679. [Google Scholar] [CrossRef]
- Sabet, P.S.; Sauer, D.U. Separation of predominant processes in electrochemical impedance spectra of lithium-ion batteries with nickelmanganesecobalt cathodes. J. Power Sources 2019, 425, 121–129. [Google Scholar] [CrossRef]
- Rahbari, O.; Omar, N.; Van Mierlo, J.; A Rosen, M.; Coosemans, T.; Berecibar, M. Electric Vehicle Battery Lifetime Extension through an Intelligent Double-Layer Control Scheme. Energies 2019, 12, 1525. [Google Scholar] [CrossRef]
- Waag, W.; Käbitz, S.; Sauer, D.U. Experimental investigation of the lithium-ion battery impedance characteristic at various conditions and aging states and its influence on the application. Appl. Energy 2013, 102, 885–897. [Google Scholar] [CrossRef]
- Spinner, N.S.; Love, C.T.; Rose-Pehrsson, S.L.; Tuttle, S.G. Expanding the operational limits of the single-point impedance diagnostic for internal temperature monitoring of lithium-ion batteries. Electrochim. Acta 2015, 174, 488–493. [Google Scholar] [CrossRef]
- Gordon, I.A.J.; Grugeon, S.; Takenouti, H.; Tribollet, B.; Armand, M.; Davoisne, C.; Débart, A.; Laruelle, S. Electrochemical Impedance Spectroscopy response study of a commercial graphite-based negative electrode for Li-ion batteries as function of the cell state of charge and ageing. Electrochim. Acta 2017, 223, 63–73. [Google Scholar] [CrossRef]
- Van Nguyen, D.; Limmer, S.; Yang, K.; Olhofer, M.; Bäck, T. Modeling and Prediction of Remaining Useful Lifetime for Maintenance Scheduling Optimization of a Car Fleet. Int. J. Perform. Eng. 2019, 15, 2318–2328. [Google Scholar]
- Limmer, S. Evaluation of Optimization-Based EV Charging Scheduling with Load Limit in a Realistic Scenario. Energies 2019, 12, 4730. [Google Scholar] [CrossRef]
- Schoenleber, M.; Ivers-Tiffée, E. Approximability of impedance spectra by RC elements and implications for impedance analysis. Electrochem. Commun. 2015, 58, 15–19. [Google Scholar] [CrossRef]
- Gantenbein, S.; Weiss, M.; Ivers-Tiffée, E. Impedance based time-domain modeling of lithium-ion batteries: Part I. J. Power Sources 2018, 379, 317–327. [Google Scholar] [CrossRef]
- Wang, X.; Wei, X.; Dai, H. Estimation of state of health of lithium-ion batteries based on charge transfer resistance considering different temperature and state of charge. J. Energy Storage 2019, 21, 618–631. [Google Scholar] [CrossRef]
- Collin, R.; Miao, Y.; Yokochi, A.; Enjeti, P.; von Jouanne, A. Advanced Electric Vehicle Fast-Charging Technologies. Energies 2019, 12, 1839. [Google Scholar] [CrossRef]
- Pastor-Fernández, C.; Uddin, K.; Chouchelamane, G.H.; Widanage, W.D.; Marco, J. A Comparison between Electrochemical Impedance Spectroscopy and Incremental Capacity-Differential Voltage as Li-ion Diagnostic Techniques to Identify and Quantify the Effects of Degradation Modes within Battery Management Systems. J. Power Sources 2017, 360, 301–318. [Google Scholar] [CrossRef]
- Sun, B.; Bian, J.; Ruan, H.; Zhang, W.; Ren, P.; Cong, X. Modeling Study for Li-ion Batteries Considering High-frequency Inductance Characteristics Based on Electrochemical Impedance Spectroscopy. DEStech Trans. Environ. Energy Earth Sci. 2018. [Google Scholar] [CrossRef]
- Cheng, C.-S.; Chung, H.S.-H.; Lau, R.W.-H.; Hong, K.Y.-W. Experimental Assessment and Stability Analysis of a Discrete-Time Battery Model with Multiple Constant Phase Elements. In Proceedings of the 2019 IEEE Applied Power Electronics Conference and Exposition (APEC), Anaheim, CA, USA, 17–21 March 2019; pp. 1090–1097. [Google Scholar]
- Tomaszewska, A.; Chu, Z.; Feng, X.; O’Kane, S.; Liu, X.; Chen, J.; Ji, C.; Endler, E.; Li, R.; Liu, L. Lithium-ion battery fast charging: A review. eTransportation 2019, 1, 100011. [Google Scholar] [CrossRef]
- Schmidt, J.P.; Chrobak, T.; Ender, M.; Illig, J.; Klotz, D.; Ivers-Tiffée, E. Studies on LiFePO4 as cathode material using impedance spectroscopy. J. Power Sources 2011, 196, 5342–5348. [Google Scholar] [CrossRef]
- Wan, T.H.; Saccoccio, M.; Chen, C.; Ciucci, F. Influence of the discretization methods on the distribution of relaxation times deconvolution: Implementing radial basis functions with DRTtools. Electrochim. Acta 2015, 184, 483–499. [Google Scholar] [CrossRef]
- Sabet, P.S.; Stahl, G.; Sauer, D.U. Non-invasive investigation of predominant processes in the impedance spectra of high energy lithium-ion batteries with Nickel-Cobalt-Aluminum cathodes. J. Power Sources 2018, 406, 185–193. [Google Scholar] [CrossRef]
- Zhou, X.; Pan, Z.; Han, X.; Lu, L.; Ouyang, M. An easy-to-implement multi-point impedance technique for monitoring aging of lithium ion batteries. J. Power Sources 2018, 417, 188–192. [Google Scholar] [CrossRef]
- Zhou, X.; Huang, J.; Pan, Z.; Ouyang, M. Impedance characterization of lithium-ion batteries aging under high-temperature cycling: Importance of electrolyte-phase diffusion. J. Power Sources 2019, 426, 216–222. [Google Scholar] [CrossRef]
- Boukamp, B.A. Derivation of a Distribution Function of Relaxation Times for the (fractal) Finite Length Warburg. Electrochim. Acta 2017, 252, 154–163. [Google Scholar] [CrossRef]
- Malkow, K.T. A theory of distribution functions of relaxation times for the deconvolution of immittance data. J. Electroanal. Chem. 2019, 838, 221–231. [Google Scholar] [CrossRef]
- Schmidt, J.P.; Berg, P.; Schönleber, M.; Weber, A.; Ivers-Tiffée, E. The distribution of relaxation times as basis for generalized time-domain models for Li-ion batteries. J. Power Sources 2013, 221, 70–77. [Google Scholar] [CrossRef]
- Schichlein, H.; Feuerstein, M.; Müller, A.; Weber, A.; Krügel, A.; Ivers-Tiffée, E. System identification: A new modelling approach for SOFC single cells. ECS Proc. Vol. 1999, 1999, 1069–1077. [Google Scholar] [CrossRef]
- Oldenburger, M.; Bedürftig, B.; Gruhle, A.; Grimsmann, F.; Richter, E.; Findeisen, R.; Hintennach, A. Investigation of the low frequency Warburg impedance of Li-ion cells by frequency domain measurements. J. Energy Storage 2019, 21, 272–280. [Google Scholar] [CrossRef]
- Ciucci, F. Modeling Electrochemical Impedance Spectroscopy. Curr. Opin. Electrochem. 2018, 13, 132–139. [Google Scholar] [CrossRef]
- Schönleber, M.; Ivers-Tiffée, E. The Distribution Function of Differential Capacity as a new tool for analyzing the capacitive properties of Lithium-Ion batteries. Electrochem. Commun. 2015, 61, 45–48. [Google Scholar] [CrossRef]
- Song, J.; Bazant, M.Z. Electrochemical impedance imaging via the distribution of diffusion times. Phys. Rev. Lett. 2018, 120, 116001. [Google Scholar] [CrossRef]
- Vladikova, D.; Stoynov, Z. Secondary differential impedance analysis–a tool for recognition of CPE behavior. J. Electroanal. Chem. 2004, 572, 377–387. [Google Scholar] [CrossRef]
- Vladikova, D.; Kilner, J.; Skinner, S.; Raikova, G.; Stoynov, Z. Differential impedance analysis of single crystal and polycrystalline yttria stabilized zirconia. Electrochim. Acta 2006, 51, 1611–1621. [Google Scholar] [CrossRef]
- Dubarry, M.; Svoboda, V.; Hwu, R.; Liaw, B.Y. Incremental capacity analysis and close-to-equilibrium OCV measurements to quantify capacity fade in commercial rechargeable lithium batteries. Electrochem. solid. State. Lett. 2006, 9, A454–A457. [Google Scholar] [CrossRef]
- Feng, X.; Li, J.; Ouyang, M.; Lu, L.; Li, J.; He, X. Using probability density function to evaluate the state of health of lithium-ion batteries. J. Power Sources 2013, 232, 209–218. [Google Scholar] [CrossRef]
- Saccoccio, M.; Wan, T.H.; Chen, C.; Ciucci, F. Optimal regularization in distribution of relaxation times applied to electrochemical impedance spectroscopy: Ridge and Lasso regression methods-A theoretical and experimental Study. Electrochim. Acta 2014, 147, 470–482. [Google Scholar] [CrossRef]
- Ciucci, F.; Chen, C. Analysis of electrochemical impedance spectroscopy data using the distribution of relaxation times: A Bayesian and hierarchical Bayesian approach. Electrochim. Acta 2015, 167, 439–454. [Google Scholar] [CrossRef]
- Han, X.; Lu, L.; Zheng, Y.; Feng, X.; Li, Z.; Li, J.; Ouyang, M. A review on the key issues of the lithium ion battery degradation among the whole life cycle. eTransportation 2019, 1, 100005. [Google Scholar] [CrossRef]
- Tian, J.; Xiong, R.; Shen, W. A review on state of health estimation for lithium ion batteries in photovoltaic systems. eTransportation 2019, 2, 100028. [Google Scholar] [CrossRef]
- Zhang, Y.; Xiong, R.; He, H.; Qu, X.; Pecht, M. Aging characteristics-based health diagnosis and remaining useful life prognostics for lithium-ion batteries. eTransportation 2019, 1, 100004. [Google Scholar] [CrossRef]
- Ren, D.; Hsu, H.; Li, R.; Feng, X.; Guo, D.; Han, X.; Lu, L.; He, X.; Gao, S.; Hou, J.; et al. A comparative investigation of aging effects on thermal runaway behavior of lithium-ion batteries. eTransportation 2019, 2, 100034. [Google Scholar] [CrossRef]
- Ali, M.U.; Zafar, A.; Nengroo, S.H.; Hussain, S.; Park, G.-S.; Kim, H.-J. Online Remaining Useful Life Prediction for Lithium-Ion Batteries Using Partial Discharge Data Features. Energies 2019, 12, 4366. [Google Scholar] [CrossRef]


© 2020 by the authors. Licensee MDPI, Basel, Switzerland. This article is an open access article distributed under the terms and conditions of the Creative Commons Attribution (CC BY) license (http://creativecommons.org/licenses/by/4.0/).