Abstract
The article presents the methodology of conducting serial laboratory measurements of thermal conductivity of recompacted samples of cohesive and non-cohesive soils. The presented research procedure has been developed for the purpose of supplementing the Engineering–Geology Database and its part–Physical and Mechanical Properties of Soils and Rocks (abbr. BDGI-WFM) with a new component regarding thermal properties of soils. The data contained in BDGI-WFM are the basis for the development of maps and plans for the assessment of geothermal potential and support for the sustainable development of low enthalpy geothermal energy. Effective thermal conductivity of soils was studied at various levels of water saturation and various degrees of compaction. Cohesive soils were tested in initial moisture content and after drying to a constant mass. Non-cohesive soils were tested in initial moisture, fully saturated with water and after drying to a constant mass. Effective thermal conductivity of non-cohesive soils was determined on samples mechanically compacted to the literature values of bulk density. Basic physical parameters were determined for each of the samples. In total, 120 measurements of thermal conductivity were carried out, for the purposes of developing the guidelines which allowed statistical analysis of the results. The results were cross-checked with different measuring equipment and with the literature data.
1. Introduction
Thermal conductivity coefficient values of soil are useful in many subjects connected with energetics. Dynamic development of renewable energy sources and increasing awareness of necessity to reduce the use of fossil fuels are main trends that drive rising interest on thermal parameters of soil and rocks. Recognition of soil’s thermal properties and parameters is essential when it comes to proper designing and building installations that use geothermal heat for energetics purposes, e.g., ground source heat pumps, [1,2,3]. At the same time, incorporating into the buildings thermally active construction elements that use thermal potential of a soil–rock medium and exchange heat between the ground and building is getting more and more popular. Few examples of those constructions are thermoactive foundations, foundation piles or tunnel walls [4,5,6].
Thermal properties of soil play key role also in determining possibilities of heat transfer in case of underground transmission infrastructure like high-voltage cables or district heating systems [7] as well as in terms of radioactive waste storage [8].
In this article authors present a developed version of quick and efficient methodology that allows conducting serial measurements of thermal properties of cohesive and non-cohesive soil. The methodology was formulated in Polish Geological Institute–National Research Institute (PGI-NRI) Soil and the Rock Testing Centre and presented in VI Polish Nationwide Geothermal Congress [9].
The Soil and Rock Testing Centre performs a number of tests of physical and mechanical parameters of different types of soil. Analyses are conducted in compliance with polish and international geotechnical standards [10,11,12,13,14,15,16,17,18,19,20]. Results of the tests performed for the purposes of tasks that fall into the scope of Polish Geological Survey activities, including the Engineering–Geological Database (BDGI), become a part of BDGI-WFM (physical and mechanical properties) component, that gathers information about soil and rocks tested in the laboratory.
Rising interest in ground heat pumps forces the need to recognize thermal parameters of soil and rocks. Current trends together with poor amount of information available in literature determine the need to develop a methodology that allows to make large amount of valid, repetitive tests in the shortest possible time. The presented methodology can find its use in Engineering–Geological and geotechnical laboratories. Thermal parameters presented in this paper were acquired with non-steady-state (transient) method with the use of thermal needle (hot wire method). During preparing the methodology, in order to verify the results, samples were also tested with transient plane source (hot disk) method, which also draw upon the non-steady-state (transient) method.
In 2014–2017, “Engineering–Geological database of physical and mechanical parameters of main soil and rocks lithotypes in Poland in terms of regional criterion (BDGI-WFM)” project was completed. The Engineering–Geological Database (BDGI) contains over 404,000 boreholes, including:
- A total of 308,120 boreholes located in areas of the Engineering–Geological Atlases (16 Polish urban agglomeration areas);
- A total of 19,860 boreholes all over the country (outside the Atlases area), introduced from the geological and geotechnical reports created since 2013;
- Over 76,020 boreholes from Warsaw in the form of Geotechnical Excavation Cards.
As a part of the project an Engineering–Geological Database that gathers data of physical and mechanical parameters of soil and rocks in Poland was established. BDGI-WFM contains information about location and contractor of the borehole/outcrop, timestamp and number of collected samples, their sampling category and measured parameters together with applied categorization standards. BDGI-WFM database is an integral part of Engineering–Geological Database (BDGI) and therefore can be updated on an ongoing basis using data from studies made for BDGI purposes. As part of the BDGI-WFM task, the following records were entered into the database:
- A total of 65,834 physical and mechanical parameters of soils;
- A total of 100 physical and mechanical parameters of rocks [21].
In 2018–2021, BDGI-WFM will be further extended by 120,000 parameters—the results of physical and mechanical laboratory tests—and enriched in the thermal properties of soil and rocks [22,23]. The thermal parameter data of soil and rocks gathered in databases like BDGI-WFM will be the basis for constructing geothermal 3D models and for low-temperature geothermal potential mapping [24].
2. Materials and Methods
2.1. Measurement Theoretical Background
Heat conduction (thermal conduction) is a physical phenomenon which involves the transfer of energy between adjacent molecules and electrons in the conducting medium. Energy is transported from places with a higher temperature to places with a lower temperature. In gases and liquids, energy is transferred mainly through inert collisions of molecules. In solids, transport occurs with the participation of free electrons and as a result of vibrations of the atoms of the crystal lattice of the medium [25,26]. Thermal conduction has been described by Fourier’s law—the heat transfer in medium is proportional to the temperature gradient measured along the heat flow direction (1D). The mathematical equation takes the form:
where:
–local heat flux density (W·m−2),
–material’s conductivity (W·m−1·K−1),
temperature gradient along the direction of heat flow (K·m−1).
Fourier’s law applies in all states of matter, both for heat flow in steady state conditions (when the temperature difference(s) driving the conduction are constant) and heat flow in transient conditions (when the temperature changes in time during transfer period). In the first case, both the temperature and the heat flux density are functions of coordinates only (∂T, ∂x), in the second case both these values additionally depend on time.
The principle of thermal conductivity measurement in the steady state condition is to determine the heat flux Q migrating through the sample with known dimensions and to measure the temperature drop in the boundary of the sample with isothermal surfaces. The measurement under steady-state heat conduction is a relatively labor-intensive and time consuming process. The methodology uses complex control and regulation systems of the test stand. It is necessary to ensure perfect contact of the sample surface with the surfaces of the heater and cooler. In addition, proper thermal insulation of the other sample surfaces should be ensured. A constant value of the heat flow and a constant temperature of the sample-heater/cooler contact surface has to be preserved. Time period required to achieve steady state heat exchange in the sample (and thus to make measurements) is relatively long. The advantage of the thermal conductivity measurement under steady state conditions is the simplicity of the calculation formulas [27]. A steady-state heat flow is described by the equation:
–heat flow (W),
–cross-sectional area through which heat flows (m2).
Measurement methods used to calculate thermal conductivity of a medium in a transient condition are based on the determination of the relationship between the density of the constant heat flux (emitted from a steady heat source) and the temperature changes over the time under non-steady energy flow through the tested material. Heat transfer under non-steady state conditions is described by the equation:
–volumetric heat capacity (J·m−3·K−1),
–time (s).
For an isotropic medium, heat transport by conduction in one-dimensional space is described by the equation:
where (m2·s−1) is the ratio of the medium’s thermal conductivity to its volumetric heat capacity (thermal diffusivity):
Measurement methods based on non-steady state are characterized by much faster test performance than steady state methods, are more versatile and easy to perform and characterized by relatively high measurement accuracy [27]. The presented methodology involves measurement of soil effective thermal conductivity in transient conditions by the thermal needle method.
Thermal needle method, also called the hot wire method, consists placing in tested sample a probe with a specific electrical resistance through which direct current of known intensity flows. Electric current flow increases temperature of the probe, which becomes a linear source of heat inside the sample. Heat flux generated during the test is constant. Measurement is carried out indirectly by determining heating rate of the tested sample [27]. As a result, it is possible to determine the increase or decrease of the temperature in the medium. Mathematical solution to the problem, based on the assumption of an infinitely long and infinitely thin heat source, was proposed by Carslaw and Jaeger [28]:
–time from the beginning of heating (s),
–temperature rise since the beginning of heating (K),
–heat rate per unit of length (W·m−1),
–radial distance from the line source (m),
–thermal diffusivity (m2·s−1),
–thermal conductivity (W·m−1·K−1),
–exponential integral,
–heating time.
Exponential integral , is defined by the series of expansion:
where is Euler’s constant (0.5772156649)
ASTM D5334-14 and IEEE Standards 442-2017 international thermal conductivity measurement standards suggest determination of thermal conductivity based on temperature data recorded for heating phase [19,20]. Interpretation method is based on the assumption that for a long measurement time , when is low and is high, conditions outside in the series become negligibly small. Due to such assumptions, the equation can be presented as:
where is a calibration constant. Therefore, when performing the interpretation proposed by ASTM D5334-14, the obtained results should be applied as a function of time on the logarithmic curve diagram. Finally, the thermal conductivity is calculated using the slope of the function:
In fact, non-steady state thermal conductivity measurement never meets the assumptions made. Soil medium is not isotropic, the heat source is not infinitely long or thin, ambient temperature is never perfectly stable during the test—temperature drift always occurs. However, the authors have chosen this method because it is easier and much faster to perform than steady state methods, as well as because of its versatility and relatively high measurement accuracy as it was mentioned before.
2.2. Measuring Equipment
Portable, battery-operated KD2 Pro Thermal Properties Analyzer with TR-1 sensor was utilized to measure thermal conductivity of the samples. Large, single needle TR-1 sensor (2.4 mm diameter × 100 mm long) was chosen to perform the tests as the producer recommends it for soil and other granular materials [29]. Measuring range for thermal conductivity of TR-1 sensor lies between 0.10 and 4.00 W·m−1·K−1. Accuracy of the sensor is ± 10% from 0.2–4 W·m−1·K−1 and ± 0.02 W·m−1·K−1 from 0.1–0.2 W·m−1·K−1.
TK04 Thermal Conductivity Meter with disc-shaped probe for plane surfaces (Standard HLQ probe) was used to validate the results obtained with KD2 Pro Analyzer.
2.3. Auxiliary Equipment
- Stainless steel cylinder with a tapping fork that is used to determine non-cohesive soil bulk density was utilized to form sand samples for thermal conductivity analyses;
- Metal form with a rammer, that were utilized for molding cohesive soil samples;
- Knife with a straight edge was used to even samples surface to the level of upper edge of the mold;
- Laboratory thermometer to monitor environment temperature during measurements.
Measuring and auxiliary equipment is shown in Figure 1.
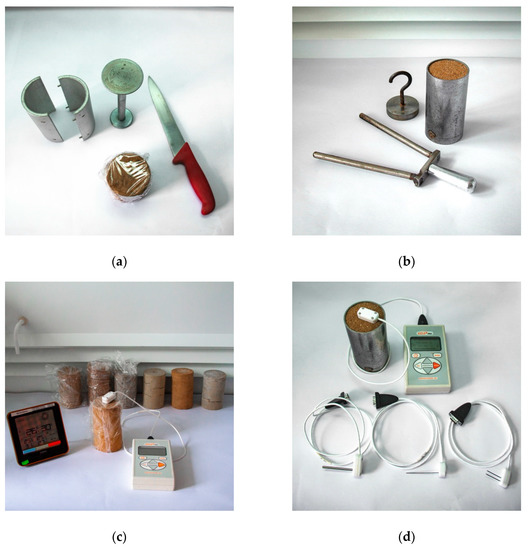
Figure 1.
Equipment for laboratory testing of thermal conductivity of soil: (a) Metal mold to form cylindrical samples of cohesive soil with a knife and rammer; (b) Steel cylinder with tapping fork that is used to form non-cohesive soil samples; (c) Molded cohesive soil samples during analysis; (d) A set of exchangeable thermal needle probes with KD2 Pro Thermal Properties Analyzer.
2.4. Samples Used in the Testing Procedure
For the purposes of collecting data for BDGI-WFM two sorts of samples are utilized: undisturbed (1st quality class of soil sample) and disturbed (3rd quality class of soil sample) according to EN 1997-2 Eurocode 7 [10].
Undisturbed samples are collected in a way that allows preserving their natural structure as well as full range of the soil’s physical and mechanical features (A sampling category). Undisturbed samples truly represent in situ soil layer in terms of its properties. In case of undisturbed soil samples, measurement of thermal conductivity can be carried out without any additional preparation of the probe.
Disturbed samples (B category soil sampling) are most commonly used in laboratory testing procedures. Natural water content and particle size distribution remain unchanged, but the structure of the soil is damaged or modified during the sampling operation. Therefore, to obtain valid results of thermal conductivity, test molding of disturbed samples is required.
Depending on the sample quality class the process of sample preparation is carried out different way (Figure 2).
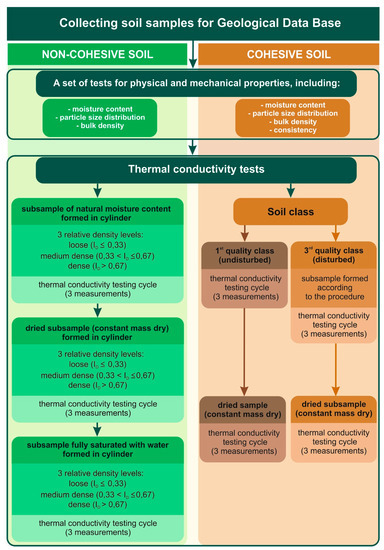
Figure 2.
Scheme of effective thermal conductivity measurements in PGI-NRI. ID stands for the density index.
A set of three thermal conductivity measurements is performed on each sample. This kind of testing cycle allows the identification of invalid thermal conductivity values and enables carrying out statistical interpretation of the results.
Consecutive results should not differ more than 10%, otherwise they are not being taken into consideration.
In order to characterize physical properties of examined soil and to identify their possible influence on acquired results of thermal conductivity coefficient authors recommend performing undermentioned supplementary analyses:
- -
- determination of water content,
- -
- determination of particle size distribution,
- -
- determination of bulk density for cohesive soils and relative density for non-cohesive soils,
- -
- determination of liquid and plastic limits.
The authors recommend those tests to be performed according to international geotechnical standards, for example ISO 17892: Geotechnical investigation and testing—Laboratory testing of soil [13,14,15,17].
Please note that to conduct additional tests sampling properly, larger amounts of soil will be required.
2.5. Sample Preparation
Minimum mass required to perform the analysis according to proposed procedure should stand 1500 g and 1000 g minimum for cohesive and non-cohesive soil respectively. Cohesive soils should be examined in two conditions: wet (in their natural moisture content) and after drying to a constant mass. Non-cohesive soils should also be tested in three cases: initial water content, dried to a constant mass and fully saturated with water.
Because in case of cohesive soils thermal conductivity tests are performed on the samples with natural water content, all cohesive soil samples should always be hermetically packed (three layers of plastic zip-lock bags recommended) directly after sampling and stored in the refrigerator to prevent the loss of water content.
Container for sample preparation should be made of stiff and rust-resisting material (e.g., stainless steel). Container dimensions should make at least 5 to 12 cm.
Prepared samples should be placed in the examination room at least 24 h before starting the test so that the equilibrium between specimen and environment temperature is reached. It is recommended to keep the environment temperature as stable as it is possible. There should be no intensive air flows or humidity changes during the test as it is proven that this kind of fluctuations in environmental conditions can affect the results [29]. During the examination, wet samples should be protected from changes in moisture content by covering with stretch wrap. Temperature and humidity level should be registered during the test.
2.6. Preparation of Cohesive Soil Samples
2.6.1. Samples with Natural Water Content
To prepare cohesive soils samples cylindrical mold made of stainless steel is being used (Figure 1a). Small lumps of soil are placed inside the form with layers and firmed to desired density with a metal rammer. The soil is then rammed to the point in which it will reach bulk density specific for the soil of the same water content in situ [30]. When the soil sample reaches the level of the upper ridge of the container, it is cut with a straight edge knife. Cutting is done from the center of the sample towards its rims. Molded sample is then removed from the form carefully, without intruding its previously molded structure. Please note, that the test can be also conducted directly in the sample container, which can be particularly useful in case of the soils of very soft consistency.
2.6.2. Dry Samples
Molded cohesive soil samples are placed in evaporating dish and dried to a constant mass in the laboratory drying oven for 72 h minimum. The drying oven used in this procedure should be capable of maintaining a temperature of 105 °C ± 5 °C [17]. When the sample reaches constant mass dry state, a hole is drilled longwise the sample, so that inserting thermal needle is possible. The drill should reach both sides of the sample [19]. The diameter of the drill should be as similar to the diameter of a needle probe used in the test (2.4 mm for TR-1 probe) as it is possible. Once drilled, the hole should be cleaned of the dust and filled with thermal grease to ensure good thermal contact between the sensor and tested soil.
2.7. Preparation of Non-cohesive Soil Samples
2.7.1. Samples with Natural Water Content
The principles of tapping fork test method that is used for determining the bulk density of non-cohesive soils was the base for developing the way of preparing non-cohesive soil samples for the purposes of this methodology. The soil’s bulk density is determined by placing it in a metal cylinder of a specified dimensions and compacting the soil by putting it into vibrations with a metal tapping fork (Figure 1b). The compaction procedure is fully described in polish geotechnical investigation standard PN-B-04481:1988 [18].
According to the fore mentioned standard, non-cohesive soils are prepared in a stainless steel, flat-bottom cylinder. The cylinder is slowly filled with examined soil by using a laboratory funnel. The funnel should at first be leaned on the cylinder’s bottom and as the cylinder was filled the funnel should be slowly elevated to let the soil form thin layers and therefore avoid closing air between soils particles. When the sample container is full, the specimen should be even with straight edge knife to the level of the upper rim of the cylinder. The cylinder is then topped with a steel ring on the surface of the soil and the soil is compacted to a desired bulk density by striking the sides of a cylinder with metal tapping fork. Water content is measured after finishing the compaction process.
2.7.2. Dry Samples
The sample should be dried to a constant mass in the laboratory drying oven for at least 12 h. The drying oven should be capable of maintaining a temperature of 105 °C ± 5 °C [17]. After drying, the specimen is gently grinded in a mortar to get rid of the aggregates that might have formed in the drying process. The authors recommend using rubber-headed pestle to grind the soil to avoid crushing the grains. Again, the soil is placed in the cylinder with a funnel. After filling the cylinder, the specimen’s surface is cut with a straight edge knife to the level of the upper rim of the cylinder and compacted to desired bulk density as it is described in the Section 2.7.1.
2.7.3. Samples Fully Saturated with Water
To prepare non-cohesive soil samples fully saturated with water, first the water is poured to the cylinder to approximately 1/4 of its total volume. The soil is then evenly placed in the cylinder using a funnel. During the filling, water is gradually added in order to keep the specimen fully saturated. Whole sample volume should all the time be kept under the water level. The specimen is cut to the level of the upper rim of the cylinder and compacted to desired bulk density. Percentage water content is determined after the whole process.
2.8. Thermal Conductivity Test Procedure
Depending on the physical properties of tested material, different type of thermal probe should be chosen. For the purpose of testing soft soils, TR-1 sensor is recommended [29]. In case of coarse grained (ϕ > 2 mm) non-cohesive samples using the TR-1 sensor is not possible due to a risk of damaging the sensor while embedding the probe into sample. For the purposes of compiling the described methodology, in order to measure coarse-grained samples (PNS-1, PNS-4) stiff large diameter (3.9 mm diameter and 60 mm long) the RK-1 needle probe was utilized instead.
Before starting each series of measurements, the sensor performance should be verified by measuring thermal conductivity of certified reference material provided by a producer. If the result of the verification is valid, the test procedure can be conducted on soil samples.
The needle sensor should be placed carefully in the center of the sample. A minimum of 2 cm of material should be allowed parallel to the sensor in all directions. The sensor should be inserted all the way into the measured soil. Once it is placed inside the specimen, the sensor position shouldn’t be changed in order to provide best possible thermal contact between the sensor and measured medium. To allow samples and sensor to come to temperature equilibrium, it is advised to wait 15 min time before starting the measurement.
According to the methodology, three measurements were performed on each sample. Probe’s location wasn’t changed during or between the readings. Fifteen minutes pause applied between measurements was optimal for the sensor-sample temperature to equilibrate.
Verification of the Results
To verify validity of the results obtained in compliance with the above mentioned procedure the results were cross-checked using TK04 Thermal Conductivity Meter with disc-shaped 88-mm diameter standard HLQ probe presented in Figure 3a. The sensor’s needle is embedded in the underside of the disc material. HLQ probe covers thermal conductivity range of 0.3 to 10 W·m−1·K−1 and can be used for measuring various plane surfaces [31]. Thermal conductivity is measured using transient hot wire method. Heat generated by the disk-shaped probe penetrates the sample and partially also the probe material (Figure 3b). TK04 software provided by a producer automatically corrects this effect to evaluate thermal conductivity of the sample.
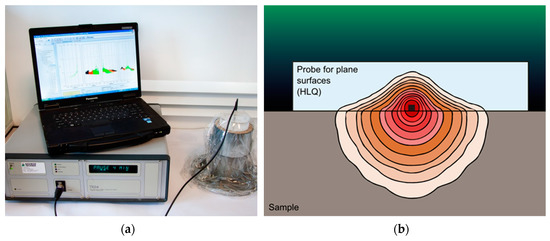
Figure 3.
(a) Non-cohesive soil sample during TK04 Thermal Conductivity Meter measurement with disc-shape probe; (b) heat generated during the test by a disc-shaped HLQ probe.
Sand gravel sample was formed to a dense degree of compaction (ID > 0.67) according to the afore-described procedure and thermal conductivity was measured. The same sample was then compacted to the same density using Proctor apparatus [11]. The results of both tests again were strongly consistent (PNS-1, Table 1). In both cases, thermal grease provided by the producer was utilized to provide a proper contact between the probe and examined specimen.

Table 1.
Thermal conductivity and physical properties of tested non-cohesive soils.
In case of cohesive soils KD2 Pro thermal conductivity verification test was performed on undisturbed silt sample with preserved natural structure [PS-1]. After the test the sample was pulled down, formed according to the procedure and thermal conductivity was measured again. Both tests showed very similar thermal conductivity coefficient values (see Table 2).
Table 2.
Thermal conductivity and physical properties of tested cohesive soils.
3. Results
The authors emphasize that the article contains only those results of thermal conductivity of soils that were obtained during the development of the methodology. The article is not intended to present the results of tests for individual soils.
Samples chosen for the present paper represent wide range of lithology types, classified on the basis of particle size distribution according to EN-ISO 14688 geotechnical standard [12]. Criterion of soil’s regional origin was omitted in the procedure.
A set of samples collected for the BDGI-WFM purposes were used. Physical parameters of samples that are believed to influence thermal properties of the soil (water content, bulk density, particle size distribution, consistency index) were determined and taken into consideration.
- Water content was measured according to EN ISO 17892-1:2014, Geotechnical investigation and testing—Laboratory testing of soil—Part 1: Determination of water content [17].
- Bulk density was measured according to EN ISO 17892-2:2014, Geotechnical investigation and testing—Laboratory testing of soil—Part 2: Determination of bulk density [13].
- Particle size distribution was measured according to EN ISO 17892-4:2017 Geotechnical investigation and testing—Laboratory testing of soil—Part 4: Determination of particle size distribution [14].
- Determination of soil’s consistency was based on methodology according to EN ISO 17892-12:2018 Geotechnical investigation and testing—Laboratory testing of soil—Part 12: Determination of liquid and plastic limits [15].
- Description and classification of soil was done according to ISO 14688-1:2017 Geotechnical investigation and testing—Identification and classification of soil—Part 1 and 2 [16].
On each sample three thermal conductivity measurements were performed. Overall 120 measurements of cohesive and non-cohesive soils were taken during preparation of this methodology.
All of thermal conductivity test results together with sample’s physical parameters are given in Table 1 (non-cohesive soils) and Table 2 (cohesive soils).
Results obtained in the laboratory were compared with numerical data from the literature guidelines provided by Polska Organizacja Rozwoju Technologii Pomp Ciepła (Polish Organization of Heat Pump Technology Development) “PORT PC” [32]. PORT PC Guidelines include recommended thermal conductivity values for certain soil types for the design of ground source heat pumps (GSHP). Those values are presented in above-mentioned guidelines in tabular form as ranges of values with a certain value recommended for the GSHP design.
3.1. Non-cohesive Soils
Thermal conductivity tests were performed on six samples of non-cohesive soils: fine sand (PNS-6), coarse sand (PNS-3), gravel (PNS-4), gravel sand (PNS-1) and two samples of medium sand (PNS-5, PNS-2).
Each sample was measured in three different degrees of water saturation: fully saturated, constant mass dry and with initial water content. Samples were compacted to a “dense” state according to a relative dense term (density index ID ≥ 0.67) [14].
Overall thermal conductivity coefficient for 25 non-cohesive soils samples of different saturation degree and density index were determined.
In order to identify if there is any correlation of compaction rate and thermal conductivity of the soil one of the samples (PNS-2) was also thermally tested in three different degrees of compaction: loose (ID ≤ 0.33), medium dense (0.33 ≤ ID ≤ 0.67) and dense (ID ≥ 0.67).
All of the thermal conductivity test results together with sample’s physical parameters are given in Table 1.
Thermal conductivity results as a function of moisture content are shown in the Figure 4. It is clearly visible that thermal conductivity of the soil increases with increasing water content. The increase of thermal conductivity coefficient is more rapid in the small moisture content (0%–5%) and becomes slower in higher moisture contents. The highest thermal conductivity values were obtained in samples fully saturated with water (up to 3.3 W·m−1·K−1).
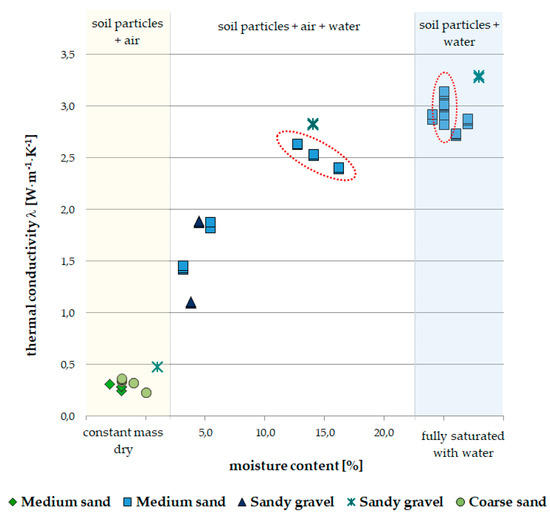
Figure 4.
Thermal conductivity as a function of moisture content for non-cohesive soils. Red ellipses indicate the effect of compaction of single non-cohesive soil sample on thermal conductivity values.
In the red ellipses the effect of medium sand compaction is visible. The compaction process causes decrease in moisture content, but increase in specimen’s relative density gives higher values of thermal conductivity coefficient despite lower moistness.
3.2. Cohesive Soils
Thermal conductivity coefficient of 15 cohesive soils samples was measured. Each sample was examined in natural water content and in constant mass dry state. 14 samples were formed according to the procedure. Undisturbed silt sample (PS-1) was used to verify and evaluate the results using TK04 conductivity meter.
To determine the relationship between water content and thermal conductivity of the soil, one of the samples (PS-6) was tested fourfold: each time in different consistency, including constant mass dry. Plasticity of the clay was increased by mixing the sample with distilled water and stirring carefully until it formed homogeneous paste. The paste was then remolded to desired density and the testing cycle of three measurements was conducted.
Thermal conductivity results for cohesive soil samples presented in this paper as a function of moisture content are shown in Figure 5.
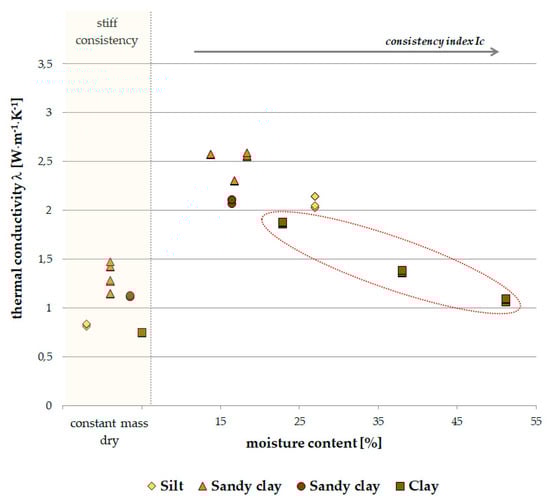
Figure 5.
Obtained thermal conductivity values as a function of moisture content for cohesive soils. Red ellipse indicates the effect of increasing water content on thermal conductivity values of single cohesive soil sample.
Similarly to non-cohesive soil, thermal conductivity of cohesive soil increases with increasing water content. The highest thermal conductivity values of cohesive soils are observed in plastic state. However, at some point of moistness adding more water to the sample has a reverse effect on measured thermal coefficient values (clay sample, inside dashed red ellipse). It is caused by the fact that the bulk density of a cohesive soil decreases at high water contents; the percentage content of water grows and the content of the soil’s particles drops. As pores are getting filled with water, soil particles are losing contact with each other and heat transfer inside the sample becomes less efficient.
The highest thermal conductivity values were obtained for sandy clays (up to 2.6 W·m−1·K−1). The effect is believed to be caused by high quartz content in this type of soil. Clay samples present significantly lower thermal conductivity values (up to 1.9 W·m−1·K−1). It is a result of the lower thermal conductivity of clay minerals [26].
Repeated thermal conductivity results at the same water content for clay and silt samples are consistent. For sandy clays (till) thermal conductivity values are less predictable. In constant mass dry state thermal conductivity coefficient for sandy clays ranges from 1.1 to 1.5 W·m−1·K−1.
It is believed that those variations are caused by a different proportions between >2mm, >0.5mm and >0.25mm soil particles fractions. Higher content of gravel, sand and silt fractions, which in Polish conditions are rich in quartz, is responsible for higher thermal conductivity values.
4. Discussion
Results obtained for the purposes of this paper were compared with data presented in “Guidelines for Ground Source Heat Pumps design. Part 1 Ground heat exchangers” published by Polish Organization for the Development of Heat Pump Technology (PORT PC), that is commonly used in Poland [32]. Thermal conductivity values presented in the guidelines come from VDI 4640 Blatt 2 2001 Thermal use of the underground–ground source heat pump systems and Earth Energy Designer software and do not cover all kind of soil found in Poland [33,34].
Ranges of thermal conductivity values provided by PORT PC Guidelines were presented in Figure 6 in graphical form, to give reference to results of thermal conductivity tests obtained in the article. Both groups of the results are mostly consistent; results of our measurements mostly fit in PORT PC recommended value ranges (Figure 6).
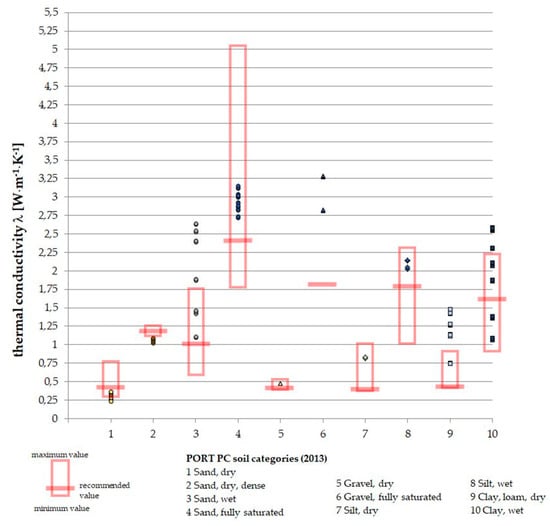
Figure 6.
Obtained thermal conductivity results for different lithotypes in comparison with data from PORT PC guidelines.
Some variations can be observed as well resulting from different way of soil classification than those provided in geotechnical standards. For example, categorization criteria available in literature put in a single category clays and sandy clays (till), while by analyzing the results of our laboratory measurements one can tell that thermal conductivity coefficient values for those two types of soil vary significantly. The authors think that more precise way of categorization the soil will be more useful. Classification of soil used in geotechnical practice identify the soils basing on the particle size grading (in case of coarse particles), plasticity of fine particles and the content of organic matter (for organic soils) [16]. It is crucial to take those properties into consideration, as each of those features can influence thermal properties of soils. Further classification criteria such as stratigraphy, regional geological conditions and genesis of the soil should be taken into account and will be the subjects of future researches.
Future research directions will comprise further filling the BDGI-WFM database with thermal conductivity parameters for different types of soils on a wide range of moisture contents. Collecting large amounts of data will allow constructing nomograms of thermal conductivity coefficient as a function of moisture content that will provide a direct tool to estimate thermal conductivity coefficient for the specific soil type (Figure 7).
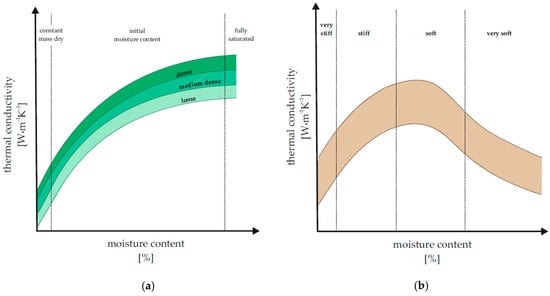
Figure 7.
Conceptual model of nomograms of effective thermal conductivity coefficient as a function of moisture content for non-cohesive (a) and cohesive (b) soil.
As mentioned before, it is important for reliability of the data to always consult local geological conditions. Creating regional thermal properties databases that integrate data from the whole country/region should be one of the future concerns [35].
Figure 8 presents the shallow geothermal potential of Poland and the result of processing, analysis and interpretation of subsurface data from the thematic databases, atlases and serial maps gathered in the archives of the Polish Geological Institute National Research Institute. According to a computational algorithm the reclassification of lithological parameters into the geothermal parameters was performed as well as the values of geothermal conductivity λ [W·m−1·K−1] of analyzed rocks and soils were calculated. Based on the results of calculations spatial layer of average effective thermal conductivity coefficient λ was prepared for the depth interval up to 100 m. The results of performed statistical estimations allowed to create the synthetic characteristics of shallow geothermal energy potential for the major geological regions of Poland.
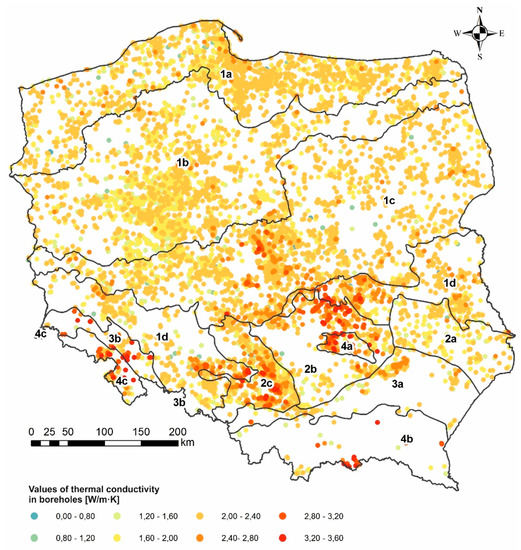
Figure 8.
Map of the shallow geothermal potential of Poland by Ryżyński et al. [24], modified.
Regions highlighted on the map are: Pomorian phase of North Polish Glaciation (1a), Vistulian phase of North Polish Glaciation (1b), Wartanian phase of Middle Polish Glaciation (1c), Odranian phase of Middle Polish Glaciation (1d), Lubelska Upland (2a), Malopolska Upland (2b), Slasko-Krakowska Upland (2c), Carpathian Foothills (3a), Sudethian Foothills (3b), Holy-Cross Mountains (4a), Carpathian Mountains (4b), Sudethian Mountains (4c).
Regions from 1a to 1d are covered with a relatively thick layers of quaternary soils deposit: gravels, sands, silt and clays. The calculations and map preparation were possible due to the application of the presented methodology, which made it possible to obtain a large amount of data on the thermal properties of soils occurring in the above-mentioned geological regions.
5. Conclusions
The presented methodology was based on the functioning ISO and ASTM standards regarding geotechnical investigation and testing of physico-mechanical and thermal parameters of soil, which allows it to be easily implemented in geological and geotechnical laboratories. Sample preparation and measurements are relatively quick and cheap. The methodology provides repeatable and reliable results (consistent with archival data), thus it has been used in the process of preparation of serial shallow geothermal potential maps and parameterization of geothermal 3D models.
After performing a series of measurements, the authors consider it necessary to prepare databases of thermal properties of soils in a regional and lithogenetic approach, which will be the subject of future research.
Author Contributions
A.Ł.: resources, methodology, investigation, visualization, writing—original draft preparation. G.R.: conceptualization, supervision, validation, writing—review and editing. M.Ż.: methodology, investigation, data curation, formal analysis, writing—original draft preparation. All authors have read and agreed to the published version of the manuscript.
Funding
This research received no external funding.
Conflicts of Interest
The authors declare no conflict of interest.
References
- Florides, G.A.; Pouloupatis, P.D.; Kalogirou, S.; Messaritis, V.; Panayides, I.; Zomeni, Z.; Partasides, G.; Lizides, A.; Sophocleous, E.; Koutsoumpas, K. The geothermal characteristics of the ground and the potential of using ground coupled heat pumps in Cyprus. Energy 2011, 36, 5027–5036. [Google Scholar] [CrossRef]
- Ramos, R.; Aresti, L.; Christodoulides, P.; Vieira, A.; Florides, G. Assessment and Comparison of Soil Thermal Characteristics by Laboratory Measurements. In Energy Geotechnics. SEG 2018; Springer Series in Geomechanics and Geoengineering; Ferrari, A., Laloui, L., Eds.; Springer: Cham, Switzerland, 2018; pp. 155–162. Available online: https://link.springer.com/chapter/10.1007/978-3-319-99670-7_20 (accessed on 16 January 2019).
- Vieira, A.; Alberdi-Pagola, M.; Christodoulides, P.; Javed, S.; Loveridge, F.; Nguyen, F.; Cecinato, F.; Maranha, J.; Florides, G.; Prodan, J.; et al. Characterisation of Ground Thermal and Thermo-Mechanical Behaviour for Shallow Geothermal Energy Applications. Energies 2017, 10, 2044. [Google Scholar] [CrossRef]
- Ryżyński, G.; Bogusz, W. City-scale perspective for thermoactive structures in Warsaw. Environ. Geotech. 2016, 3, 280–290. [Google Scholar] [CrossRef]
- Bogusz, W. Możliwość zastosowania fundamentów termoaktywnych w budownictwie mostowym. Mosty 2017, 1, 42–45. (In Polish) [Google Scholar]
- Baralis, M.; Barla, M.; Bogusz, W.; Di Donna, A.; Ryżyński, G.; Żeruń, M. Geothermal potential of the NE extension Warsaw (Poland) metro tunnels. Environ. Geotech. 2018, 1–13. Available online: https://www.icevirtuallibrary.com/doi/abs/10.1680/jenge.18.00042 (accessed on 16 January 2019). [CrossRef]
- Anders, G.J.; Radhakrishna, H.S. Power cable thermal analysis with consideration of heat and moisture transfer in the soil. IEEE Trans. Power Deliv. 1988, 3, 1280–1288. [Google Scholar] [CrossRef]
- Popov, Y.; Beardsmore, G.; Clauser, C.; Roy, S. ISRM suggested methods for determining thermal properties of rocks from laboratory tests at atmospheric pressure. Rock Mech. Rock Eng. 2016, 49, 4179–4207. [Google Scholar] [CrossRef]
- Ryżyński, G.; Łukawska, A.; Żeruń, M. Wytyczne do prowadzenia seryjnych oznaczeń laboratoryjnych przewodności cieplnej gruntów spoistych i niespoistych na potrzeby sporządzania map i baz danych potencjału geotermii niskotemperaturowej. Tech. Poszuk. Geol. Geoterm. Zrównoważony Rozw. 2018, 57, 229–230. (In Polish) [Google Scholar]
- EN 1997-2:2007 Eurocode 7: Geotechnical Design—Part 2: Ground Investigation and Testing; European Committee for Standardization: Brussels, Belgium, 2007; Available online: https://eurocodes.jrc.ec.europa.eu/showpage.php?id=137 (accessed on 5 December 2019).
- ASTM. ASTM D698-12e2, Standard Test Methods for Laboratory Compaction Characteristics of Soil Using Standard Effort (12 400 ft-lbf/ft3 (600 kN-m/m3)); ASTM International: West Conshohocken, PA, USA, 2012. [Google Scholar]
- ISO. ISO 14688-2:2018 Geotechnical Investigation and Testing. Identification and Classification of Soil. Principles for a Classification; International Organization for Standardization: Geneva, Switzerland, 2018; Available online: https://www.iso.org/ (accessed on 25 December 2019).
- ISO. ISO 17892-2:2014 Geotechnical Investigation and Testing. Laboratory Testing of Soil. Determination of Bulk Density; International Organization for Standardization: Geneva, Switzerland, 2014; Available online: https://www.iso.org/ (accessed on 10 December 2019).
- ISO. ISO 17892-4:2017 Geotechnical Investigation and Testing—Laboratory Testing of Soil—Part 4: Determination of Particle Size Distribution; International Organization for Standardization: Geneva, Switzerland, 2017; Available online: https://www.iso.org/ (accessed on 10 November 2019).
- ISO. ISO 17892-12:2018 Geotechnical Investigation and Testing—Laboratory Testing of Soil—Part 12: Determination of Liquid and Plastic Limits; International Organization for Standardization: Geneva, Switzerland, 2018; Available online: https://www.iso.org/ (accessed on 18 November 2019).
- ISO. ISO 14688-1:2017 Geotechnical Investigation and Testing—Identification and Classification of Soil—Part 1: Identification and Description; International Organization for Standardization: Geneva, Switzerland, 2017; Available online: https://www.iso.org/ (accessed on 21 November 2019).
- ISO. ISO 17892-1:2014 Geotechnical Investigation and Testing. Laboratory Testing of Soil. Determination of Water Content; International Organization for Standardization: Geneva, Switzerland, 2014; Available online: https://www.iso.org/ (accessed on 5 December 2019).
- PN-B-04481:1988 Grunty Budowlane—Badania Próbek Gruntu (Geotechnical Soils—Soil Testing); The Polish Committee for Standardization: Warszawa, Polska, 1988; Available online: https://www.pkn.pl/en/ (accessed on 9 December 2019). (In Polish)
- ASTM. ASTM D5334-14 Standard Test Method for Determination of Thermal Conductivity of Soil and Soft Rock by Thermal Needle Probe Procedure; ASTM International: West Conshohocken, PA, USA, 2014. [Google Scholar]
- IEEE. IEEE 442-2017—IEEE Guide for Thermal Resistivity Measurements of Soils and Backfill Materials; The Institute of Electrical and Electronics Engineers: New York, NY, USA, 2017; Available online: https://www.ieee.org/ (accessed on 12 November 2019).
- Baza Danych Geologiczno-Inżynierskich BDGI. Available online: http://geoportal.pgi.gov.pl/atlasy_gi (accessed on 23 December 2019). (In Polish)
- Frankowski, Z.; Majer, E.; Sokołowska, M.; Ryżyński, G.; Ostrowski, S.; Majer, K. Badania geologiczno-inżynierskie prowadzone w Państwowym Instytucie Geologicznym w drugim pięćdziesięcioleciu jego działalności. Prz. Geol. 2018, 66, 752–768. (In Polish) [Google Scholar]
- Majer, E.; Sokołowska, M.; Frankowski, Z.; Barański, M.; Bestyński, Z.; Ostrowski, S.; Pasieczna, A.; Pietrzykowski, P.; Przyłucka, M.; Błachnio, O.; et al. Zasady Dokumentowania Geologiczno-Inżynierskiego; Dział Wydawnictw PIG-PIB: Warsaw, Poland, 2018; pp. 34–35. (In Polish)
- Ryżyński, G.; Żeruń, M.; Kocyła, J.; Kłonowski, M.R. Estimation of Potential Low-temperature Geothermal Energy Extraction from the Closed-loop Systems Based on Analysis, Interpretation and Reclassification of Geological Borehole Data in Poland. In Proceedings of the World Geothermal Congress 2020, Reykjavik, Iceland, 26 April—2 May 2020. [Google Scholar]
- Farouki, O.T. Thermal Properties of Soils; Cold Regions Research and Engineering Laboratory Monograph 81-1: New Hampshire, MA, USA, 1981. [Google Scholar]
- Robertson, E.C. Thermal Properties of Rocks; Open-File Report no. 88-441; US Geological Survey: Richmond, VA, USA, 1988. Available online: https://pubs.er.usgs.gov/publication/ofr88441 (accessed on 12 January 2019).
- Maglić, K.D.; Cezairliyan, A.; Peletsky, V.E. (Eds.) Compendium of Thermophysical Property Measurement Methods: Volume 2 Recommended Measurement Techniques and Practices; Springer: Boston, MA, USA, 1992. [Google Scholar]
- Carslaw, H.S.; Jaeger, J.C. Conduction of Heat in Solids; Oxford Science Publications: Oxford, UK, 1959. [Google Scholar]
- KD2 Pro Thermal Properties Analyzer Operator’s Manual Version 4; Decagon Devices: Pullman, DC, USA, 2016; Available online: https://www.metergroup.com/ (accessed on 18 January 2019).
- Myślińska, E. Laboratoryjne Badania Gruntów; Wydawnictwo Naukowe PWN: Warsaw, Poland, 2006. (In Polish) [Google Scholar]
- Thermophysical Instruments—Geothermal Investigation TK04 Thermal Conductivity Meter User’s Manual version 5.5; Thermophysical Instruments—Geothermal Investigation: Berlin, Germany, 2019; Available online: https://www.te-ka.de/en/ (accessed on 16 January 2019).
- Polska Organizacja Rozwoju Technologii Pomp Ciepła. Wytyczne Projektowania, Wykonania i Odbioru Instalacji z Pompami Ciepła. Część 1—Dolne źródło Ciepła; Wydanie 1: Krakow, Poland, 2013. (In Polish) [Google Scholar]
- VDI 4640 Blatt 2 2001 Thermal use of the underground—Ground source heat pump systems. 2001.
- Bolcon Sweden. EED 3.0-Earth Energy Designer; Bolcon AB: Lund, Sweden, 2008; Available online: https://buildingphysics.com (accessed on 29 November 2019).
- Santaa, G.D.; Galgaroa, A.; Sassia, R.; Cultreraa, M.; Scottona, P.; Muellerc, J.; Bertermannc, D.; Mendrinosd, D.; Pasqualie, R.; Peregoa, R.; et al. An updated ground thermal properties database for GSHP applications. Geothermics 2020, 85, 101758. [Google Scholar] [CrossRef]


© 2020 by the authors. Licensee MDPI, Basel, Switzerland. This article is an open access article distributed under the terms and conditions of the Creative Commons Attribution (CC BY) license (http://creativecommons.org/licenses/by/4.0/).