Abstract
In underground construction, especially tunnel building, a detailed knowledge of the geological conditions ahead of the tunnel face is essential for both safety and efficiency of work. Many tunnel collapses have been reported to occur because of a lack of accurate evaluation of the geological conditions. While conventional horizontal boring conducted from a tunnel face provides good accuracy, it is infrequently conducted due to its high cost and time-consuming nature. In addition, the tunnel seismic reflection method has limited practicality owing to the complexity of data processing. This paper presents a new approach based on the specific energy of the mechanical drilling rig to evaluate the geological conditions ahead of the tunnel face. In order to assess the geological conditions, rock mass quality index, buried depth of the tunnel and tunnel deformation investigation were undertaken, and the obtained data were compared to the specific energy. Results from the comparison reveal the evaluation criterion that if the distribution of specific energy in some areas deviates from the distribution of buried depth, it is considered that abnormal geological conditions exist in this area. This work can greatly contribute to the accurate and effective evaluation of the geological conditions ahead of the tunnel face.
1. Introduction
Evaluation of geological conditions ahead of a tunnel face is of major importance for safe and economic tunnel building [1,2,3]. The inaccurate evaluation of geological conditions may lead to the failure of the support design, which will significantly reduce the safety of tunnel construction and operation and even bring irreparable disaster such as water and mud gushing [4,5,6] and sudden collapse of tunnel [7,8,9]. Consequently, detection of weak zones and other geological features affecting the construction work ahead of the tunnel face is highly desirable [10].
The purpose of detection ahead of a tunnel face is to avoid unexpected collapses at a tunnel face. Conventional horizontal boring conducted from a tunnel face can detect weak zones directly. However, it is time-consuming and often interferes with tunneling works [11,12]. Geophysical methods can also offer several principal possibilities to achieve this goal. One of them is seismic imaging ahead of a tunnel face, which is based on vertical seismic profiling [13,14,15]. This method has been developed in the field of hydrocarbon exploration and uses seismic wave fields generated by surface sources and observed by geophone arrays in boreholes [16,17,18]. Tunnel Seismic Prediction (TSP), the first technique for searching ahead of a tunnel face using seismic reflection, was proposed by Sattel, et al. [19] in 1996. This technique was introduced in Japan and various application tests have been carried out by Inaba, et al. [20], KASA, et al. [21] and Yamamoto, et al. [22]. Several drawbacks were pointed out, such as that the strike of the strata must be assumed and small variations in analytical accuracy appear from person to person and based on experience. Additionally, in order to simplify the analysis, the results obtained are still two-dimensional and only the reflection surface on the tunnel line is generated. On the other hand, a three-dimensional seismic image was created by Ashida [23] to interpret the image of reflector planes using the equi-travel time plane algorithm. Furthermore, the required precision was improved by using seismic signals from three-component geophones in the tunnel. However, a great amount of boring is required with these methods for probing ahead of a tunnel face due to the fact that they involve special blasting work and geophone installation. Not only does the continuous measurement have to be carried out when the excavation work is interrupted but also a great quantity of time for preparation and analysis is required.
In recent decades, advanced measure-while-drilling (MWD) technology has been rapidly developed to create the opportunities to assess the geological conditions ahead of a tunnel face in broad tunneling projects [24,25,26,27]. The MWD technology can therefore be considered a robust technique for detailed characterization of large rock masses, provided that the raw data are treated properly and effective analysis is applied. In geological engineering, many researchers have carried out the study of evaluating geological conditions by MWD technology. For example, the MWD system was first developed by Aoki, et al. [28] in 1995 to evaluate the geological conditions at various ground depths by the data obtained while boring through the rock with a hydraulic drill. A methodology was presented by Yue, et al. [29] to identify zones of volcanic weathering and decomposition grades in the ground through the MWD data monitored from rotary percussive drilling. Results showed that the penetration rate parameter had a close correlation with decomposition grades in the ground. As a composite MWD parameter, specific energy was proposed by Teale [30] to correlate drill performance parameters in rotary drilling. Drilling monitoring devices installed on the drilling rigs provide systematic records of the main drilling parameters (e.g., penetration rate, hammer pressure, rotation pressure, hammer frequency) from which the specific energy can be easily derived and expressed in terms of the mechanical energy necessary to drill a determined volume of rock (J/cm3). Leung and Scheding [31] proposed a novel measure called modulated specific energy for characterizing drilled material in open-pit coal mining, which can overcome the problems of low specificity and high variability observed in existing MWD approaches. Celada, et al. [32] found that the values of specific energy can be correlated with the main quality indexes as rock mass rating. Laboratory tests also have been carried out measuring uniaxial compressive strength, Young’s modulus and obtained results indicating that the relationship exists between the specific energy of drilling and these rock mechanical parameters. As the result of onsite applications of the MWD technology the obtained indices have been validated to be reliable for evaluating geological conditions. However, due to the complexity of analyzing and processing the MWD data, the existing methods of utilizing specific energy to evaluate geological conditions ahead of tunnel face have limited practical guidance for onsite applications.
To the authors’ knowledge, little research on the relationship between the specific energy of the mechanical drilling rig in the region ahead of the tunnel face derived from MWD data, rock mass quality index, buried depth of the tunnel and tunnel deformation has been reported, if any. In this study, a new method was proposed to evaluate the geological conditions ahead of a tunnel face based on the comparative analysis of the relationship among specific energy, rock mass quality score (RQS, an index used in Japan to evaluate the quality of tunnel rock mass), buried depth of the tunnel and tunnel deformation. The measurement of the specific energy, RQS, buried depth and tunnel deformation were firstly carried out with the excavation of a tunnel and then the correlations among these measurement data were subsequently compared and analyzed. Finally, the criterion for evaluating geological conditions ahead of the tunnel face was determined. The proposed method can contribute to the accurate and effective evaluation of the geological conditions ahead of the tunnel face.
2. Materials and Methods
2.1. Description of the New Nagasaki Tunnel (East)
Many mountains exist in Japan. The construction cost will increase when building a highway or railway bypass the mountains. Therefore, quantities of tunnels are inevitably required for the construction of a highway or railway. Unpredictable geological conditions such as water inrush, mud inrush and cavity are abundant in mountain tunnels, especially in the south of Japan. The case study was carried out on the new Nagasaki tunnel of West Kyushu Line with a total length of 7.46 km. Its construction was started in March 2013 and it connects the cities of Nagasaki and Isahaya in the southeast and center of Nagasaki province, respectively. As shown in Figure 1, this tunnel has been designed and built with two phases, east and west phases, with lengths of 3.885 and 3.575 km, respectively. The shape of the tunnel is a horseshoe with 9.3 m height and 10.4 m width. For the both east and west phases of the tunnel, the New Austrian Tunneling Method was used. The excavation of the new Nagasaki tunnel (east) was completed in 2017 and the data measured from this tunnel were used for the analysis and research of this study. The stratum that this tunnel passes through is volcanic rock. The rock type is roughly pyroxene andesite. The geological conditions of the surrounding rock of this tunnel are not very good, with the elastic wave velocity of 2.5–3.5 km/s.
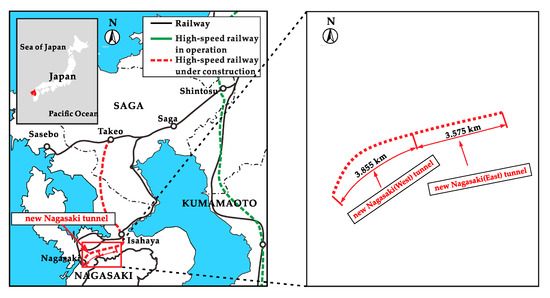
Figure 1.
The location of the new Nagasaki tunnel.
2.2. Evaluation Method
The data used for the evaluation of the geological conditions ahead of the tunnel face are the data obtained during the construction of the tunnel, including the MWD data and the data (e.g., RQS, buried depth of the tunnel and tunnel deformation) recorded in the observation report of the tunnel face. The specific energy is one of the MWD data obtained by drilling ahead of the tunnel face in the drilling process. In this study, the drilling data of every 1 m length are processed averagely. The specific energy, buried depth of tunnel and RQS are compared and their correlation is analyzed to evaluate the factors closely related to the geological conditions ahead of tunnel face.
In this study, the new Nagasaki tunnel (east) with a total length of about 4 km is divided into four intervals for investigation, as shown in Figure 2 and Table 1. The geological conditions at a certain mileage of the tunnel are determined according to the corresponding deformations of the tunnel recorded in the investigation report. The deformations of the tunnel include convergences in the top and lower half of the tunnel and crown settlement of the tunnel. The large deformation value of the tunnel indicates that the geological conditions are poor. It should be noted that due to the reason that some field measurements are difficult to carry out, the specific energy and RQS measurement data used in this paper have not been obtained from all tunnel sections. At the same time, in order to be able to clearly compare and analyze the relationship between the measurement data under different geological conditions, part of the measurement data is applied to analyze four representative tunnel sections (intervals 1 to 4). The geological conditions in intervals 1 and 3 are good, while poor in interval 2 and fair in interval 4. As for the burial depth of tunnel, intervals 1, 2 and 4 have common burial depth, while interval 3 has large burial depth. As for the water inflow of the tunnel face, there is a small amount of water inflow in intervals 1 and 3 and a large amount in intervals 2 and 4. Descriptive statistical distribution of the values of the specific energy, buried depth and RQS is summarized in Table 2. Additionally, Figure 3 compares the range and distribution of feature parameters. As can be observed from Figure 3 and Table 2, all the three parameters have a certain degree of discrimination.
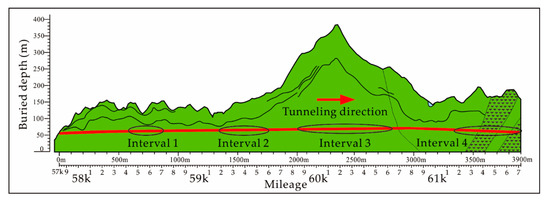
Figure 2.
Distribution of four intervals of the new Nagasaki tunnel (east).

Table 1.
Geological conditions, buried depth, and water inflow of four intervals.
Table 2.
Basic statistical description of the values of the specific energy, buried depth and RQS.
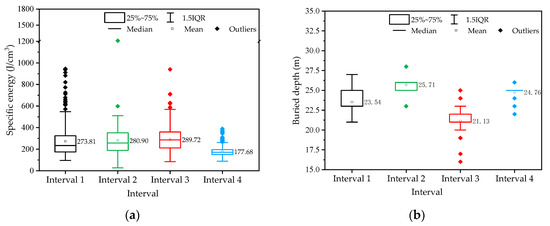
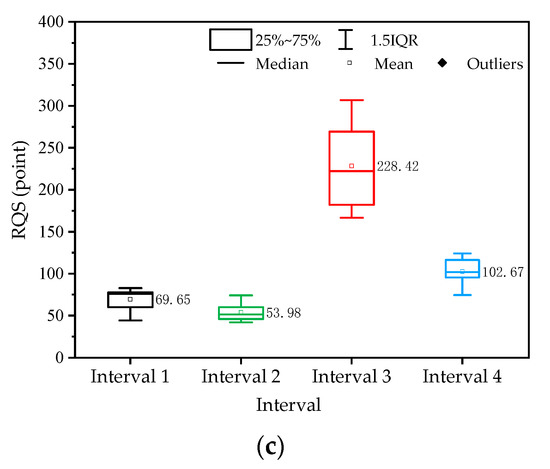
Figure 3.
The range and distribution of the values of the specific energy, buried depth and rock mass quality score (RQS). (a) The value of the specific energy; (b) The value of the buried depth; (c) The value of the RQS.
2.3. The Specific Energy
In this study, during the tunnel excavation, the advance drilling work ahead of the tunnel face was carried out utilizing a hydraulic rotary percussion drill (as shown in Figure 4). The parameters of MWD data (the data obtained from a 30 m borehole as shown in Figure 5) obtained from the data collection device include the penetration rate, hammer pressure, hammer frequency and specific energy. The specific energy is a fundamental parameter in the drilling of rocks and is defined as the amount of mechanical energy required to break a unit volume of rock, calculated as Equation (1) [33]:
where Es is the specific energy (J/cm3), f is hammer frequency (1/min), v is penetration rate (cm/min), S is cross-sectional area of the drill hole (cm2), k is loss coefficient, A is piston compression area (cm2), L is piston stroke (cm) and Ns is the hammer pressure (MPa). The role of loss coefficient k in this equation is mainly to compensate the energy loss caused by the friction between drill pipe and borehole. The determination of loss coefficient k is based on the laboratory test of drilling different lithology rocks. The drilling data obtained from the field in this study are directly measured using the drilling guidance system “Drill Navi” developed by Konoike Construction Co., Ltd. of Japan. The calculation equation of the specific energy is embedded in the system.
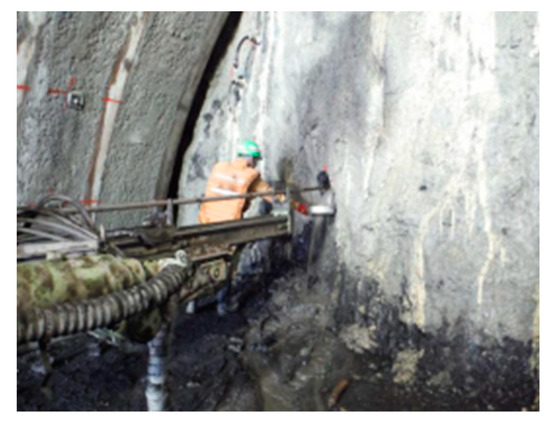
Figure 4.
The hydraulic rotary percussion drill.
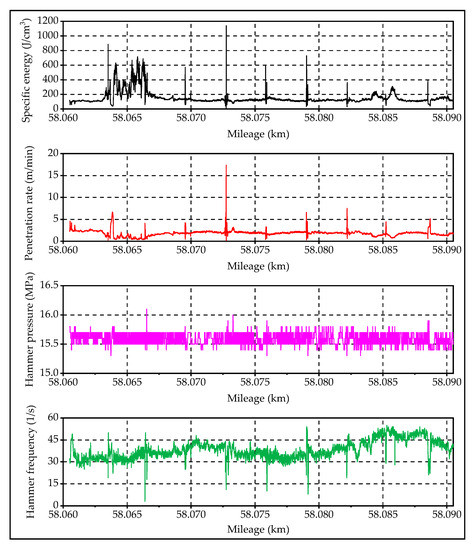
Figure 5.
Visualization of the measure-while-drilling (MWD) data recorded.
2.4. RQS
In this tunnel construction, the observation report of tunnel face is implemented for rock mass assessment. A tunnel rock mass classification method, JH method, proposed by Akagi, et al. [34], is employed to classify the rock mass. This method uses ten rock parameters of overall state, self-stability, intact rock strength, weathering, joints proportion, spacing of joints, joint aperture, morphology of joints, ground water inflow and ground water corrosion to assess rock mass quality. Based on the above parameters, an engineering classification of rock masses, termed the geomechanics classification, is shown in Table 3. As shown in Table 3, all observation items are configured with four values from 1 to 4. The RQS (the final rock class rating) value will be the sum of each item value, with lower numbers reflecting better conditions and, hence, lesser support requirements in the case of tunnels.
Table 3.
Geomechanics classification of rock masses.
2.5. The Deformation
As an important part of tunnel construction process, deformation monitoring is widely used in tunnel engineering [35]. On the one hand, the data provided by the monitoring process can be used to evaluate the geological conditions of the surrounding rock, on the other hand, it can be used to judge the stability of the tunnel structure [36]. It is very important that the monitoring of the development trend of tunnel deformation can also determine the reasonable support design to adapt to the unforeseen geological conditions ahead of tunnel face. Tunnel deformation includes wall convergence (horizontal displacement) and crown settlement (vertical displacement). Many measurement techniques such as tape extensometers, total station survey, photogrammetric devices, and laser profilers (laser scanners) have been developed for these processes. In this study, total station was used to measure tunnel deformation because it has the advantages of fast, simple and non-contact. It mainly adopts a total station and a reflective film to measure horizontal convergence and crown settlement, with measurement accuracy of 0.5–1 mm.
In this paper, the deformation measurement of the entire length of the new Nagasaki tunnel (east) was carried out by the measuring technology of total station survey. Through the trigonometry relation among total station, rear viewpoint and measuring point, the settlement displacement of a measuring point can also be obtained (as shown in Figure 6).
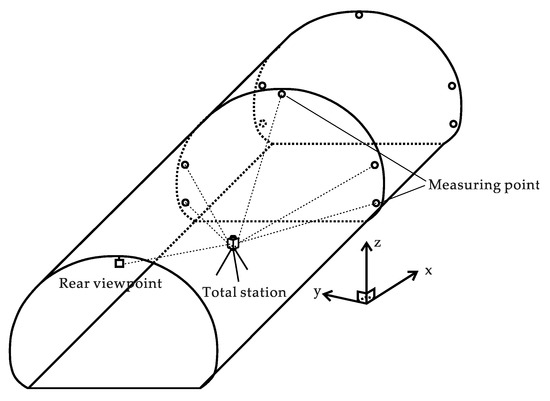
Figure 6.
The sketch of deformation measurement with total station.
Figure 7 depicts the measuring points layout of cross section. Two measuring lines B–C and D–E were set to measure the horizontal convergence during tunnel excavation. In addition, point A was set to measure the crown settlement.
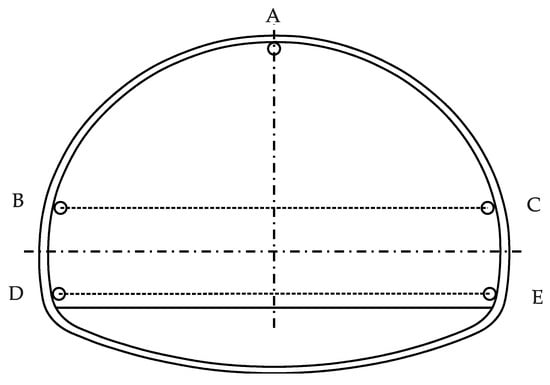
Figure 7.
Measuring points layout of cross section.
Table 4 and Table 5 illustrate the monitoring interval and frequency applied in this site, respectively, which was set according to the technical code for monitoring measurement of railway tunnels. It should be noted that the deformation data (wall convergence and crown settlement) used for the relationship analysis with specific energy and RQS are the final data after the tunnel deformation was basically stable after support. The detailed discussion of the measured data is given in the next section.
Table 4.
The deformation monitoring interval applied in this site.
Table 5.
The deformation monitoring frequency applied in this site.
3. Results and Discussion
This section contains the comparison and analysis between specific energy, RQS and deformation. In addition, the feasibility of utilizing the correlation between these data to evaluate the geological conditions ahead of tunnel face is also discussed. In this study, the correlation coefficient (R2) index was calculated to evaluate the correlation between variables, as employed by Grima and Babuška [37]:
3.1. Interval 1
Figure 8 shows the deformation of the convergences (top and lower half) and crown settlement of interval 1. As shown in Figure 8, for interval 1, although a small amount of water inflow is visible, the deformations are quite small. The maximum deformation is less than 10 mm with the 58.65 km mileage. Comparing intervals 1–4, interval 1 has the best geological conditions among the four intervals.
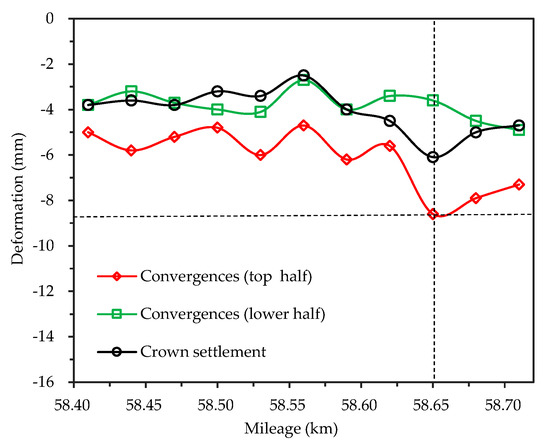
Figure 8.
Measured deformation of the convergences (top and lower half) and crown settlement of interval 1.
The distributions of specific energy and RQS with mileage are shown in Figure 9. As can be seen, higher singular values of specific energy exist near 58.45 km mileage. After removing these singular values, the specific energy is roughly distributed between 100–500 J/cm3. It can be concluded that the specific energy of interval 1 varies little with the mileage. The relationship between specific energy and RQS was analyzed by comparing Figure 8 with Figure 9a and Figure 10a. In theory, high specific energy values and low RQS values indicate that the rock mass is harder. As displayed in Table 2 and Figure 9a, it can be seen that RQS of interval 1 is 27 points at the highest, 21 points at the lowest and 23.5 points on average. As mentioned above, interval 1 has the best geological condition with the smallest deformation. However, if only RQS is considered, the average RQS of interval 3 is smaller than that of interval 1, which means that the geological condition of interval 3 is the best. It is not matched with the fact that interval 1 has the best geological conditions. As shown in Figure 9a, when the points of specific energy and RQS overlap, the distribution trends of specific energy and RQS points look similar but it is not consistent at 58.424–58.500 km mileage. The R2 values of specific energy and RQS are also smaller at this mileage. In addition, the largest RQS exists at 58.63 km and 58.73 km mileage, rather than at 58.65 km mileage where the deformation is the largest. From these results, it can be concluded that a reasonable correlation exists between specific energy and RQS for interval 1 but there is low correlation between RQS and deformation.
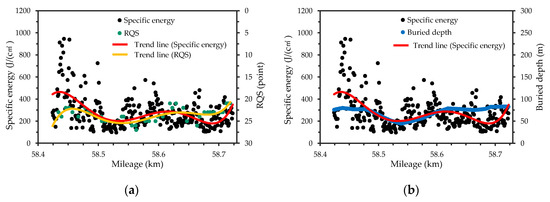
Figure 9.
Distribution of specific energy, RQS and buried depth with mileage of interval 1. (a) Comparison of distributions between specific energy and RQS; (b) Comparison of distributions between specific energy and buried depth.
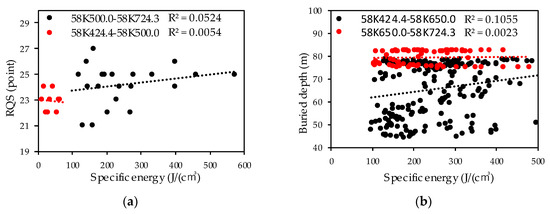
Figure 10.
Correlation coefficients of specific energy, RQS and buried depth with mileage of interval 1. (a) Correlation coefficients of specific energy and RQS; (b) Correlation coefficients of specific energy and buried depth.
Figure 9b shows the distributions of specific energy and buried depth with mileage of interval 1. The relationship between specific energy and buried depth is discussed by comparing Figure 8 with Figure 9b and Figure 10b. Interval 1 has relatively small buried depth among the four intervals; the buried depth of interval 1 is 82.7 m at maximum, 44.3 m at minimum and 69.64 m on average. Theoretically, as the burial depth increases, the rock mass hardens, and the specific energy increases accordingly. The distribution trends of specific energy and buried depth points are basically the same except for the mileage of 58.650–58.724 km as presented in in Figure 9b. Figure 10b shows that lower R2 values exist at the mileage of 58.650–58.724 km. This result reveals that a certain correlation exists between specific energy and buried depth except for the mileage of 58.650–58.724 km where the deformation is large. It should be noted that the trend lines in Figure 9 are computed by using multiple regression technique. The regression equations between specific energy, RQS and mileage are all quintic equations. Accordingly, the following interval 2, 3 and 4 use the same technology to calculate the trend lines.
3.2. Interval 2
A large amount of water inrush and poor geological conditions exist in parts of interval 2, which leads to the inability to obtain specific energy data, as presented in Figure 11. From Figure 11, it is considered that the geological conditions are quite deteriorated after 59.32 m mileage The maximum deformation of the area before 59.32 m mileage is about 120 mm, which can allow us to predict that the geological conditions near this mileage are the worst.
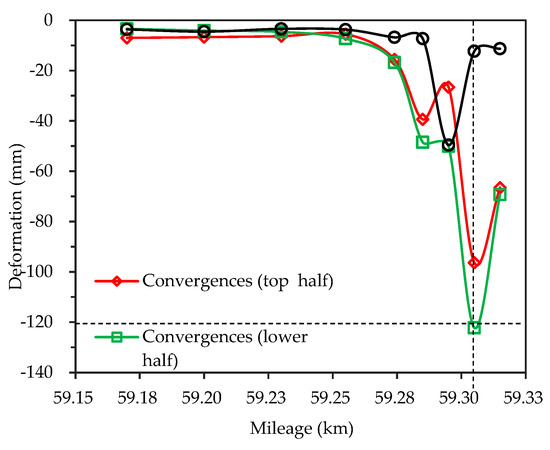
Figure 11.
Measured deformation of the convergences (top and lower half) and crown settlement of interval 2.
The distributions of specific energy and RQS with mileage of interval 2 are shown in Figure 12a. As can be seen, although some mileage in interval 2 cannot obtain specific energy, the specific energy is basically distributed between 100–500 J/cm3, which is the same value as interval 1 with good geological conditions. In addition, the average value is 280.9 J/cm3, which is very close to 273.8 J/cm3 of interval 1. Although the specific energies of interval 1 and 2 are similar, the geological conditions are totally different. The relationship between specific energy and RQS was analyzed by comparing Figure 11 with Figure 12a and Figure 13a. As displayed in Table 2, it can be seen that RQS of interval 2 is 28 points at the highest, 23 points at the lowest and 25.71 points on average. Although the value of the specific energy is not lowest near the 59.24 km mileage in interval 2, the value of RQS is the highest. In addition, according to the theory mentioned in Section 3.1 that the higher the specific energy, the harder the rock mass and the lower the RQS value will be, the distribution of specific energy is basically similar to the distribution of RQS with mileage in interval 2, so it can be concluded that for interval 2, the specific energy and RQS have a certain correlation (as shown in Figure 13a). It can be seen that although the specific energy is related to RQS, the distribution of deformation changes greatly with mileage (as shown in Figure 11). Therefore, it is difficult to accurately predict the geological conditions of rock mass based only on the relationship between specific energy and RQS.
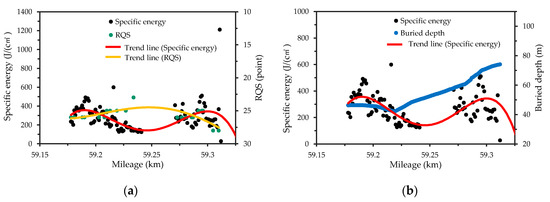
Figure 12.
Distribution of specific energy, RQS and buried depth with mileage of interval 2. (a) Comparison of distributions between specific energy and RQS; (b) Comparison of distributions between specific energy and buried depth.
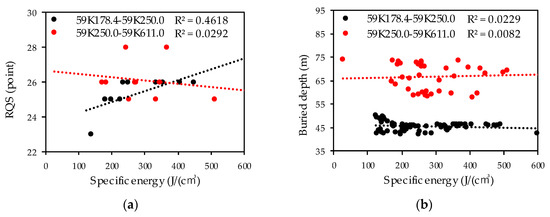
Figure 13.
Correlation coefficients of specific energy, RQS and buried depth with mileage of interval 2. (a) Correlation coefficients of specific energy and RQS; (b) Correlation coefficients of specific energy and buried depth.
Figure 12b displays the distributions of specific energy and buried depth with mileage of interval 2. The comparison of the graphs of Figure 11, Figure 12b and Figure 13b was carried out to examine the relationship between specific energy and buried depth. The maximum buried depth of interval 2 is 74.1 m, the minimum is 42 m and the average is 53.92 m, which is roughly the same as interval 1. From Table 2, Figure 12b, the distributions of specific energy and buried depth corresponding to the first half of mileage are very similar; however, the specific energy remains generally constant when the buried depth of the second half becomes higher. Figure 13b shows that lower R2 value exists at these mileages. As the deformation becomes larger in the second half (as shown in Figure 11), an assumption that the geological conditions of the area will be worse with higher buried depth and lower specific energy with a higher probability was proposed and carried out to investigate the remaining intervals.
3.3. Interval 3
Almost no water inflow exists in the whole part of interval 3; however, the maximum deformation of about 20 mm occurs near the 60.100 km mileage and the large deformation of about 17 mm occurs near the 60.700 km mileage, as shown in Figure 14.
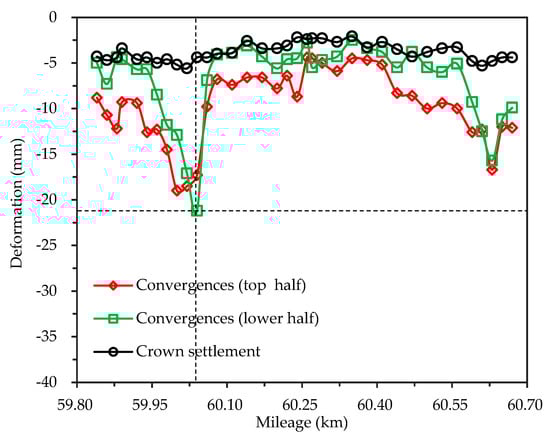
Figure 14.
Measured deformation of the convergences (top and lower half) and crown settlement of interval 3.
Figure 13a depicts the distributions of specific energy and RQS with mileage of interval 3. The average value of specific energy is similar to intervals 1 and 2 (as shown in Table 2); however, the distribution of specific energy with mileage fluctuates significantly. The relationship between specific energy and RQS was analyzed by comparing Figure 14 with Figure 15a and Figure 16a. It can be seen that the distributions and the R2 values of specific energy and RQS with mileage are almost the same. However, it cannot be concluded that the low specific energy values and the low RQS values indicate that the deformation is larger.
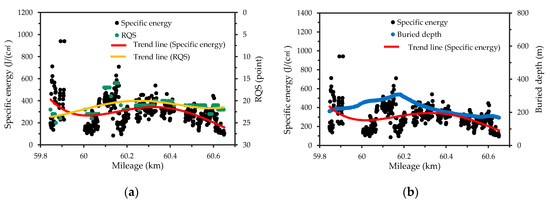
Figure 15.
Distribution of specific energy, RQS and buried depth with mileage of interval 3. (a) Comparison of distributions between specific energy and RQS; (b) Comparison of distributions between specific energy and buried depth.
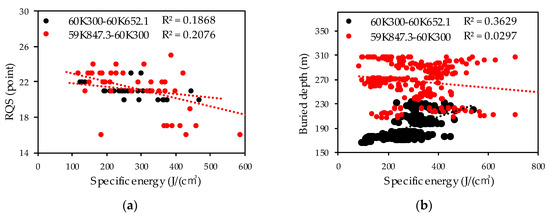
Figure 16.
Correlation coefficients of specific energy, RQS and buried depth with mileage of interval 3. (a) Correlation coefficients of specific energy and RQS; (b) Correlation coefficients of specific energy and buried depth.
As can be seen from Table 2, the maximum burial depth of interval 3 is 306.8 m, the minimum is 166.6 m and the average is 228.42 m. Interval 3 has the highest burial depth among the four intervals. Figure 15a shows the distributions of specific energy and buried depth with mileage of interval 3. The relationship between specific energy and buried depth was analyzed through the comparison of the graphs of Figure 14, Figure 15b and Figure 16b. The results show that although the distribution of specific energy and buried depth with mileage is very similar, the distribution of specific energy near the 59.847–60.300 km mileage is lower than the buried depth, the lower R2 value exists at these mileages and it can be seen from Figure 14 that the deformation of this area is larger. These results verify the assumption in interval 2 that the geological conditions of the area are worse with higher buried depth and lower specific energy.
3.4. Interval 4
The water inflow exists in the whole section of interval 4 and the deformation of about 10 mm can be seen almost in the whole section, as shown in Figure 17.
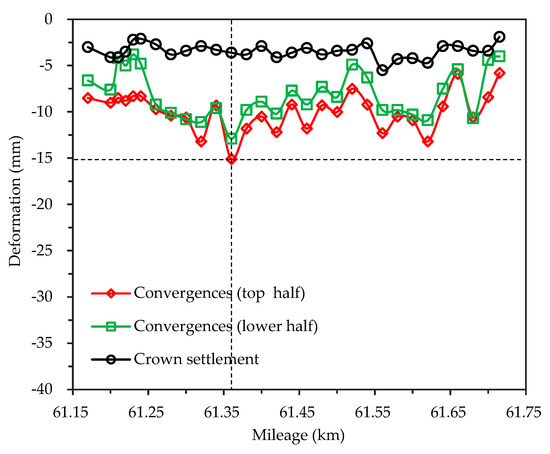
Figure 17.
Measured deformation of the convergences (top and lower half) and crown settlement of interval 4.
The distributions of specific energy and RQS with mileage of interval 4 are expressed in Figure 18a. The specific energy of interval 4 is between 100–400 J/cm3 and the larger specific energy exists near 61.68 km of interval 4. The total variation range of specific energy of interval 4 is very small, the smallest one among the four intervals. The average value of specific energy is also smaller than other intervals but the specific energy fluctuates obviously in interval 4, the same as interval 3. The relationship between specific energy and RQS was analyzed by comparing Figure 17 with Figure 18a and Figure 19a. As expressed in Table 2, the RQS of interval 4 is 26 points at the highest, 22 points at the lowest and 24.75 points on average. For the first half of interval 4, the distributions of specific energy and RQS with mileage are approximately the same. However, for the second half, some fluctuations exist in the distribution of specific energy but the distribution of RQS remains constant. It can also be seen from Figure 19a that the R2 value of the first half is greater than that of the second half. However, a large amount of deformation exists in these two sections.
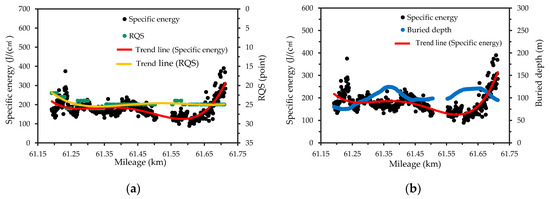
Figure 18.
Distribution of specific energy, RQS and buried depth with mileage of interval 4. (a) Comparison of distributions between specific energy and RQS; (b) Comparison of distributions between specific energy and buried depth.
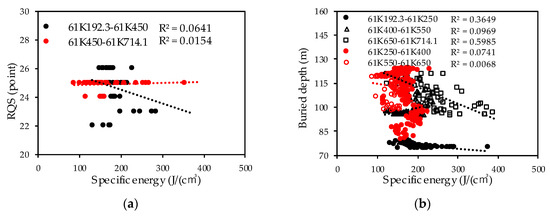
Figure 19.
Correlation coefficients of specific energy, RQS and buried depth with mileage of interval 4. (a) Correlation coefficients of specific energy and RQS; (b) Correlation coefficients of specific energy and buried depth.
As indicated in Table 2, the maximum burial depth of interval 4 is 124.2 m, the minimum is 74.5 m and the average is 102.61 m. The burial depth of interval 4 is slightly higher than that of intervals 1 and 2. Figure 18b depicts the distributions of specific energy and buried depth with mileage of interval 4. The relationship between specific energy and buried depth was analyzed through the comparison of the graphs of Figure 17, Figure 18b and Figure 19b. As shown in Figure 18b, the deformation is relatively large near 61.25–61.40 km mileage and 61.55–61.68 km mileage, which indicates that poor geological conditions exist in these two sections. The lower R2 values also exist in these two sections (as shown in Figure 19b). Except for the distribution of specific energy of these two sections being lower than that of buried depth, the distributions of specific energy and buried depth with mileage are basically the same for other parts of interval 4. These results further reveal that the distribution of specific energy in this section is much lower than that of buried depth, which may be due to the poor geological conditions in this area. Therefore, the assumption proposed in interval 2 is verified; that is, the areas with lower specific energy distribution than the buried depth distribution have worse geological conditions with a higher probability.
4. Conclusions
The accurate/objective evaluation of geological conditions ahead of a tunnel face is one of the biggest challenges in tunnel building. Serious mistakes in geological condition prediction can cause considerable irreparable damage, that is, support instability caused by the unexpected anomalies (i.e., cavities or water bearing, fractured or relatively stronger zones). Therefore, in this paper, the feasibility of using mechanical specific energy (a composite parameter of the MWD parameter) in the drilling process to evaluate the geological conditions ahead of tunnel face is analyzed and the relationship between specific energy, RQS, tunnel buried depth and tunnel deformation is compared. The specific conclusions from this study are the following:
- (1)
- Although the geological conditions of the four intervals of the new Nagasaki tunnel (east) are different, the difference between the average values of specific energy of these intervals is very small, within 100 J/cm3. According to the distributions of specific energy, RQS and buried depth with the mileage of this tunnel, it can be observed that certain correlations exist between these items.
- (2)
- A high correlation exists between specific energy and RQS but the feasibility of employing this correlation to evaluate the geological conditions ahead of the tunnel face is very limited.
- (3)
- Although the correlation coefficient values obtained are small and widely dispersed, the geological conditions can be evaluated by comparing the correlation coefficient values in different regions and the distribution trend of each variable. Compared with the distribution of buried depth, a high probability of large tunnel deformation occurs in the region with extensive low specific energy values. The reason behind this view is explained as follows: The specific energy can reflect the strength of rock and the strength state of rock mass; in theory, the strength of the rock mass with larger buried depth is higher and the corresponding specific energy value is larger. If the buried depth of a certain area is larger but the specific energy value measured is smaller, it is an abnormal phenomenon with greater probability. Therefore, the objective criterion for evaluating geological conditions can be obtained: If the distribution of the specific energy in some areas deviates from the distribution of buried depth, it is considered that abnormal geological conditions exist in this area with a higher probability.
Although the criterion for evaluating geological conditions ahead of the tunnel face has been determined via comparing the specific energy, the RQS, the tunnel buried depth and the tunnel deformation, some problems should be considered further. How to establish the quantitative index based on the MWD data to evaluate the geological conditions ahead of a tunnel face is a challenging topic. This is still an open problem and therefore deserves further investigation.
Author Contributions
Conceptualization, Y.J.; methodology, Y.J.; software, S.I. and J.L.; validation, Y.J. and O.S.; formal analysis, J.L.; investigation, W.H., S.I. and H.L.; data curation, O.S. and H.L.; writing—original draft preparation, J.L.; writing—review and editing, J.L.; visualization, J.L., S.I. and W.H.; supervision, Y.J.; funding acquisition, J.L. and H.L. All authors have read and agreed to the published version of the manuscript.
Funding
This research was funded by Shandong Provincial Natural Science Foundation, China (Grant No. ZR2019BEE065).
Acknowledgments
The authors gratefully acknowledge support of Civil Engineering Department, Technical Division, Konoike Construction Japan for providing field data and sharing experience on tunnel construction.
Conflicts of Interest
The authors declare that there is no conflict of interest.
References
- Mahdevari, S.; Torabi, S.R. Prediction of tunnel convergence using artificial neural networks. Tunn. Undergr. Space Technol. 2012, 28, 218–228. [Google Scholar] [CrossRef]
- Djogo, M.; Vasic, M.; Cosic, M. Engineering geological evaluation of the conditions for constructing a bridge and a tunnel in the zone of the old Petrovaradin Fortress, Serbia. Bull. Eng. Geol. Environ. 2011, 70, 139–142. [Google Scholar] [CrossRef]
- Lee, I.M.; Truong, Q.H.; Kim, D.H.; Lee, J.S. Discontinuity detection ahead of a tunnel face utilizing ultrasonic reflection: Laboratory scale application. Tunn. Undergr. Space Technol. 2009, 24, 155–163. [Google Scholar] [CrossRef]
- Gong, Q.; Yin, L.; She, Q. TBM tunneling in marble rock masses with high in situ stress and large groundwater inflow: A case study in China. Bull. Eng. Geol. Environ. 2013, 72, 163–172. [Google Scholar] [CrossRef]
- Li, S.C.; Wu, J.; Xu, Z.H.; Li, L.P. Unascertained measure model of water and mud inrush risk evaluation in karst tunnels and its engineering application. KSCE J. Civ. Eng. 2017, 21, 1170–1182. [Google Scholar] [CrossRef]
- Lu, J.; Liu, X. Construction Techniques for Water and Sand Gushing Section in Xiushan Tunnel on Yuxi-Mengzi Railway. Tunn. Constr. 2009, 29, 339–341. [Google Scholar]
- Shin, H.S.; Han, K.C.; Sunwoo, C.; Choi, S.O.; Choi, Y.K. Collapse of a Tunnel in Weak Rock and the Optimal Design of the Support System. In Proceedings of the 9th ISRM Congress, Paris, France, 25–28 August 1999; p. 3. [Google Scholar]
- Li, L.; Wang, Q.; Li, S.; Huang, H.; Shi, S.; Wang, K.; Lei, T.; Chen, D. Cause Analysis of Soft and Hard Rock Tunnel Collapse and Information Management. Pol. J. Environ. Stud. 2014, 23, 1227–1233. [Google Scholar]
- Chen, Z.; Shi, C.; Li, T.; Yuan, Y. Damage characteristics and influence factors of mountain tunnels under strong earthquakes. Nat. Hazards 2012, 61, 387–401. [Google Scholar] [CrossRef]
- Janda, T.; Šejnoha, M.; Šejnoha, J. Applying Bayesian approach to predict deformations during tunnel construction. Int. J. Numer. Anal. Methods Geomech. 2018, 42, 1765–1784. [Google Scholar] [CrossRef]
- Li, S.; Liu, B.; Xu, X.; Nie, L.; Liu, Z.; Song, J.; Sun, H.; Chen, L.; Fan, K. An overview of ahead geological prospecting in tunneling. Tunn. Undergr. Space Technol. 2017, 63, 69–94. [Google Scholar] [CrossRef]
- Bu, L.; Li, S.; Shi, S.; Li, L.; Zhao, Y.; Zhou, Z.; Nie, L.; Sun, H. Application of the comprehensive forecast system for water-bearing structures in a karst tunnel: A case study. Bull. Eng. Geol. Environ. 2019, 78, 357–373. [Google Scholar] [CrossRef]
- Swinnen, G.; Thorbecke, J.W.; Drijkoningen, G.G. Seismic Imaging from a TBM. Rock Mech. Rock Eng. 2007, 40, 577–590. [Google Scholar] [CrossRef]
- Tzavaras, J.; Buske, S.; Groß, K.; Shapiro, S. Three-dimensional seismic imaging of tunnels. Int. J. Rock Mech. Min. Sci. 2012, 49, 12–20. [Google Scholar] [CrossRef]
- Bellino, A.; Garibaldi, L.; Godio, A. An automatic method for data processing of seismic data in tunneling. J. Appl. Geophys. 2013, 98, 243–253. [Google Scholar] [CrossRef]
- Dix, C.H. Seismic Prospecting for Oil; Harper: New York, NY, USA, 1952. [Google Scholar]
- Robertson, J.D.; Pritchett, W.C. Direct hydrocarbon detection using comparative P-wave and S-wave seismic sections. Geophysics 1985, 50, 383–393. [Google Scholar] [CrossRef]
- Stewart, R.R.; Gaiser, J.E.; Brown, R.J.; Lawton, D.C. Converted-wave seismic exploration: Methods. Geophysics 2002, 67, 1348–1363. [Google Scholar] [CrossRef]
- Sattel, G.; Sander, B.; Amberg, F.; Kashiwa, T. Predicting ahead of the face. Tunn. Tunn. Int. 1996, 28, 24–30. [Google Scholar]
- Inaba, T.; Ishiyama, K.; Akashi, T.; Hirano, T. Prediction system of geological condition ahead of the tunnel face. Constr. Mach. Equip. 1996, 32, 40–45. [Google Scholar]
- Kasa, H.; Igari, T.; Yamamoto, H.; Maeda, N. A study on exploration accuracy of tunnel seismic prediction method. Proc. Tunn. Eng. JSCE 1996, 6, 95–100. [Google Scholar]
- Yamamoto, T.; Shirasagi, S.; Yokota, Y.; Koizumi, Y. Imaging geological conditions ahead of a tunnel face using Three-dimensional Seismic Reflector Tracing System. Int. J. JCRM 2011, 6, 23–31. [Google Scholar]
- Ashida, Y. Seismic imaging ahead of a tunnel face with three-component geophones. Int. J. Rock Mech. Min. Sci. 2001, 38, 823–831. [Google Scholar] [CrossRef]
- Schunnesson, H. RQD predictions based on drill performance parameters. Tunn. Undergr. Space Technol. 1996, 11, 345–351. [Google Scholar] [CrossRef]
- Sugawara, J.; Yue, Z.; Tham, L.; Law, K.; Lee, C. Weathered rock characterization using drilling parameters. Can. Geotech. J. 2003, 40, 661–668. [Google Scholar] [CrossRef]
- Høien, A.H.; Nilsen, B. Rock mass grouting in the Løren Tunnel: Case study with the main focus on the groutability and feasibility of drill parameter interpretation. Rock Mech. Rock Eng. 2014, 47, 967–983. [Google Scholar] [CrossRef][Green Version]
- Galende-Hernández, M.; Menéndez, M.; Fuente, M.J.; Sainz-Palmero, G.I. Monitor-While-Drilling-based estimation of rock mass rating with computational intelligence: The case of tunnel excavation front. Autom. Constr. 2018, 93, 325–338. [Google Scholar] [CrossRef]
- Aoki, K.; Shirasagi, S.; Yamamoto, T.; Inou, M.; Nishioka, K. Examination of the application of drill Logging to predict ahead of the tunnel face. In Proceedings of the 54th Annual Conference of the Japan Society of Civil Engineers, Tokyo, Japan, 22–24 September 1999; pp. 412–413. [Google Scholar]
- Yue, Z.Q.; Lee, C.F.; Law, K.T.; Tham, L.G. Automatic monitoring of rotary-percussive drilling for ground characterization—Illustrated by a case example in Hong Kong. Int. J. Rock Mech. Min. Sci. 2004, 41, 573–612. [Google Scholar] [CrossRef]
- Teale, R. The concept of specific energy in rock drilling. Int. J. Rock Mech. Min. Sci. Geomech. Abstr. 1965, 2, 57–73. [Google Scholar] [CrossRef]
- Leung, R.; Scheding, S. Automated coal seam detection using a modulated specific energy measure in a monitor-while-drilling context. Int. J. Rock Mech. Min. Sci. 2015, 75, 196–209. [Google Scholar] [CrossRef]
- Celada, B.; Galera, J.; Muñoz, C.; Tardáguila, I. The use of the specific drilling energy for rock mass characterisation and TBM driving during tunnel construction. In Proceedings of the ITA-AITES World Tunnel Congress, Budapest, Hungary, 23–28 May 2009; pp. 1–13. [Google Scholar]
- Masayuki, Y.; Ishiyama, K.; Yumura, T.; Tsukada, J. Application of drilling survey system for weak rock with in-flow water. In Proceedings of the 31st Symposium on Rock Mechanics, Tokyo, Japan, 7–8 January 2001; pp. 191–195. [Google Scholar]
- Akagi, W.; Sano, A.; Shinji, M.; Nishi, T.; Nakagawa, K. A new rock mass classification method at tunnel face for tunnel support system. Doboku Gakkai Ronbunshu 2001, 2001, 121–134. [Google Scholar] [CrossRef]
- Schubert, W.; Steindorfer, A.; Button, E.A. Displacement monitoring in tunnels—An overview. Felsbau 2002, 20, 7–15. [Google Scholar]
- Bizjak, K.F.; Petkovšek, B. Displacement analysis of tunnel support in soft rock around a shallow highway tunnel at Golovec. Eng. Geol. 2004, 75, 89–106. [Google Scholar] [CrossRef]
- Grima, M.A.; Babuška, R. Fuzzy model for the prediction of unconfined compressive strength of rock samples. Int. J. Rock Mech. Min. Sci. 1999, 36, 339–349. [Google Scholar] [CrossRef]
© 2020 by the authors. Licensee MDPI, Basel, Switzerland. This article is an open access article distributed under the terms and conditions of the Creative Commons Attribution (CC BY) license (http://creativecommons.org/licenses/by/4.0/).