Abstract
The excessive use of power electronics makes power quality problems in power grids increasingly prominent. The estimation of the harmonic parameters of harmonic sources in the power grid and the division of harmonic responsibilities are of great significance for the evaluation of power quality. At present, methods for estimating harmonic parameters and harmonic responsibilities need to provide the amplitude and phase information of the current and voltage of the point of common coupling (PCC). However, in practical engineering applications, the general power quality monitor only provides the amplitude information of the voltage and current of the measured point and the phase difference information between them. Missing phase information invalidates existing methods. Based on the partial least squares regression method, the present work proposes a method for estimating harmonic parameters in the case of monitoring data without phase. This method only needs to measure the amplitude information of the harmonic voltage and current of the PCC and the phase difference between them, then use the measurable data to estimate the harmonic parameters and the harmonic responsibility of each harmonic source. It provides a new way to effectively solve the problem that the measured data of the project has no phase information. The feasibility and effectiveness of the proposed method are proved by simulation data and measured engineering data.
1. Introduction
With the development of electronic technology, power electronic equipment is widely used. Power electronic equipment has non-linear and fast switching characteristics. This non-linear time-varying load is extremely prone to generate harmonics. Power quality problems caused by harmonics have received extensive attention [1]. The prerequisite for evaluating and improving power quality is to evaluate the harmonic emission levels of each user reasonably. In order to evaluate the harmonic emission levels of each user correctly, it is necessary to divide the harmonic responsibility. In addition, the quantitative estimation of the harmonic responsibility of each harmonic source provides a basis for the implementation of a “reward and punishment scheme” [2]. At present, the basis for the division of harmonic responsibility is not given internationally. Most methods project the harmonic voltage generated at the PCC when the harmonic source acts alone to the harmonic voltage of the PCC. The size and direction of the projection is an evaluation indicator for dividing the harmonic responsibility [3,4,5,6,7,8,9]. In recent years, research on the division of harmonic responsibilities has been carried out step-by-step. The main assessment methods can be divided into “intervention” and “non-intervention” methods [10,11,12,13,14,15,16,17]. At present, non-intervention methods are more commonly used. Harmonic parameters can be estimated without disturbing the normal operation of the power system. This requires extracting more information from the limited measurement data. Machine learning is a data processing method that can find the underlying laws and values of data from massive amounts of data. It has the advantages of fast running speed, high accuracy, and high efficiency. Experts and scholars have introduced machine learning methods into the field of power quality and achieved good results [18,19,20]. Regression algorithms in machine learning are fast, accurate and are widely used in non-intervention methods. For better analysis, the methods of estimating harmonic responsibility are further divided into direct and indirect algorithms:
- Indirect algorithm first estimates harmonic parameters. The harmonic responsibility of each harmonic source can then be estimated [5,6,7,8]. The complex linear least square method is used to estimate the harmonic impedance and background harmonic voltage, thereby realizing the quantitative calculation of the harmonic responsibility of the harmonic source for the concerned bus [5]. The combination of the dominant fluctuation filtering method and the quantile regression method is adopted to divide the user’s harmonic responsibility [6]. Ridge estimation method is used to estimate the harmonic impedance, which can better improve the ill-conditioned solution when the coefficient matrix is ill-conditioned [7]. To improve the robustness of the algorithm, a robust regression method in the complex domain is used to quantitatively estimate the harmonic responsibility of the harmonic source [8]. The above methods all require the amplitude and phase information of the harmonic voltage and harmonic current at the PCC. General power quality monitors can only provide the phase difference between harmonic voltage and harmonic current, not their phase values. In addition, the phase information of higher harmonics is more difficult to measure. This makes the above method ineffective in practical engineering applications.
- The direct algorithm estimates the harmonic responsibility of each harmonic source directly, such as the complex least squares method and partial least squares method [3]. Aiming at the problem of centralized multiple harmonic source responsibility division, [3] proposed a research method of evaluating harmonic responsibilities based on measured data. This method only needs the amplitude information of the harmonic voltage and harmonic current at the PCC and does not need the phase information. However, this method has the disadvantage that it cannot estimate harmonic parameters such as harmonic impedance.
In order to estimate harmonic parameters with measurable information, [21] proposed a method for harmonic impedance estimation on the system side based on measurement data without phase angle. This method requires amplitude information and phase difference of the harmonic voltage and harmonic current, which can be measured by a general power quality monitor. However, [21] has not established a model applicable to multiple harmonic sources, which makes this method unsuitable for the situation where multiple harmonic sources are common in practice. In addition, [21] did not further calculate parameters such as harmonic responsibility of each harmonic source. [22] proposed a method of impedance calculation based on particle swarm optimization. Impedance parameters between nodes can be calculated. However, this method involves the measurement and calculation of multiple nodes. There are many equations, and the method is complicated.
Aiming at the above problems, the main contributions of this paper are as follows:
- This paper presents a method for estimating harmonic parameters. The proposed method only needs the amplitude information and phase difference of the harmonic voltage and harmonic current at the PCC. It solves the problem that the harmonic parameters cannot be estimated due to the difficulty of measuring the phase value of the data. Compared with traditional direct algorithms, more harmonic parameters can be estimated. Compared with traditional indirect algorithms, there is no need to measure the data phase value information.
- This paper derives a mathematical model that can be used in practice based on the linear regression model. This model is not only applicable to the case of a single harmonic source, but also to the case of multiple harmonic sources that are common in practice. Harmonic parameters such as the harmonic contribution impedance, harmonic contribution voltage, and the harmonic responsibility of each harmonic source can be estimated.
- In order to verify the effectiveness of the proposed method, the estimation accuracy of this method, and the traditional linear regression method are compared.
- This paper provides a new idea for estimating the harmonic parameters of the system, especially for the higher harmonics whose phase value information cannot be accurately measured. The proposed method has less calculation and is easy to implement.
2. Evaluation Model of Harmonic Responsibility
2.1. Definition of Harmonic Responsibility
In the power system, the feeders are connected to the PCC bus. There are some linear loads and nonlinear harmonic sources on the feeder. The schematic diagram of the power system is shown in Figure 1. According to the theory of harmonic power flow calculation, the fundamental power flow and the harmonic power flow can be calculated separately [3]. The following research on harmonic identification is at harmonic frequency (h = 0,1,2,...).
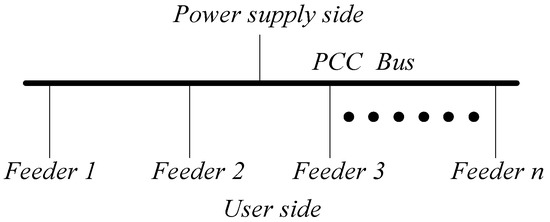
Figure 1.
Schematic diagram of the power system with multiple feeders connected to the point of common coupling (PCC) bus.
For the study of single harmonic source identification, the power supply side of the power system can be equivalent to the Thevenin equivalent circuit and the user side equivalent to the Norton circuit. The equivalent circuit diagram is shown in Figure 2. The power supply side contains an equivalent harmonic voltage source () and a harmonic impedance (). The user side contains an equivalent harmonic current source () and a harmonic impedance (). There is a harmonic voltage () at the PCC and harmonic current () flows. According to the same idea, an equivalent circuit suitable for multiple harmonic sources is established as shown in Figure 3. Similarly, there is an equivalent harmonic voltage source () and a harmonic impedance () on the power supply side. The user side contains n feeders. Each feeder contains an equivalent harmonic current source () and a harmonic impedance () (). There is a harmonic voltage () at the PCC, and each feeder connected to it also contains a harmonic current ().
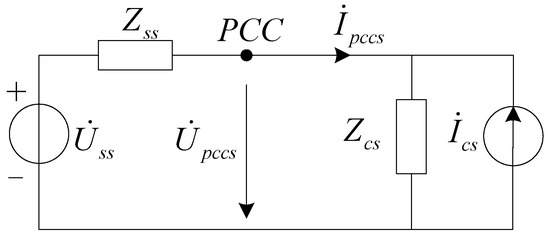
Figure 2.
Equivalent circuit to identify a single harmonic source.
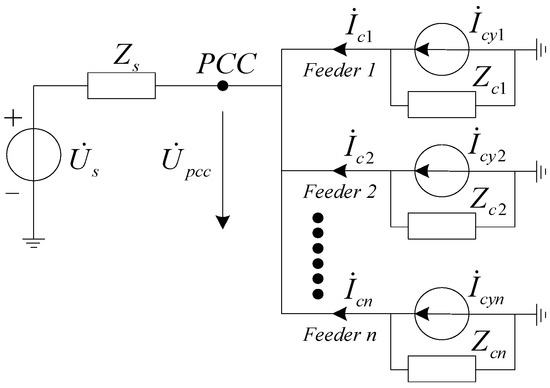
Figure 3.
Equivalent circuit of the power system with concentrated multiple harmonic feeders.
When the harmonic source on each feeder acts independently, harmonic voltage () will be generated at the PCC. According to the superposition theorem, the vector sum of the background harmonic voltage () and these harmonic voltages is the harmonic voltage () at the PCC. It can be expressed as:
The phasor relationship of the harmonic voltages is shown in Figure 4. There is a phase angle () () between the harmonic voltage () generated by each harmonic source at the PCC point and the harmonic voltage () at the PCC.
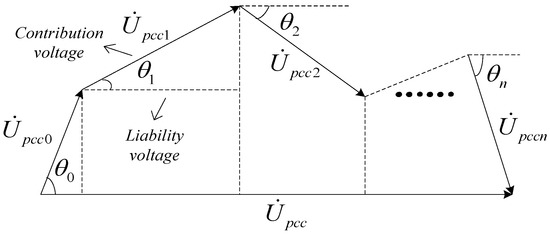
Figure 4.
Phasor projection diagram of the harmonic voltages.
The harmonic voltage () generated by the harmonic source at the PCC is projected onto the harmonic voltage () at the PCC. The scale of the projection is considered to be the magnitude of harmonic responsibility. The projection direction is positive, which indicates that the harmonic source emits harmonics; otherwise, it indicates that the harmonic source absorbs harmonics. The harmonic responsibility of the harmonic source can be quantitatively expressed as:
2.2. Shortcomings of Existing Estimation Methods
In order to accurately estimate the harmonic responsibility of harmonic sources, experts and scholars have conducted a lot of research [3,4,5,6,7,8,9,10,11,12,13,14,15,16,17]. These methods can be divided into direct algorithms and indirect algorithms. The idea of the direct algorithm is to use linear regression to estimate the harmonic responsibility directly, which only needs the amplitude information of the harmonic voltage and harmonic current. But this algorithm cannot estimate harmonic parameters such as harmonic impedance. The idea of the indirect algorithm is to estimate the harmonic impedance first, then calculate the harmonic contribution voltage of each harmonic source, and then calculate the harmonic responsibility. Although this method can estimate multiple harmonic parameters, the method fails when the power quality monitor cannot accurately measure the phase value information. The method of manually constructing the phase can avoid the failure of the indirect algorithm, but it will introduce uncontrollable errors [21].
The following sections will analyze the classic algorithms of the two methods in detail.
2.2.1. Direct Method for Estimating Harmonic Responsibility
In the direct algorithm, [3] established a model for assessing the harmonic responsibility of multiple harmonics, and solved it by linear regression. Take the direct algorithm proposed in [3] as an example for analysis. Based on the phasor relationship in Figure 4, it can be obtained as
where
where is the harmonic contribution impedance of the feeder i in the power system. It is the parallel value of other harmonic impedances, except feeder i.
The harmonic voltage () at the PCC point is considered as the dependent variable. The harmonic current of each feeder () is considered an independent variable. Linear regression is performed on equation (3) to get the regression coefficient (). The calculation method of the harmonic responsibility of each harmonic source is as follows:
According to the above analysis, the estimated characteristics of the direct method are as follows:
- (1)
- From the perspective of information input, the direct algorithm only needs the amplitude information of the harmonic voltage and harmonic current.
- (2)
- From the perspective of information output, the direct algorithm can only estimate the harmonic liability, but cannot estimate other harmonic parameters.
- (3)
- The direct algorithm does not use the phase difference information of the harmonic voltage and harmonic current measured by the power quality monitor so that the algorithm cannot estimate other harmonic parameters.
2.2.2. Indirect Method for Estimating Harmonic Responsibility
In the indirect algorithm, paper [7] first estimates the harmonic impedance parameters and then calculates the harmonic responsibility of each harmonic source. Take the indirect algorithm proposed in [7] as an example of the analysis. The phasor relationship in Figure 4 can be expressed as:
When the phase values of the harmonic voltage and harmonic current are known, the real and imaginary parts of equation (6) can be expanded as:
The subscript x of the variable represents the real part, and the subscript y represents the imaginary part. The harmonic voltage is considered as the dependent variable, and the harmonic current is considered as the independent variable. Linear regression is performed on Equation (7) to obtain the harmonic impedance (). The harmonic contribution voltage () of the harmonic source can be expressed as:
The harmonic responsibility can be calculated as:
In summary, the estimation characteristics of the indirect algorithm are as follows:
- (1)
- From the perspective of information input, the amplitude information and phase information of the harmonic voltage and harmonic current are required.
- (2)
- From the perspective of information output, harmonic parameters including harmonic contribution impedance, harmonic contribution voltage, and harmonic responsibility can be estimated.
- (3)
- When the phase information of the harmonic voltage and harmonic current is missing, the phase needs to be constructed artificially to avoid indirect algorithm failure, as this will inevitably cause errors.
2.2.3. The Basic Principle of the Proposed Algorithm
According to the equivalent circuit in Figure 3, the phasor relationship in Figure 4 can be expressed as:
Note that the harmonic current () in equation (10) is the harmonic current of the equivalent harmonic source, and the harmonic impedance () is the parallel value of all harmonic impedances in the power system. The harmonic current () in equation (6) is the harmonic current of the feeder, and the harmonic impedance () is the parallel value of all harmonic impedances in the system except the feeder. The harmonic impedance in Equation (10) is called the total harmonic impedance, and it can be expressed as:
In order to further distinguish the physical meaning of the total harmonic impedance and the harmonic contribution impedance, the equivalent circuit when a single harmonic source acts alone is shown in Figure 5.
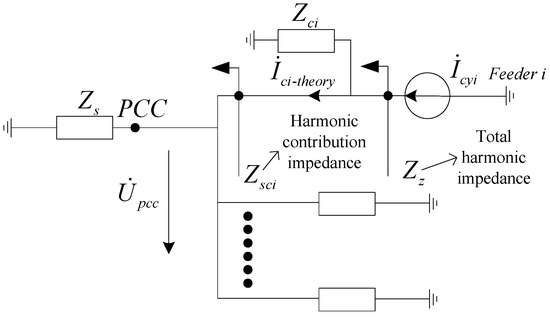
Figure 5.
The equivalent circuit of the system when the feeder i acts alone.
When the harmonic source acts alone, the theoretical harmonic current () on the feeder can be expressed as:
In practical power systems, the harmonic impedance on the user side is much larger than the harmonic impedance on the power supply side (). Equation (12) can be approximated as:
The actual harmonic current on the feeder is approximately equal to the theoretical harmonic current [3], which is expressed as:
Equation (10) can be rewritten as:
We conjugate the two ends of equation (15) and multiply the harmonic voltage () at both ends of the equation. The resulting equation is expressed as
where and can be expressed as:
where represents the apparent power of feeder i. and represent the active power and reactive power of feeder i, respectively. Superscript * indicates the conjugate of a variable.
In Equation (16), the algebraic formula () can be regarded as a constant (). Take the real part of equation (16), and it can be rewritten as:
In Equation (18), the active () and reactive power () of feeder i are used as independent variables, and the harmonic voltage () at the PCC is used as the dependent variable. The total harmonic impedance can be estimated by linear regression. Further, the harmonic contribution voltage of feeder i can be calculated, which can be expressed as:
Since the general power quality monitor can only measure the phase difference of the harmonic voltage and harmonic current instead of their phase values, the phase difference is taken as the phase value of the harmonic current in Equation (19). The phase of the calculated harmonic contribution voltage is the phase difference between the harmonic contribution voltage () and the harmonic voltage () at the PCC. This processing method does not affect the calculation of harmonic responsibility of feeder i. Harmonic responsibility can still be estimated by Equation (9).
In summary, the harmonic parameters estimated in this paper include the total harmonic impedance of the system, the harmonic contribution voltage of each feeder, and the harmonic responsibility of each feeder. The total harmonic impedance can be estimated by linear regression. And the harmonic contribution voltage of each feeder can be estimated by Equation (19). After estimating the harmonic contribution voltage of each feeder, the harmonic responsibilities of each feeder can be estimated by Equation (9).
The characteristics of the algorithm in this paper are as follows:
- (1)
- The harmonic parameters, including the total harmonic impedance of the feeder i, the harmonic contribution voltage of the feeder i, and the harmonic responsibility of the feeder i can be estimated by the algorithm.
- (2)
- During the estimation process, the harmonic voltage at the PCC, and the power of each feeder are required. The calculation of power parameters no longer requires the phase values of the harmonic voltage and harmonic current, only their phase difference. This makes it possible to estimate harmonic parameters such as harmonic impedance with a general power quality monitor.
Compared with the above-mentioned classic algorithm, this algorithm has the following advantages:
- (1)
- Compared with the direct algorithm, the algorithm can estimate the harmonic parameters such as total harmonic impedance, in addition to the harmonic responsibility.
- (2)
- Compared with indirect algorithms, the parameters required for the algorithm can be measured with a general power quality monitor.
3. Simulation Verification
As the proposed algorithm is applicable to harmonics of any frequency, the simulations are performed at the 3rd harmonic frequency.
In the simulation, the estimation capabilities of the following four methods are compared:
Ideal Method: The phase values of the harmonic voltage and harmonic current are used for estimation. Harmonic parameters can be estimated from existing linear regression models.
Proposed Method: The phase difference between the harmonic voltage and the harmonic current is used for estimation. Harmonic parameters can be estimated by the linear model proposed in this paper.
Random Phase Method: The phase is constructed by the random phase method, and then the harmonic parameters are estimated by the existing linear regression model.
Zero Phase Method: The zero phase method is used to construct phase, and then the harmonic parameters are estimated by the existing linear regression model.
3.1. The Case of a Single Harmonic Source
To establish a simulation model according to the equivalent circuit diagram shown in Figure 2, we set the harmonic voltage amplitude at the power supply side to 50 V, the phase angle to 50 degrees, and the harmonic impedance to 7+ 50 j. The amplitude of the user-side harmonic current source was set to 12 A, the phase angle was 180 degrees, and a disturbance signal was added. We set the harmonic impedance on the user side to 80 + 800 j.
Considering that the harmonic impedance on the user side is much larger than the harmonic impedance on the power supply side, the total harmonic impedance can be approximately equivalent to the harmonic contribution impedance of the harmonic source. The estimation results of the harmonic parameters on the user side are shown in Table 1.

Table 1.
Error of parameter estimation of a single harmonic source.
According to the simulation results, the following conclusions can be drawn:
When the phase value of the data can be measured, it is very accurate to use the ideal method to estimate the harmonic parameters. When the phase value information of the data is missing, the relative error of the harmonic parameters estimated by the proposed method was less than 5%, and the absolute error of the estimated phase angle was less than 0.02. In the case of a single harmonic source, the error of the phase angle of the harmonic parameters estimated by the random phase method and zero phase method is acceptable, but the error of the estimated value of the modulus is large.
Considering that there are often multiple harmonic sources in the actual power system, the model of a single harmonic source is not applicable. The situation of multiple harmonic sources was analyzed, and is discussed below.
3.2. The Case of Multiple Harmonic Sources
In the simulation, it was assumed that three feeders on the user side contain harmonic sources. We set the amplitude of the equivalent harmonic voltage source on the power supply side to 50V, the phase angle to 60 degrees, and the harmonic resistance to . We set the amplitude of the equivalent harmonic electric current source of the user-side feeder to 11A, 16A, and 20A in sequence, and the phase angle to be 1 radian, 2 radians, and 3 radians in order. The harmonic impedance of each feeder on the user side was set to . In order to simulate the fluctuations in the system, we added a noise signal to each feeder on the user side, and set the current amplitude fluctuation within 5%. Considering that , the total harmonic impedance is approximately equivalent to the harmonic contribution impedance of the feeder. The harmonic parameters of the system can be estimated by different methods, and the relative errors of each parameter are shown in Table 2.
Table 2.
Relative error of parameter estimation of a single harmonic source.
In Table 2, feeder 0 indicates the power supply side.
In the simulation, the theoretical harmonic responsibilities of feeders 1 to 3 were 13.66%, 51.22%, and 44.34% in turn. The theoretical harmonic responsibility of the power supply side was −9.22%. The conclusions that can be drawn from Table 2 are as follows:
- (1)
- From the aspect of estimation accuracy, the relative error of the ideal method and the proposed method is small, and the estimation error of most parameters is controlled within 5%. The relative errors of the random phase and zero phase methods are very large, and the estimation error of most parameters is more than 10%. It can be seen that the estimation accuracy of the ideal method and the proposed method was better.
- (2)
- From the perspective of the difficulty of implementing the algorithm, the ideal method requires the phase values of the harmonic voltage and harmonic current, but the general power quality monitor can only provide the phase difference between them. Compared with the ideal method, other methods estimate harmonic parameters based on phase difference information, and the methods are easier to implement.
In the method proposed in this paper, when estimating the harmonic responsibility, the estimation error of the harmonic responsibility of the power supply side and feeder 1 is large, both exceeding 10%. Because they have less harmonic responsibility, small absolute errors can also cause large relative errors. It can be seen that the proposed method has better estimation accuracy for feeders with larger harmonic responsibilities
In order to explore the influence of different background harmonics on the above four methods, we changed the amplitude of the background harmonics, and estimated the harmonic parameters of each feeder through four methods. Considering that more attention is paid to feeders with higher harmonic responsibility in practice, four different methods were used to estimate the harmonic parameters of feeder 2 with higher harmonic responsibility. In order to evaluate the magnitude of the background harmonic, the ratio of the amplitude of the harmonic contribution voltage generated by feeder 2 to the amplitude of the background harmonic voltage is defined as the parameter m. (). The larger the parameter m, the larger the background harmonics. The relative errors of the harmonic parameters estimated by the four methods are shown in Figure 6, Figure 7 and Figure 8.
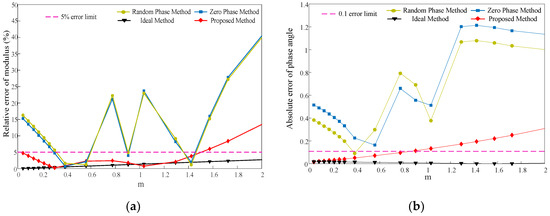
Figure 6.
(a) Relative error of the modulus value of the harmonic contribution voltage of feeder 2; (b) Absolute error of phase value of the harmonic contribution voltage of feeder 2.
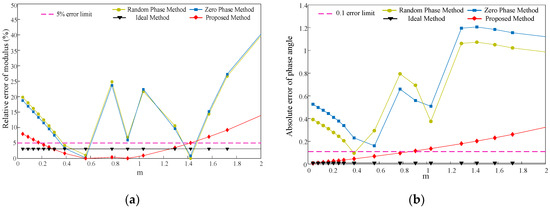
Figure 7.
(a) Relative error of the modulus value of the harmonic contribution impedance of feeder 2; (b) Absolute error of phase value of the harmonic contribution impedance of feeder 2.
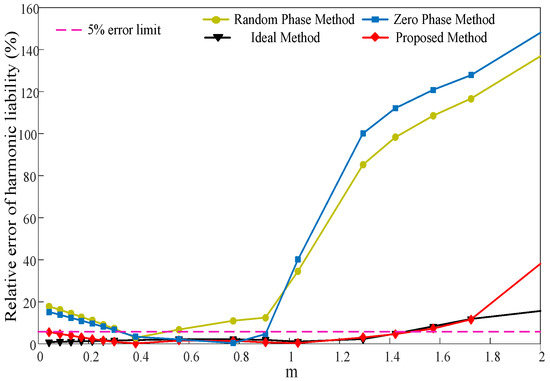
Figure 8.
Relative error of harmonic responsibility of feeder 2.
From the figure above, the following conclusions were obtained:
- (1)
- The estimation capabilities of the random phase method and the zero phase method are unstable, and the estimation errors of the two methods are relatively worse in most cases. In contrast, the ideal method and proposed method have more stable estimation capabilities and better.
- (2)
- From the perspective of changing trends, the estimation ability of the proposed method will deteriorate as the background harmonics become larger. The ideal method also has the same trend in estimating harmonic responsibility.
- (3)
- When the background harmonic voltage is low, the estimation error of the proposed method to estimate each harmonic parameter can be controlled within 5%. When the amplitude of the background harmonic voltage reaches the amplitude of the harmonic contribution voltage of the feeder, the harmonic parameters obtained by the proposed method are also acceptable.
In summary, when the phase values of the harmonic voltage and harmonic current can be measured, it is accurate to estimate the harmonic parameters by the existing methods. However, in practice, ordinary power quality monitors can only provide the phase difference between the harmonic voltage and the harmonic current. The errors introduced by constructing the phase are uncontrollable, and such methods are not desirable. In contrast, the method proposed in this paper can directly use phase difference information to estimate harmonic parameters with high accuracy.
4. Instance Verification
In this section, the proposed algorithm is verified by using residential electricity and electrified railways as examples. Due to the particularity of the load in electrified railways, the problems arising should be taken seriously [23,24].
4.1. The Case of Residential Electricity
The data of this example came from the experimental platform. The bus voltage was 220 V, and the frequency was 50 Hz. Three feeders were connected to the bus. Feeder A contained electrical appliances, feeder B was connected to a resistor, and feeder C was connected to a reactance. The schematic diagram of the experiment is shown in Figure 9.
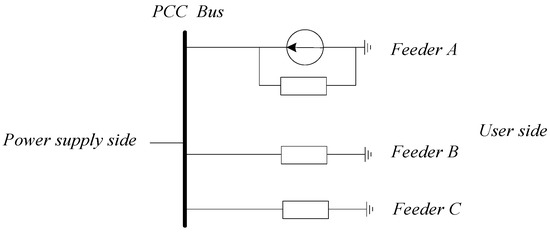
Figure 9.
Schematic of the experimental system.
The sampling frequency of the measuring device was 25,600 Hz. Considering the measurement time and the linear regression method used, harmonic parameters can be estimated with samples from 600 cycles. The 13th and 21st harmonics were used as examples to estimate the harmonic parameters of each feeder.
The measurement data at the 13th harmonic frequency is shown in Figure 10.
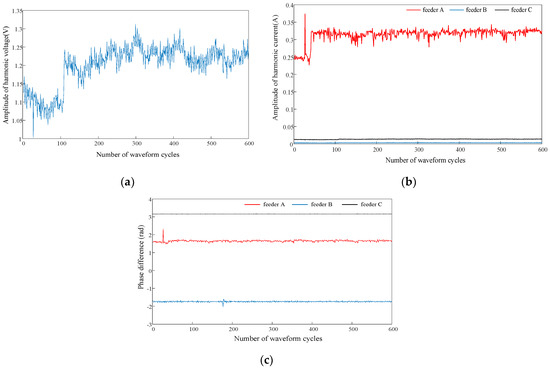
Figure 10.
(a) Harmonic voltage data at PCC point; (b) Harmonic current data of each feeder; (c) Phase difference data between harmonic voltage and harmonic current of each feeder.
The harmonic parameters of each feeder obtained by different algorithms are shown in Table 3.
Table 3.
Results of different methods for estimating harmonic parameters.
In Table 3, feeder 0 indicates the power supply side.
In this example, feeder A contains harmonic sources, and feeder B and feeder C do not contain harmonic sources. The harmonic responsibility () of each feeder should have the following relationship:
The measurement data at the 21st harmonic frequency is shown in Figure 11.
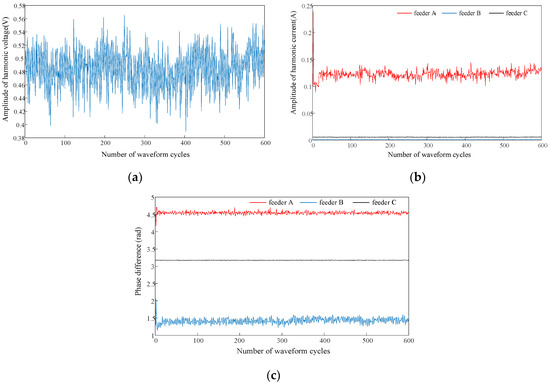
Figure 11.
(a) Harmonic voltage data at PCC point; (b) Harmonic current data of each feeder; (c) Phase difference data between harmonic voltage and harmonic current of each feeder.
The harmonic parameters of each feeder obtained by different algorithms are shown in Table 4.
Table 4.
Results of different methods for estimating harmonic parameters.
In Table 4, feeder 0 indicates the power supply side.
4.2. The Case of Electrified Railway
Measurement data comes from a traction substation. During the measurement period, two trains were running on two feeders, respectively. The schematic of this example is shown in Figure 12.
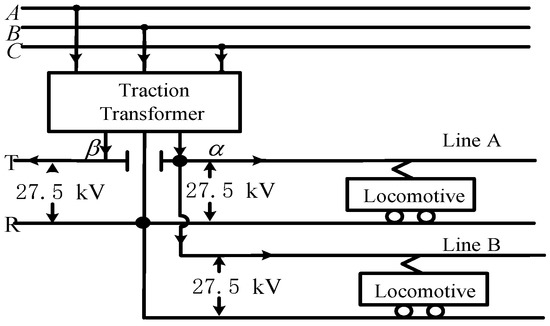
Figure 12.
Schematic diagram of the “traction net-locomotive” system.
The sampling frequency of the measuring device was 25,600 Hz. Considering that the locomotive is a special load, it emits not only odd harmonics but also higher harmonics. Taking the 11th and 31st harmonics as examples, different methods were used to estimate the harmonic parameters of the two feeders.
The measured data at the 11th harmonic frequency is shown in Figure 13.
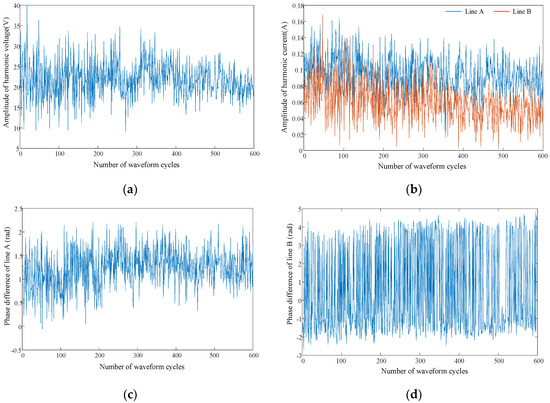
Figure 13.
(a) Harmonic voltage data at PCC point; (b) Harmonic current data of each feeder; (c) Phase difference data between harmonic voltage and harmonic current of Line A; (d) Phase difference data between harmonic voltage and harmonic current of Line B.
The harmonic parameters of each feeder obtained by different algorithms are shown in Table 5.
Table 5.
Results of different methods for estimating harmonic parameters.
The measured data at the 31st harmonic frequency is shown in Figure 14.
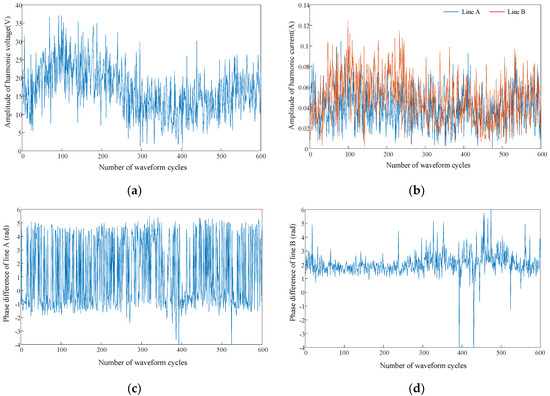
Figure 14.
(a) Harmonic voltage data at PCC point; (b) Harmonic current data of each line; (c) Phase difference data between harmonic voltage and harmonic current of Line A; (d) Phase difference data between harmonic voltage and harmonic current of Line B.
The harmonic parameters of each feeder obtained by different algorithms are shown in Table 6.
Table 6.
Results of different methods for estimating harmonic parameters.
In practical traction systems, locomotives are the main source of higher harmonics. The locomotive should bear the main harmonic responsibility. The harmonic responsibilities estimated by the proposed method are basically consistent with the actual situation.
The feasibility and accuracy of the method proposed in this paper were further proven by the two examples above.
5. Discussion
Simulation and experimental results demonstrated the feasibility and accuracy of the proposed method in actual engineering. Compared with the method of constructing the phase (random phase and zero phase methods), the proposed method had a high estimation accuracy. This is because the method of constructing the phase introduces uncontrollable errors, and the proposed algorithm directly uses the measurement data. Compared with the estimation method using the data phase value (ideal method), the error produced by the proposed algorithm was slightly larger. This is because the proposed method performed a power operation on the original data, amplifying the error to some extent.
6. Conclusions
In this paper, a linear model was derived, and phase values of harmonic voltage and harmonic current were no longer needed in the estimation process. The proposed algorithm uses the phase difference information and amplitude information of the harmonic voltage and harmonic current to estimate the harmonic parameters. Phase difference information and amplitude information can be measured by a general power quality monitor. This provides a new way to estimate the harmonic parameters of each feeder in practice.
The proposed algorithm has the following characteristics:
- (1)
- The estimation accuracy of this algorithm will be affected by background harmonics. It has the same characteristics as the method proposed in [21].
- (2)
- When the algorithm estimates the harmonic responsibility of the feeder, the estimation accuracy is higher for the feeder with larger harmonic responsibility.
- (3)
- From the perspective of the complexity of the algorithm, although the derivation process may be slightly complicated, the algorithm in this paper still uses linear regression to estimate the total harmonic impedance. Linear regression does not take a long time, so the execution time of the algorithm in this article is short.
Considering that the background harmonics will affect the estimation ability of the algorithm, future research will improve the robustness of the algorithm.
Author Contributions
For research articles with several authors, a short paragraph specifying their individual contributions must be provided. Conceptualization, F.Z. and F.L.; Methodology, F.Z.; Validation, F.L. and R.Y.; Formal analysis, F.L.; Investigation, R.Y.; Resources, H.L.; Writing—original draft preparation, F.L.; writing—review and editing, R.Y. All authors have read and agreed to the published version of the manuscript.
Funding
This paper was funded by technology project of China Southern Power Grid Corporation (ZBKJXM20180044).
Conflicts of Interest
The authors declare that they have no conflicts of interest.
References
- Yuanyuan, S.; Zhiming, Y. Quantifying harmonic responsibilities of multiple harmonic sources based on M-estimation robust regression. Proc. CSEE 2012, 32, 166–173. [Google Scholar]
- McEachern, A.; Grady, W.M.; Moncrief, W.A.; Heydt, G.T.; McGranaghan, M. Revenue and harmonics: An evaluation of some proposed rate structures. IEEE Trans. Power Deliv. 1995, 10, 474–482. [Google Scholar] [CrossRef]
- Yuanyyuan, S.; Jiaqi, L.; Zhiming, Y. Quantifying harmonic impacts for concentrated multiple harmonic sources using actual data. Proc. CSEE 2014, 34, 2164–2171. [Google Scholar]
- Hui, W.; Wei, L.; Qunzhan, L.; Dong, Y.; Cheng, G. Responsibility distinction for multiple harmonic sources based on partial least square in complex field and equivalent method. Autom. Electr. Power Syst. 2017, 41, 78–85. [Google Scholar]
- Jia, X.; Hua, H.; Cao, D.; Zhao, C. Determining harmonic contributions based on complex least squares method. Proc. CSEE 2013, 33, 149–155. [Google Scholar]
- Chen, J.; Fu, L.; Zang, T.; He, Z. Harmonic responsibility determination considering background harmonic fluctuation. Electr. Power Autom. Equip. 2016, 36, 61–65. [Google Scholar]
- Jia, X.; Yue, N. A method for determination of utility harmonic responsibility using ridge estimation. Autom. Electr. Power Syst. 2015, 39, 87–92. [Google Scholar]
- Jia, X.; Dong, L. Quantifying harmonic pollution responsibilities of multiple harmonic sources based on robust. Acta Energ. Sol. Sin. 2019, 40, 1309–1315. [Google Scholar]
- Wang, Y.; Zang, T.; Fu, L.; He, Z. Harmonic Contribution Partition of Multiple Harmonic Sources Considering Background Harmonic Voltage Fluctuation. Autom. Electr. Power Syst. 2015, 39, 55–61. [Google Scholar]
- Mazin, H.E.; Xu, W.; Huang, B. Determining the Harmonic Impacts of Multiple Harmonic-Producing Loads. IEEE Trans. Power Deliv. 2011, 26, 1187–1195. [Google Scholar] [CrossRef]
- Zhang, W.; Yang, H. A method for assessing harmonic emission level based on binary linear regression. Proc. CSEE 2004, 24, 54–57. [Google Scholar]
- Wilsun, X.; Yilu, L. A method for determining customer and utility harmonic contributions at the point of common coupling. IEEE Trans. Power Deliv. 2000, 15, 804–811. [Google Scholar] [CrossRef]
- Huang, S.; Xu, Y. Assessing harmonic impedance and the harmonic emission Level based on partial least-squares regression method. Proc. CSEE 2007, 27, 93–97. [Google Scholar]
- Sumner, M.; Palethorpe, B.; Thomas, D.W.P. Impedance measurement for improved power quality, part I: The measurement technique. IEEE Trans. Power Deliv. 2004, 19, 1442–1448. [Google Scholar] [CrossRef]
- Xu, W.; Bahry, R.; Mazin, H.E.; Tayjasanant, T. A method to determine the harmonic contributions of multiple loads. In Proceedings of the IEEE Power & Energy Society General Meeting, Calgary, AB, Canada, 26–30 July 2009; IEEE PES: Piscataway, NJ, USA, 2009; pp. 1–6. [Google Scholar]
- Ahmed, E.E.; Xu, W. Assessment of potential harmonic problems for systems with distributed or random harmonic sources. IEE Proc. Gener. Transm. Distrib. 2007, 1, 506–515. [Google Scholar] [CrossRef]
- Omran, W.A.; El-Goharey, H.S.K.; Kazerani, M.; Salama, M.M.A. Identification and Measurement of Harmonic Pollution for Radial and Nonradial Systems. IEEE Trans. Power Deliv. 2009, 24, 1642–1650. [Google Scholar] [CrossRef]
- Yang, W.; Zhiqiang, X. Generalized phase retrieval: Measurement number, matrix recovery and beyond. Appl. Comput. Harmon. Anal. 2019, 47, 423–446. [Google Scholar]
- Xiong, J.; Li, Y.; Cao, Y.; Panasetsky, D.; Sidorov, D. Modeling and operating characteristic analysis of MMC-SST based shipboard power system. In Proceedings of the IEEE PES Asia-Pacific Power and Energy Engineering Conference (APPEEC), Xi’an, China, 25–28 October 2016; pp. 28–32. [Google Scholar]
- Tomin, N.V.; Kurbatsky, V.G.; Sidorov, D.N.; Zhukov, A.V. Machine Learning Techniques for Power System Security Assessment. IFAC PapersOnLine 2016, 49, 445–450. [Google Scholar] [CrossRef]
- Xu, F.; Zheng, H.; Yang, H.; Zhao, J.; Wang, C. Method for Harmonic Impedance Estimation on System Side Based on Measurement Data without Phase Angle. Autom. Electr. Power Syst. 2019, 43, 170–176. [Google Scholar]
- Han, S.; Kodaira, D.; Han, S.; Kwon, B.; Hasegawa, Y.; Aki, H. An Automated Impedance Estimation Method in Low-Voltage Distribution Network for Coordinated Voltage Regulation. IEEE Trans. Smart Grid 2016, 7, 1012–1020. [Google Scholar] [CrossRef]
- Yuan, C.; Yuzhuo, Z.; Tao, W.; Peng, L. Research on dynamic nonlinear input prediction of fault diagnosis based on fractional differential operator equation in high-speed train control system. Chaos 2019. [Google Scholar] [CrossRef]
- Yuan, C.; Peng, L.; Yuzhuo, Z. Parallel Processing algorithm for railway signal fault diagnosis data based on cloud computing. Future Gener. Comput. Syst. 2018, 88, 594–598. [Google Scholar]


© 2020 by the authors. Licensee MDPI, Basel, Switzerland. This article is an open access article distributed under the terms and conditions of the Creative Commons Attribution (CC BY) license (http://creativecommons.org/licenses/by/4.0/).