Environmental Impact Assessments of Integrated Food and Non-Food Production Systems in Italy and Denmark

 ,
,  ,
,  ,
,
Abstract
1. Introduction
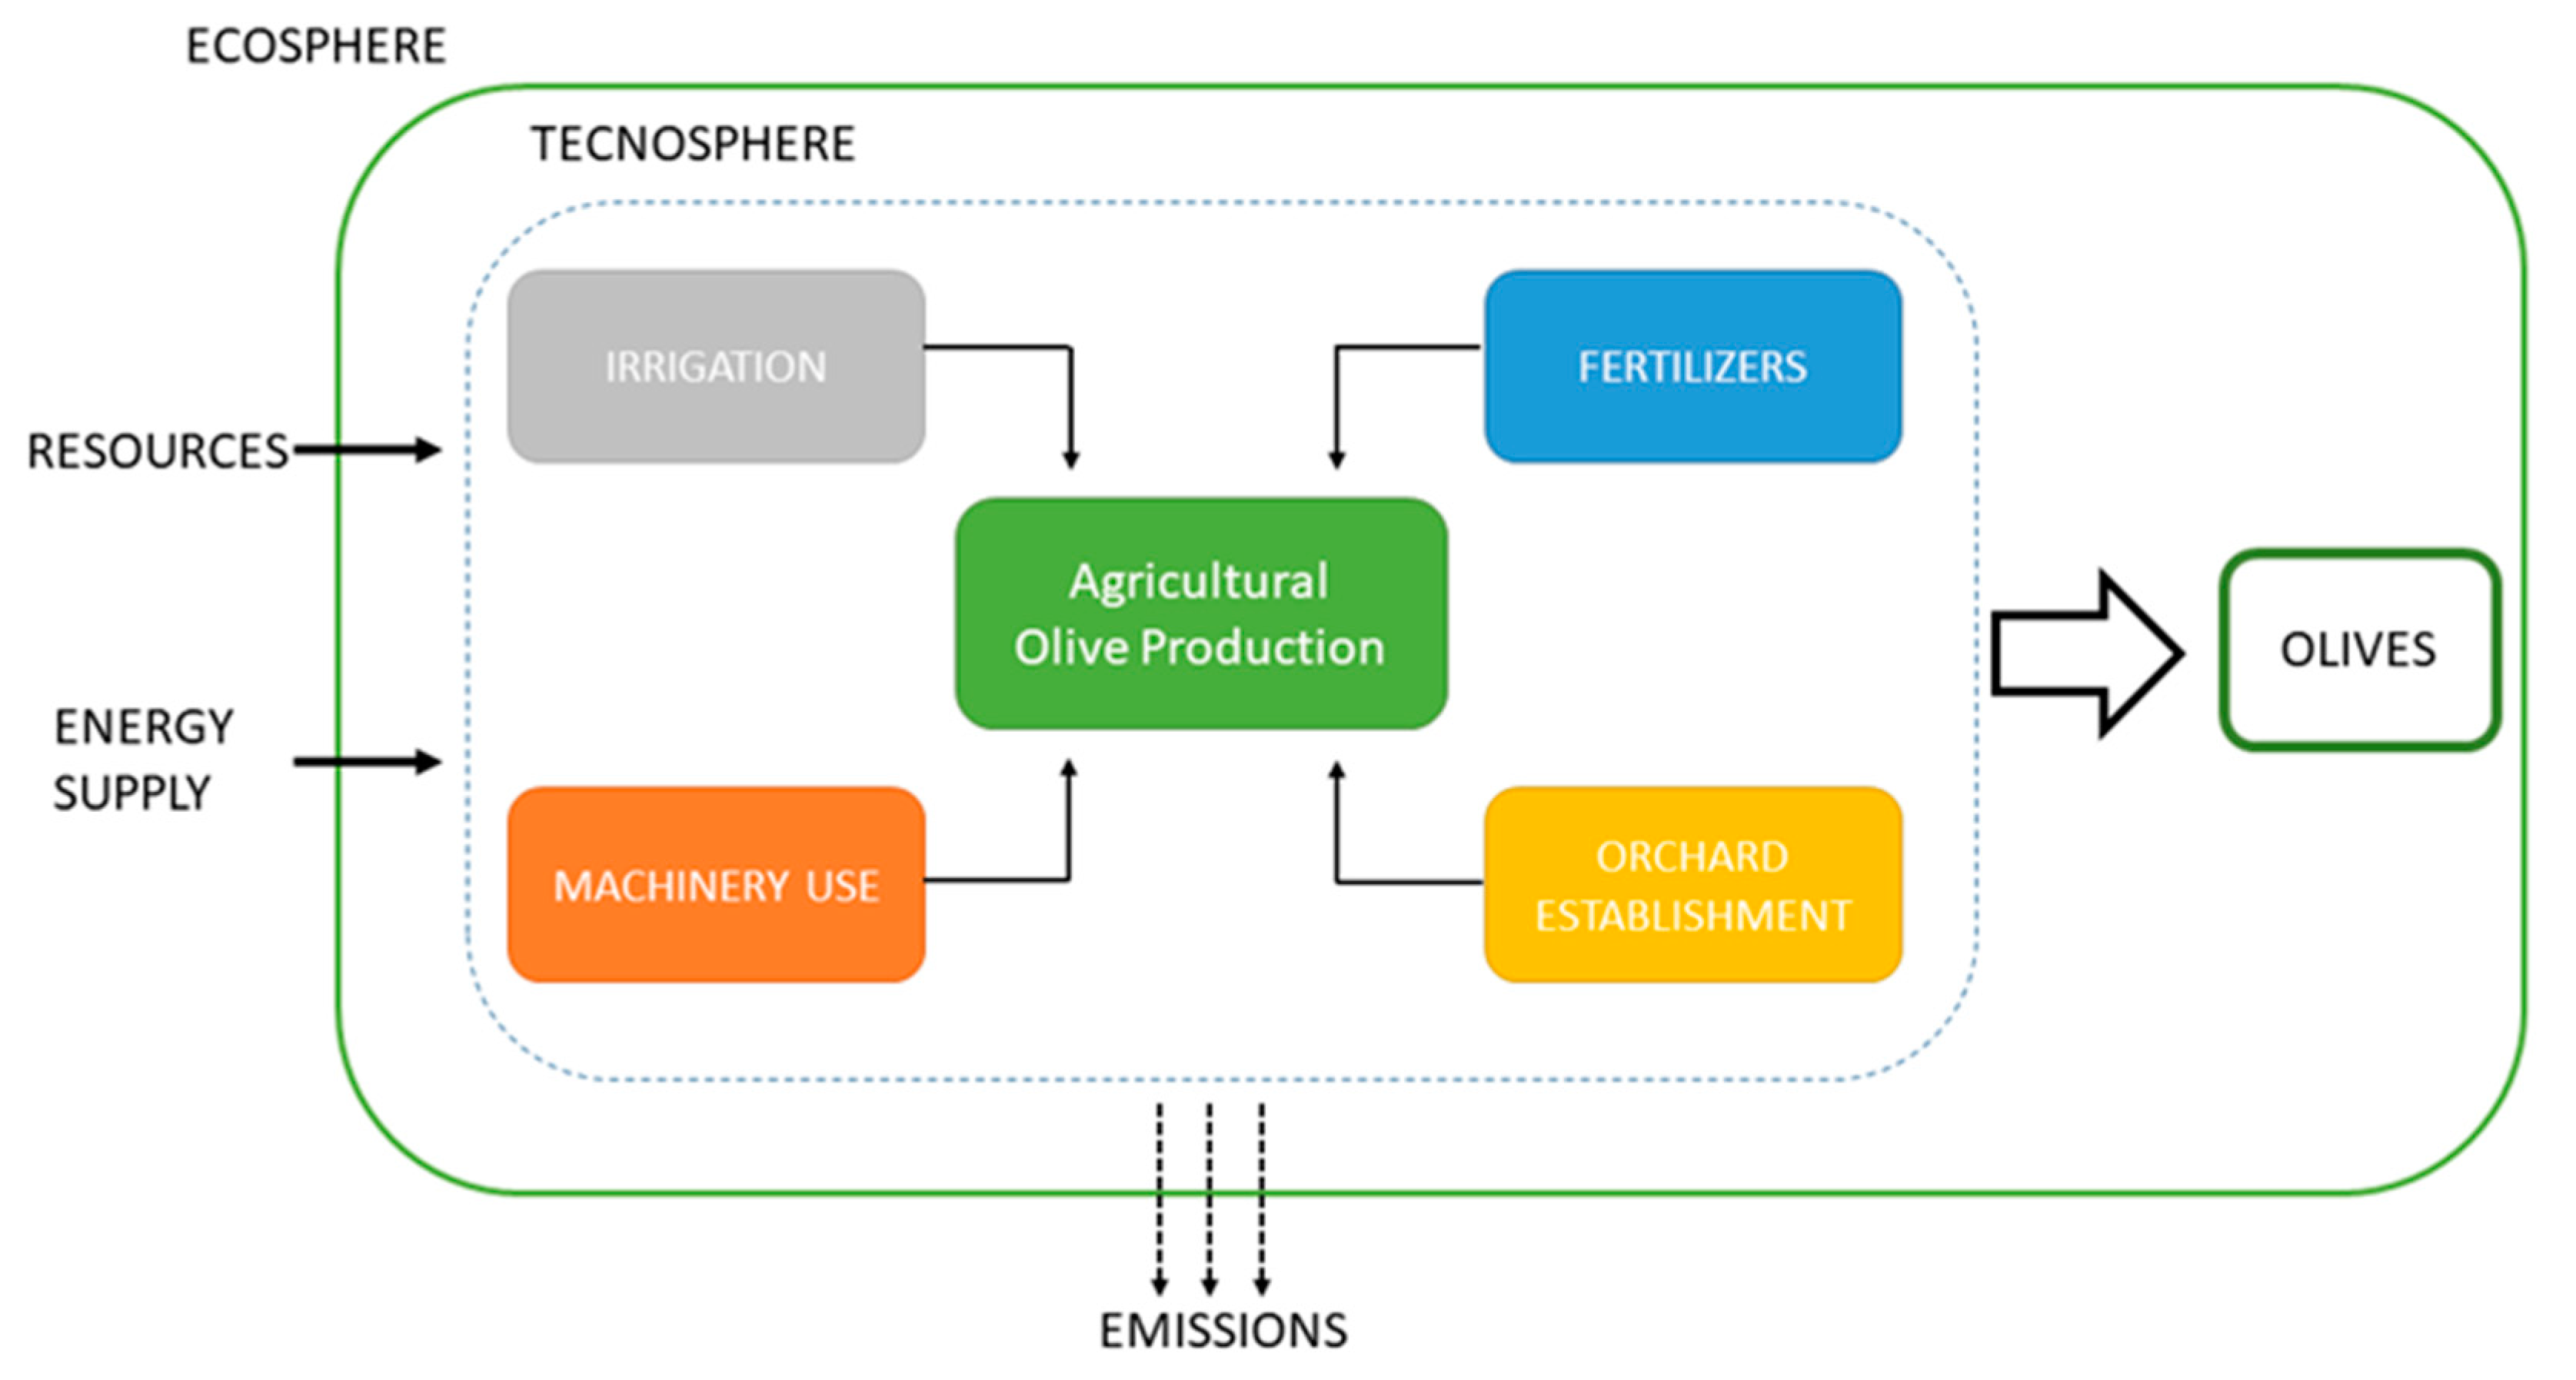
2. Method
2.1. Study Site
2.2. Data Collection
2.3. Life Cycle Analysis
3. Results
4. Discussion
5. Conclusions
Author Contributions
Funding
Conflicts of Interest
References
- FAO. Agroforestry. 2017. Available online: http://www.fao.org/forestry/agroforestry/en/ (accessed on 10 May 2019).
- Rois-Díaz, M.; Lovric, N.; Lovric, M.; Ferreiro-Donmínquez, N.; Mosquera-Losada, M.R.; Den Herder, M.; Graves, A.; Palma, J.H.N.; Paulo, J.A.; Pisanelli, A.; et al. Farmers’ reasoning behind the uptake of agroforestry practices: Evidence from multiple case-studies across Europe. Agrofor. Syst. 2018, 92, 811–828. [Google Scholar] [CrossRef]
- Den Herder, M.; Moreno, G.; Mosquera-Losada, M.R.; Palma, J.H.N.; Sidiropoulou, A.; Santiago-Freijanes, J.J.; Crous-Duran, J.; Paulo, J.A.; Tomé, M.; Pantera, A.; et al. Current extent and stratification of agroforestry in the European Union. Agric. Ecosyst. Environ. 2017, 241, 121–132. [Google Scholar] [CrossRef]
- Tsiafouli, M.A.; Thébault, E.; Sgardelis, S.P.; de Ruiter, P.C.; van der Putten, W.H.; Birkhofer, K.; Hemerik, L.; de Vries, F.T.; Bardgett, R.D.; Brady, M.V.; et al. Intensive agriculture reduces soil biodiversity across Europe. Glob. Chang. Biol. 2015, 21, 973–985. [Google Scholar] [CrossRef] [PubMed]
- Danmarks Statistik. Statistikbanken. 2019. Available online: www.statistikbanken.dk (accessed on 8 May 2019).
- Foereid, B.; Bro, R.; Mogensen, V.O.; Porter, J.R. Effects of windbreak strips of willow coppice-modelling and field experiment on barley in Denmark. Agric. Ecosyst. Environ. 2002, 93, 25–32. [Google Scholar] [CrossRef]
- Jørgensen, U.; Dalgaard, T.; Kristensen, E.S. Biomass energy in organic farming-the potential role of short rotation coppice. Biomass Bioenergy 2005, 28, 237–248. [Google Scholar] [CrossRef]
- FAOSTAT. 2016. Available online: http://www.fao.org/faostat/en/#home (accessed on 26 April 2019).
- Ramachandran Nair, P.K. (Ed.) An Introduction to Agroforestry; Kluwer Academic Publishers: Dordrecht, The Netherlands, 1993; p. 499. [Google Scholar]
- Avraamides, M.; Fatta, D. Resource consumption and emissions from olive oil production: A life cycle inventory case study in Cyprus. J. Clean. Prod. 2008, 16, 809–821. [Google Scholar] [CrossRef]
- Hanandeh, A.E.; Gharaibeh, M.A. Environmental efficiency of olive oil production by small and micro-scale farmers in northern Jordan: Life cycle assessment. Agric. Syst. 2016, 148, 169–177. [Google Scholar] [CrossRef]
- Notarnicola, B.; Salomone, R.; Petti, L.; Renzulli, P.A.; Roma, R.; Cerutti, A.K. (Eds.) Life Cycle Assessment in the Agri-Food Sector Case Studies, Methodological Issues and Best Practices; Hardcover; 2015; Volume XXI, 390 p. Available online: www.springer.com/978-3-319–11939-7 (accessed on 26 April 2019).
- Mohamed, R.S.; Verrastro, V.; Cardone, G.; Bteich, M.R.; Favia, M.; Moretti, M.; Roma, R. Optimization of organic and conventional olive agricultural practices from a Life Cycle Assessment and Life Cycle Costing perspectives. J. Clean. Prod. 2014, 70, 78–89. [Google Scholar] [CrossRef]
- Romero-Gamez, M.; Castro-Rodriguez, J.; Suarez-Rey, E.M. Optimization of olive growing practices in Spain from a life cycle assessment perspective. J. Clean. Prod. 2017, 149, 25–37. [Google Scholar] [CrossRef]
- Nemecek, T.; Dubois, D.; Huguenin-Elie, O.; Gaillard, G. Life cycle assessment of Swiss farming systems: I. integrated and organic farming. Agric. Syst. 2011, 104, 217–232. [Google Scholar] [CrossRef]
- Borzęcka, M.; Żyłowska, K.; Russo, G.; Pisanelli, A.; Freire, F. Life Cycle Assessment of olive cultivation in Italy: Comparison of three management systems. In Proceedings of the 167th EAAE Seminar: European Agriculture and the Transition to Bioeconomy, 24–25 September 2018; Institute of Soil Science and Plant Cultivation-State Research Institute: Pulawy, Poland. Available online: https://ageconsearch.umn.edu/record/281566?ln=en (accessed on 26 April 2019).
- Olive-4-Climate 2019. Manuale per la Gestione Sostenibile Degli Uliveti. LIFE15 CCM/IT/000141. Available online: www.OLIVE4CLIMATE.eu (accessed on 17 January 2020).
- Teatro Naturale. Gli Olivi Devono Produrre a Costi Accettabili: Analisi di Quelli Fissi e Variabili. 2018. Available online: https://www.teatronaturale.it/strettamente-tecnico/l-arca-olearia/26289-gli-olivi-devono-produrre-a-costi-accettabili-analisi-dei-costi-fissi-e-variabili.htm (accessed on 17 January 2020).
- Ghaley, B.B.; Porter, J.R. Emergy synthesis of a combined food and energy production system compared to a conventional wheat (Triticum aestivum) production system. Ecol. Indic. 2013, 24, 534–542. [Google Scholar] [CrossRef]
- Ghaley, B.B.; Vesterdal, L.; Porter, J.R. Quantification and valuation of ecosystem services in diverse production systems for informed decision-making. Environ. Sci. Policy 2014, 39, 139–149. [Google Scholar] [CrossRef]
- Wernet, G.; Bauer, C.; Steubing, B.; Reinhard, J.; Moreno-Ruiz, E.; Weidema, B. The ecoinvent database version 3 (part I): Overview and methodology. Int. J. Life Cycle Assess. 2016, 21, 1218–1230. [Google Scholar] [CrossRef]
- ISO. ISO. ISO 14040 International Standard. In Environmental Management-Life Cycle Assessment-Principles and Framework. International Organisation for Standardization; ISO: Geneva, Switzerland, 2006; Available online: http://www.iso.org/iso/catalogue_detail?csnumber=37456 (accessed on 26 April 2019).
- Pré Consultants. SimaPro Version 7; Pré Consultants: Amersfoort, The Netherlands, 2006. [Google Scholar]
- EEA/EMEP. EMEP/EEA Air Pollutant Emission Inventory Guidebook 2013; ISBN 978-92-9213-403-7. Available online: https://www.eea.europa.eu/publications/emep-eea-guidebook-2013 (accessed on 26 April 2019).
- Intergovernment Panel on Climate Change (IPCC). N2O emissions from managed soils, and CO2 emissions from lime and urea applications. In 2006 IPCC Guidelines for National Greenhouse Gas Inventories, Volume 4, Agriculture Forestry and Other Land Use’; Eggleston, H.S., Buendia, L., Miwa, K., Ngara, T., Tanabe, K., Eds.; Institute for Global Environmental Strategies: Hayama, Japan, 2006; pp. 11.1–11.54. [Google Scholar]
- Nemecek, T.; Bengoa, X.; Lansche, J.; Mouron, P.; Rossi, V.; Humbert, S. Methodological Guidelines for the Life Cycle Inventory of Agricultural Products; Version 2.0; World Food LCA Database (WFLDB), July 2015; Available online: https://quantis-intl.com/wp-content/uploads/2017/02/wfldb_methodologicalguidelines_v3.0.pdf (accessed on 26 April 2019).
- Guinée, J.B.; Gorrée, M.; Heijungs, R.; Huppes, G.; Kleijn, R.; Koning, A.; de Oers, L.; van Wegener Sleeswijk, A.; Suh, S.; Udo de Haes, H.A.; et al. Handbook on life cycle assessment. In Operational Guide to the ISO Standards; I: LCA in Perspective, IIa: Guide. IIb: Operational Annex, III: Scientific Background; Kluwer Academic Publishers: Dordrecht, The Netherland, 2002; p. 692. ISBN 1-4020-0228-9. [Google Scholar]
- Goedkoop, M.J.; Heijungs, R.; Huijbregts, M.; De Schryver, A.; Struijs, J.; Van Zelm, R. ReCiPe: A Life Cycle Impact Assessment Method Which Comprises Harmonised Category Indicators at the Midpoint and the Endpoint Level, 1st ed. Report I: Characterisation. 2008. Available online: http://www.lcia-recipe.net (accessed on 26 April 2019).
- Knudsen, M.T.; Meyer-Aurich, A.; Olesen, J.E.; Chirinda, N.; Hermansen, J.E. Carbon footprints of crop from organic and conventional arable crop rotations-using a life cycle assessment approach. J. Clean. Prod. 2014, 64, 609–618. [Google Scholar] [CrossRef]


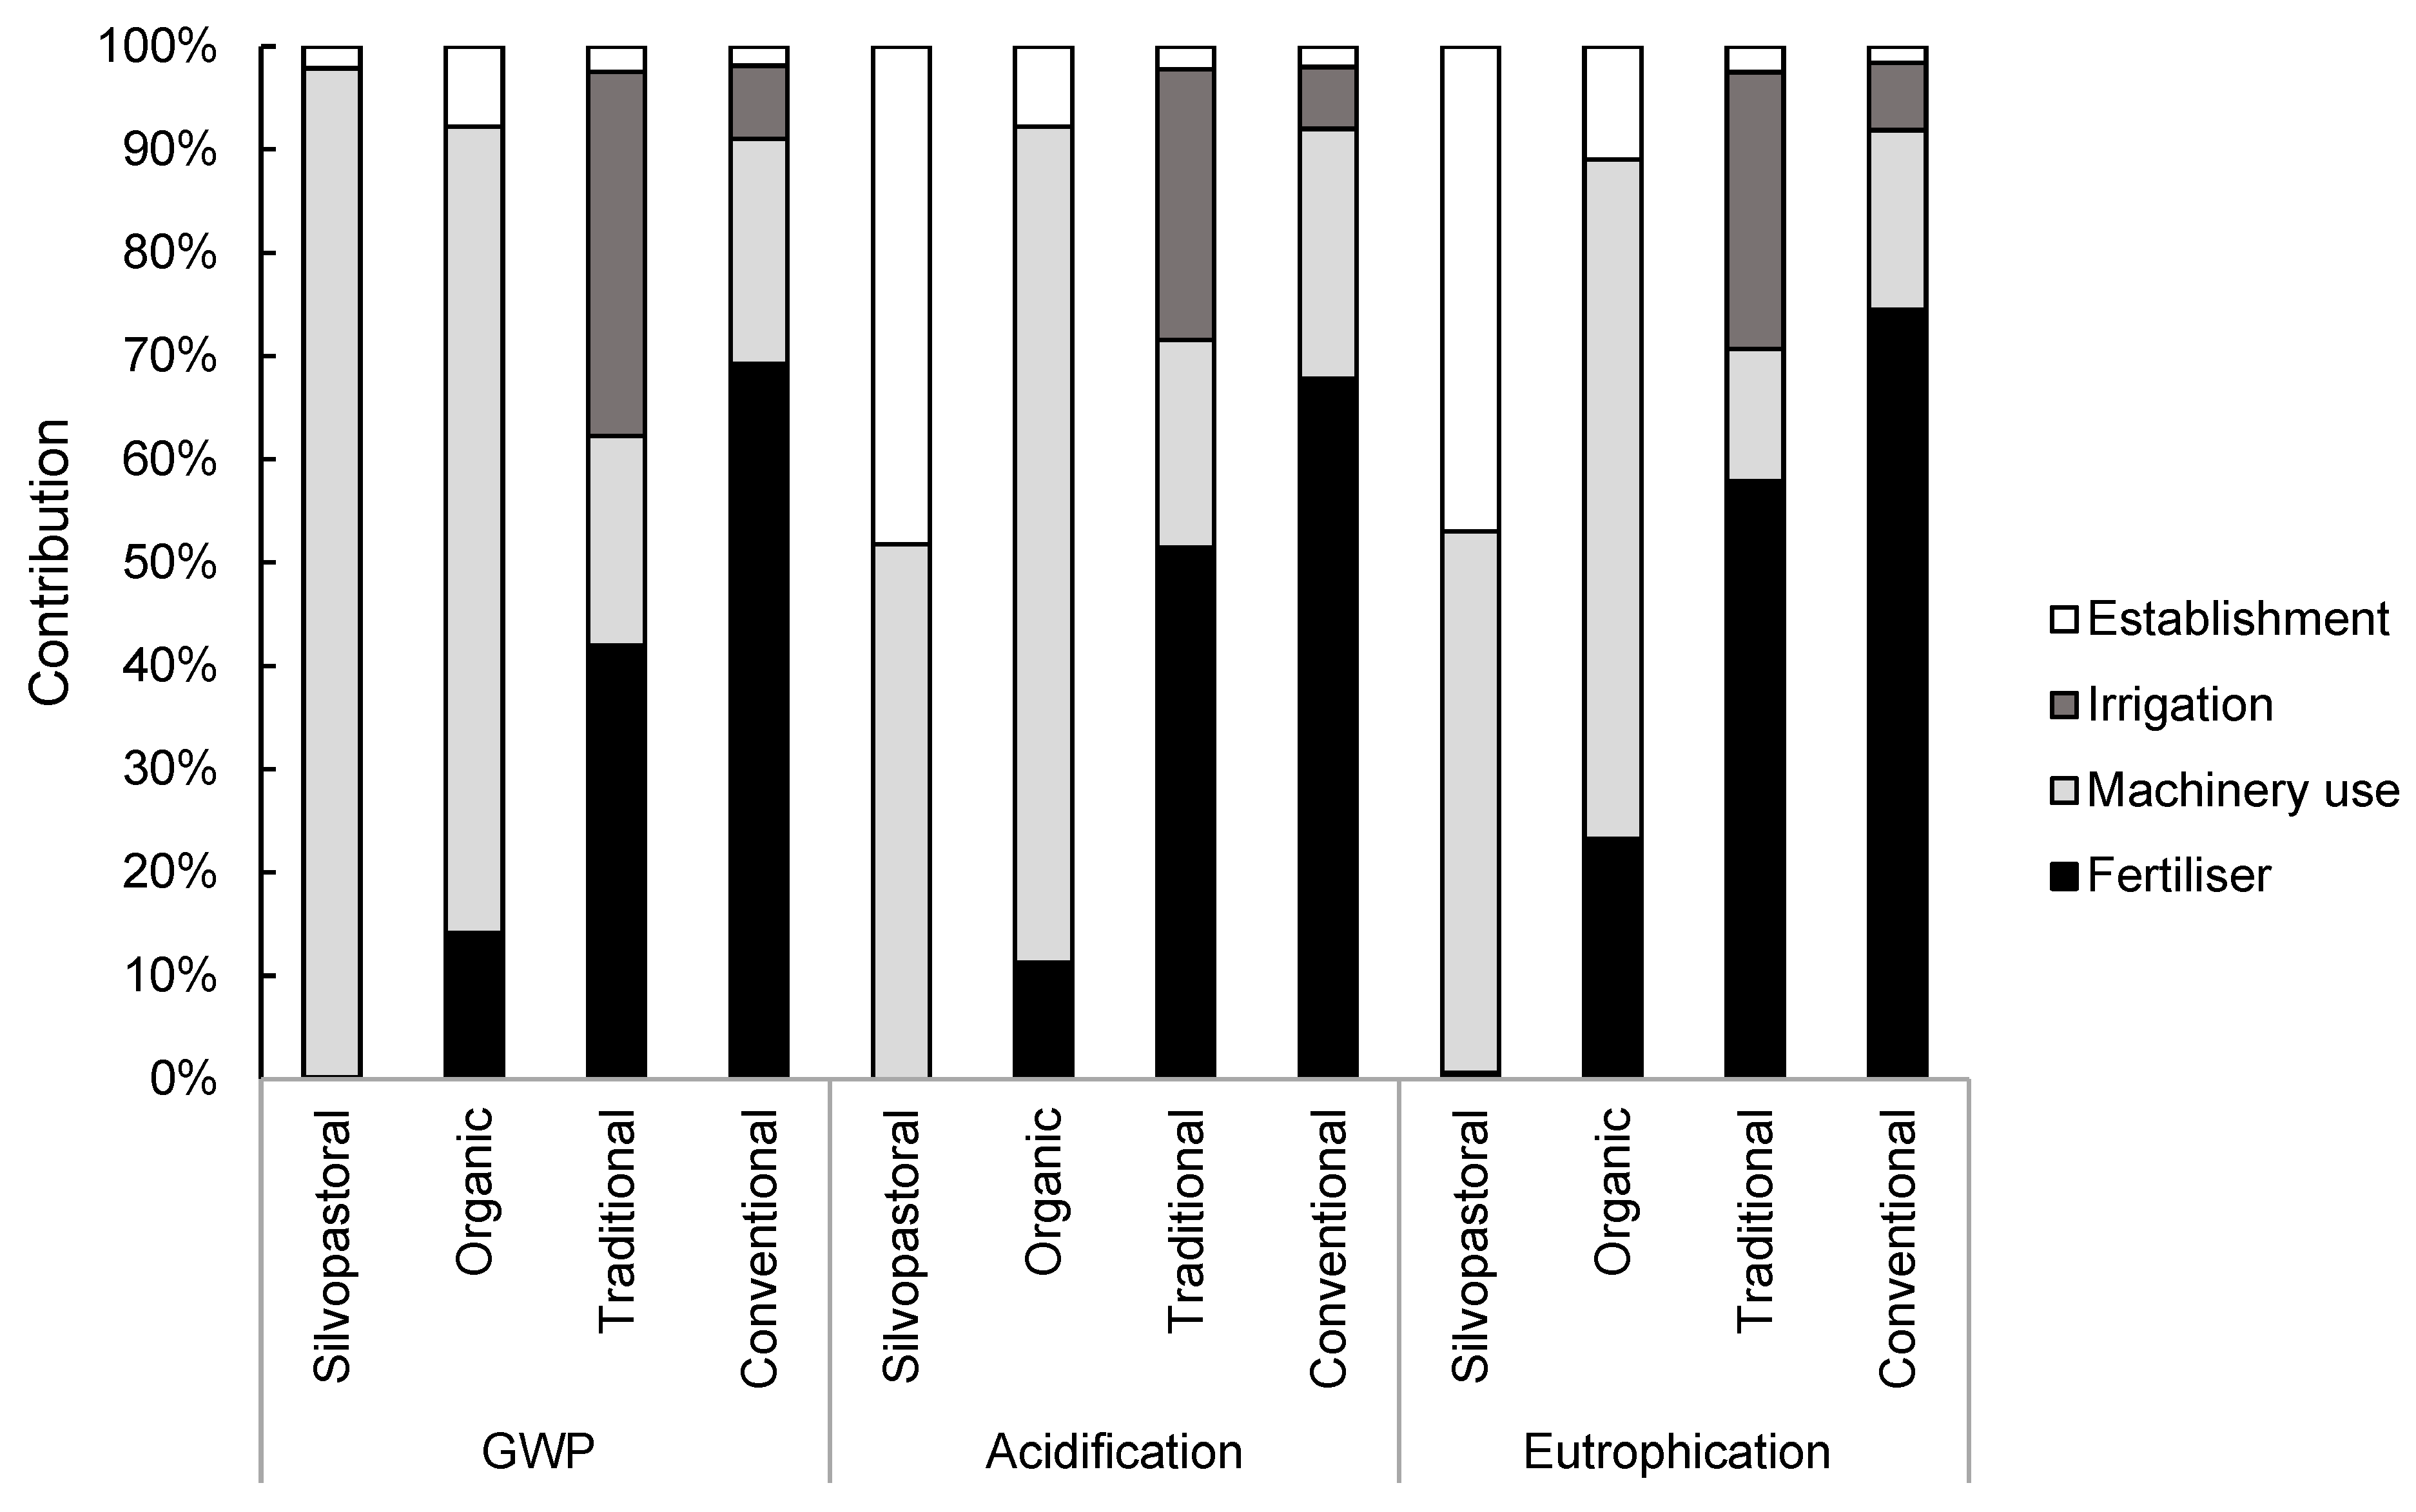
| Agricultural Practice | On Field Emissions | Methodology | Unit | Italy | Denmark | ||||
|---|---|---|---|---|---|---|---|---|---|
| Silvo-Pastoral | Organic | Tradi-Tional | Conven-Tional | CFE | Conven-Tional | ||||
| Fertilization | N2O | EEA/EMEP (2013) | g kg−1 | 0.00 | 0.50 | 0.31 | 0.4 | ||
| CO2 | Nemecek (2014) | g kg−1 | 0.00 | 0.00 | 31.18 | 5 | |||
| NH3 | EEA/EMEP (2013) | g kg−1 | 8.92 | 0.00 | 1.03 | 3 | |||
| NO | EEA/EMEP (2013) | g kg−1 | 12.35 | 34.20 | 0.24 | 0.7 | |||
| Chemical N | kg ha−1 | 0.00 | 190.00 | ||||||
| Manure N | kg ha−1 | 16.00 | 35.20 | ||||||
| Crop residues N | kg ha−1 | 0.00 | 0.00 | ||||||
| Direct NO2-N N2O | IPCC 2006 | kg ha−1 | 0.25 | 3.54 | |||||
| Indirect (VOL.) NO2-N N2O | IPCC 2006 | kg ha−1 | 0.05 | 0.41 | |||||
| Indirect (leaching) NO2-N N2O | IPCC 2006 | kg ha−1 | 0.06 | 0.80 | |||||
| Irrigation | H2O | Nemecek (2014) | m3 | 0.00 | 0.00 | 0.14 | |||
| Impact Category | Unit | Italy | Denmark | ||||
|---|---|---|---|---|---|---|---|
| Silvo-Pastoral | Organic | Tradi-Tional | Conventional Orchard | Combined Food and Energy | Conventional Wheat System | ||
| GWP | kg CO2-eq. kg−1 yr−1 | 0.166 | 0.266 | 0.655 | 0.388 | 0.615 | 4.922 |
| Acidification | kg SO2-eq. kg−1 yr−1 | 0.022 | 0.018 | 0.007 | 0.008 | 1.290 | 6.844 |
| Eutrophication | kg PO4-eq. kg−1 yr−1 | 0.005 | 0.005 | 0.002 | 0.004 | 2.957 | 20.446 |
| Crop | Unit | Combined Food and Energy | Conventional | Share of Crop at Farm |
|---|---|---|---|---|
| Wheat | $ farm−1 | 16,975.07 | 30.5 | |
| Barley | $ farm−1 | 10,760.29 | 19.3 | |
| clover | $ farm−1 | 27,342.72 | 49.1 | |
| Willow | $ farm−1 | 570.89 | 1.0 | |
| Wheat | $ farm−1 | 39,028.43 | 100.0 | |
| Total | $ farm−1 | 55,648.96 | 39,028.43 |
| Impact Category | Unit | Combined Food and Energy | Conventional |
|---|---|---|---|
| GWP | g CO2-eq. $−1 yr−1 | 123.89 | 1413.80 |
| Acidification | g SO2-eq. $−1 yr−1 | 0.80 | 6.03 |
| Eutrophication | g PO4-eq. $−1 yr−1 | 0.02 | 0.22 |
| Impact Category | Unit | Italy | Denmark | ||||
|---|---|---|---|---|---|---|---|
| Silvo-Pastoral | Organic | Tradi-Tional | Conven-Tional | CFE | Conven-Tional | ||
| GWP | kg CO2-eq. ha−1 yr−1 | 606 | 585 | 4615 | 1669 | 3083 | 17,705 |
| Acidification | kg SO2-eq. ha−1 yr−1 | 78 | 39 | 49 | 33 | 6467 | 24,618 |
| Eutrophication | kg PO4-eq. ha−1 yr−1 | 18 | 11 | 16 | 18 | 14,825 | 73,618 |
| Yield ha−1 | kg ha−1 | 3640 | 2200 | 7050 | 4300 | 7341 | |
| Income ha−1 | $ ha−1 | 5013 | 3597 | ||||
| Area | ha | 1.0 | 4.5 | 8.5 | 11.1 | ||
© 2020 by the authors. Licensee MDPI, Basel, Switzerland. This article is an open access article distributed under the terms and conditions of the Creative Commons Attribution (CC BY) license (http://creativecommons.org/licenses/by/4.0/).
Share and Cite
Lehmann, L.M.; Borzęcka, M.; Żyłowska, K.; Pisanelli, A.; Russo, G.; Ghaley, B.B. Environmental Impact Assessments of Integrated Food and Non-Food Production Systems in Italy and Denmark. Energies 2020, 13, 849. https://doi.org/10.3390/en13040849
Lehmann LM, Borzęcka M, Żyłowska K, Pisanelli A, Russo G, Ghaley BB. Environmental Impact Assessments of Integrated Food and Non-Food Production Systems in Italy and Denmark. Energies. 2020; 13(4):849. https://doi.org/10.3390/en13040849
Chicago/Turabian StyleLehmann, Lisa Mølgaard, Magdalena Borzęcka, Katarzyna Żyłowska, Andrea Pisanelli, Giuseppe Russo, and Bhim Bahadur Ghaley. 2020. "Environmental Impact Assessments of Integrated Food and Non-Food Production Systems in Italy and Denmark" Energies 13, no. 4: 849. https://doi.org/10.3390/en13040849
APA StyleLehmann, L. M., Borzęcka, M., Żyłowska, K., Pisanelli, A., Russo, G., & Ghaley, B. B. (2020). Environmental Impact Assessments of Integrated Food and Non-Food Production Systems in Italy and Denmark. Energies, 13(4), 849. https://doi.org/10.3390/en13040849