Article

Study on Global Industrialization and Industry Emission to Achieve the 2 °C Goal Based on MESSAGE Model and LMDI Approach

1
Global Energy Interconnection Development and Cooperation Organization, Xicheng District, Beijing 100031, China
2
International Institute for Applied Systems Analysis (IIASA), Schlossplatz 1-A, 2361 Laxenburg, Austria
3
Faculty of science, Camperdown campus, University of Sydney, Camperdown, Sydney 2006, Australia
*
Author to whom correspondence should be addressed.
Energies 2020, 13(4), 825; https://doi.org/10.3390/en13040825
Submission received: 2 January 2020 / Revised: 26 January 2020 / Accepted: 6 February 2020 / Published: 13 February 2020
(This article belongs to the Special Issue Assessment of Energy–Environment–Economy Interrelations)

Abstract

:
The industrial sector dominates the global energy consumption and carbon emissions in end use sectors, and it faces challenges in emission reductions to reach the Paris Agreement goals. This paper analyzes and quantifies the relationship between industrialization, energy systems, and carbon emissions. Firstly, it forecasts the global and regional industrialization trends under Representative Concentration Pathway (RCP) and Shared Socioeconomic Pathway2 (SSP2) scenarios. Then, it projects the global and regional energy consumption that aligns with the industrialization trend, and optimizes the global energy supply system using the Model for Energy Supply Strategy Alternatives and their General Environmental Impact (MESSAGE) model for the industrial sector. Moreover, it develops an expanded Kaya identity to comprehensively investigate the drivers of industrial carbon emissions. In addition, it employs a Logarithmic Mean Divisia Index (LMDI) approach to track the historical contributions of various drivers of carbon emissions, as well as predictions into the future. This paper finds that economic development and population growth are the two largest drivers for historical industrial CO2 emissions, and that carbon intensity and industry energy intensity are the top two drivers for the decrease of future industrial CO2 emissions. Finally, it proposes three modes, i.e., clean supply, electrification, and energy efficiency for industrial emission reduction.

1. Introduction

The industrial sector is the largest sector of energy consumption with largest CO2 emission among the final sectors [1]. In 2017, the total energy consumption of the industrial sector accounted for 29% of the end-use energy consumption and 24% of the total CO2 emissions. Considering the indirect energy consumption and CO2 emissions from industrial electricity and heat, the percentage of industrial energy consumption and emissions are 43% and 42% respectively [2]. In order to understand the role of the industrial sector in the future energy consumption and emission pathways, especially under the rapid development of renewable energy and electrification, there is a need to analyze the global industrialization process, study the energy system and the drivers, and explore a future emission path for the industrial sector that aligns with the 2 °C global temperature control goal of the Paris Agreement.
There is much existing literature evaluating industrialization from the economic perspective. Regarding industrialization, Chang Pei-Kang studied the industrialization process and its relationship with the agriculture sector [3]. In this paper, we define the “industrialization” stage as the proportion of the manufacturing industries’ output in the GDP structure. The manufacturing industries include iron and steel, cement, chemicals, pulp and paper, non-ferrous metals, food processing, textiles, leather, and mining etc. Economists have divided economic development into three stages: pre-industrialization, industrialization, and post-industrialization [4]. The industrialization process of a country is closely related to the stage of economic growth [3,4]. The basic characteristics of the industrialization are shown in the following aspects: (a) The increase in the proportion of manufacturing activities in national income structure. (b) The increase in the proportion of the labor population in the manufacturing industry. According to various standards, e.g., income level of GDP per capita, national income structure (percent of the first, second, and third industry respectively), employment structure, urbanization level, etc. Therefore, the industrialization stage can be further divided into three sub-stages: initial stage, intermediate stage, and late stage (Table 1).
The manufacturing industries represent the industrialization process and dominate energy consumption and emission in the end-use sectors. Along with the industrialization process, the proportion of output value of the manufacturing industries in the national economy will experience an inverse-U shaped process which is also known as the “Kuznets curve.” In general, the proportion of the second industry in GDP rises first, then reaches peak, and falls afterwards. The internal structure of the manufacturing industry will experience the same process as well. During the early stage of industrialization, the dominant industries are labor-intensive light industries such as the textile and food sectors, whose proportion will first increase and peak, and then begin to decline at the end of the early stage. While in the intermediate stage of industrialization, the dominant industries are capital-intensive heavy industries, such as the iron and steel, cement, electricity, and other energy and raw material-related industries, in the late stage of industrialization, the dominant industries involve technology-intensive high-value machining manufacturing, such as equipment manufacturing sectors. When entering the post-industrialization stage, the proportion of secondary industry output falls, while the proportion of third industry rises [6]. According to the experience of the major developed countries, the proportion of industrial output in the total output will keep stable between 20%~30%. This result is driven by both the international industry transfer and domestic industry upgrade trends [7].
There is also extensive literature regarding industrial energy and emissions. For example, Caraiani et al. [8] study the causality relationship between energy consumption and economic growth in the context of emerging European countries, while Ntanos et al. [9] study renewable energy and economic growth based on European countries. Taeyoung and Jinsoo [10] study the relationship between coal consumption and economic growth based on the OECD and non-OECD countries. Chen et al. [3] study the relationship between industrialization and industrial CO2 emissions for China. Wang and Chen [11] study the decarbonization pathways of industrial energy consumption under 2 °C scenario for a comparison of China, India and Western European countries. Van Ruijven et al. [12] study the energy use and CO2 emissions from the global steel and cement industries based on model projections. International Energy Agency (IEA) studies the industrial energy efficiency and CO2 emissions [13]. However, there are few papers attempting to link the industrialization process with the industrial energy consumption and CO2 emissions together, especially at the global level [12]. This is one of the main innovative contributions of this paper: to establish and quantify the relationship between industrialization, energy system, and carbon emissions.
When identifying drivers of CO2 emissions, Kaya identity [14] is commonly used in Intergovernmental Panel on Climate Change (IPCC) reports [15] and IEA reports for tracking the trends of key drivers [16]. As indicated from IEA statistics, energy intensity has decreased by 34% globally compared with the reference year of 1990, while population and GDP per capita has increased by 41% and 68% respectively [16]. In order to further study the impact of these drivers, the Logarithmic Mean Divisia Index (LMDI) approach [17,18] is proposed and widely used to decompose the drivers for national CO2 emission. For example, Freitas and Kaneko [19] used the LMDI approach to evaluate the changes in CO2 emissions from energy consumption in Brazil for the period 1970–2009 and the results demonstrated that economic activity and demographic pressure are the leading forces explaining emissions increase. Fatima et al. [20] applied LMDI method to study energy-related CO2 emission in China’s industrial sector and found that CO2 emission experienced a significant increase from 1991 to 2013, and started to decrease in 2016. They also identified that the income effect and labor effect are the top two contributors to emissions. Arsalan et al. [21] used the LMDI approach to decompose the changes in CO2 emissions in Pakistan for the time periods of 1990–2017 and found that activity effect, structural effect and intensity effect were identified as the three major factors responsible for changes in overall CO2 emissions in the country. Besides Brazil [19], China [20,22,23], and Pakistan [21], the LMDI approach is also applied in the study for Iran [24], Philippines [25], Spain [26], Portugal [27], Iran [28], Turkey [29], and Greece [30] etc. In terms of regional study, Wang and Chen [11] applied a 14-region energy system model (Global TIMES) to analyze the transition pathways of the industrial sector using the LMDI approach and found that the changes in socio-economic development pattern could slow the emission growth. Moutinho et al. [31] identified the relevant factors that have influenced the changes in the level of CO2 emissions among four groups (eastern, western, northern and southern) of European countries and found that energy mix, switching to cleaner fuels for end-user energy production contributes significantly to emission reduction. To sum up, most of the previous studies focused on analyzing national historical data to identify the contribution of drivers in CO2 emission using the LMDI approach, while the key drivers’ potential in future CO2 emission reductions are yet to be discussed [17,19,20,21,22,23,24,25,26,27,28,29,30,31]. Furthermore, a traditional Kaya identity equation consisting of energy intensity, CO2 intensity, economy, and population is used in the decomposition analysis, while more detailed factors are overlooked for better understanding the source of those drivers [11]. Another aim of this paper is to fill these gaps.
The aim of this paper is to first explore the global industrialization trend, the energy demand, and emission trend for the world and 11 regions achieving the temperature control goal of 2 °C of the Paris Agreement, and then to expand the traditional Kaya identity to study the drivers of CO2 emissions from historical data and a future scenario using the LMDI approach. Section 2 provides a description of the method and data, including the industrialization regression and projection method; energy and emission prediction and optimization software by the Model for Energy Supply Strategy Alternatives and their General Environmental Impact (MESSAGE) model and Representative Concentration Pathways (RCPs) and Shared Socioeconomic Pathways (SSPs) scenarios database, the decomposition method of Kaya identity, and contribution analysis method of the LMDI approach. Section 3 is the analysis and results, it assesses the global industry development and industrialization trend in the 21st century, the global energy demand and emissions from the industrial sector under the 2 °C scenario, and the decomposition and contribution analysis using the LMDI approach. Section 4 summarizes the modes for industrial emission mitigation. Section 5 presents the conclusions and future works.

2. Method and Data

2.1. Industrialization Projection Method

This paper analyzes the status quo of the current industrialization stages globally, for 11 regions. The world average industrialization rate is 24% in 2015. Based on the industrialization rate and GDP per capita levels for 11 regions, from Figure 1, it clearly shows the inverse-U shape of the industrialization process. The least developing region, i.e., Sub-Saharan Africa (AFR) is still at the first stage of industrialization or Before Industrialization stage. South Asia (SAS) is at the Early stage of Industrialization. These two regions are still experiencing an increasing trend in terms of their industrialization rate. According to the criterions from Table 1, and based on the historical data for the industrialization rate and GDP per capita levels for these six regions, these regions are in different sub-stages of industrialization. The Central and Eastern Europe (EEU), Former Soviet Union (FSU) and Latin America and the Caribbean (LAC) are in the late stage of industrialization, while the Centrally planned Asia and China (CPA), Middle East and North Africa (MEA) and Other Pacific Asia (PAS) are in the intermediate stage of industrialization. The three most developed regions, i.e., North America (NAM), Western Europe (WEU), Pacific OECD (PAO) are in the post-industrialization stage.
Based on the historical data of industrialization for the 11 regions across the globe, we develop a regression method to predict the future industrialization for those regions. The country-level historical annual data such as the GDP, population and GDP per capita (denoted as gdppc), from 1990 to 2017 are collected from the World Bank Database [31]. Then, country-level data are aggregated to 11 regions defined by IIASA [32]. We collect the annual GDP per capita (gdppc) along with its quadratic and cubic forms as the main explanatory variables. The explained variable is the industrialization level (ind). The basic regression equation is defined as following:
i n d i t = c o n s t a n t + a · g d p p c i t + b · g d p p c i t 2 + c · g d p p c i t 3 .
where i denotes 11 regions, t denotes different years, a, b, c are parameters.
When we arrive at the regression results for 11 regions, we apply the future gdppc data derived from the second Shared Social-economic Pathways (SSP2) [34] to predict the future industrialization level for 11 regions. Two caveats arise here: the first is that there is only one explanatory variable, gdppc, because we try to catch the relationship between income and industrialization level; the second is that the prediction period of 2018–2100 is much longer than the historical period in order to match the “S-curve” method for energy projection and the Kaya and LMDI methods.

2.2. Industrial Energy Demand Projection Method

A hump-shaped function method is used to project the industrial energy demand in each region. Historical data show that the relationship between the industrial energy consumption per capita and GDP per capita follows the “S-Curve”: with the increase of GDP per capita, the industrial energy consumption per capita first increases, and then peaks then decreases along with the industrialization process [3]. Studies reveal that the “S-curve” method can capture the relationship between industrial energy consumption per capita and GDP per capita. Based on the industrialization projection method in Section 2.1, here we apply a simple top-down method, i.e., the “S-curve” method to project the global energy consumption for the industry sector.
The mathematic equation to describe the S-curve relationship [35] between the industrial energy consumption per capita and GDP per capita is:
E E i = A exp ( α 1 ( G G i ) ) exp ( α 3 ( G G i ) ) 2 cosh ( α 3 ( G G i ) )
where i is the turning point of the S-curve; G i is the GDP per capita at the turning point; E i is the industrial energy consumption per capita at the turning point; α 1 , α 2 , α 3 , and A are country specific parameters which can be estimated from regression results.
According to the time of industrialization process, industrial structure, duration of industrialization as studied in Section 2.1 and urbanization development in each country or region, the S-curve could be classified into three main types: high S type, middle S type, and low S type [35]. Countries categorized with high S type consumed more energy intensive products than middle and low type, resulting in a larger magnitude of turning point. Furthermore, the timing of the high S type turning point occurrence lags middle and low S type, resulting in high GDP per capita when the turning point occurred. Threshold GDP per capita for different S-curves is summarized in Table 2. Major boundary conditions and assumptions in the MESSAGE model are described in Table 3.
In the present study, traditional Kaya identity [14] is further expanded to decompose the industrial carbon emission and a LMDI approach is used to investigate the contribution of each drivers in carbon emission based on historical data. Furthermore, on the basis of MESSAGE optimized energy system results under conditions of the 2 °C target, decomposition analysis for projected industrial carbon emissions is carried out. The analysis framework is shown in Figure 2.

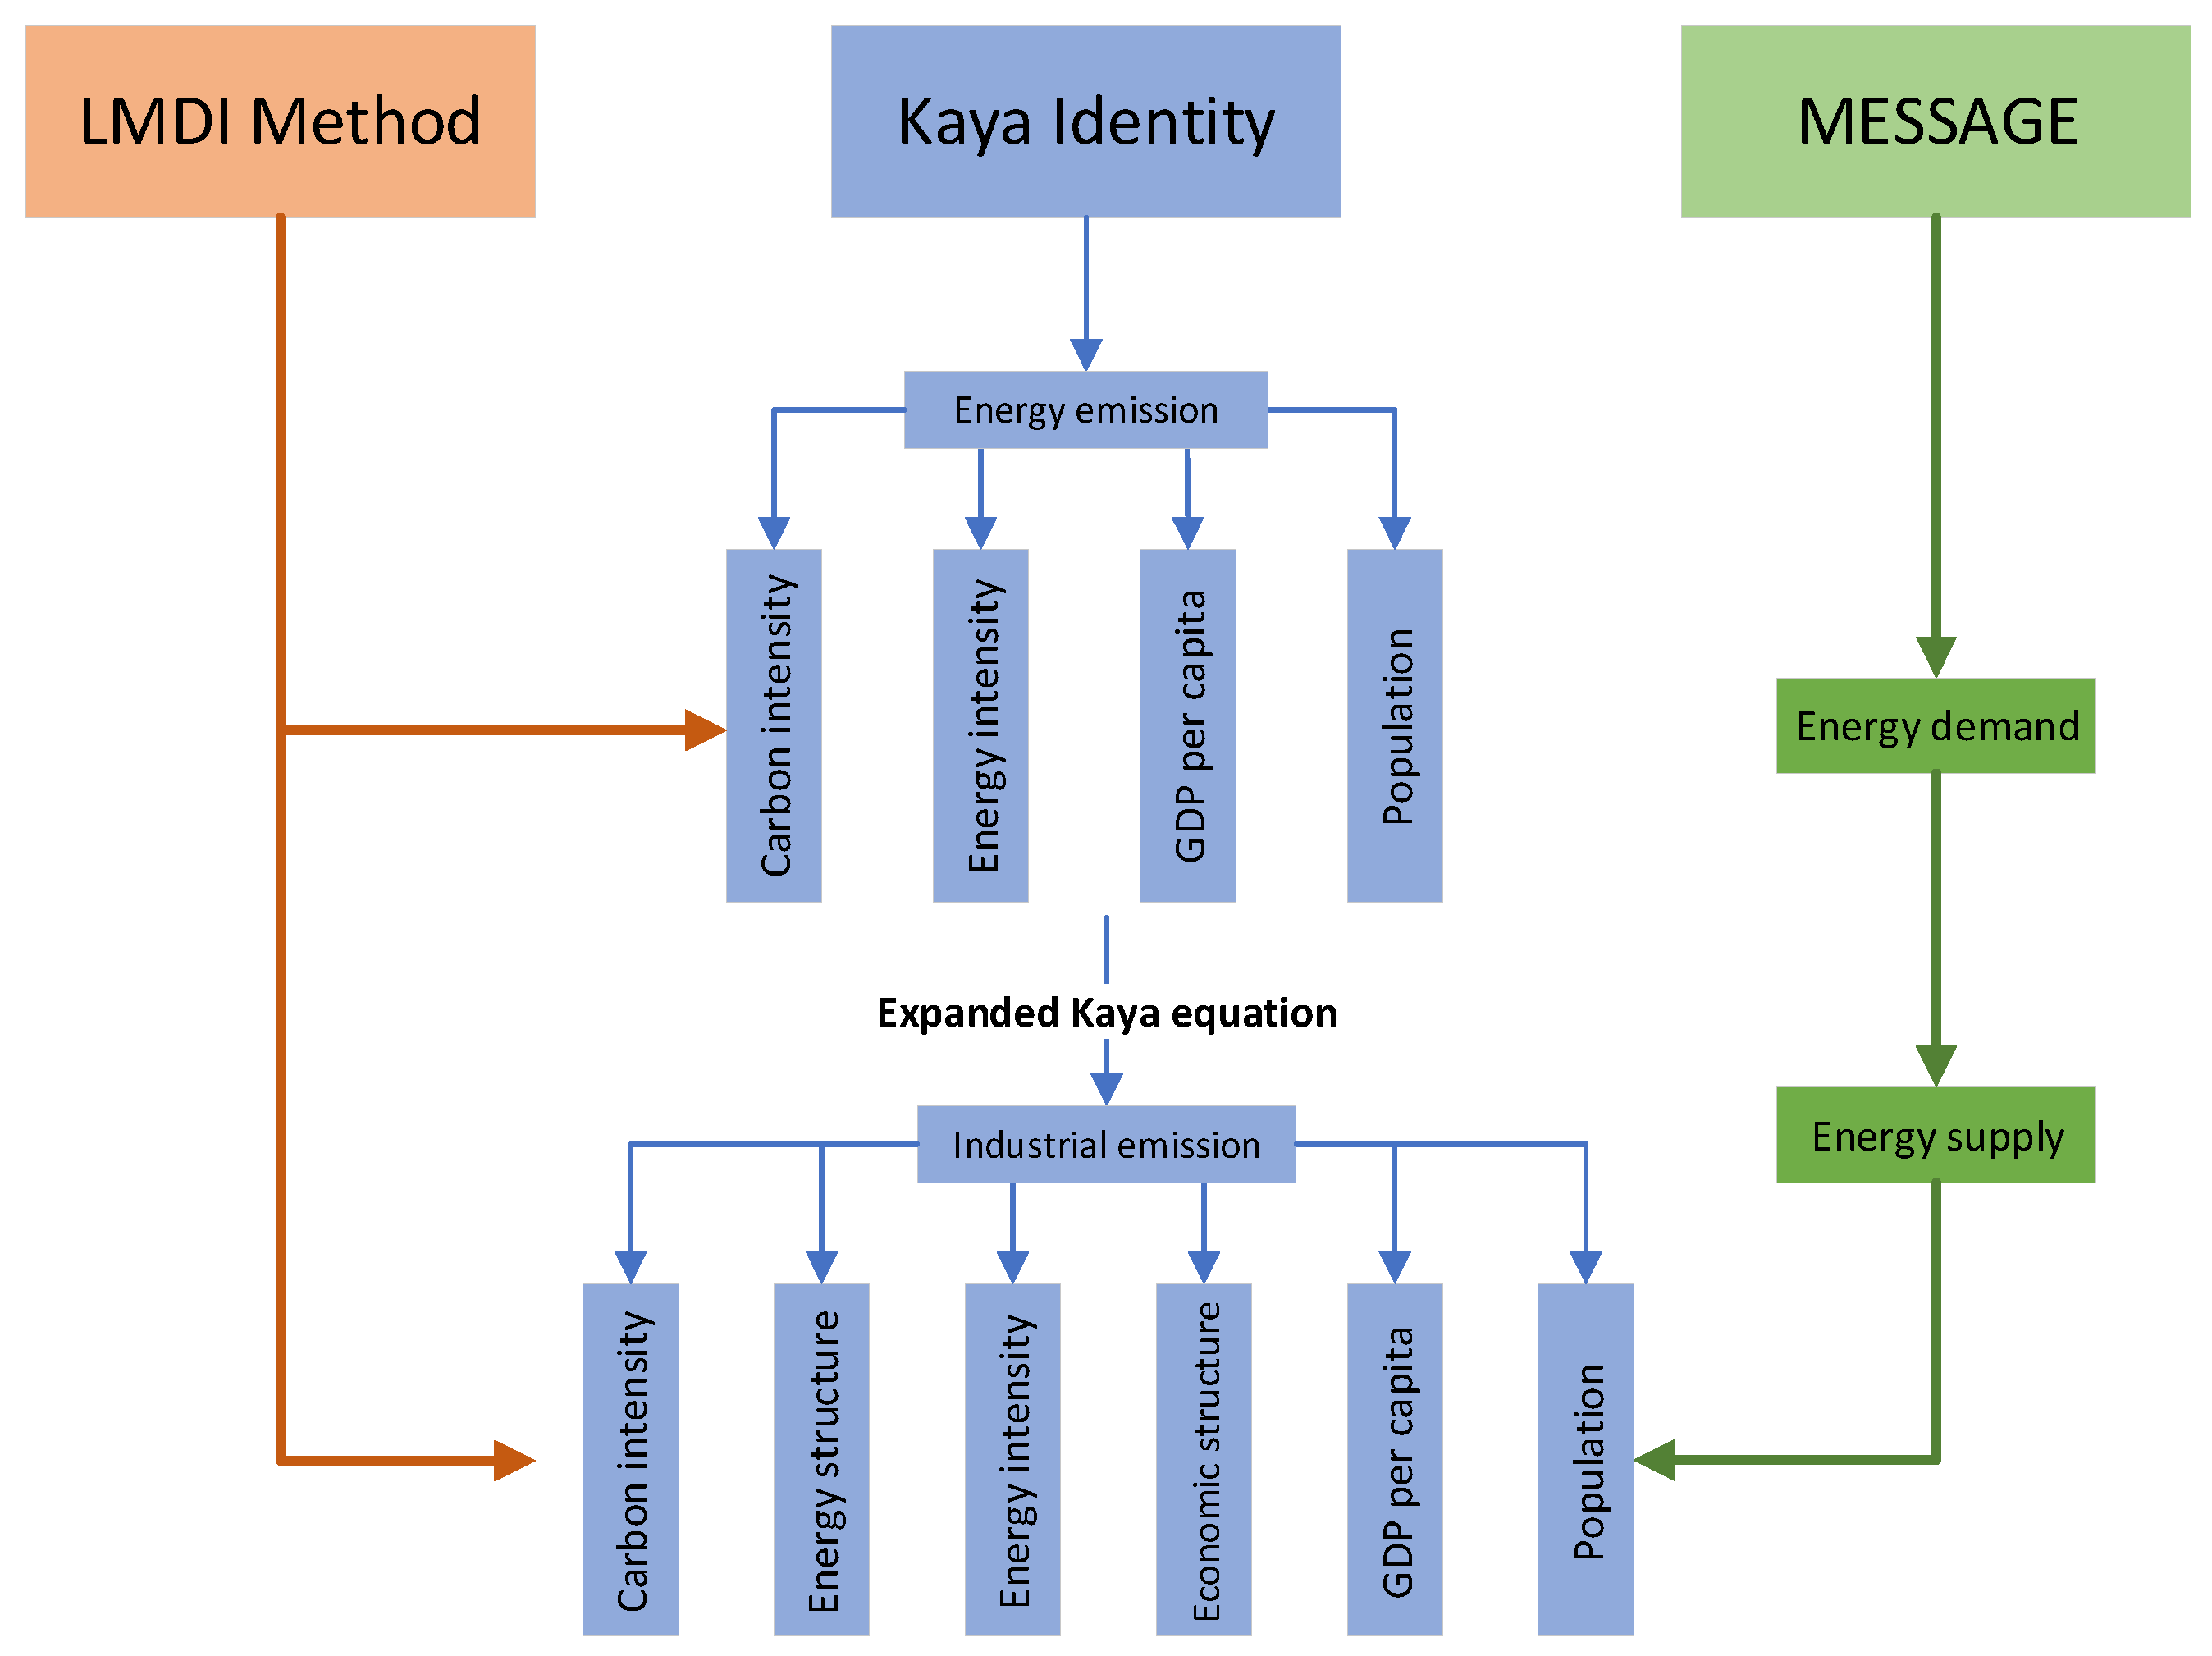
2.3. Expanded Kaya Equation and Contribution Decomposition

2.3.1. Expanded Kaya Equation

Traditional Kaya identity [14] is a commonly used way to decompose carbon dioxide emissions, which is expressed as the product of four factors: population, GDP per capita, energy intensity and carbon intensity (see Equation (3)).
C O 2 = P O P × G D P P O P × E G D P × C O 2 E .
where C O 2 is the total CO 2 emissions, POP is total population, GDP is economic output, E . is total primary energy consumption, while G D P / P O P denotes GDP per capita indicating income level, E / G D P represents energy intensity which indicates energy efficiency, C O 2 / E stands for carbon intensity, reflecting the effect from energy structure changes.
Traditional Kaya identity is widely used to decompose carbon emissions [16], but it fails to consider the impact of industrialization and electrification on carbon reduction. An expanded Kaya identity is re-written as follows,
C O 2 = C O 2 F O F × F O F T O E × T O E I N D × I N D G D P × G D P P O P × P O P
Here, the CO2 is the total industrial CO2 emissions, FOF is total industrial fossil fuels consumption, TOE is total industrial energy consumption, IND is industrial output, GDP is economic output, POP is total population. Therefore, the industrial CO2 emissions is decomposed into six drivers, while the CO2/FOF denotes CO2 emission intensity of fossil fuels, FOF/TOE denotes the energy structure of fossil fuel among total energy consumption, TOE/IND denotes energy intensity of industrial output, IND/GDP denotes the industrialization level, GDP/POP denotes GDP per capita. This paper applies the Kaya method, which is in essence a top-down method, while combined with a bottom-up study on specific industries based on local endowments of different regions.

2.3.2. Contribution Analysis Based on LMDI Approach

When taking all industry sectors into consideration, the total industrial emissions could be expressed in the following way as in Equation (5).
C O 2 = i j C O 2 i j = i j C O 2 i j F O F i j × F O F i j T O E i × T O E i I N D i × I N D i G D P × G D P P O P × P O P = i j C i j × S i j × I i × Q i × G × P
where C O 2 i j is the CO2 emissions arising from fuel j in industrial sector i, F O F i j is the consumption of fuel j in industrial sector i, T O E i is total energy consumption in industrial sector i, I N D i is total industrial output in industrial sector i; C i j , S i j , I i , Q i , G and P represent the drivers of carbon emission from carbon intensity, energy structure, industrial energy intensity, economic structure, economic development, and population, respectively.
According to Ang [18] and present CO2 decomposition, changes in CO2 emission from industry could be expressed in an additive decomposition way as follows,
Δ C t o t = C T C 0 = Δ C c e i + Δ C s t r + Δ C i e i + Δ C e s t r + Δ C e d + Δ C p o p
where,
Δ C c e i = i j C i j T C i j 0 ln C i j T ln C i j 0 ln ( C T C 0 ) Δ C s t r = i j C i j T C i j 0 ln C i j T ln C i j 0 ln ( C T C 0 ) Δ C i e i = i j C i j T C i j 0 ln C i j T ln C i j 0 ln ( S T S 0 ) Δ C e s t r = i j C i j T C i j 0 ln C i j T ln C i j 0 ln ( I T I 0 ) Δ C e d = i j C i j T C i j 0 ln C i j T ln C i j 0 ln ( Q T Q 0 ) Δ C p o p = i j C i j T C i j 0 ln C i j T ln C i j 0 ln ( P T P 0 )

3. Results and Discussion

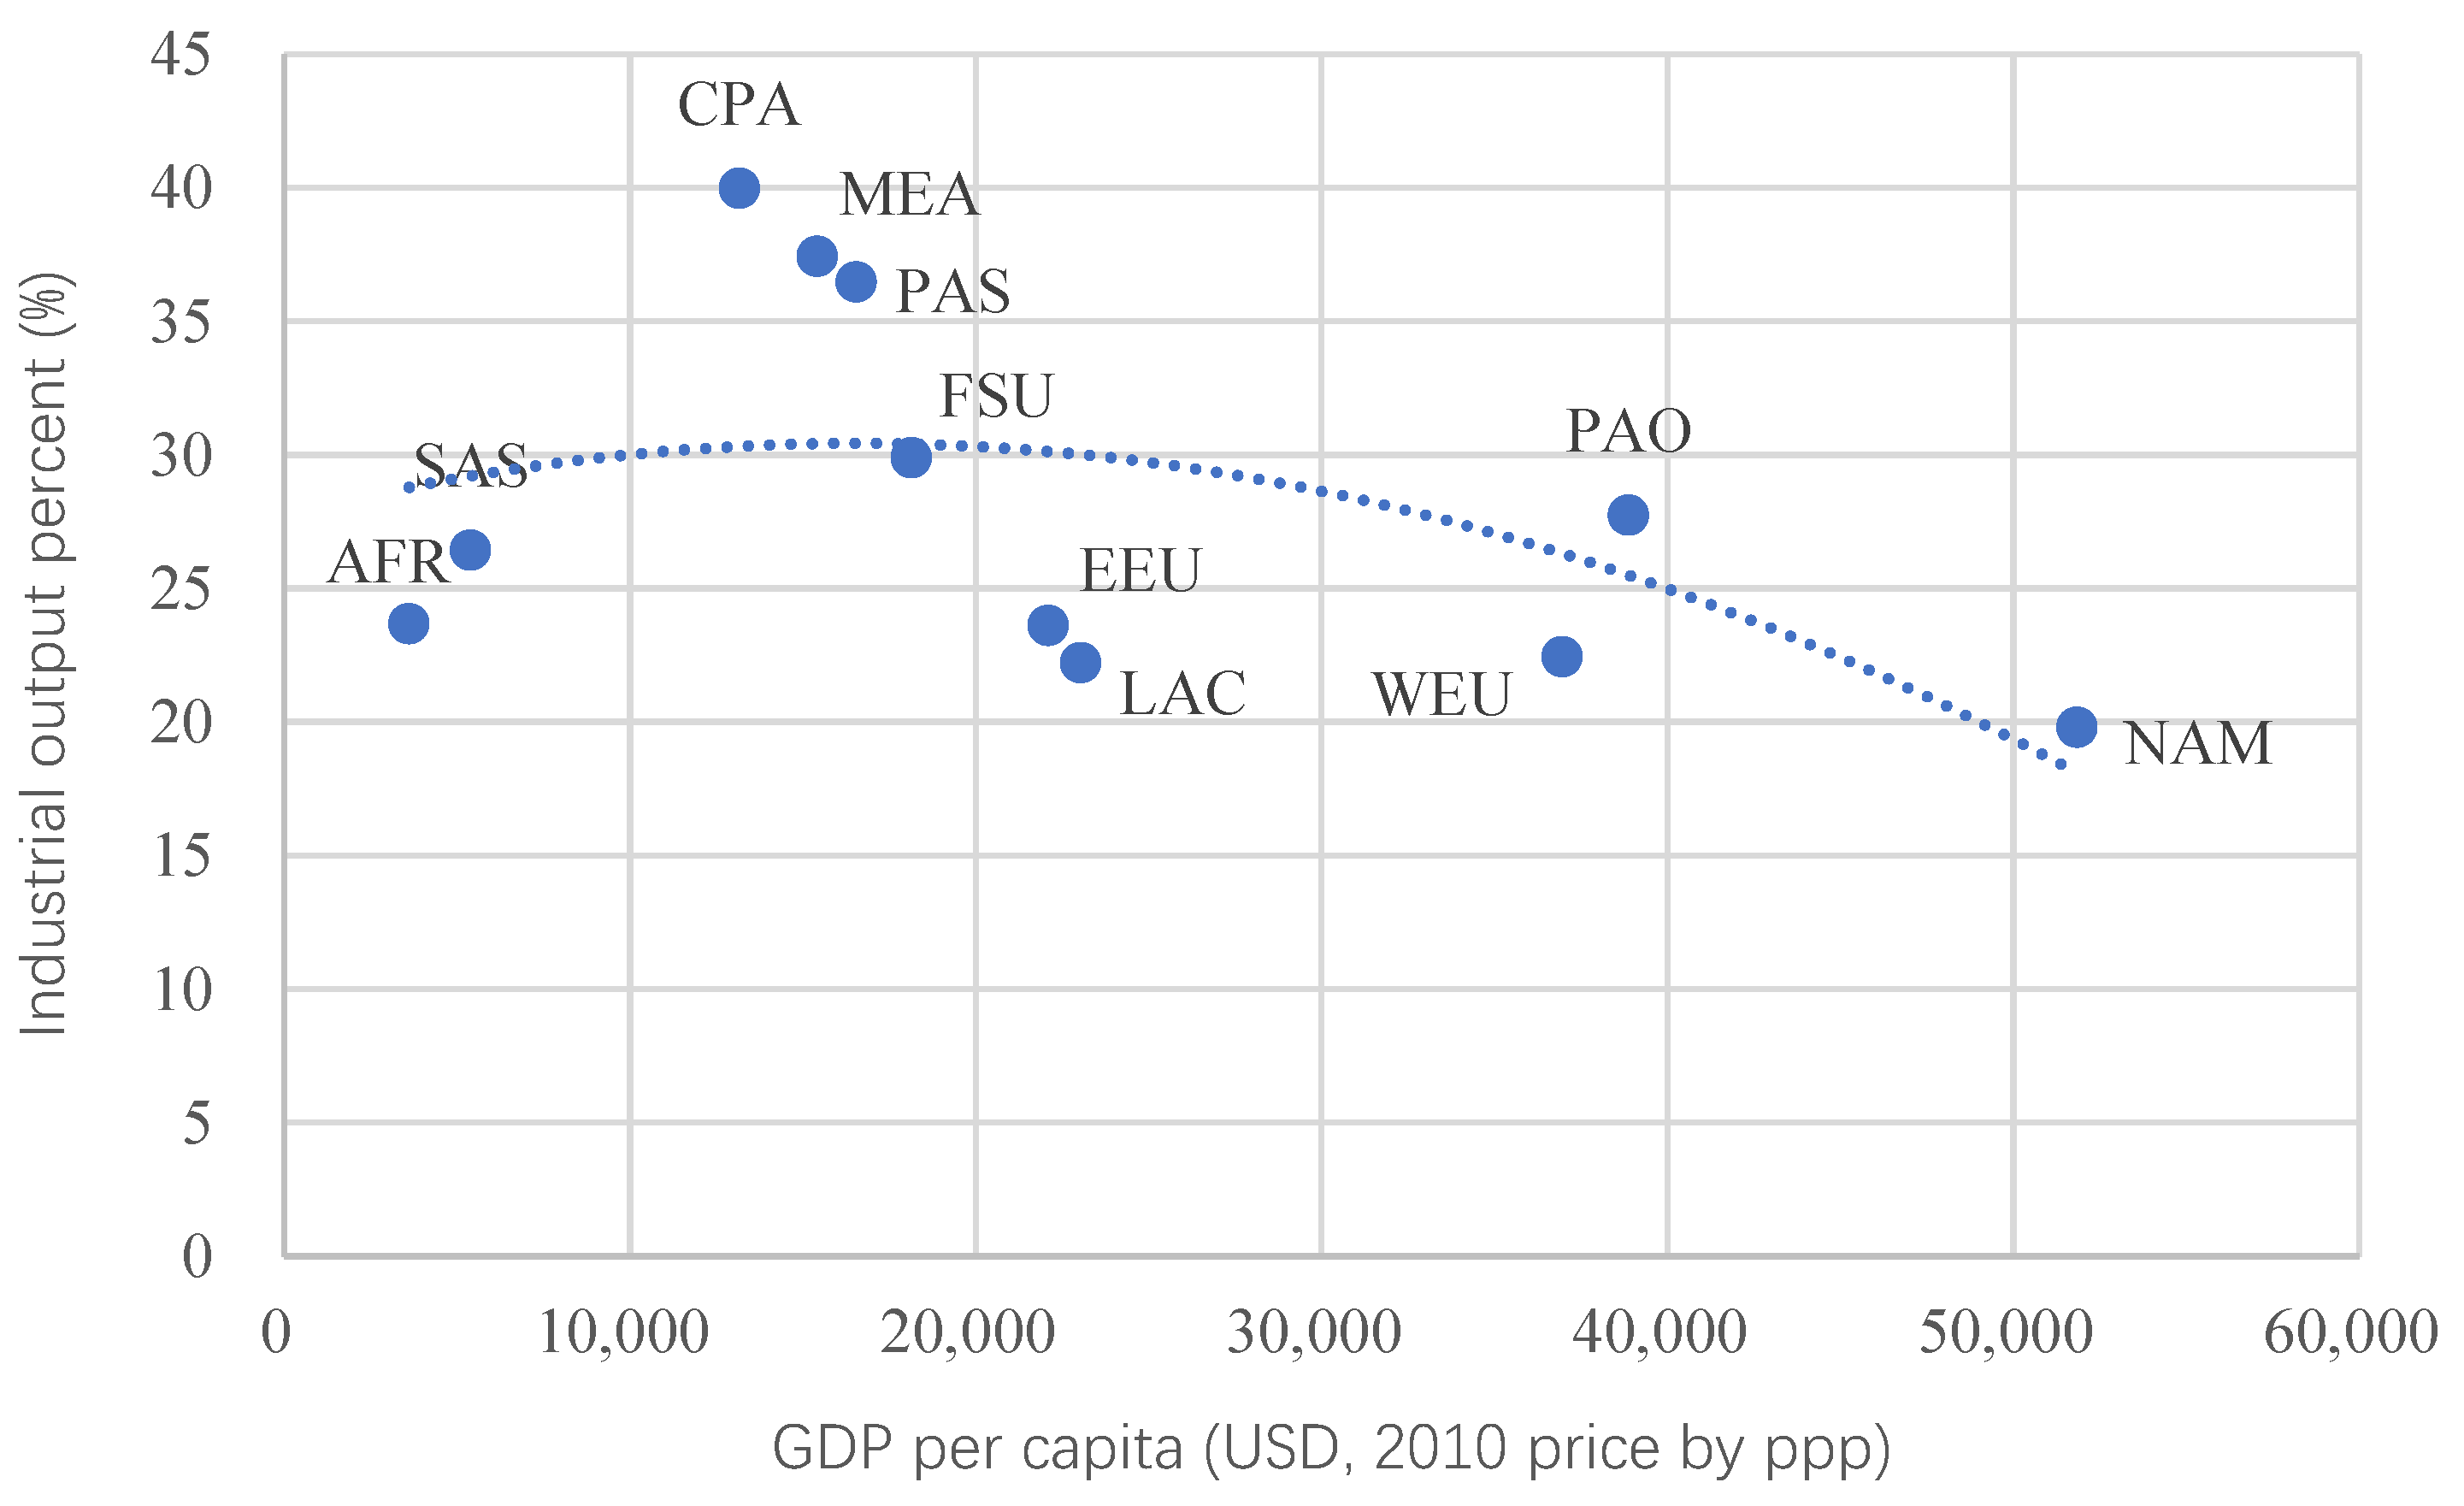
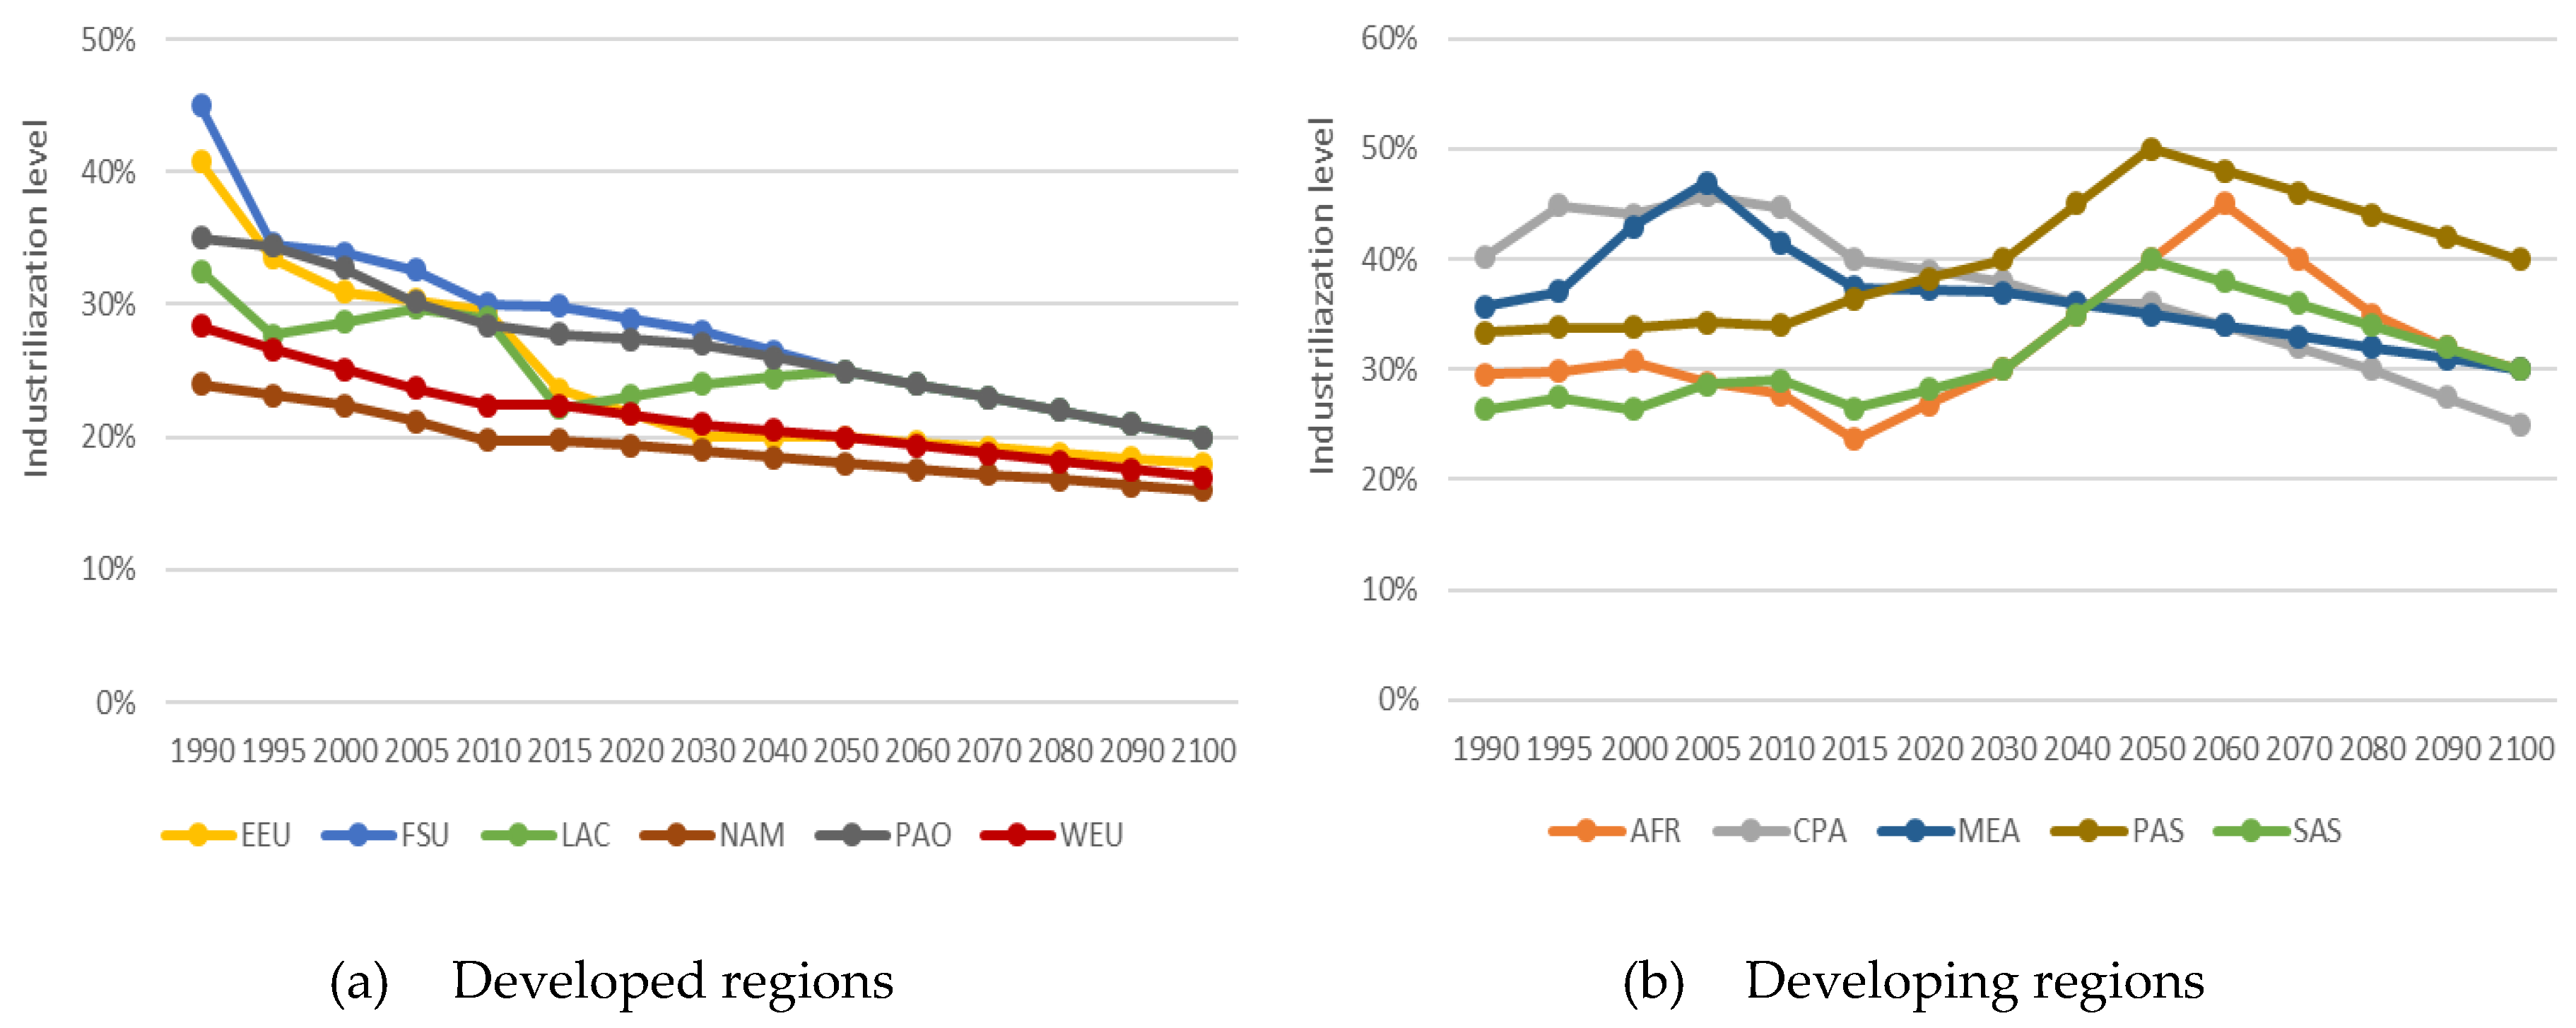
3.1. Industrialization and Its Projection

In this paper, we use the historical industrialization data to predict the future industrialization process for the 11 regions. The regression results for the 11 regions are as in Table 4. From the regression results we can find that there are significant downward trends for the most developed regions and also the post-industrialization regions such as the NAM, WEU, and PAO. With regard to the late stage of industrialization regions such as EEU and FSU, we can find that there is significant downward trend for EEU; there is an inverse-U shape for the FSU; there is a downward cube trend for the LAC region. With regard to the regions in the intermediate stage of industrialization, CPA shows that it has passed the peak and goes downward of industrialization; MEA and PAS show downward cubic trend. With regard to the AFR and SAS regions, they show an upward trend, i.e., they are on the left side of the inverse-U curve and still climbing up of their industrialization levels.
Based on the SSP2 scenario, we can predict the future industrialization levels of the 11 regions. The prediction results are as in Figure 3. The figure on the left is for six developed regions; while the figure on the right is for the five developing regions.

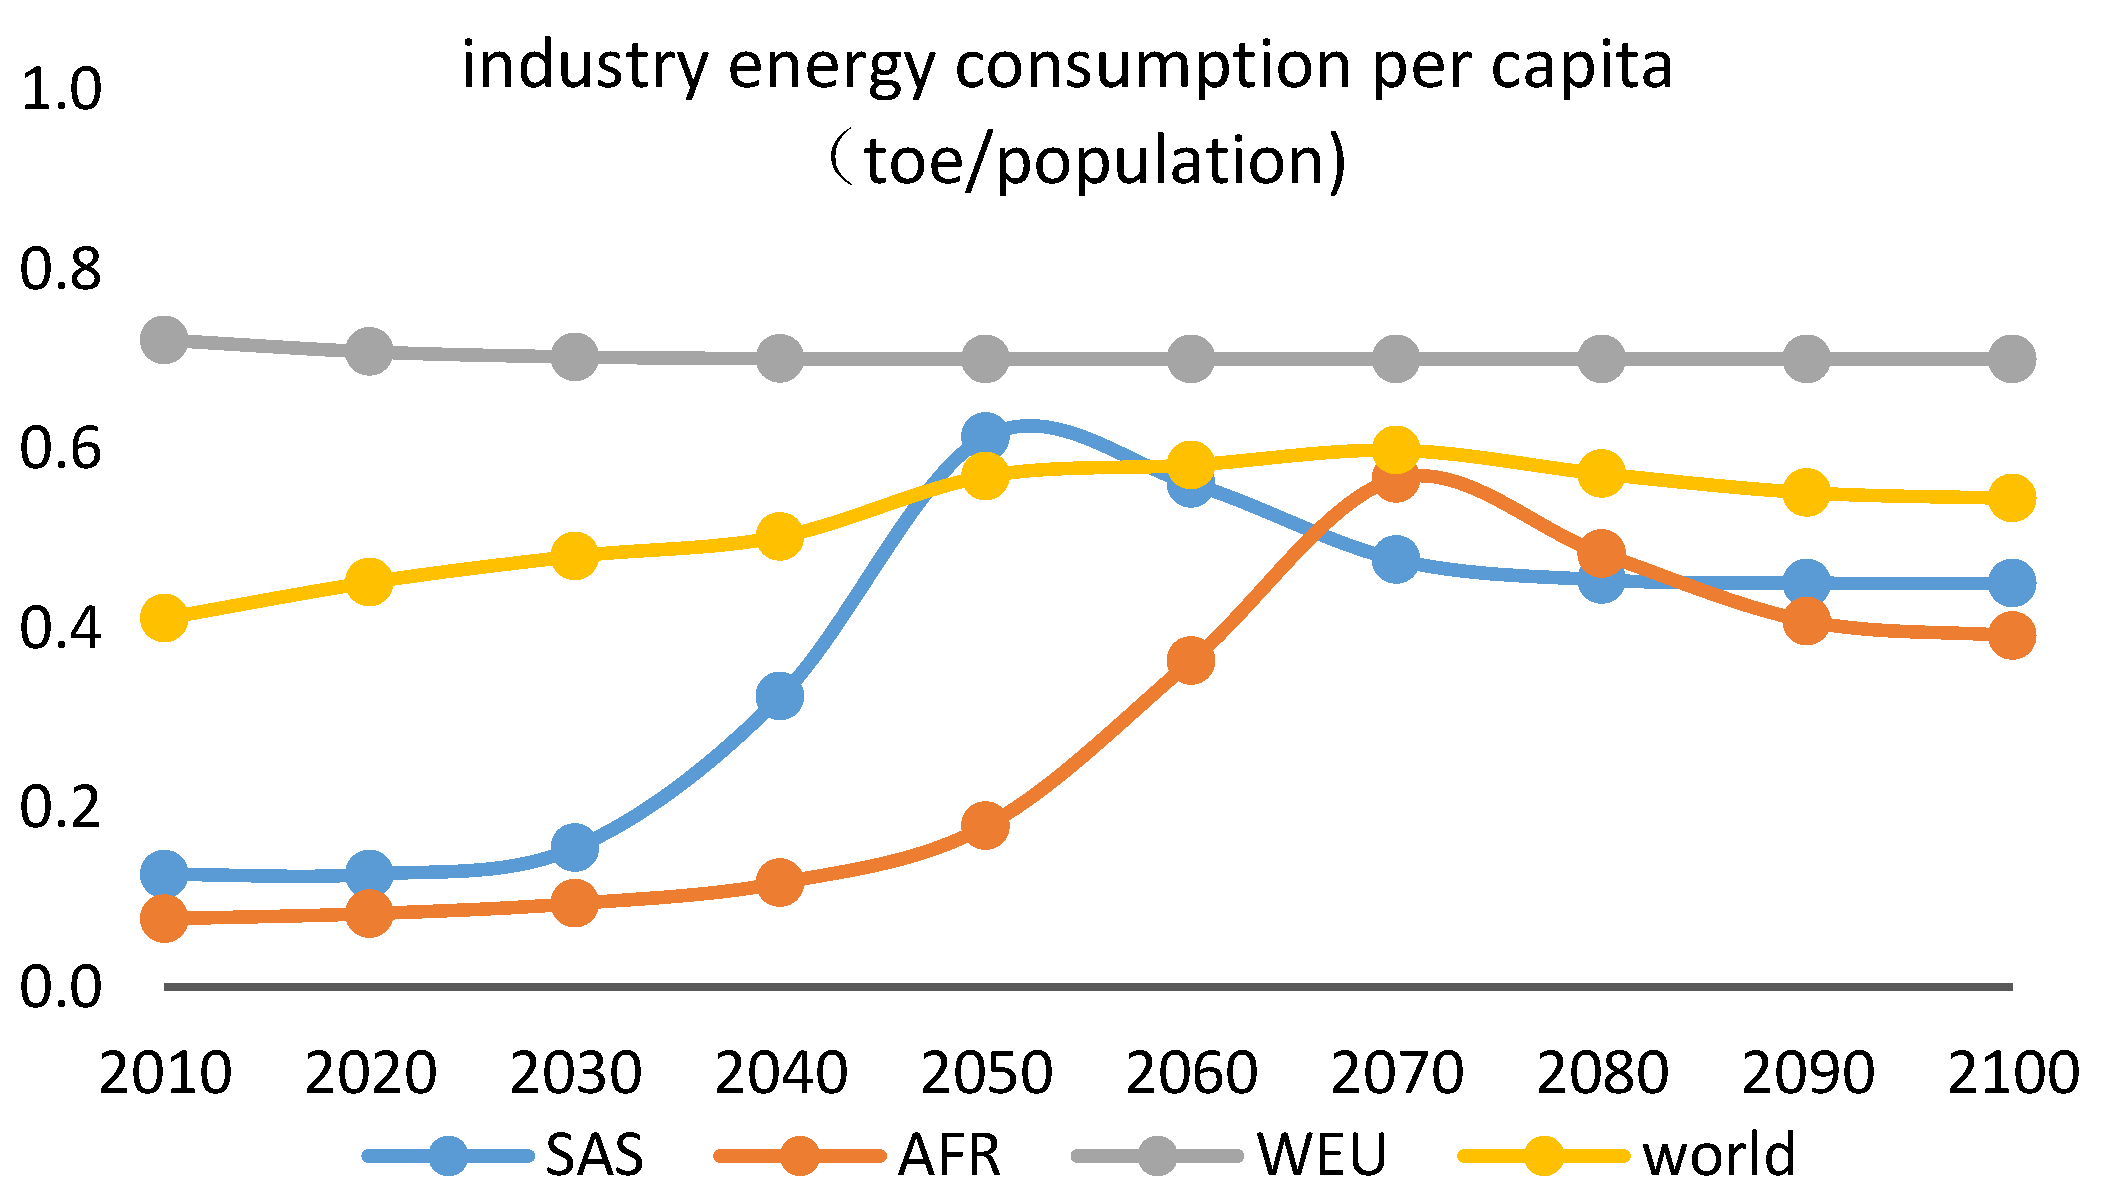
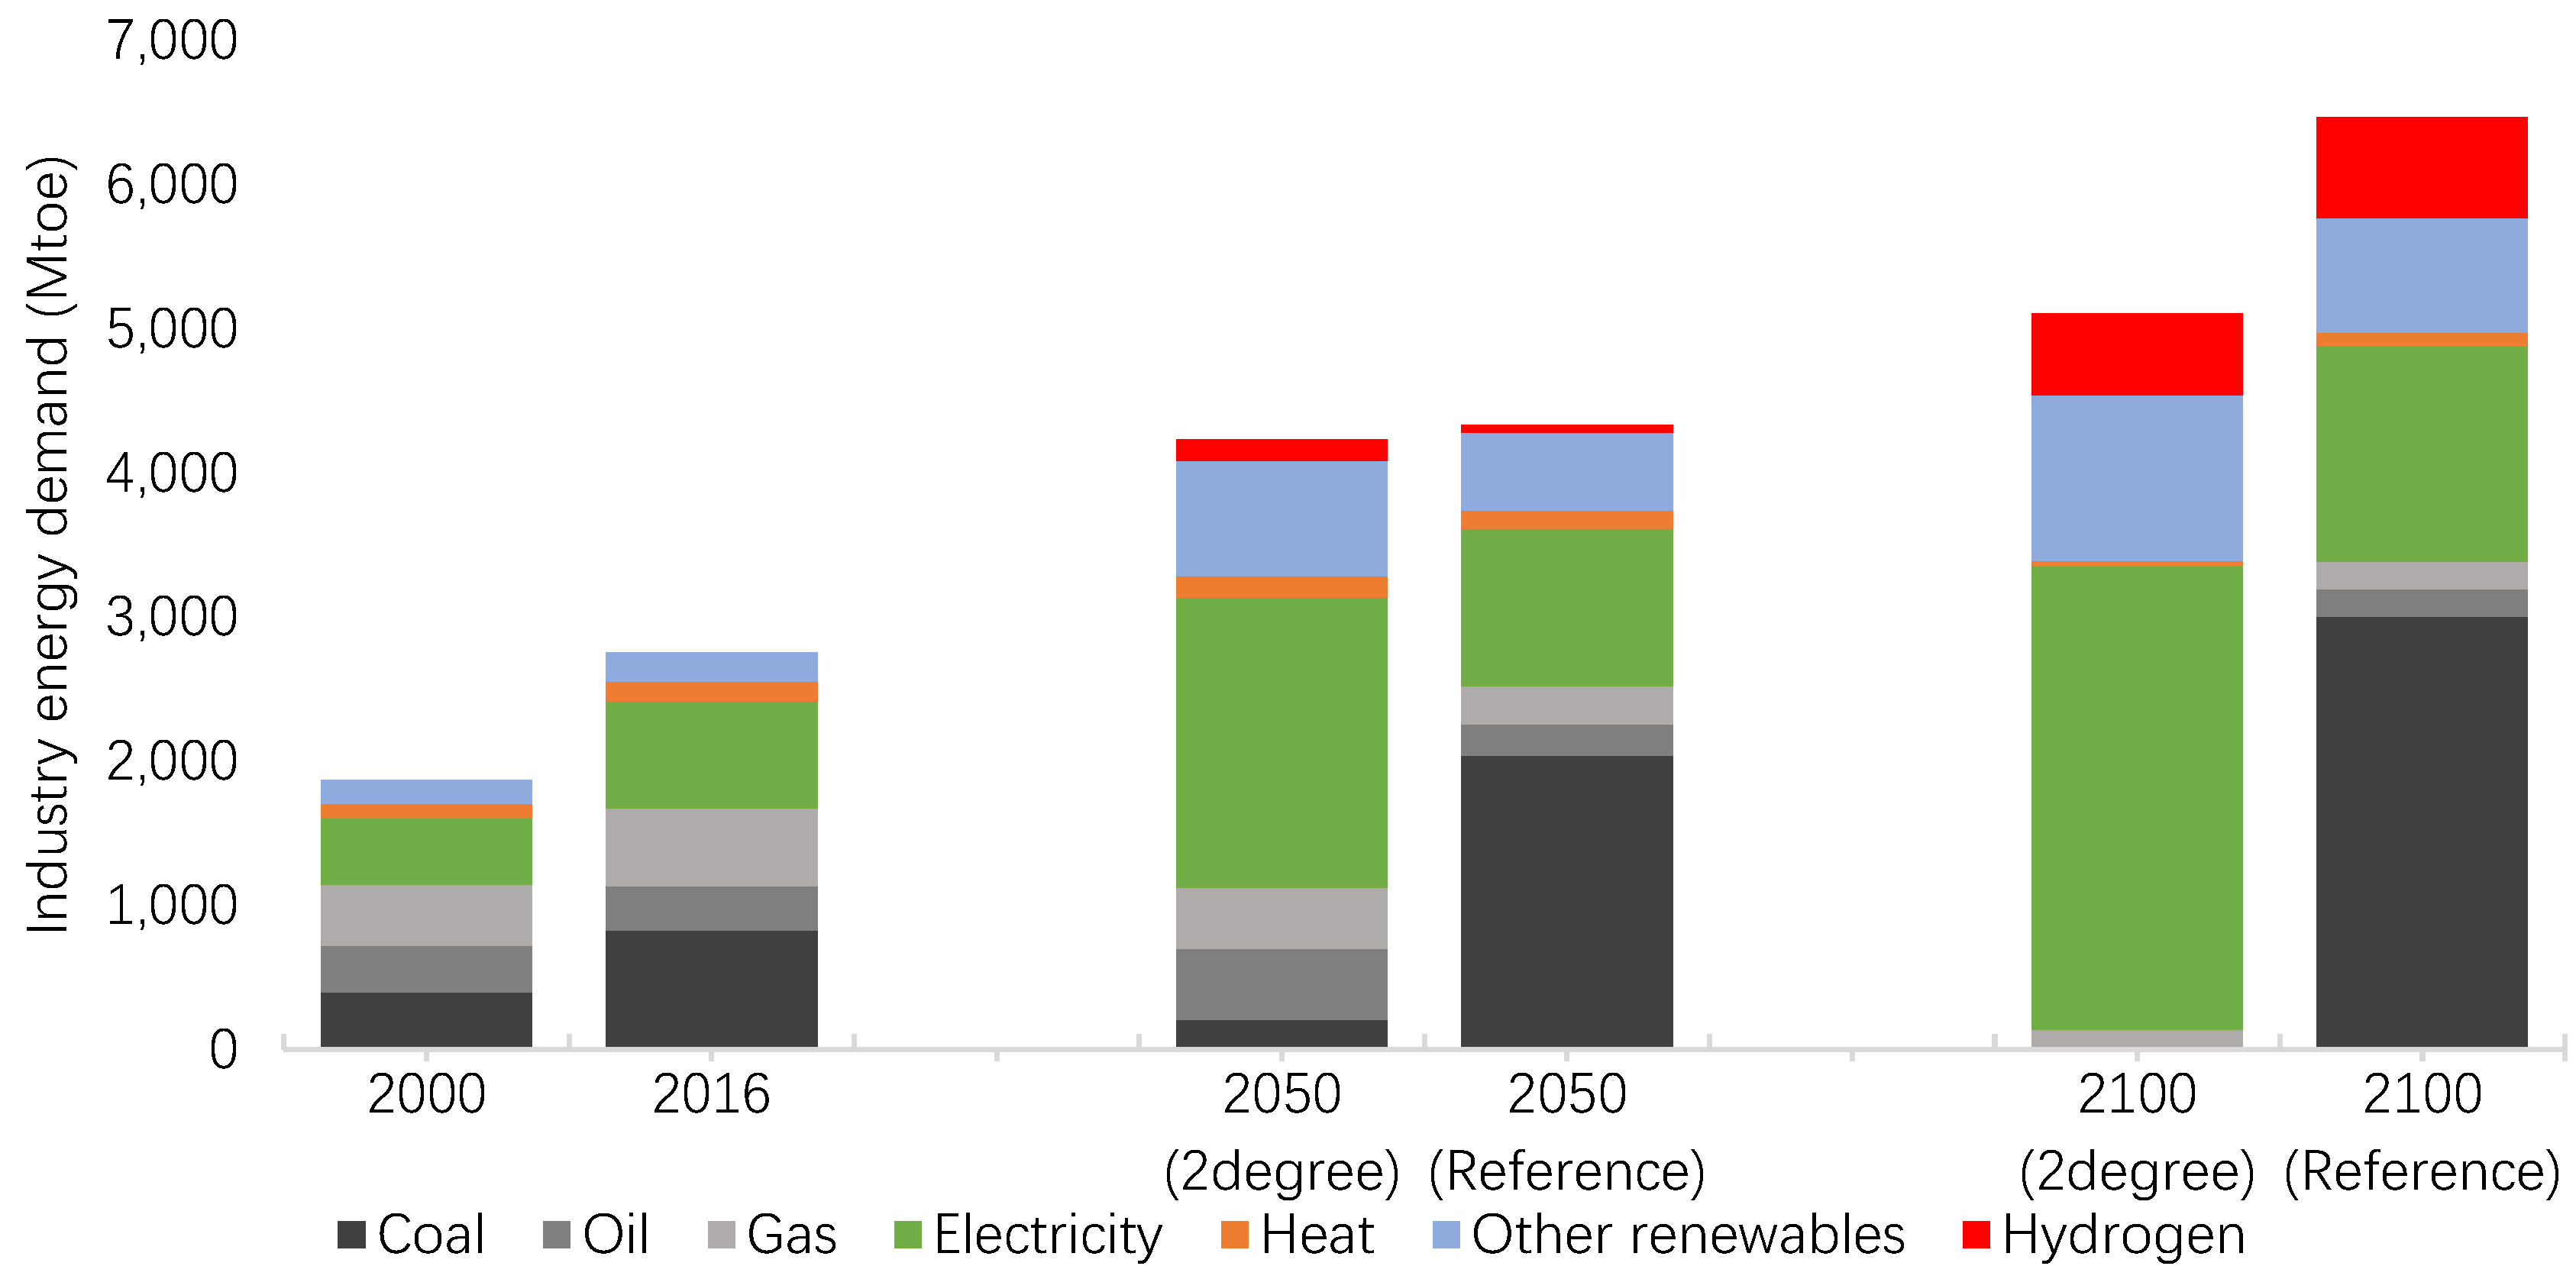
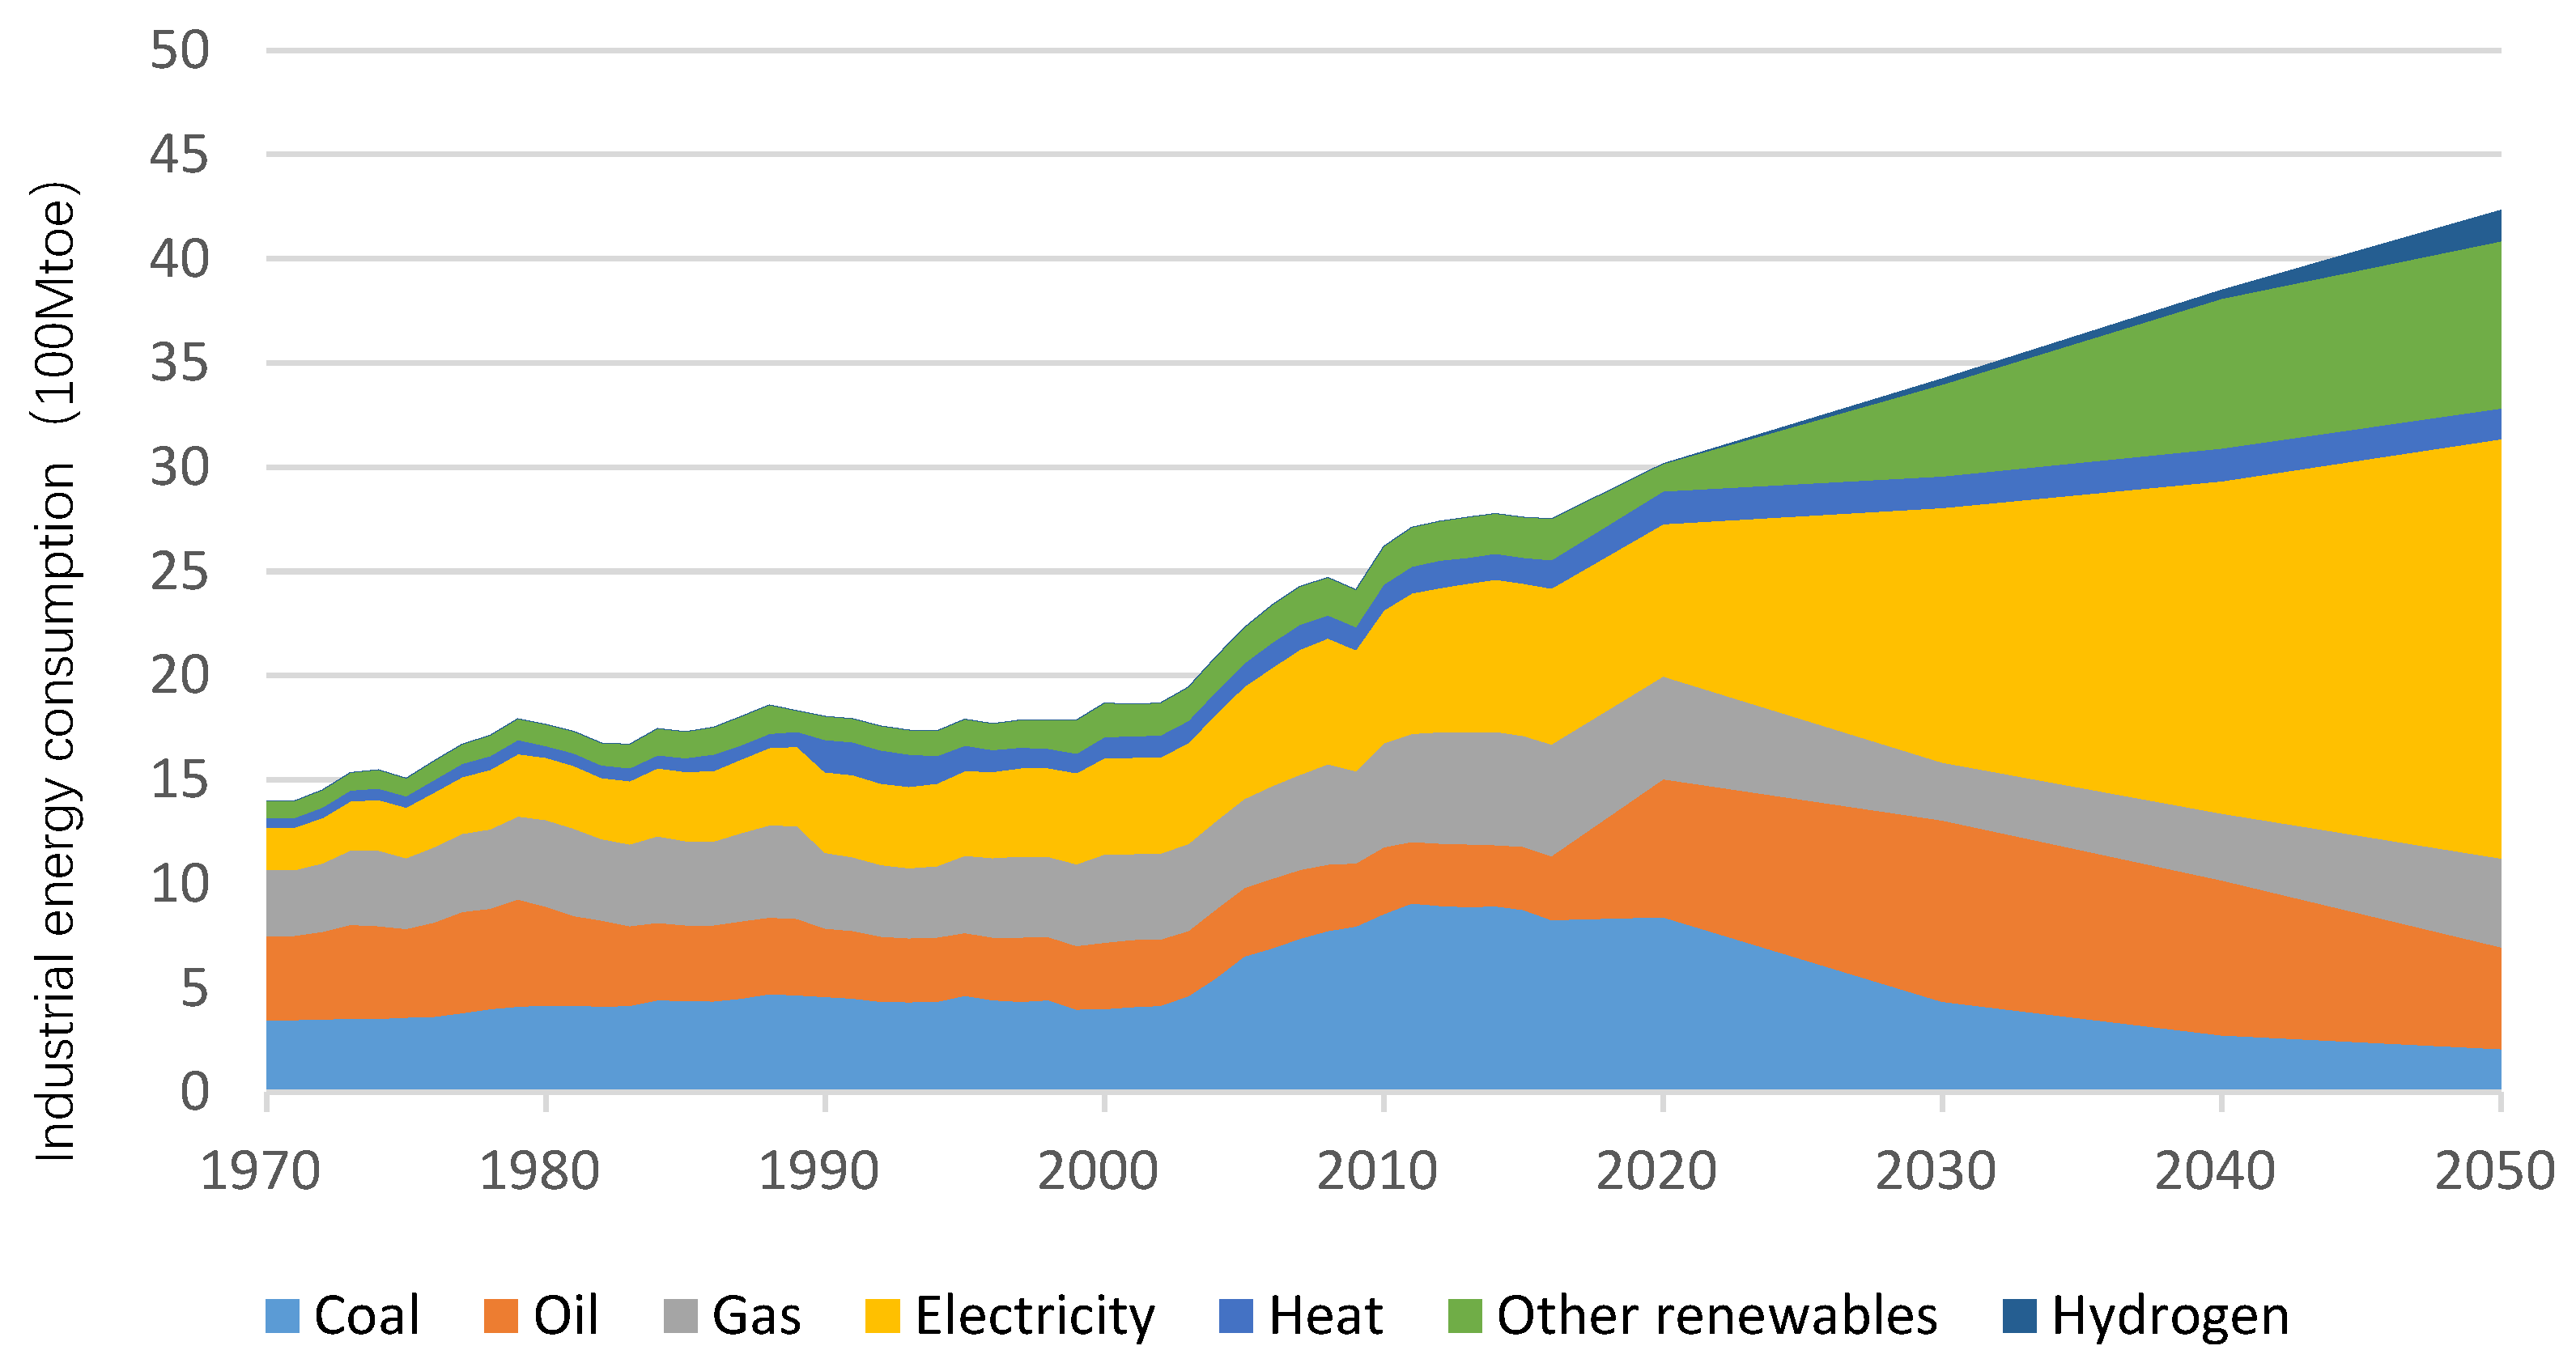
3.2. Industrial Energy Consumption and Demand

In 2017, the direct energy consumption of the industrial sector was 2821 Mtoe, accounting for 29% of end-use energy consumption [2]. The industrial sector’s direct emission is approximately 7.7 GtCO2, which is about 24% of the world total emissions in 2016 [2]. Based on the historical emissions of the industrial sector, both direct and indirect emissions are increasing from 1970 to 2010, with a rapid increase after the 2000s, accompanying fast industrialization, especially the heavy industry development in China. It was also found that the indirect emissions from electricity and heat consumption in the industrial sector is increasing faster than direct emissions, implying that the electrification for the industrial sector plays an increasingly important role in mitigation options.
As introduced in Section 2.2, the total industry energy demand is firstly projected using an S-curve and then energy structure in industry sector is optimized by the MESSAGE model [36]. The identified parameters in S-curves for 11 regions are listed in Table 5.
The industrial energy consumption per capita estimation from the S-curve model for several specific regions is shown in Figure 4. Most of the countries in WEU are now in Post-industrialization stage and they concentrate more on technology-intensive products with high added value in industrial sectors. Furthermore, lots of efforts have been spent on energy efficiency improvement. For example, energy intensity in manufacturing sector from Ireland, Denmark, and United Kingdom and United States decreased by 46%, 26%, 20%, and 9%, respectively in the past five years. Consequently, industry energy consumption per capita in WEU will experience a decreasing trend in coming years. On the contrary, countries in SAS and AFR are all developing or undeveloped countries. Those countries are in the pre-industrialization stage or are experiencing industrialization, and they will pursue urbanization and economic development in the coming years. With more energy-intensive products such as steel, cement, chemicals and petrochemicals, and nonferrous metals produced in industrial sectors, the energy demand will firstly see a significant growing trend in coming years, but it will shift to a slow decrease as industrialization is completed and energy efficiency improves. In 2016, 34 of 53 countries in Africa are estimated to be in the pre-industrialization stage according to the method introduced by Chen et al. [5], while 14 countries are in the intermediate-industrialization stage and only five countries are estimated in the post-industrialization stage. Therefore, considering the relatively undeveloped situation, AFR is the last region to complete the industrialization process while energy consumption in AFR will keep increasing due to its upcoming booming economic development and increasing population.
With the acceleration of industrialization in Africa and Asia and the re-industrialization in Central and South America, the energy consumption in the industrial sector increases year by year. By 2050, the direct energy consumption in the industrial sector will increase by 54% to 4230 Mtoe, accounting for 40% of end-use energy consumption and surpassing the building sector to become the largest end-use energy consumption sector. In 2100, the industrial energy demand will increase to 5060 Mtoe, 22% more compared to 2050. As discussed in Section 2, a 2 °C scenario and a business-as-usual (BAU) scenario as the reference are used in this study, and the industrial sector is part of the whole global energy system in these scenarios [37]. Energy technologies in industry and other sectors are optimized to provide energy services in the MESSAGE model for both scenarios. As seen in Figure 5, more electricity is consumed in the 2 °C scenario, resulting in less energy consumption compared with the reference case. In 2050 and 2100, industry energy demand under 2 °C conditions are 5% and 20% respectively less than that in the reference scenario.
The energy structure is optimized in the above two scenarios. In the 2 °C scenario, total fossil fuel consumption in the industrial sector fell to 1120 Mtoe in 2050, a decrease of 34% compared with 2017. The fossil fuel consumption reduction in the industrial sector is mainly due to increasing electricity consumption and the direct use of clean energy such as solar, bioenergy, and geothermal energy to provide heat within the low and middle range of temperature. Compared with 2017, the total electricity consumption in the industrial sector in 2050 increased by about 1240 Mtoe, accounting for 90% of the industrial energy increment. The share of electricity consumption in the industrial sector increases from 27.1% in 2016 to 48% in 2050 with an average annual growth rate of 0.6 percentage which is four times the growth from 2000–2017. Besides the increasing electricity consumption, the direct use of renewables in industry increases more than three times from 2016 to 2050, most of which are solar and bioenergy deployment. Solar energy utilization in the industrial sector has achieved extensive development from a few applications. With the increasing maturity of solar energy application technology, the cost of direct solar technology utilization in the industrial sector has dropped significantly. Solar water heaters, solar air heating systems, and solar collector systems are widely used in industrial processes for low-temperature heating and preheating in high-temperature demand. Furthermore, as the cost of clean energy power generation declines, hydrogen produced by electrolyzed water will gradually become economically competitive with fossil fuel energy hydrogen production, which is driving more hydrogen usage in industrial sector to provide high-temperature heat. 150 Mtoe hydrogen is expected to be used in 2050 while it increases to 570 Mtoe in 2100. In summary, more electricity and clean energy are used in 2 °C scenario compared with that in the reference scenario, as can be seen from leading to significant carbon reduction.
If the energy consumption for producing electricity, heat, and hydrogen are also allocated to consuming sectors, energy consumption in industrial sector increases to 4086 Mtoe in 2016 and 5270 Mtoe in 2050, increasing by 48% and 25% respectively compared with the case without electricity, heat and hydrogen energy consumption allocating to consuming sectors as shown in Figure 5. As seen in Figure 6, adjusted industry energy demand in 2 °C scenario is comparable to that in the reference scenario before 2050, while energy demand is smaller in the 2 °C scenario after 2050 due to massive electricity utilization and cleaner energy based power generation.

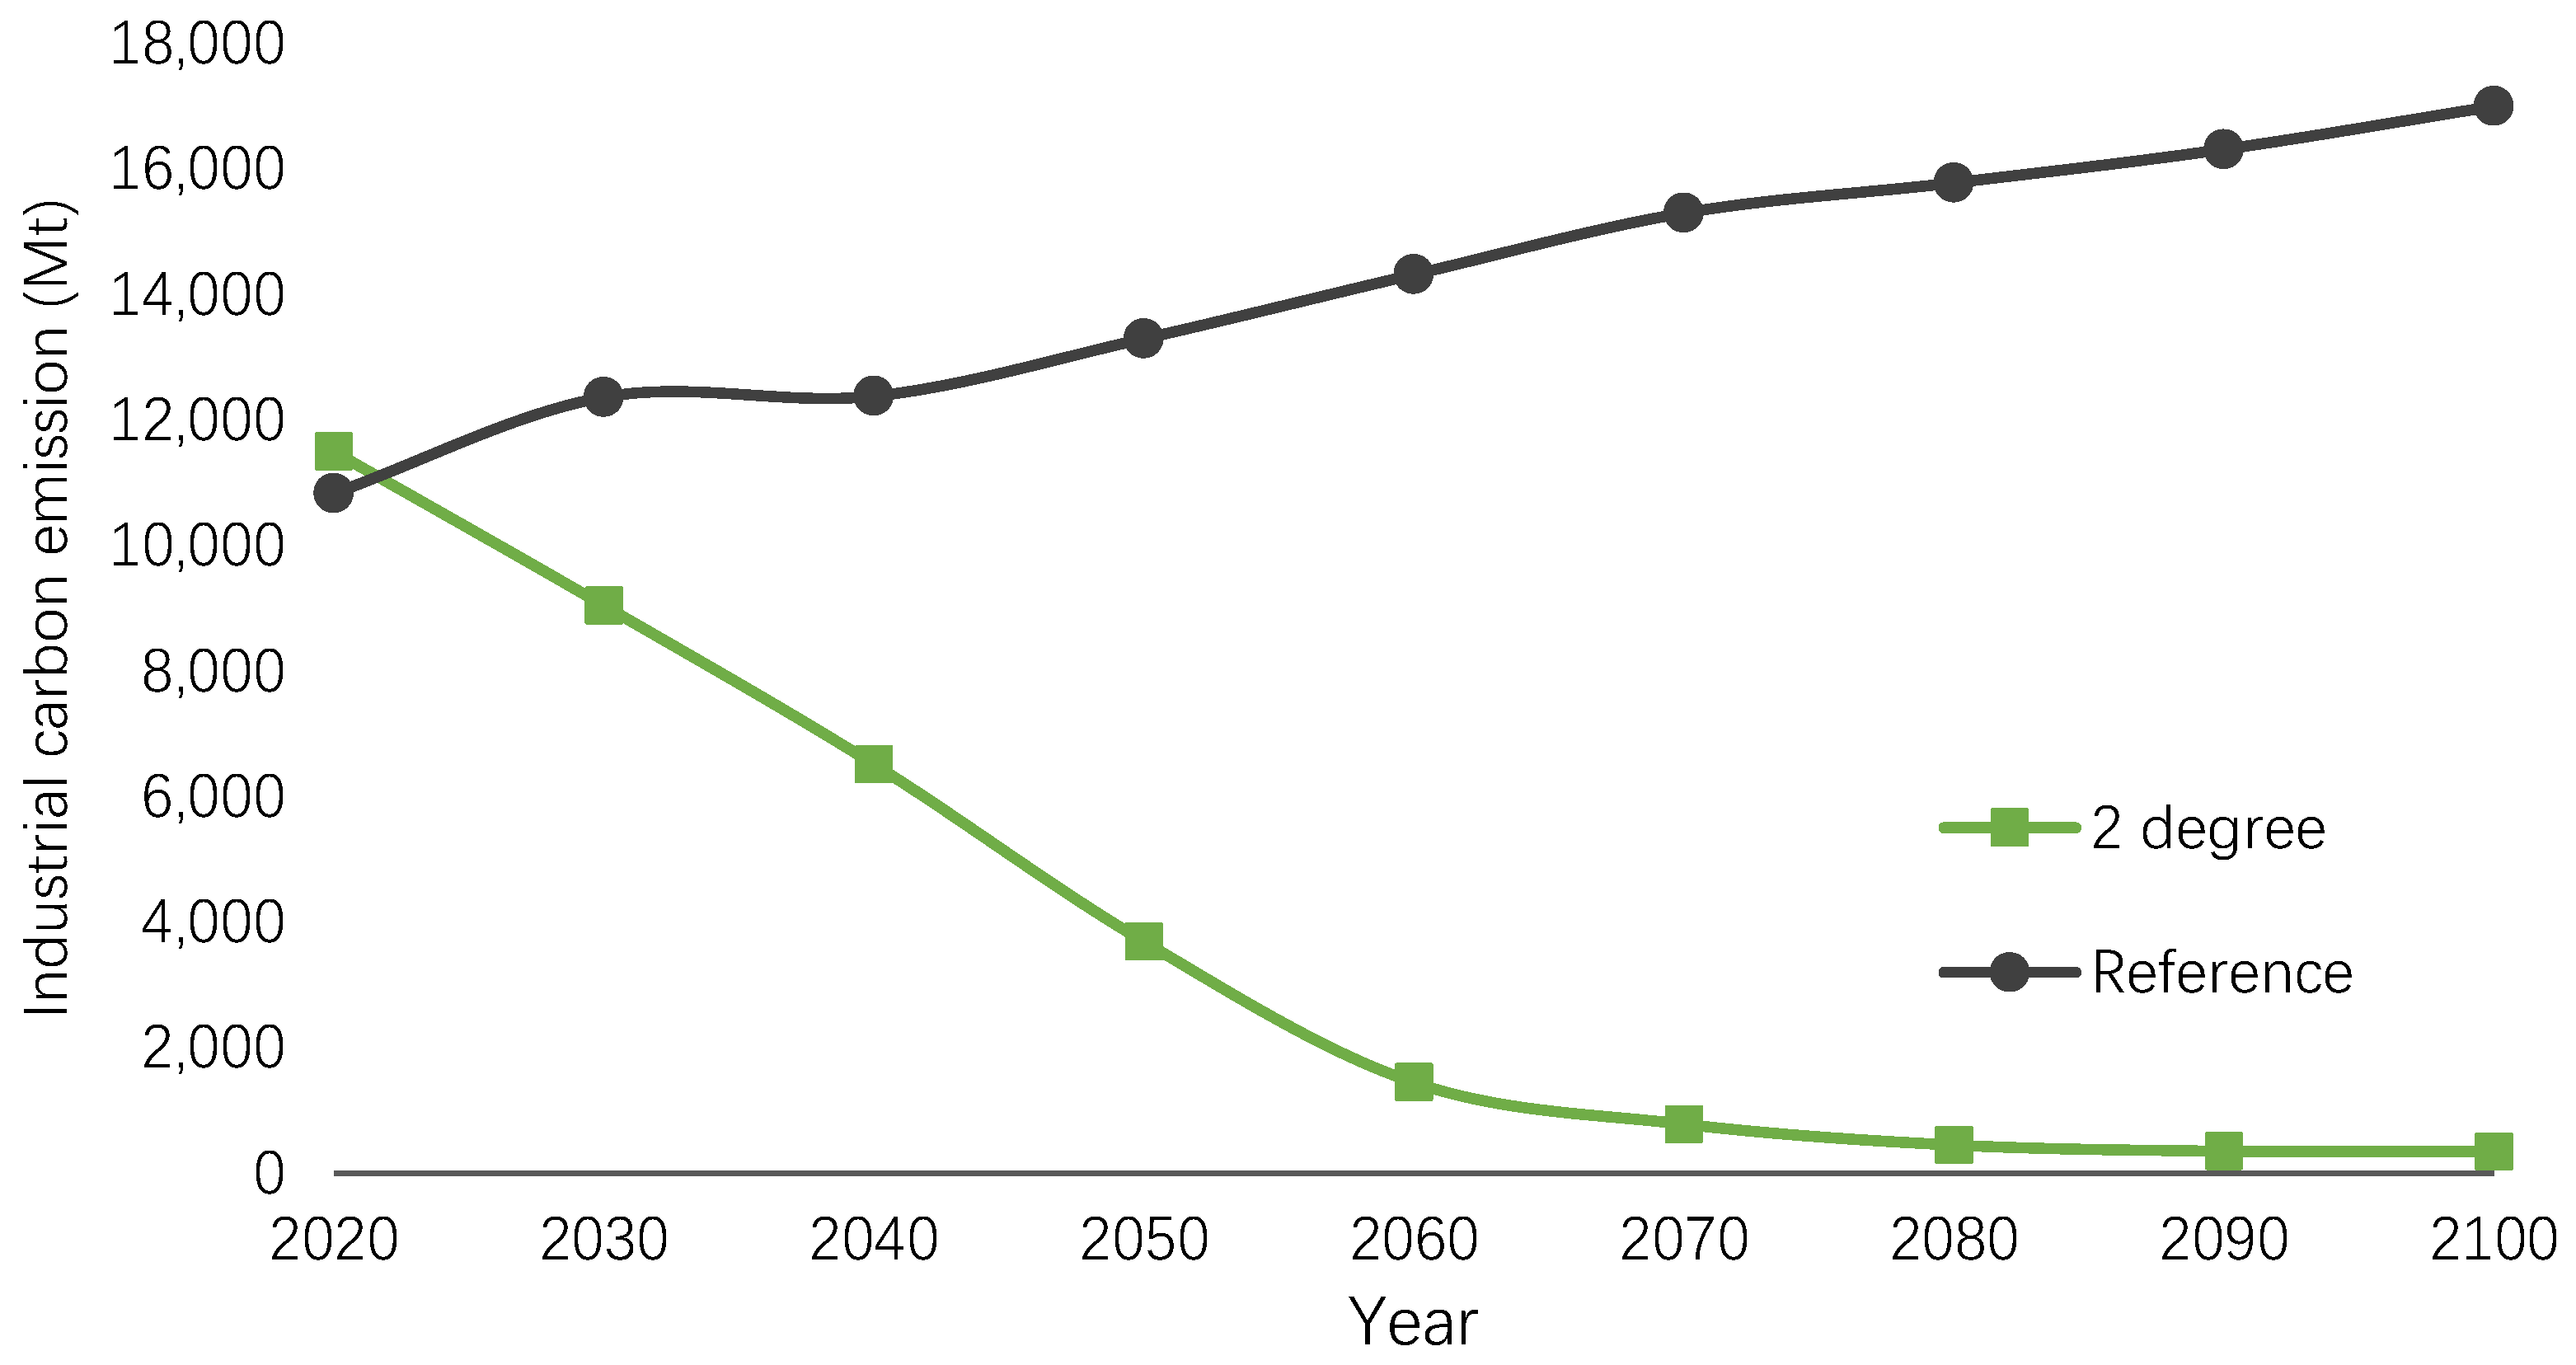
3.3. Industrial Emissions and Its Projection

It should be noted that CO2 emissions from fuel combustion with electricity, heat, and hydrogen are allocated to consuming sectors in this research. Total direct and indirect industrial emission in 2016 is 13,537 Mt CO2 accounting for 42% of total emissions. Industrial sector dominates the emissions in the end-use factors and the emissions differ a lot between countries. Nearly half (43%) of industrial carbon emissions come from China, while the second largest emission source (United States) accounts for 8.3% and the third largest emission source (India) accounts for 7.1%. In the case of reference scenario, carbon emission in 2100 reaches to 17,000 Mt CO2 which is even 25% larger than that in 2016 (see Figure 7). Under conditions of 2 °C constraints, the industrial carbon emission in 2050 reduces to 3690 Mt CO2 decreasing by 73% compared with that in 2016, and the carbon emission is further reduced to 350 Mt CO2 in 2100 as shown in Figure 7. Carbon intensity improvement, energy intensity improvement, energy and economic structure optimization are believed to contribute to the carbon emission reduction in the 2 °C scenario [38].

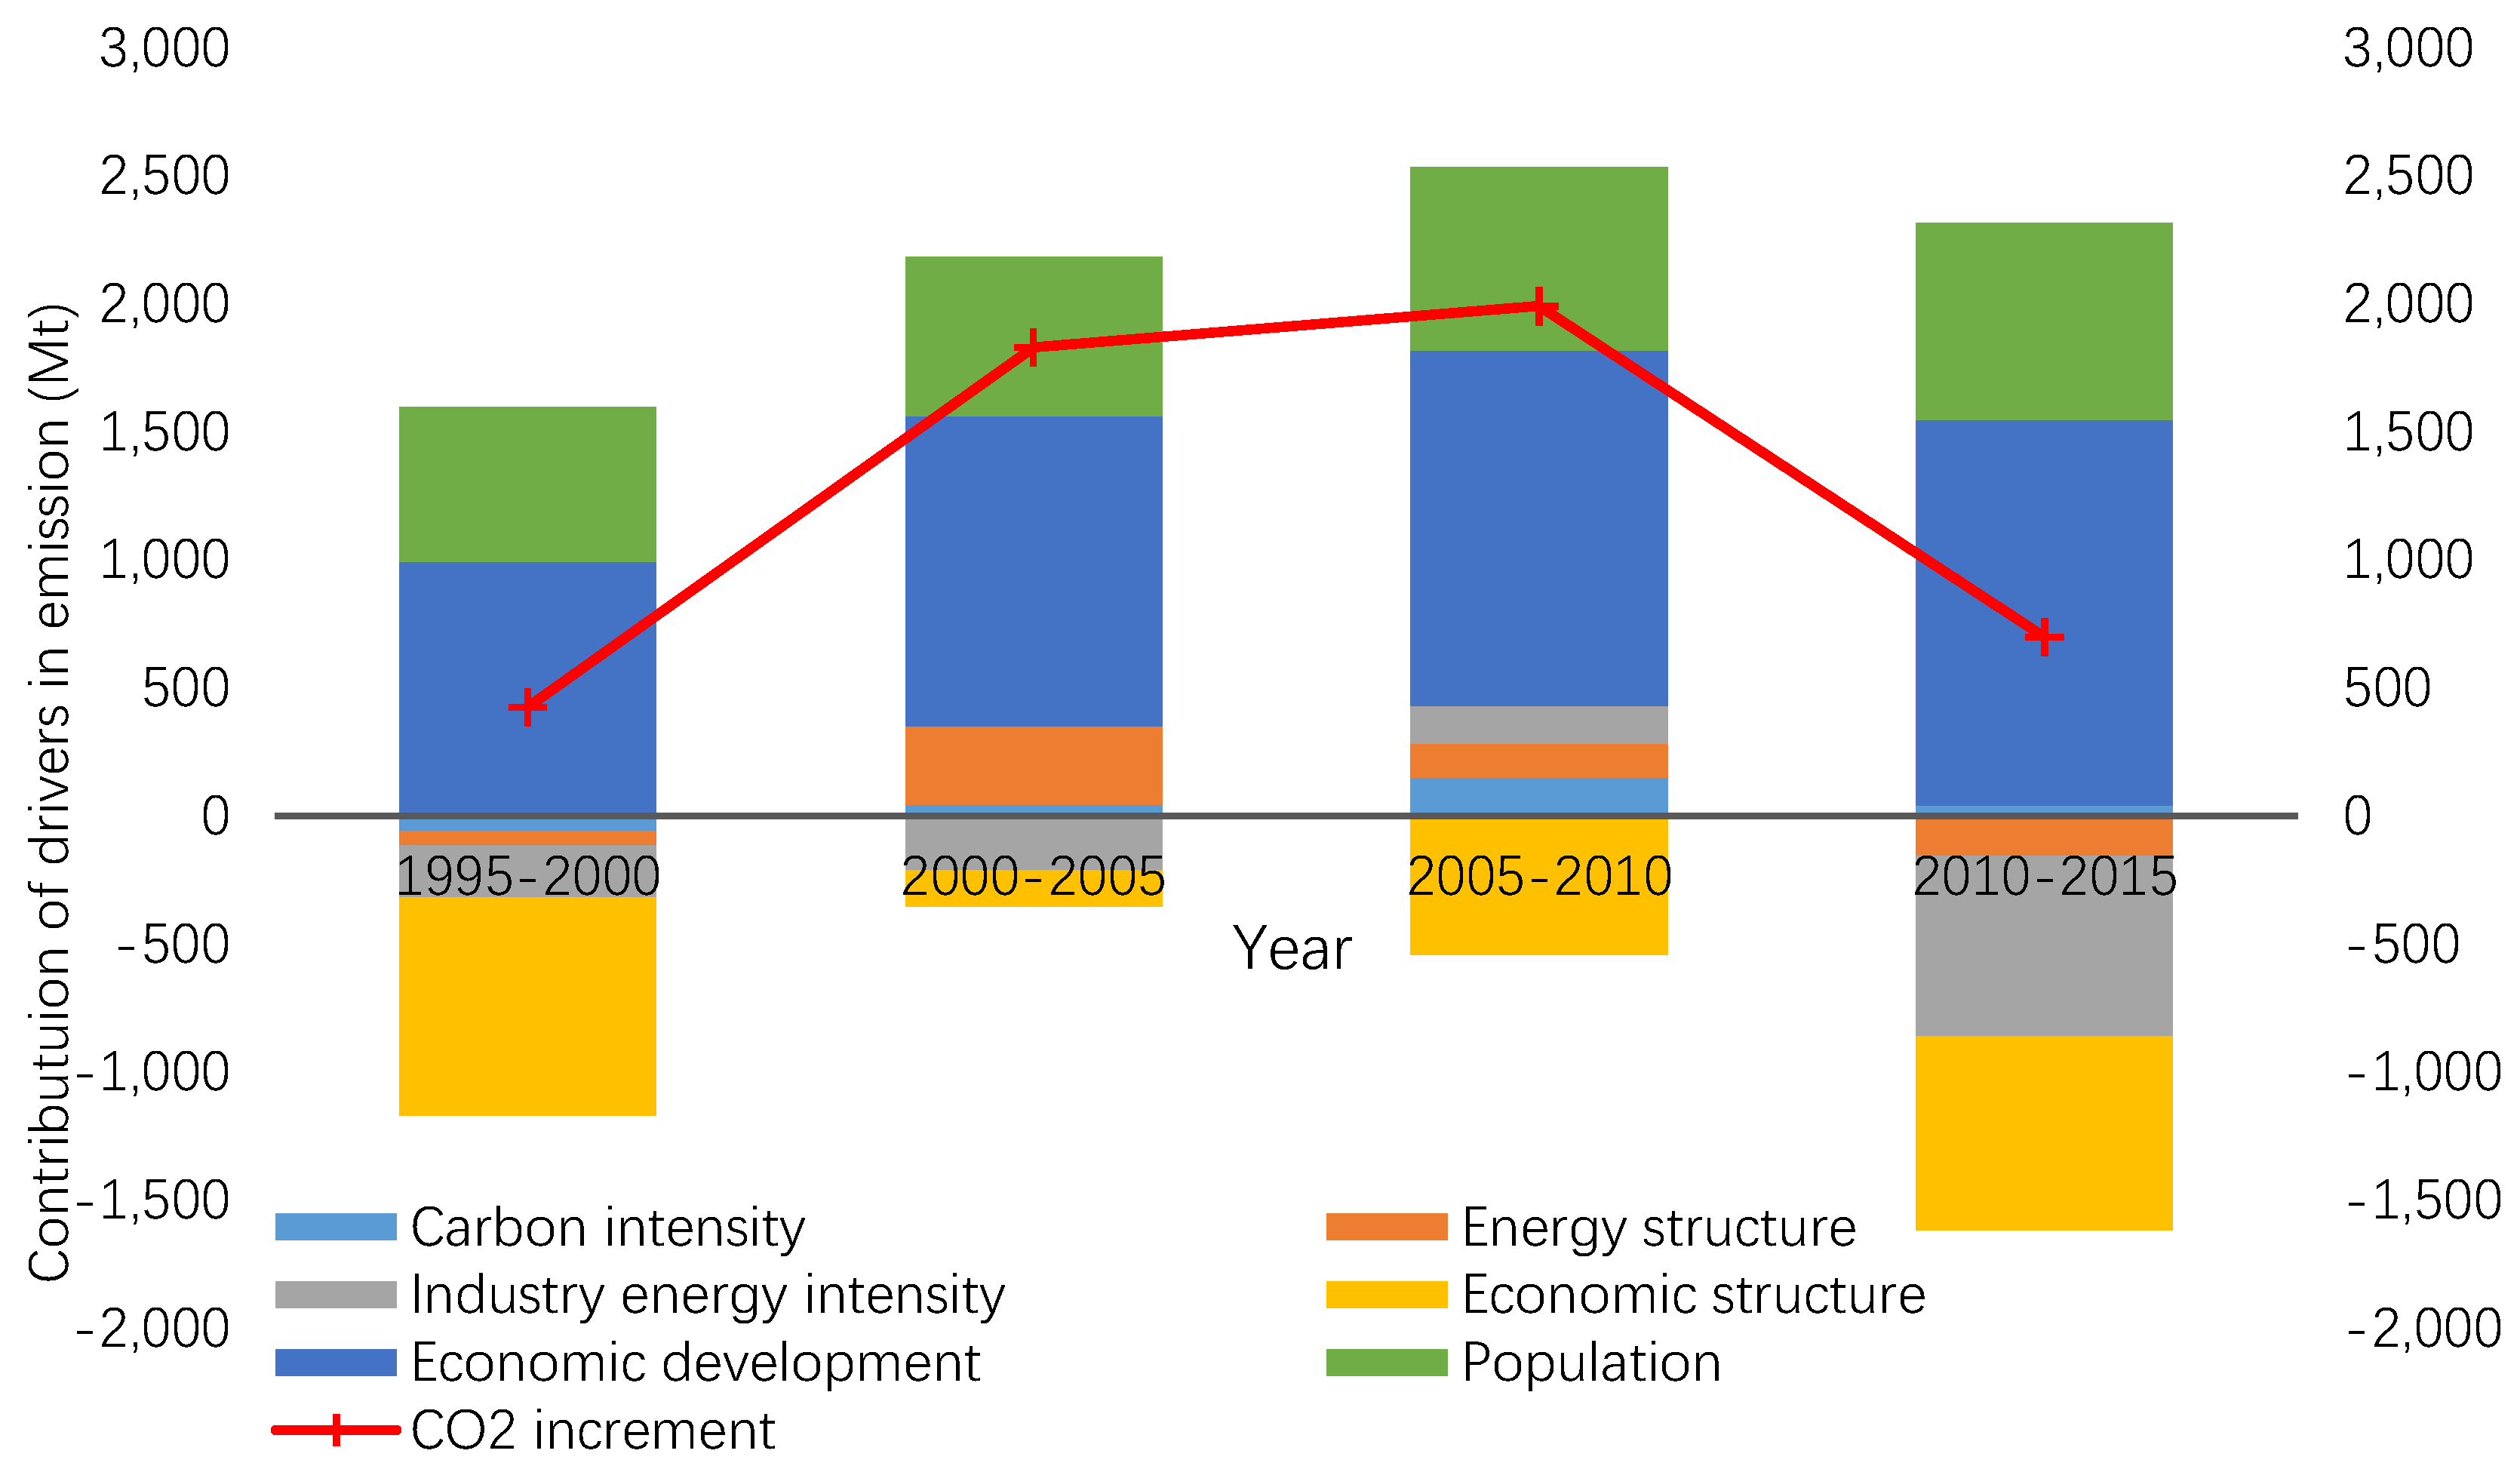
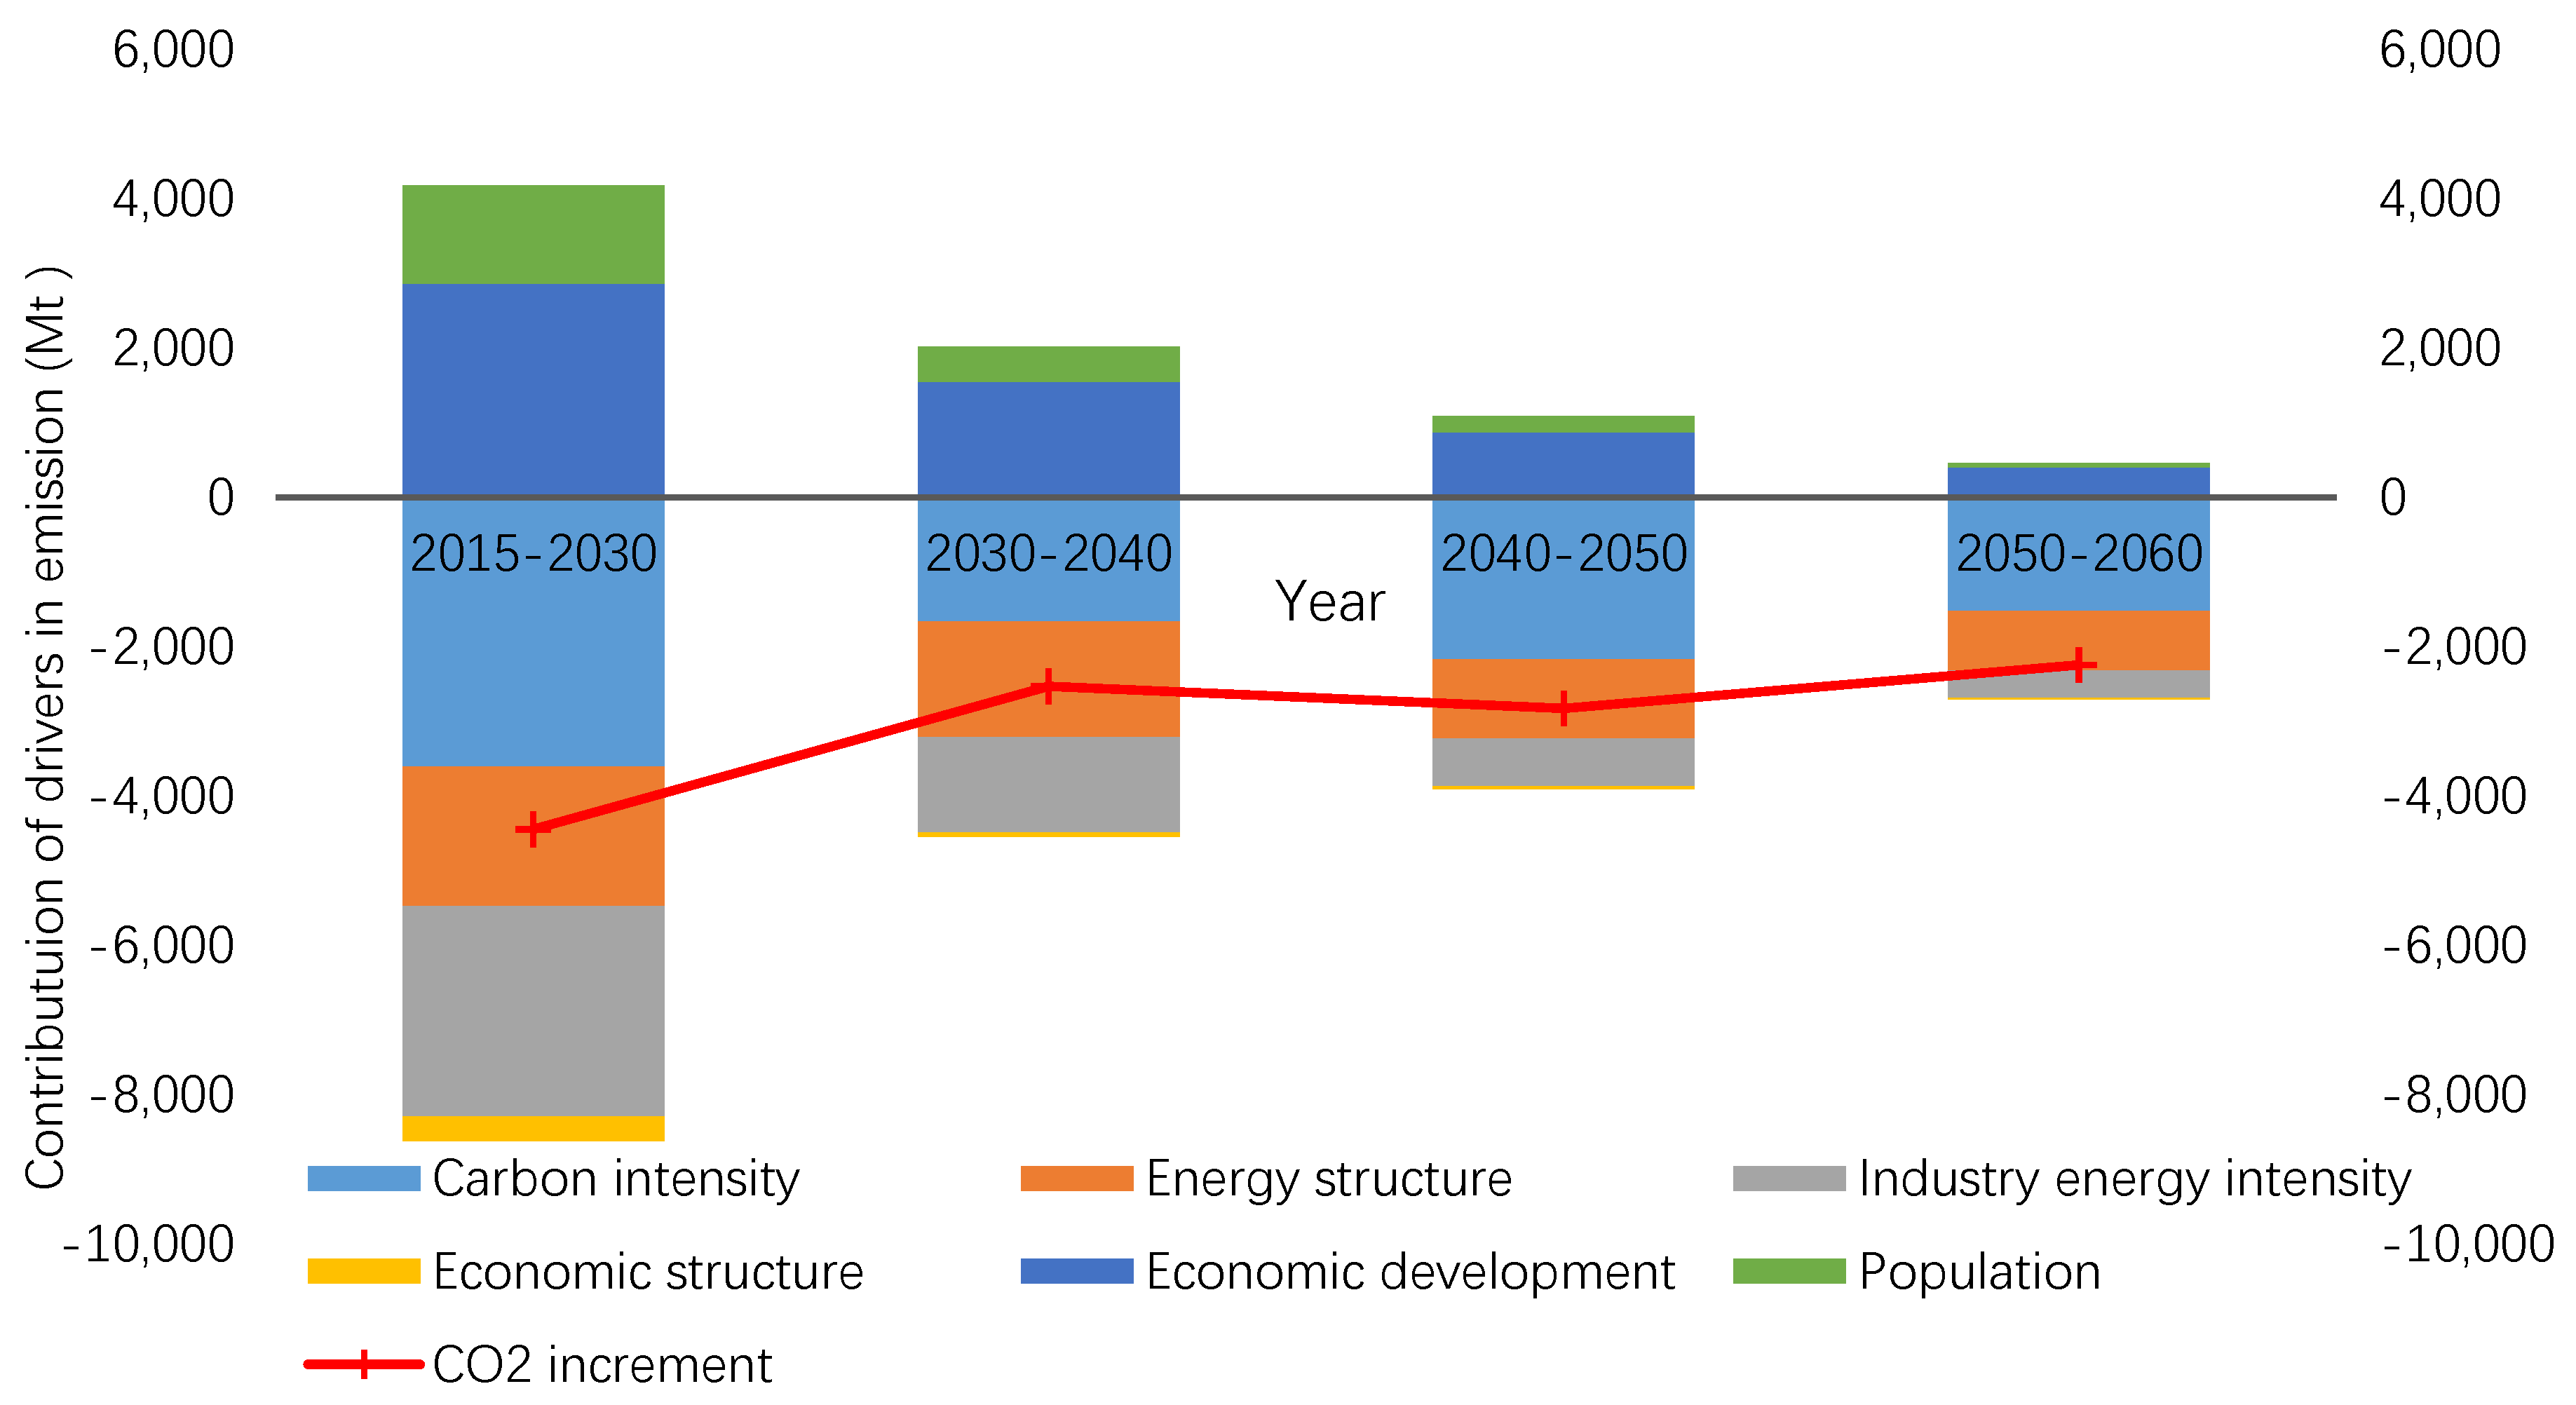
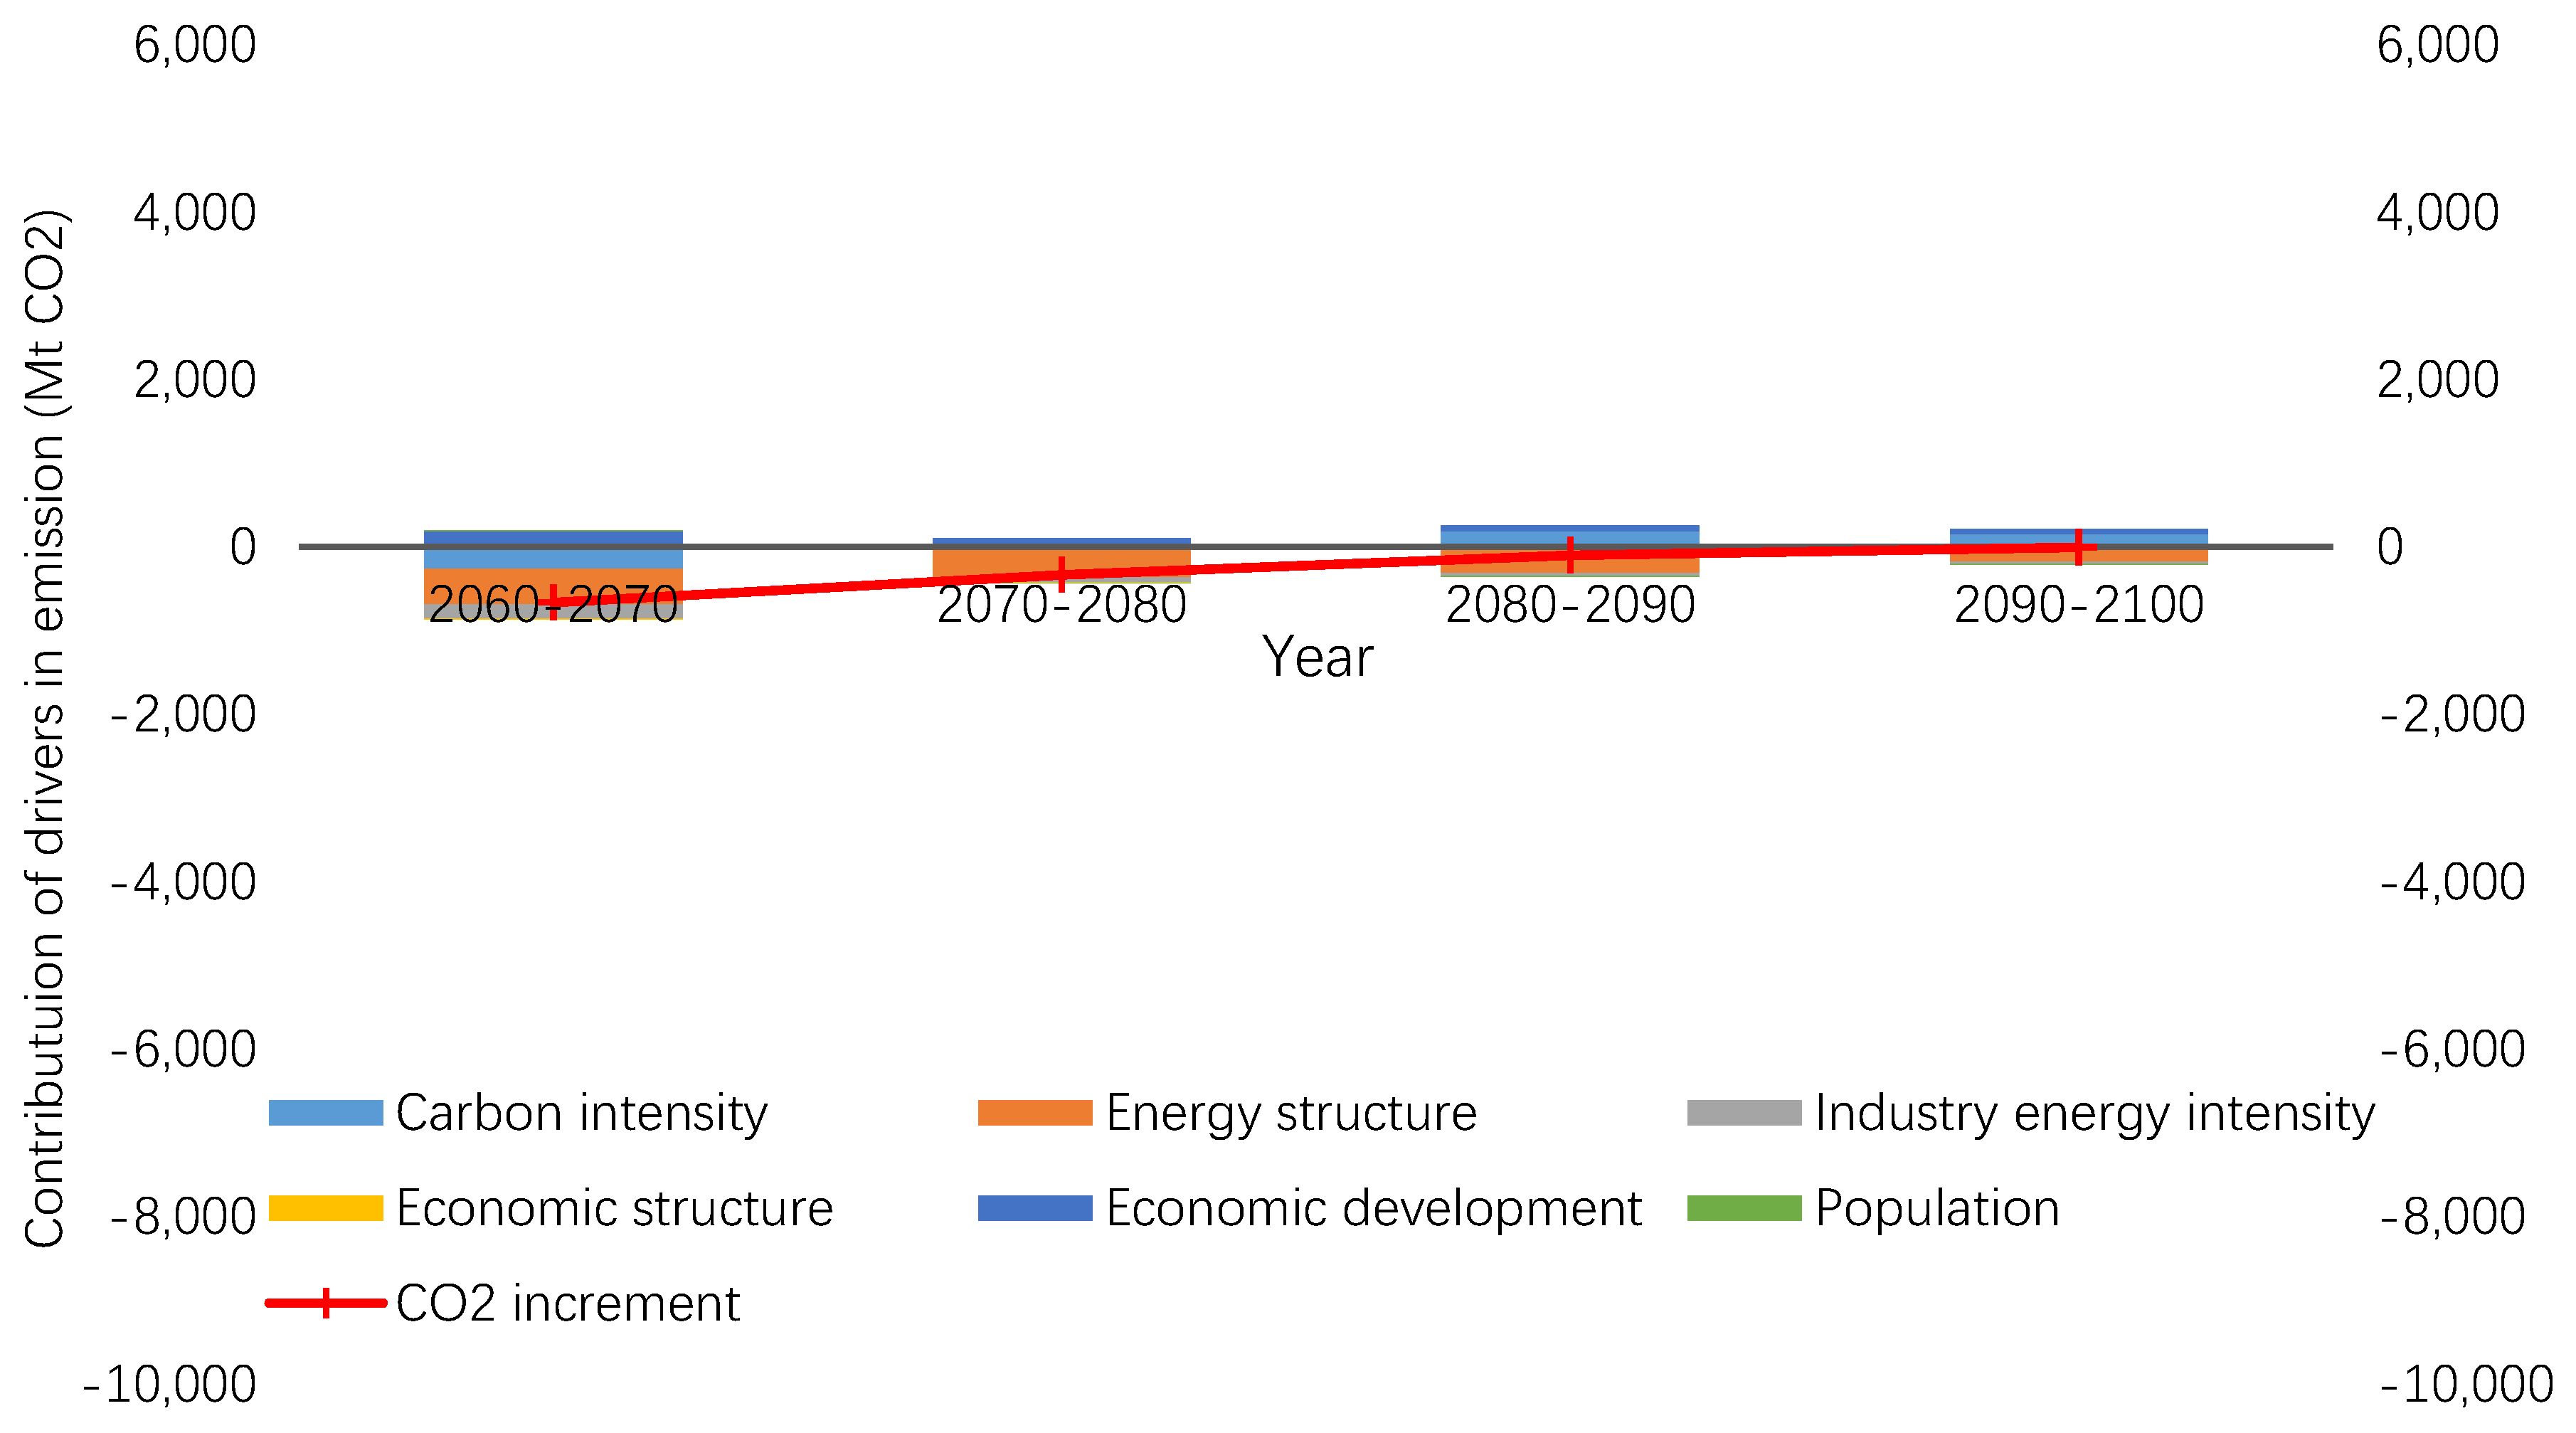
3.4. Decomposition Analysis of Industrial Carbon Emission

The industrial carbon emission from 1995 to 2015 is decomposed according to the LMDI method introduced in Section 2. As can be seen from the decomposition results shown in Figure 8, every five-year CO2 increment is positive from 1995 to 2015 and the increment peaks around 2010. The economic development and increasing population contribute the most to CO2 incremental growth, while the economic structure contributes to the decreasing CO2 emissions. Energy structure and industry energy intensity might contribute positively or negatively to emission reductions depending on the energy price, energy efficiency improvement, clean energy development rate, etc. Taking the case from 2010 to 2015 as an example, the contribution of carbon emission from economic development, population, carbon intensity, energy structure, industry energy intensity, and economic structure are 1510, 770, 40, −160, −700, and −760 Mt CO2 respectively, resulting in a net 700 Mt CO2 increment.
Economic development is the biggest driving force of CO2 emission increase, especially in the emerging economies like China, Brazil, India, Russia, and South Africa. Based on the World Bank Database, the averaged GDP growth rate from 2010–2015 in China and India was 8.3% and 7.4% respectively, while the world’s averaged GDP growth is around 3% [7]. Globally, GDP per capita in 2015 reached to 14,825 USD/person, increasing by 12% compared with that in 2010. Economic development accounts for 65% of positive emissions. Increasing population is the second largest driver for CO2 emission as industrial energy demand increases. Average population growth in Sub-Saharan Africa from 2010 to 2015 was 2.76%, more than twice the world’s average growth. Increasing populations account for 33% of positive emissions. Industrial carbon intensity contributes to positive CO2 emission, but its contribution decreases significantly due to much cleaner gas utilization in end-use sectors, and the use of increasing renewables power generation in power & heat generation sector. The share of gas consumption in fossil fuels is 30% and 30.4% in 2005 and 2010 respectively. In 2015, the share of gas further increases to 31.4%. As the share of electricity consumption increases, fossil fuel consumption in the industrial sector is limited, and therefore industrial carbon emission is restricted. Carbon intensity only accounts for 2% of positive emissions from 2010 to 2015. As the energy structure becomes cleaner, the role of energy structure adjustment in 2010–2015 contributes negatively to CO2 emission. In 2010, the share of electricity consumption in the industrial sector was 24.3% with only a 0.2 percentage point increment from 2005. Correspondingly, the share of electricity consumption increased to 26.5% in 2015 and the increment from 2010 to 2015 was 2.2 percentage points which is 11 times the increment from 2005 to 2010. The share of fossil fuel consumption decreased by 1.2% from 2010 to 2015 as electricity consumption increased. As a result, energy structure contributed 10% of decreasing emissions. Industry energy intensity and economic structure contribute for 43% and 47% respectively in the decreasing emissions. Regarding energy intensity, it decreased from 1.53 to 1.45 toe/thousand USD with a decline of 5.2%. Declining energy intensity is mainly attributed to continuous energy efficiency enhancement and production of more high value-added products. Take United States as an example, energy saving reached to 414 PJ in manufacturing sector from 2010 to 2015. The saved energy is even more than the energy consumed in manufacturing sector from Austria and Czech Republic. As the statistics data from IEA members, manufacturing sector saves 1410 PJ from 2010 to 2015, while chemicals and chemical products sector, paper pulp and printing sector, and non-metallic minerals sector save 460 PJ, 390 PJ, and 77 PJ, respectively. The manufacturing sector contributes the most energy savings in industry sector. Due to greater production of high value-added products, 29 of 33 IEA members saw energy efficiency enhancement in the manufacturing sector. Ireland improved its manufacturing energy efficiency by 46% from 2010 to 2015 [39].
Among the driving factors, economic structure adjustment contributes the greatest emission reduction. Globally, economic structure transforms from industry driven economy to service driven economy. The share of industry value added in GDP declined in more than 160 countries, while service value added in GDP increased from 2010 to 2015. As global statistics data indicate, the share of industry value added in GDP decreased by 1.5 percentage points, while the share of service value added in GDP increased by 2.7 percentage point from 2010 to 2015 [7].
As can be seen from the annual industrial emission reduction shown in Figure 9, the industrial carbon emission path has three stages of characteristics: medium speed decline, high speed decline, and low speed decline. Maximum annual emission reduction peaks around 2040 to 2050 as −280 Mt CO2/a. To ensure global temperature rises well below 2 °C at the end of this century, the industrial sector needs to reduce emissions substantially before 2060.
Figure 10 exhibits decomposition of industrial carbon emission from 2015 to 2060. Net negative emission is required to meet the global 2 °C temperature control goal. Contrary to the situation from 2010 to 2015, carbon intensity and industry energy intensity will contribute most of the decreasing emissions after 2015 rather than the economic structure factor. Carbon intensity could reduce by 28% from 2015 to 2030 as fossil fuel consumption decreases. The share of fossil fuels in the industrial sector decreases from 62% in 2015 to 46% in 2030 with an average annual drop of one percentage point. Compared with the emission in 2015, declining carbon intensity contributes 3600 Mt CO2 decreasing emissions in 2030. Industry energy intensity is the second largest factor contributing to the decreasing emissions. Compared with industrial carbon emissions in 2015, the declining energy intensity has reduced carbon emissions by 2800 Mt CO2. Energy intensity is expected to decrease to 22% from 2015 to 2030 due to increased energy efficiency through equipment updates and more digital equipment applications. Energy structure adjustment also plays an important role in future emission reduction. Share of fossil fuels reduces by 15% from 2015 to 2030 as electrification rate increases and more renewables are directly used in the industrial sector. As indicated by the MESSAGE result, the electrification rate could increase from 26.5% in 2015 to 35.7% in 2030 with an increase of nine percentage points, which is five times the increase during same time range from 2010 to 2015. Besides the contributions from more electricity consumption, the direct use of renewables like solar, modern bioenergy, and hydrogen in the industrial sector are beneficial for energy intensity improvement. The direct use of renewables increases by 125% from 2015 to 2030 with more solar and hydrogen energy applications in the industrial sector. In 2030, the share of solar direct use could reach 37% in terms of renewables and the share of hydrogen could hit 6% from zero in 2015.
As can be found from Figure 10, the contribution of population growth and economic development in driving an increase of emissions declines over time due to population saturation. The world’s population will peak around 2070. Moreover, economy increase rate decreases over the next several decades, limiting the positive emission. GDP per capita increases by 30% in 2030 compared with that in 2020, whereas it only increases by 18% from 2050 to 2060. Totally, compared with emission in 2050, population and economic development drive an additional 460 Mt CO2 emission in 2060. However, the role of energy structure transition will become more and more important after 2030, while carbon intensity is still the biggest contributor to decreasing emission before 2060.
As can be seen from Figure 7, the industrial emission is well controlled after 2060. Even the emission reduction decreases after 2060 as indicated in Figure 11, it will become increasingly difficult to reduce emissions more. Consequently, marginal costs of emissions reductions in the industrial sector increase, which is also the reason why the government should seize the opportunity to control emissions in the industrial sector in the earlier stages. From 2060 to 2070, energy structure transition accounts for 50% of total decreasing emissions and the main contribution of energy structure transition comes from further electrification development and much cleaner power structure. In 2070, the electrification rate in industry sector reaches to 62% and clean power generation rate hits more than 90%. Further, 32,200 TWh is expected to be consumed in 2070 which is 3950 TWh more compared to 2060, which will cover the decreasing fossil fuels and increasing industry energy demand needs. Due to negative growth in the world population after 2070, the population starts to drive decreasing emissions, but contributes less than other factors to driving emission reductions.

4. Modes for Industrial Emission Mitigation

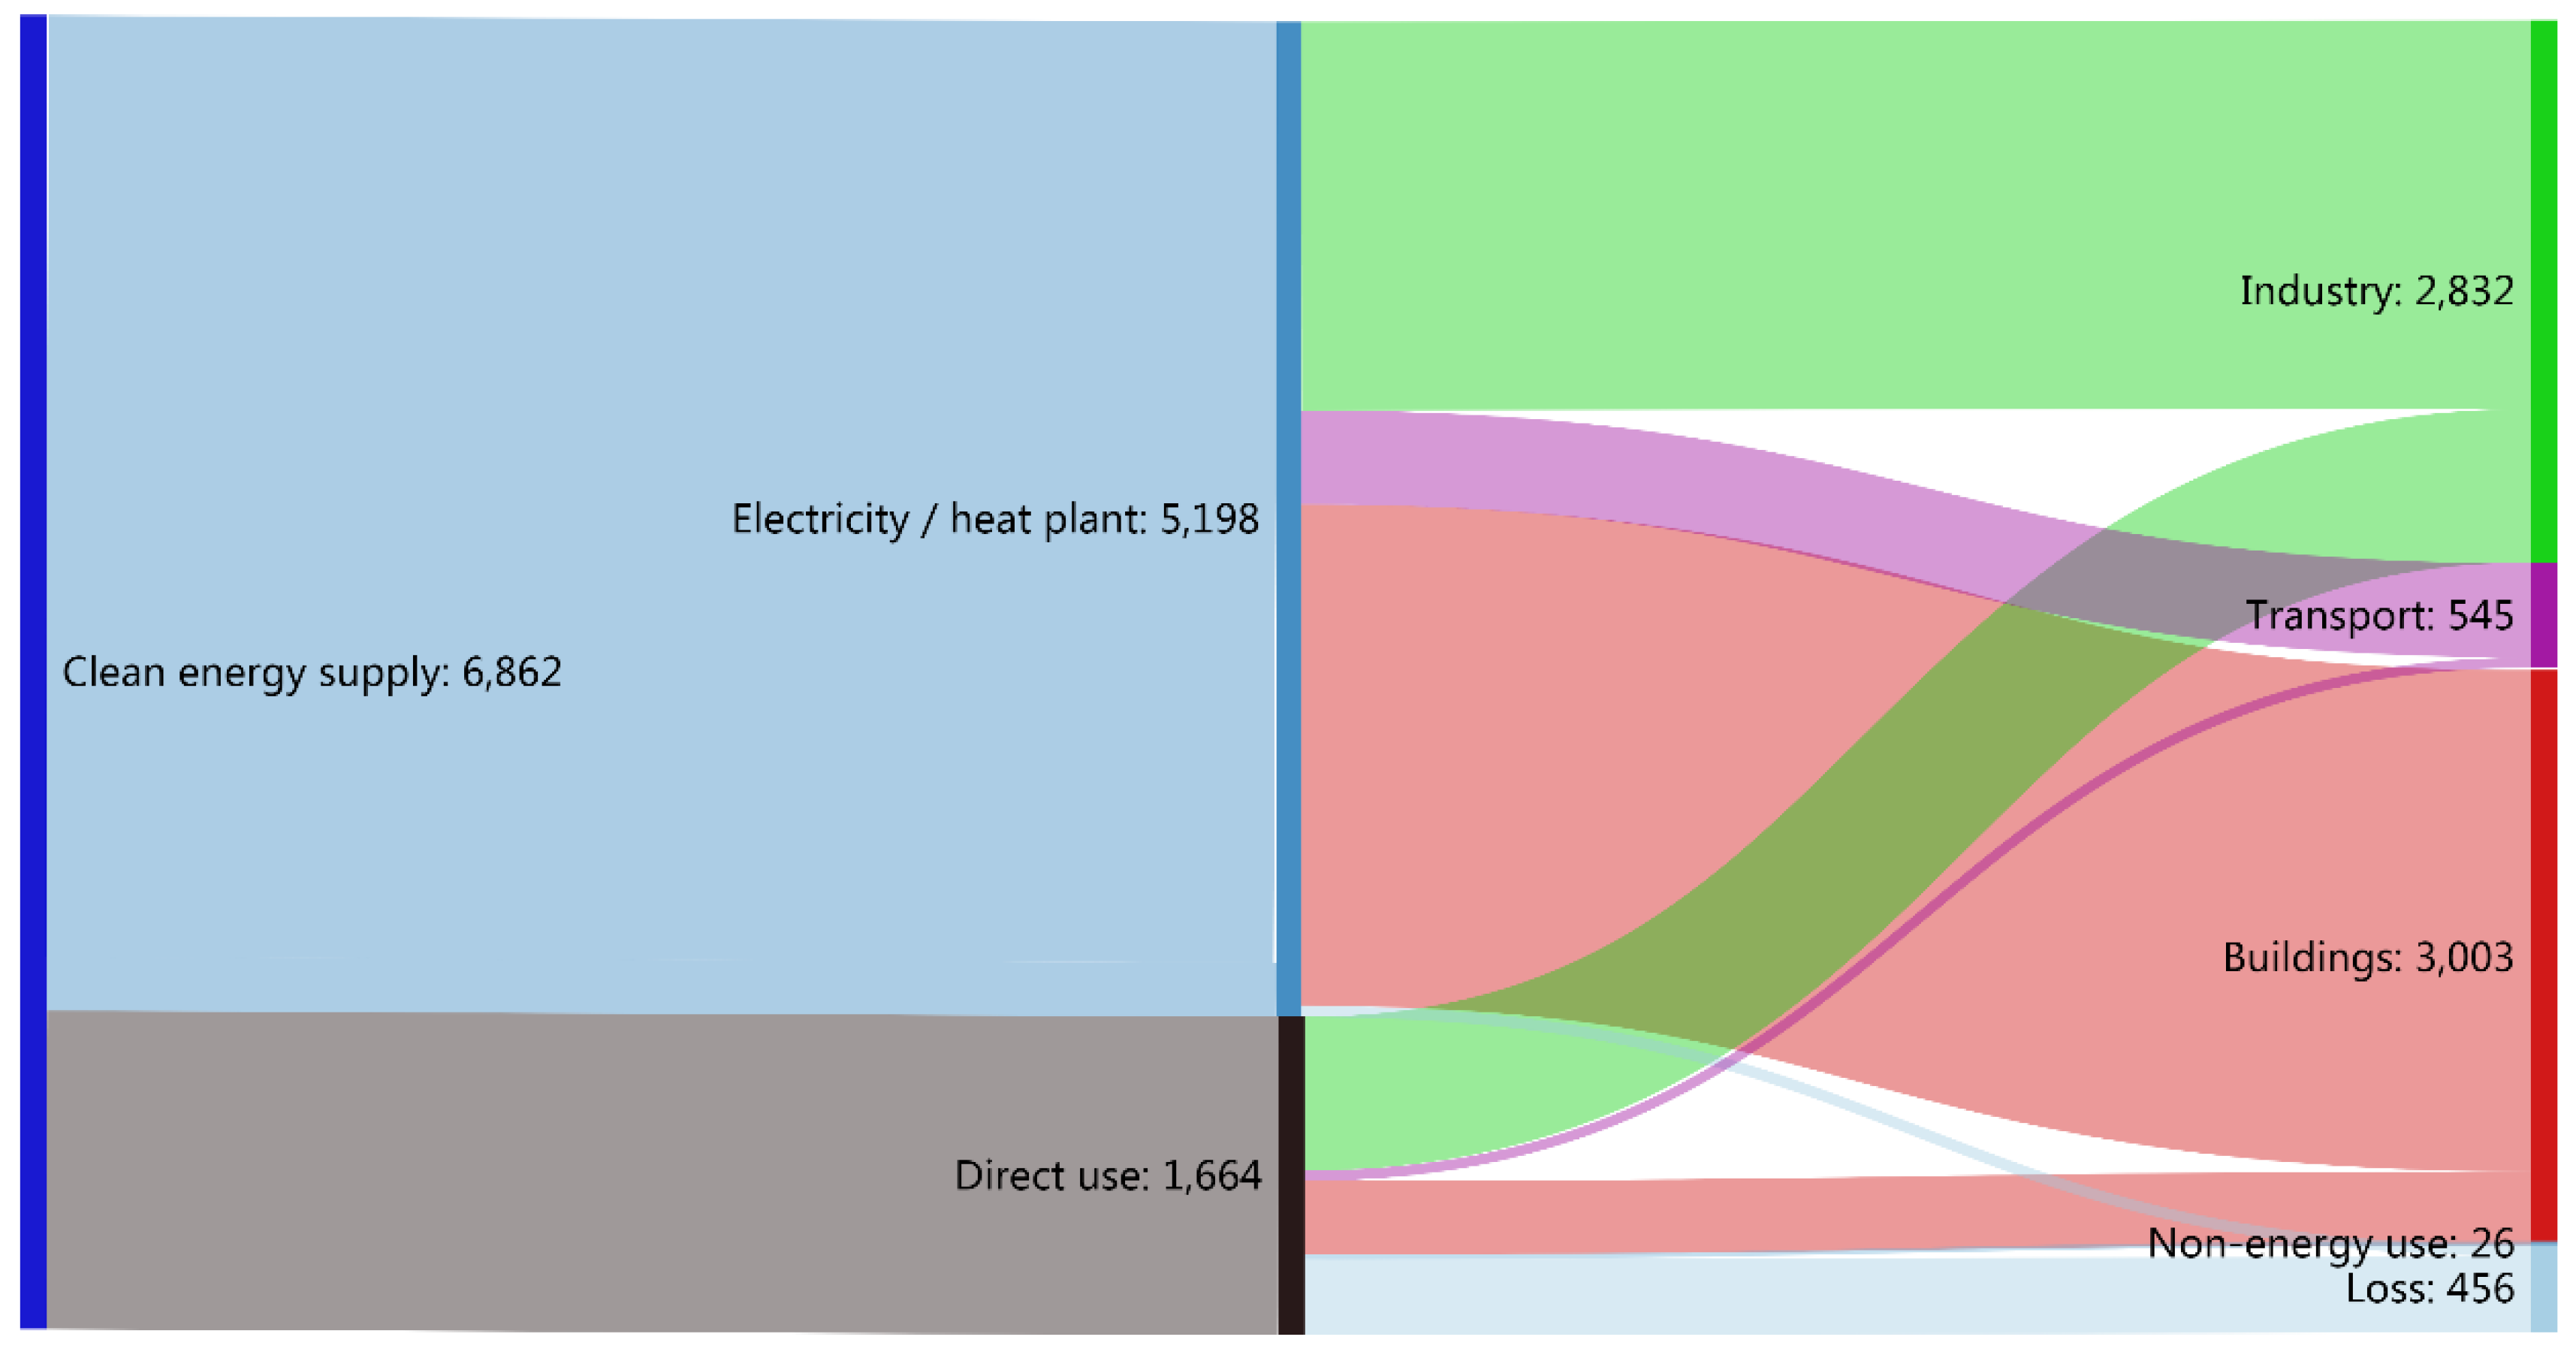
4.1. Mode 1: Clean Supply-Driven Mode

The clean supply-driven mode refers to the increasing proportion of clean energy power generation and promoting the direct use of clean energy in the industrial sector. The rich clean energy such as water, wind, solar, geothermal energy, etc., could be converted into clean power, which will be used in the industrial sector to realize the support of green power for industrial economic development. Meanwhile, the clean supply-driven mode promotes more modern bioenergy, solar, and hydrogen energy in the industry sector. By replacing fossil fuels with more clean energy to adjust the energy structure, industry sector emissions could be reduced.
Large-scale clean energy development, interconnection and utilization will contribute to the rapid decline of carbon intensity in the power sector, and the direct utilization of clean energy promotes the decline of carbon intensity in the end-use sector [40]. By 2050, clean energy utilization will triple to 6860 Mtoe, three quarters of which will be used for clean energy power generation in the energy supply. CO2 emissions from the power sector will decrease by more than 95% from 554 g CO2/kWh in 2015 to 25 g CO2/kWh in 2050. In terms of regional results, the PAO (Australia, Japan and New Zealand) is expected to have the lowest value of 1.3 g CO2/kWh owing to 93% clean energy share in power generation and 56% CCS share in fossil fuel power generation. The NAM (North America) is found to have the highest value of 72 g CO2/kWh, which is attributed to gas power plants in operation with low CCS share as 30%. Globally, the share of CO2 emissions from the power sector in all energy sectors will fall from 42% in 2015 to 20% by 2050. The direct utilization of clean energy such as solar energy and modern bio-energy can effectively reduce the carbon intensity of energy consumption in end-use sectors. By 2050, the carbon intensity of end-use energy consumption will decrease from 2.21 t CO2/toe in 2015 to 1.42 t CO2/toe, a drop of more than 35%. The clean energy consumption flow in 2050 is shown in Figure 12.
As the cost of clean energy power generation continues to fall, clean electricity will increase significantly, gradually forming a clean dominant power supply landscape. In 2016, clean energy power generation in the world accounted for 35%, with hydropower, wind power, PV, nuclear power, and other clean energy sources accounting for 17%, 4%, 1.3%, 10.5%, and 2.1%, respectively. In the 2 °C scenario, it is estimated that clean energy power generation will account for more than 80% by 2050, broken out as 32% for PV, 23% for wind power, 15% for hydropower, and 6% for nuclear power as indicated from MESSAGE model results.
Traditional biomass combustion will gradually be replaced by other forms of energy utilization due to its adverse effects on air quality and human health. Modern bioenergy would be widely used in industry, transport and building sectors. In 2050, 80% of bioenergy is expected to be used for industrial heating, while the rest will be used in the transport and building sectors for decentralized heating. The direct utilization of solar energy is to provide heating or heating collection for the end-use sectors, which is mainly applied to industrial low temperature heating and hot water and heating in the building sector. In the industrial sector, the utilization of solar energy is expected to be large-scale deployed. With the maturity of solar energy application technology, the cost of solar energy used in the industrial sector has decreased significantly. Solar water heaters, solar air heaters and solar collectors are widely used in low temperature heating and preheating in the industrial process. First, as a mature technology, the solar water heater will be popularized worldwide in the near future. Solar water heaters can increase the water temperature from 25 °C to 80 °C for boilers, thus saving a lot of fossil fuels. Second, solar air heaters provide air in the temperature of 50~80 °C for drying tea leaves or processing fruits, spices, cereals, mushroom, vegetables, seafood etc. Third, solar collector systems can provide steam at up to 300 °C to meet industrial heating needs. Applications include mercerizing, drying and finishing in textile industry; drying, dissolving, thickening, leaching and distillation in chemical industry; cooking, drying and canning in food industry, craft pulping, bleaching and drying in pulp and paper industry; drying and cleaning in leather industry.

4.2. Mode 2: Electricity Consumption-Driven Mode

The electrification in the industrial sector will be further improved, with the electrification rate reaching 48% by 2050. Global industrialization and urbanization further accelerate energy consumption of the industrial sector. The total consumption of fossil energy in the industrial sector will drop to 1120 Mtoe by 2050, down 34% from 2017. The decrease of fossil fuels consumption in the industrial sector is mainly attributed to electricity replacement as discussed in Section 4.3. Compared with 2017, the total electricity consumption in the industrial sector in 2050 will increase by about 1240 Mtoe, providing 90% of energy demand increase (Figure 13).
The industrial sector’s carbon dioxide emissions are concentrated in energy-intensive industries, in which electricity replacement has a great potential for mitigation. Traditional energy-intensive industries such as iron and steel, chemical and petrochemical, paper pulp and printing consume the largest amount of energy in the industrial sector, accounting for 69% of end-use energy consumption and 74% of total CO2 emissions in the industrial sector. Among them, the chemical and petrochemical industry, which mainly relies on oil and natural gas, accounts for 28%, the largest proportion of end-use energy consumption in the industrial sector. The iron and steel industry, which relies heavily on coal, takes the largest share of CO2 emissions in the industrial sector. At present, the global average electrification rate of traditional energy-intensive industries has much room for improvement. Electrification can significantly reduce the use of fossil fuels such as coal and oil.
Replacing coal fired boilers with electric boilers and replacing coal and oil heating furnaces with electric heating furnace could be the alternative of electricity replacement in traditional energy-intensive industries. In traditional energy-intensive industries, large amounts of coal is burned for heating in the process of cooking, smelting, drying, firing and annealing in the equipment including industrial boilers and kilns. For the iron and steel industry, in the process of steelmaking, the replacement of coal and coke by electricity can be realized by replacing the converter steelmaking with electric steelmaking, which can shorten the steel production process and save energy consumption required by iron smelting. For the non-ferrous metal industry, induction furnaces with high heating efficiency and accurate temperature control are mainly used to replace coke furnaces in the smelting process. For the paper pulp and printing industries, electric boilers and electromagnetic induction heating ovens are used to replace coal fired boilers and steam heating ovens in the pulping and drying of the papermaking process respectively, so as to replace coal, oil, and natural gas with electricity and to save energy.

4.3. Mode 3: Energy Efficiency-Driven Mode

Energy efficiency-driven mode refers to meeting energy demand with less energy consumption through the technical improvement of energy-using equipment in the end-use sectors, technological innovation of energy supply (power generation, oil and gas exploration and refining), and digital development of energy systems, thus reducing CO2 emissions in industry, transport, building, power generation, and other sectors.
In the industrial sector, in order to reduce energy consumption, it could be very helpful to optimize production processes in energy-intensive industries and to promote the application of digital and intelligent equipment. Three measurements could be taken in energy-intensive industries. First is to optimize the production process of energy-intensive industries such as iron and steel, non-ferrous metals and chemical industry, thus realizing continuous and efficient production process. Enhanced energy efficiency of the production process reduces energy consumption and emissions significantly, and process energy saving is gradually transforming to system energy savings. Second is to explore the characteristics of dynamic balance between supply and demand of energy flow in the production process, thus improving the intelligent level of energy control system. By carrying out fine management of the energy system on the basis of informatization and strengthening energy dynamic prediction and optimal scheduling, the level of energy utilization efficiency will be improved. The third is to promote the application of the recycling economy model, build an ecological chain of industries for product manufacturing, energy conversion, waste disposal and recycling, and promote energy conservation and efficiency in the industrial sector [41].

5. Conclusions

The trends and relationship between industrialization, industrial energy demand and carbon emission are studied in this paper to meet the temperature control goal of 2 °C of the Paris Agreement. The energy system is optimized using the IAM model of MESSAGE and the LMDI approach is adopted to track the historical drivers of emission and to investigate potential drivers of future emission with an expanded Kaya identity. Main conclusions are as follows.
Firstly, historical industrialization of 11 regions is analyzed and a regression method is used to predict the future industrialization for those regions. Sub-Saharan Africa (AFR), South Asia (SAS), and Other Pacific Asia (PAS) are still at the early stage of industrialization, and will keep increasing in terms of industrialization until 2050–2060. There are downward trends for the most developed regions and also the post-industrialization regions such as the North America (NAM), Western Europe (WEU), and Pacific OECD (PAO). With regard to the late stage of industrialization regions, such as East Europe (EEU) and Former Soviet Union (FSU), we find that there are downward trends for EEU and FSU. There is a re-industrialization then downward trend for the Latin American (LAC) region. With regard to Centrally planned Asia and China (CPA) and Middle East and North Africa (MEA), they have passed the peak and goes downward of industrialization.
Secondly, industry energy demand is projected using a hump-shaped function method with consideration of duration of industrialization and urbanization development and energy structure is optimized using MESSAGE model. Industrial energy demands in reference scenario and 2 °C scenario are compared in this paper. In the 2 °C scenario, fossil fuel consumption in the industrial sector fell to 1120 Mtoe in 2050, a decrease of 34% compared with that in 2017 which is mainly due to growing electricity consumption and the direct use of clean energy. When energy consumption for producing electricity, heat, and hydrogen are allocated to the consumer sector, energy consumption in the industrial sector increases from 4230 to 5270 Mtoe in 2050, and adjusted industry energy demand in 2 °C scenario is comparable with that in the reference scenario before 2050, while it is smaller than reference scenario after 2050 due to massive electricity utilization and cleaner energy based power generation in the 2 °C scenario.
Thirdly, an expanded Kaya identity is proposed to decompose carbon emission into six derivers as carbon intensity, energy structure, energy intensity, economic structure, GDP per capita, and population. As studied from the historical industrial carbon emission from 1995 to 2015, economic development is the biggest driving force for CO2 emission increase, followed by population. Industrial carbon intensity contributes positive CO2 emission, but its contribution decreases significantly due to much cleaner gas utilization in end-use sectors, and the use of increasing renewables power generation in the power and heat generation sector. In the 2 °C scenario, carbon intensity and industry energy intensity will contribute most of the decreasing emissions from 2015 to 2060. Contribution of population and economy development in driving emission increase declines due to population saturation. After 2060, it will become increasingly difficult to reduce emissions more, resulting in high marginal costs of emissions reductions, indicating government should seize the opportunity to control emissions in the industrial sector in earlier stages.
Finally, three modes for emission reduction are suggested in this study. Clean supply-driven mode could drive power sector’s emission share decreases from 42% in 2015 to 20% by 2050. Clean energy direct use could drive carbon intensity in end use sectors to decrease from 2.21 t CO2/toe in 2015 to 1.42 t CO2/toe, with a drop of more than 35%. Electricity consumption-driven mode could drive total consumption of fossil energy in the industrial sector drop to 1120 Mtoe by 2050, down 34% from 2017, and therefore reducing carbon emissions with a clean supply-driven mode will be extensively adopted in power sectors. Energy efficiency-driven mode could drive energy consumption reductions by optimizing production processes in energy-intensive industries, promoting the application of digital and intelligent equipment.
More studies are needed to explore the industry sector, such as to integrate the top-down method with a bottom-up method for the projection of future energy consumption and CO2 emissions, have a detailed study on the manufacturing industries such as the iron and steel, cement etc., and to investigate global and country-specific industrial emission pathways to meet the 2°C and 1.5 °C goals and their policy implications [42,43].

Author Contributions

C.L. and S.Z. conceived of and designed the proposed scheme. Conceptualization, C.L., S.Z., X.C., F.Y. conceived, designed and performed the experiments, X.T., F.G. and W.J. analyzed the data. F.Y. and Y.Z. supervised the whole project. C.L. and S.Z. wrote the manuscript. F.Y., X.T. and W.J. reviewed the manuscript. All authors have read and agreed to the published version of the manuscript.

Funding

This research was support by the China’s National Key Research and Development Project (2016YFA0602602), GEIGC Science and Technology Project (No. 52450018000Q).

Acknowledgments

The authors would like to thank IIASA for providing the scenario data.

Conflicts of Interest

The authors declare no conflict of interest.

References

  1. Fischedick, M.; Roy, J.; Acquaye, A.; Allwood, J.; Ceron, J.P.; Geng, Y.; Kheshgi, H.; Lanza, A.; Perczyk, D.; Price, L.; et al. Industry, in Climate Change 2014: Mitigation of Climate Change. Contribution of Working Group III to the Fifth Assessment Report of the Intergovernmental Panel on Climate Change; Edenhofer, O., Pichs-Madruga, R., Sokona, Y., Edenhofer, O., Pichs-Madruga, R., Sokona, Y., Eds.; Cambridge University Press: Cambridge, UK; New York, NY, USA, 2014. [Google Scholar]
  2. IEA. IEA Data and Statistics. 2017. Available online: http://data.iea.org (accessed on 1 December 2019).
  3. Chen, Z.; Liu, C.; Qu, S. China’s Industrialization and the Pathway of Industrial CO2 Emissions. Chin. J. Urban Environ. Stud. 2005, 3, 1550019. [Google Scholar] [CrossRef]
  4. Chenery, H.B. Patterns of Industrial Growth. Am. Econ. Rev. 1960, 4, 624–654. [Google Scholar]
  5. Chen, J.; Huang, Q.; Lv, T.; Li, X. The Report on Chinese Industrialization (1995–2010); Social Sciences Academic Press: Beijing, China, 2012. [Google Scholar]
  6. UNIDO. Industrial Development Report 2016. The Role of Technology and Innovation in Inclusive and Sustainable Industrial Development; United Nations Industrial Development Organization: Vienna, Austria, 2015. [Google Scholar]
  7. UNIDO. Industrial Development Report 2018. Demand for Manufacturing: Driving Inclusive and Sustainable Industrial Development; United Nations Industrial Development Organization: Vienna, Austria, 2017. [Google Scholar]
  8. Caraiani, C.A.; Lungu, C.I.; Dasc Lu, C. Energy consumption and GDP causality: A Three-Step Analysis for Emerging European Countries. Renew. Sustain. Energy Rev. 2015, 44, 198–210. [Google Scholar] [CrossRef]
  9. Ntanos, S.; Skordoulis, M.; Kyriakopoulos, G.; Arabatzis, G.; Chalikias, M.; Galatsidas, S.; Batzios, A.; Katsarou, A. Renewable Energy and Economic Growth: Evidence from European Countries. Sustainability 2018, 8, 2626. [Google Scholar] [CrossRef] [Green Version]
  10. Taeyoung, J.; Jinsoo, K. Coal Consumption and Economic Growth: Panel Cointegration and Causality Evidence from OECD and Non-OECD Countries. Sustainability 2018, 3, 660. [Google Scholar] [CrossRef] [Green Version]
  11. Wang, H.; Chen, W. Modelling Deep Decarbonization of Industrial Energy Consumption under 2-Degree Target: Comparing China, India and Western Europe. Appl. Energy 2019, 1563–1572. [Google Scholar] [CrossRef]
  12. Van Ruijven, B.J.; Van Vuuren, D.P.; Boskaljon, W.; Neelis, M.L.; Saygin, D.; Patel, M.K. Long-Term Model-Based Projections of Energy Use and CO2 Emissions from the Global Steel and Cement Industries. Resour. Conserv. Recycl. 2016, 112, 15–36. [Google Scholar] [CrossRef] [Green Version]
  13. IEA. Tracking Industrial Energy Efficiency and CO2 Emissions; International Energy Agency: Paris, France, 2007. [Google Scholar]
  14. Kaya, Y. Impact of Carbon Dioxide Emission Control on GNP Growth: Interpretation of Proposed Scenarios; Intergovernmental Panel on Climate Change (IPCC)/Response Strategies Working Group: Geneva, Switzerland, 1990. [Google Scholar]
  15. Gabriel Blanco, R.G.S.S. Drivers, Trends and Mitigation. In Climate Change 2014: Mitigation of Climate Change; Contribution of Working Group III to the Fifth Assessment Report of the Intergovernmental Panel on Climate Change; Cambridge University Press: Cambridge, UK; New York, NY, USA, 2014. [Google Scholar]
  16. IEA. CO2 Emissions from Fuel Combustion; International Energy Agency: Paris, France, 2018. [Google Scholar]
  17. Ang, B.W.; Liu, F.; Chew, E. Perfect Decomposition Techniques in Energy and Environmental Analysis. Energy Policy 2003, 31, 1561–1566. [Google Scholar] [CrossRef]
  18. Ang, B.W. The LMDI Approach to Decomposition Analysis: A Practical Guide. Energy Policy 2005, 7, 867–871. [Google Scholar] [CrossRef]
  19. Freitas, L.C.; Kaneko, S. Decomposition of CO2 Emissions Change from Energy Consumption in Brazil: Challenges and Policy Implications. Energy Policy 2011, 3, 1495–1504. [Google Scholar] [CrossRef]
  20. Fatima, T.; Xia, E.; Cao, Z.; Khan, D.; Fan, J. Decomposition Analysis of Energy-Related CO2 Emission in the Industrial Sector of China: Evidence from the LMDI Approach. Environ. Sci. Pollut. Res. 2019, 21, 21736–21749. [Google Scholar] [CrossRef]
  21. Khan, A.; Jamil, F.; Khan, N.H. Decomposition Analysis of Carbon Dioxide emissions in Pakistan. SN Appl. Sci. 2019, 1, 1012. [Google Scholar] [CrossRef] [Green Version]
  22. Ouyang, X.; Lin, B. An Analysis of the Driving Forces of Energy-Related Carbon Dioxide Emissions in China’s Industrial Sector. Renew. Sustain. Energy Rev. 2015, 45, 838–849. [Google Scholar] [CrossRef] [Green Version]
  23. Zhang, S.; Wang, J.; Zheng, W. Decomposition Analysis of Energy-Related CO2 Emissions and Decoupling Status in China’s Logistics Industry. Sustainability 2018, 5, 1340. [Google Scholar] [CrossRef] [Green Version]
  24. Mousavi, B.; Lopez, N.S.A.; Biona, J.B.M.; Chiu, A.S.; Blesl, M. Driving Forces of Iran’s CO2 Emissions from Energy Consumption: An LMDI Decomposition Approach. Appl. Energy 2017, 206, 804–814. [Google Scholar] [CrossRef]
  25. Sumabat, A.K.; Lopez, N.S.; Yu, K.D.; Hao, H.; Li, R.; Geng, Y.; Chiu, A.S. Decomposition Analysis of Philippine CO2 Emissions from Fuel Combustion and Electricity Generation. Appl. Energy 2016, 164, 795–804. [Google Scholar] [CrossRef]
  26. Cansino, J.M.; Sánchez-Braza, A.; Rodríguez-Arévalo, M.L. Driving Forces of Spain’s CO2 Emissions: A LMDI Decomposition Approach. Renew. Sustain. Energy Rev. 2015, 48, 749–759. [Google Scholar] [CrossRef]
  27. Alves, M.R.; Moutinho, V. Decomposition analysis for energy-related CO2 emissions intensity over 1996–2009 in Portuguese Industrial Sectors; CEF AGE-UE Working Paper; Center for Advanced Studies in Management and Economics: Evora, Portugal, 2013. [Google Scholar]
  28. Hosseini Nasab, E.; Aalami, R.; Foroughi Dahr, S.; Sadeghzadeh, M.A. An Analysis of Energy Consumption in Transportation and Industrial Sectors- a Multiplicative LMDI Approach with Application to Iran. Iran. Econ. Rev. 2012, 16, 1–17. [Google Scholar]
  29. Akbostancı, E.; Tunç, G.İ.; Türüt-Aşık, S. CO2 Emissions of Turkish Manufacturing Industry: A Decomposition Analysis. Appl. Energy 2011, 6, 2273–2278. [Google Scholar] [CrossRef]
  30. Hatzigeorgiou, E.; Polatidis, H.; Haralambopoulos, D. CO2 Emissions in Greece for 1990–2002: A Decomposition Analysis and Comparison of Results Using the Arithmetic Mean Divisia Index and Logarithmic Mean Divisia Index Techniques. Energy 2008, 3, 492–499. [Google Scholar] [CrossRef]
  31. Moutinho, V.; Moreira, A.C.; Silva, P.M. The Driving Forces of Change in Energy-Related CO2 Emissions in Eastern, Western, Northern and Southern Europe: The LMDI Approach to Decomposition Analysis. Renew. Sustain. Energy Rev. 2015, 1485–1499. [Google Scholar] [CrossRef]
  32. IIASA. MESSAGE Model Regions. 2013. Available online: http://www.iiasa.ac.at/web/home/research/researchPrograms/Energy/MESSAGE-model-regions.en.html (accessed on 22 July 2013).
  33. World Bank Database. Available online: https://databank.worldbank.org/databases (accessed on 20 December 2019).
  34. Fricko, O.; Havlik, P.; Rogelj, J.; Klimont, Z.; Gusti, M.; Johnson, N.; Kolp, P.; Strubegger, M.; Valin, H.; Amann, M.; et al. The Marker Quantification of the Shared Socioeconomic Pathway 2: A Middle-of-the-Road Scenario for the 21st Century. Glob. Environ. Chang. 2017, 42, 251–267. [Google Scholar] [CrossRef] [Green Version]
  35. Liu, G. Research on the Model and Application of Sector Final Energy Consumption: Based on the Industry and Transportation Sector; China University of Geosciences: Beijing, China, 2016; p. 133. [Google Scholar]
  36. Schrattenholzer, L. The Energy Supply Model MESSAGE; International Institute for Applied Systems Analysis: Laxenburg, Austria, 1981. [Google Scholar]
  37. Hou, F.; Zhang, S.; Zhao, Z.; Chen, X.; Tan, X.; Huang, H.; Yang, F.; Tan, F. Global Energy Interconnection Scenario Outlook and Analysis in the Context of Achieving the Paris Agreement Goals. J. Glob. Energy Interconnect. 2020, 3, 34–43. [Google Scholar]
  38. Zhou, Y.; Chen, X.; Tan, X.; Liu, C.; Zhang, S.; Yang, F.; Zhou, W.; Huang, H. Mechanism of CO2 Emission Reduction by Global Energy Interconnection. J. Glob. Energy Interconnect. 2018, 1, 409–419. [Google Scholar]
  39. IEA. Energy Efficiency Indicators Database; International Energy Agency: Paris, France, 2018. [Google Scholar]
  40. Tan, X.; Liu, C.; Chen, X.; Zhang, S.; Yang, F.; Wei, C. Carbon Flow and Mitigation Benefits Based on Grid Interconnection: A Case Study on Africa Energy Interconnection. J. Glob. Energy Interconnect. 2019, 3, 291–298. [Google Scholar]
  41. Zhang, Q.; Zhang, W.; Wang, Y.; Xu, J.; Cao, X. Potential of Energy Saving and Emission Reduction and Energy Efficiency Improvement of China’s Steel Industry. Iron Steel. 2019, 54, 7–14. [Google Scholar]
  42. Jiang, K.; He, C.; Xu, X.; Jiang, W.; Xiang, P.; Li, H.; Liu, J. Transition Scenarios of Power Generation in China under Global 2 °C and 1.5 °C Targets. J. Glob. Energy Interconnect. 2018, 4, 79–88. [Google Scholar]
  43. Wang, M.; Kang, W.; Chen, Z.; Zhang, Y.; Liu, C.; Yang, F. Global Energy Interconnection: An Innovative Solution for Implementing the Paris Agreement—The Significance and Pathway of Integrating GEI into Global Climate Governance. J. Glob. Energy Interconnect. 2018, 4, 69–78. [Google Scholar]
Figure 1. The status of industrialization globally and across 11 regions in 2015. Note: (1) 11 regions are defined by International Institute for Applied Systems Analysis (IIASA) [32]. (2) Data of GDP per capita and industrial output percent are retrieved from the World Bank Database [33]. (3) Dashed line is the world average; dotted line is the regression line from the 11 regions GDP per capita and industrialization data.
Energies 13 00825 g001
Figure 2. The framework of present and projection analysis on industrial emission reduction based on MESSAGE optimization and expanded Kaya equation with LMDI decomposition.
Energies 13 00825 g002
Figure 3. The predicted industrialization results for 11 regions. Note: (a) Developed regions; (b) Developing regions.
Energies 13 00825 g003
Figure 4. The evaluated regional and global industrial energy consumption per capita estimation from S-curve model.
Energies 13 00825 g004
Figure 5. Industry energy demand and energy structure in 2050 and 2100 from 2 degree and reference scenarios.
Energies 13 00825 g005
Figure 6. Adjusted industry energy demand with energy consumption in electricity, heat and hydrogen are allocated to consuming sectors in 2 degree and reference scenarios.
Energies 13 00825 g006
Figure 7. Projected industrial carbon emissions in 2-degree and reference scenarios.
Energies 13 00825 g007
Figure 8. Decomposition of industrial carbon emission from 1995 to 2015.
Energies 13 00825 g008
Figure 9. Annual emission reductions in industry sector from 2030 to 2100.
Energies 13 00825 g009
Figure 10. Decomposition of industrial carbon emission from 2015 to 2060.
Energies 13 00825 g010
Figure 11. Decomposition of industrial CO2 emission from 2060 to 2100.
Energies 13 00825 g011
Figure 12. Clean Energy Consumption Flow in 2050 (Unit: 100 Mtoe).
Energies 13 00825 g012
Figure 13. Energy Consumption and Structure in Industry Sector Based on MESSAGE Optimization Analysis.
Energies 13 00825 g013
Table 1. Different industrialization stages and criterions.
CriterionsPre-Industrialization (I)Industrialization StagesPost-Industrialization Stage (V)
Early Stage of Industrialization (II)Intermediate Stage of Industrialization (III)Late Stage of Industrialization (IV)
(1) GDP per capita (2015 USD, in PPP)<10001000~50005000~18,00018,000~30,000>30,000
(2) Economic structureA > IA > 20% and A > IA < 20% and A > SA < 10% and I > SA < 10% and I < S
(3) Urbanization rate by populationBelow 30%30~50%50~60%60~75%Above 75%
Note: (1) criterions refers to Chen et al. [5], the standard of per capita GDP levels be updated by the authors; (2) A denotes agriculture, I denotes second industry, S denotes the services sector.
Table 2. Threshold GDP per capita levels for different S-curve.
TypeTake-Off PointGi and Ei at Turning PointGi and Ei at Zero Growth PointRepresentative Countries
High “S” type2500~300010,000~12,00015,000~17,000U.S., Canada
1.6~1.82~2.5
Mid “S” type10,000~12,00015,000~17,000Sweden, Belgium
1.4~1.51.7~1.8
Low “S” type7000~900010,000~12,000England, France, Germany, Japan, Italy, etc.
0.6~0.80.7~1.2
Table 3. Major boundary conditions and assumptions.
Items Description
Model relatedSocio-economicSSP2
Industry energy demandS-Curve
Resource potentialResource curves for each region
SolveGlobal optimization
Scenario related2 °C targetCarbon budget for 2018–2100: 1280 Gt CO2 [1]
Reference scenarioNo carbon limit, NPi_v4 from IIASA
TechnologyExogenous technological progress
Table 4. The regression results for the 11 regions.
RegionsConstantabcAdj-R2F-statp-Value for F
CPA38 ***2.22 × 10⁻³ ***−1.63 × 10⁻⁷ ***/0.7848.22.64 × 10−9
EEU98.04 ***−1.46 × 10⁻² **1.02 × 10⁻⁶ **−2.34 × 10⁻¹¹ **0.395.070.012
FSU119 ***−1.42 × 10⁻² **7.53 × 10⁻⁷ **−1.32 × 10⁻¹¹ **0.589.577.4 × 10−4
LAC847.4 ***−0.2 ***1.615 × 10⁻⁵ ***−4.34 × 10⁻¹⁰ ***0.526119.74 × 10−5
MEA368.2 *−0.12 *1.42 × 10−5 **−5.34 × 10⁻¹⁰ **0.69216.78 × 10−7
NAM31.2 ***−2.12 × 10⁻⁴ ***//0.75821.54 × 10−9
PAS66.3 ***−9.05 × 10⁻³ **8.08 × 10⁻⁷ **−2.33 × 10⁻¹¹ **0.5512.24.84 × 10−5
PAO66.4 ***1.02 × 10⁻³ ***//0.6857.43.83 × 10−8
SAS16.4 ***6.24 × 10⁻³ ***−8 × 10⁻⁷ ***/0.6223.21.99 × 10−6
AFR4.472.48 × 10−2 **−4.61 × 10⁻⁶ **/0.45122.22 × 10−4
WEU39.8 ***−4.93 × 10⁻⁴ ***//0.912821.78 × 10−15
Note: (1) Significance levels: * denotes p < 0.1; ** denotes p < 0.05; *** denotes p < 0.01. Use R software for regression. (2) The EEU and FSU regions went through economic recessions in 1990s thus authors use historical data during period 1998–2017 for regressions.
Table 5. Major boundary conditions and assumptions.
Regions“S” TypeEiAα1α2α3Gi
(toe/p)($/capita)(1/$)(1/$)(1/$)($/capita)
CPALow0.750.70.000020.000250.000099000
EEUMid0.5510.0000150.000250.000097000
FSUMid0.751.20.0000150.000250.000096000
LACMid0.610.0000150.000250.0000910,000
MEAHigh0.5510.000010.000350.00017000
NAMHigh0.7510.0000150.000250.0000915,000
PASLow0.5510.0000150.000250.0000910,000
PAOLow0.710.0000150.000250.000099000
SASLow0.4510.000020.000190.0001110,000
AFRLow0.3910.000020.000190.000117300
WEUMid0.710.0000150.000250.0000910,000

