Article

Experiments and Modeling for Flexible Biogas Production by Co-Digestion of Food Waste and Sewage Sludge

1
Faculty of Geosciences and Environmental Engineering, Southwest Jiaotong University, Chengdu 611756, Sichuan, China
2
Institute for Sanitary Engineering, Water Quality and Solid Waste Management, University of Stuttgart, Bandtäle 2, 70569 Stuttgart, Germany
*
Authors to whom correspondence should be addressed.
Energies 2020, 13(4), 818; https://doi.org/10.3390/en13040818
Submission received: 13 January 2020 / Revised: 8 February 2020 / Accepted: 11 February 2020 / Published: 13 February 2020
(This article belongs to the Special Issue Bioenergy from Organic Waste)

Abstract

:
This paper explores the feasibility of flexible biogas production by co-digestion of food waste and sewage sludge based on experiments and mathematical modeling. First, laboratory-scale experiments were carried out in variable operating conditions in terms of organic loading rate and feeding frequency to the digester. It is demonstrated that biogas production can achieve rapid responses to arbitrary feedings through co-digestion, and the stability of the anaerobic digestion process is not affected by the overloading of substrates. Compared with the conventional continuous mode, the required biogas storage capacity in flexible feeding mode can be significantly reduced. The optimum employed feeding organic loading rate (OLR) is identified, and how to adjust the feeding scheme for flexible biogas production is also discussed. Finally, a simplified prediction model for flexible biogas production is proposed and verified by experimental data, which could be conveniently used for demand-oriented control. It is expected that this research could give some theoretical basis for the enhancement of biogas utilization efficiency, thus expanding the applications of bio-energy.

1. Introduction

Bio-energy has the unique advantage that it can be stored and controlled according to a targeted schedule; thus, it is applicable for compensating the differences between power demand and supply that arise at peak times or when production bottlenecks occur [1,2,3]. In this context, demand-oriented power supply through utilization of biogas from the anaerobic digestion process could be regarded as an important mean to implement the “Complementary renewable energy supply” system for improved stabilization and comparative advantages of renewable energies [4].
Flexible biogas production was proposed as an important pathway for realizing demand-oriented biogas supply, which is operated by controlling the anaerobic digestion (AD) process in order for just-in-time biogas production when power is needed [5,6,7]. Compared with the traditional demand-oriented pathway by extension of biogas storage capacity, the additional investments, operational costs and the risk caused by higher biogas storage capacity could be significantly reduced via flexible biogas production [8,9].
Some specific technologies of flexible biogas production have already been researched; for instance, Linke et al. [10] and Lemmer et al. [6] focused their attention on the adaption of a two-stage systembiogas plant configuration that generates liquid substrates with a high content of easily degradable organic matter. This can be fed in variable amounts into fixed-bed digesters to increase the biogas production instantly. However, adaption of configurations is expensive and difficult to implement, especially for already-built biogas plants [11]. Another method for achieving flexible biogas production is targeted variation of the feeding scheme, which can be manipulated by varying the substrate addition time and intervals, in order to coordinate the actual variations of biogas production with the electricity demand trend; related researches can be found in Mulat et al. [12] and Zealand et al. [13]. The most commonly used flexible method is addition of easily degradable substrates for just-in-time biogas production. In this field, Ahmed et al. [14] adopted sugar beet silage; Barchmann et al. [15] studied co-digested cattle manure and corn silage; Laperrière et al. [16] used carrot, maize silage and glycerol; Nghiem et al. [17] employed sewage sludge and crude glycerol;and Feng et al. [18] used the maize silage and briquetted meadow grass as the targeted feeding substrates. These substrates’ fast biodegradability and effectiveness for flexible biogas production demonstrate the technical feasibility for demand-oriented biogas supply.
Current literatures have only taken a few agricultural by-products (mainlyconsistingof energy crops and livestock manure) as the feeding substrates for flexible biogas production [19]. Some other municipal bio-waste produced in large quantities, such as food waste, has potential for use as feeding substrates since they arerich in easily degradable organic matter. However, they have been scarcely discussed [20]. Compared with agricultural by-products, food waste is widely available in large quantities, and holds promise for great environmental and social benefits if the embodied bio-energy can be recovered [21,22]. Mono-digestion of food waste often leads to digester instability and even failure at higher organic loading rates (OLR above 2.5 g volatile solid (VS) L−1 day−1) due to the accumulation of volatile fatty acid (VFA) and insufficient buffering capability [23,24,25]. Co-digestion with sewage sludge is an optimal choice for AD of food waste compared with other potential substrates since sewage sludge can provide the alkalinity and micronutrients required for the AD process, thus increasing the buffering ability against acidification of the AD system when the flexible biogas production is implemented [26,27]. Co-digestion of food waste and sewage sludge is already a consolidate technology, also in pilot and full-scale plants in some European countries, but only a few plants have implemented the demand-oriented biogas supply mechanism; some already operating demand-oriented plants only take the practice of adding gas storage and adding the extra digesters, which can be switched on and off in order to balance the intermittent power production, while no plant tries the practice of changing the feeding regimes for just-in-time flexible biogas production [28]. In this context, this research analyzed the feasibility of changing the feeding regime for realizing the flexible biogas production by co-digestion of food waste and sewage sludge. Laboratory experiments were conducted by feeding the excess sludge and food waste in variable operating conditions in terms of organic loading rate (OLR), feeding frequency and interval to the digester. Whether the alteration of feeding regimes could significantly benefit the flexibilization was further evaluated based on the experimental results.
Variable feeding of flexible biogas production additionally raises the complexity of the reactor’s response [29].A critical step for practical flexible operations will be attaining an effective method for predicting the biogas production [30]. The effects of the feeding amounts of substrates on the biogas production process can be simulated by the Anaerobic Digestion Model (ADM) No. 1; related researches can be found in Löffler [31], Mendes et al. [32] and Nordlander et al. [33]. However, ADM1 needs a variety of equations to describe the AD process and faces challenges when lacking more complex data, like change of feedstock characteristic, shift of microbial populations and many more [34,35]. Some other possible prediction models have also been studied, for example Ahmed et al. [14] used the Gaussian equation; Rieke et al. [35] employed the transfer function in Laplace domain; and Hien et al. [36] designed the Biotool based on R software. But these models are inconvenient to simulate the biogas production responseto targeted variation of feedings. Therefore, this research aims to establish a simpler, accurate model that can be used to predict biogas production in flexible operating conditions.
It is expected that this research can give some theoretical basis for biogas engineers to improve their organic waste valorization for energy recovery, thus promoting the diffusion of bioenergies and helping to realize a more efficient sustainable energy utilization.

2. Experiment Description and Modeling Method

2.1. Experiment Overview and Substrates Characterization

The experiment was carried out at the Institute for Sanitary Engineering, Water Quality and Solid Waste Management (ISWA), University of Stuttgart. A laboratory-scale 250 L continuous stirred tank reactor (CSTR) with approximately 210 L liquid volume was used as the digester. During the experiment, the digester was operated at the mesophilic condition of 35 °C, slightly pressurized with the pressure of about 0.01 bar, with the hydraulic retention time fixed in 21 days. The produced biogas was collected at the top of the reactor and guided into the CH4 sensor (Blue Sens gas sensor GmbH, Herten, Germany) to measure the methane concentrations. Afterwards, the gas flow volume was measured by a gas-flow meter (Ritter Apparatebau GmbH, Bochum, Germany). These data can be recorded in the system’s data logger (Endress Hauser company with the type RSG10, Reinach, Switzerland), which stores information about the amount and composition of biogas every 10 min.
Three groups of experiments were operated at organic loading rates (OLRs) of 600 g chemical oxygen demand (COD) per day (2.86 g COD L−1 digester day−1), 400 g COD per day (1.90 g COD L−1 digester day−1) and 200 g COD per day (0.95 g COD L−1 digester day−1), respectively; the three weeks’ stabilization period were experienced prior to each group of experiment. The maximal OLR is set according to the research of Yang et al. [35], who found that an OLR higher than 3 g COD L−1 digester day−1 will acidify the process and cause instability. The feedings in each group were further split into different feeding regimes, i.e., feeding a given daily load in one portion or separating the same amount into equal portions, which operated with feeding twice per day with 9 h, 7 h and 5 h intervals, in order to simulate the need to cover high electricity demand peaks during a typical day. Each round of experimentation lasted one week, with feeding for five workdays, which resembles the biogas utilization period, while a feeding break during weekends for simulating a low demand at the weekend or high electricity production by, e.g., wind or solar power. In order to ensure the consistency of the feeding property during the whole experiments, and thus to facilitate the analysis of the results, the feeding food wastewas prepared with noodle, soybean, edible oils and edible salt, and their composition ratio was decided according to the typical characteristics of Chinese food waste with 48% carbohydrate, 35% protein, 17% fat, and 11 g L−1 salt [37]. Food waste was then diluted with sewage sludge obtained from the returned sludge tank in the sewage plant to 10 L for feeding. The properties of the noodles, soy flour, oil and excess sludgeare shown in Table 1, and the addition amounts were calculated based on Equation (1). Results are shown in the Appendix A.
O L R i C O D =   C O D j × M j ρ j V
where CODj represents the chemical oxygen demand in g L−1 of the fresh material j, values are shown in Table 1; Mj the mass in g of the feeding material j; ρ j the density of the fresh material j with unit g L−1 fresh material; and V the volume of reactor, which is assigned for 210 L in this case.

2.2. Analytical Methods

To assess the stability of the anaerobic digestion system, process parameters like the pH of the feeding substrates and effluent, the ammonia nitrogen content in the digester, the conductivity of the salt concentration, the total solids (TS), the volatile solids (VS) of the effluent, and the ratio of volatile organic acids to total inorganic carbon (expressed as FOS/TAC) were measured. During which the pH, TS and VS were measured every day during the feeding period, while others were measured twice a week. In the testing process, we collected three parallel samples from the digestate, and calculated the average value of the tested parameters for three parallel samples as the final result in order to reduce the measurement errors.
SCHOTT GERATE’s CG819 series pH meter was used for pH measurement. The determination of TS and VS was determined according to the standards of DIN EN 15934 and DIN 15935. Ammonia nitrogen was measured by an ammonia nitrogen analyzer (Merck KGaA, Darmstadt, Germany). According to Hach Company© (2015), the FOS/TAC ratio was determined according to the Nordmann criteria.

2.3. Prediction Model for Flexible Biogas Production

A novelty prediction model for biogas production in flexible operating conditions was developed based on the first-order kinetics model, which was based on the microbial growth with a growth-limiting substrate concentration [38,39]. Related parameter notations and basic hypotheses are made as follows:
Given the first feeding time t 0 during a specific feeding period, and it is assumed that the ith feeding will be arranged at time t i based on feeding schedule, when n times feedings have already been passed. The accumulative biogas production after the ith feeding can be simulated by Equations (2) and (3):
V ( t ) = V 0 ( t i ) + V t i
V t i = v m a x i × ( 1 e x p ( k i × ( t t i ) ) )
where in Equation (2) V ( t ) represents the accumulated biogas production (mL biogas/L digester) in feeding time t (min) from the arbitrary ith to (i + 1)th feeding during the biogas utilization period; V 0 ( t i ) represents the accumulated biogas production volume from the first feeding to ith feeding, which belongs to a measured parameter; and V t i is the biogas production generated specifically from the ith feeding, and the value is calculated from the first-order kinetic model, expressed in Equation (3). Parameter v m a x i is the final specific methane produced (mL Biogas L−1 digester) at the end of the assay, and k i is the first order decay constant (1 day−1).
v m a x i = f ( n = 1 i 1 X n + O L R i )
k i = g ( n = 1 i 1 X n + O L R i )
The parameters v m a x i and k i are mainly determined by the organic matter in the digester, while this amount consists of two parts: the undegraded organic matters left from previous feedings, as well as the organic matters from the ith feeding. Thus, they can be expressed as the function of organic matters in digesters, as show in the Equations (4) and (5), and the specific function formations can be found by regression analysis seen in Section 5. The undegraded organic matters existed in digester X t i left from ith feeding can be further calculated by Equation (6), which hypnoses the degradation of organic subjects to the first-order kinetics. The OLR0 represents the feeding OLR at the initial time, and the parameter m denotes the organic degradation rate, which can be obtained by the linearization transformation given by Equation (7) using the reaction data.
X t i = O L R 0 × e m t
ln X t i O L R 0 = m t

3. Experimental Results and Discussion

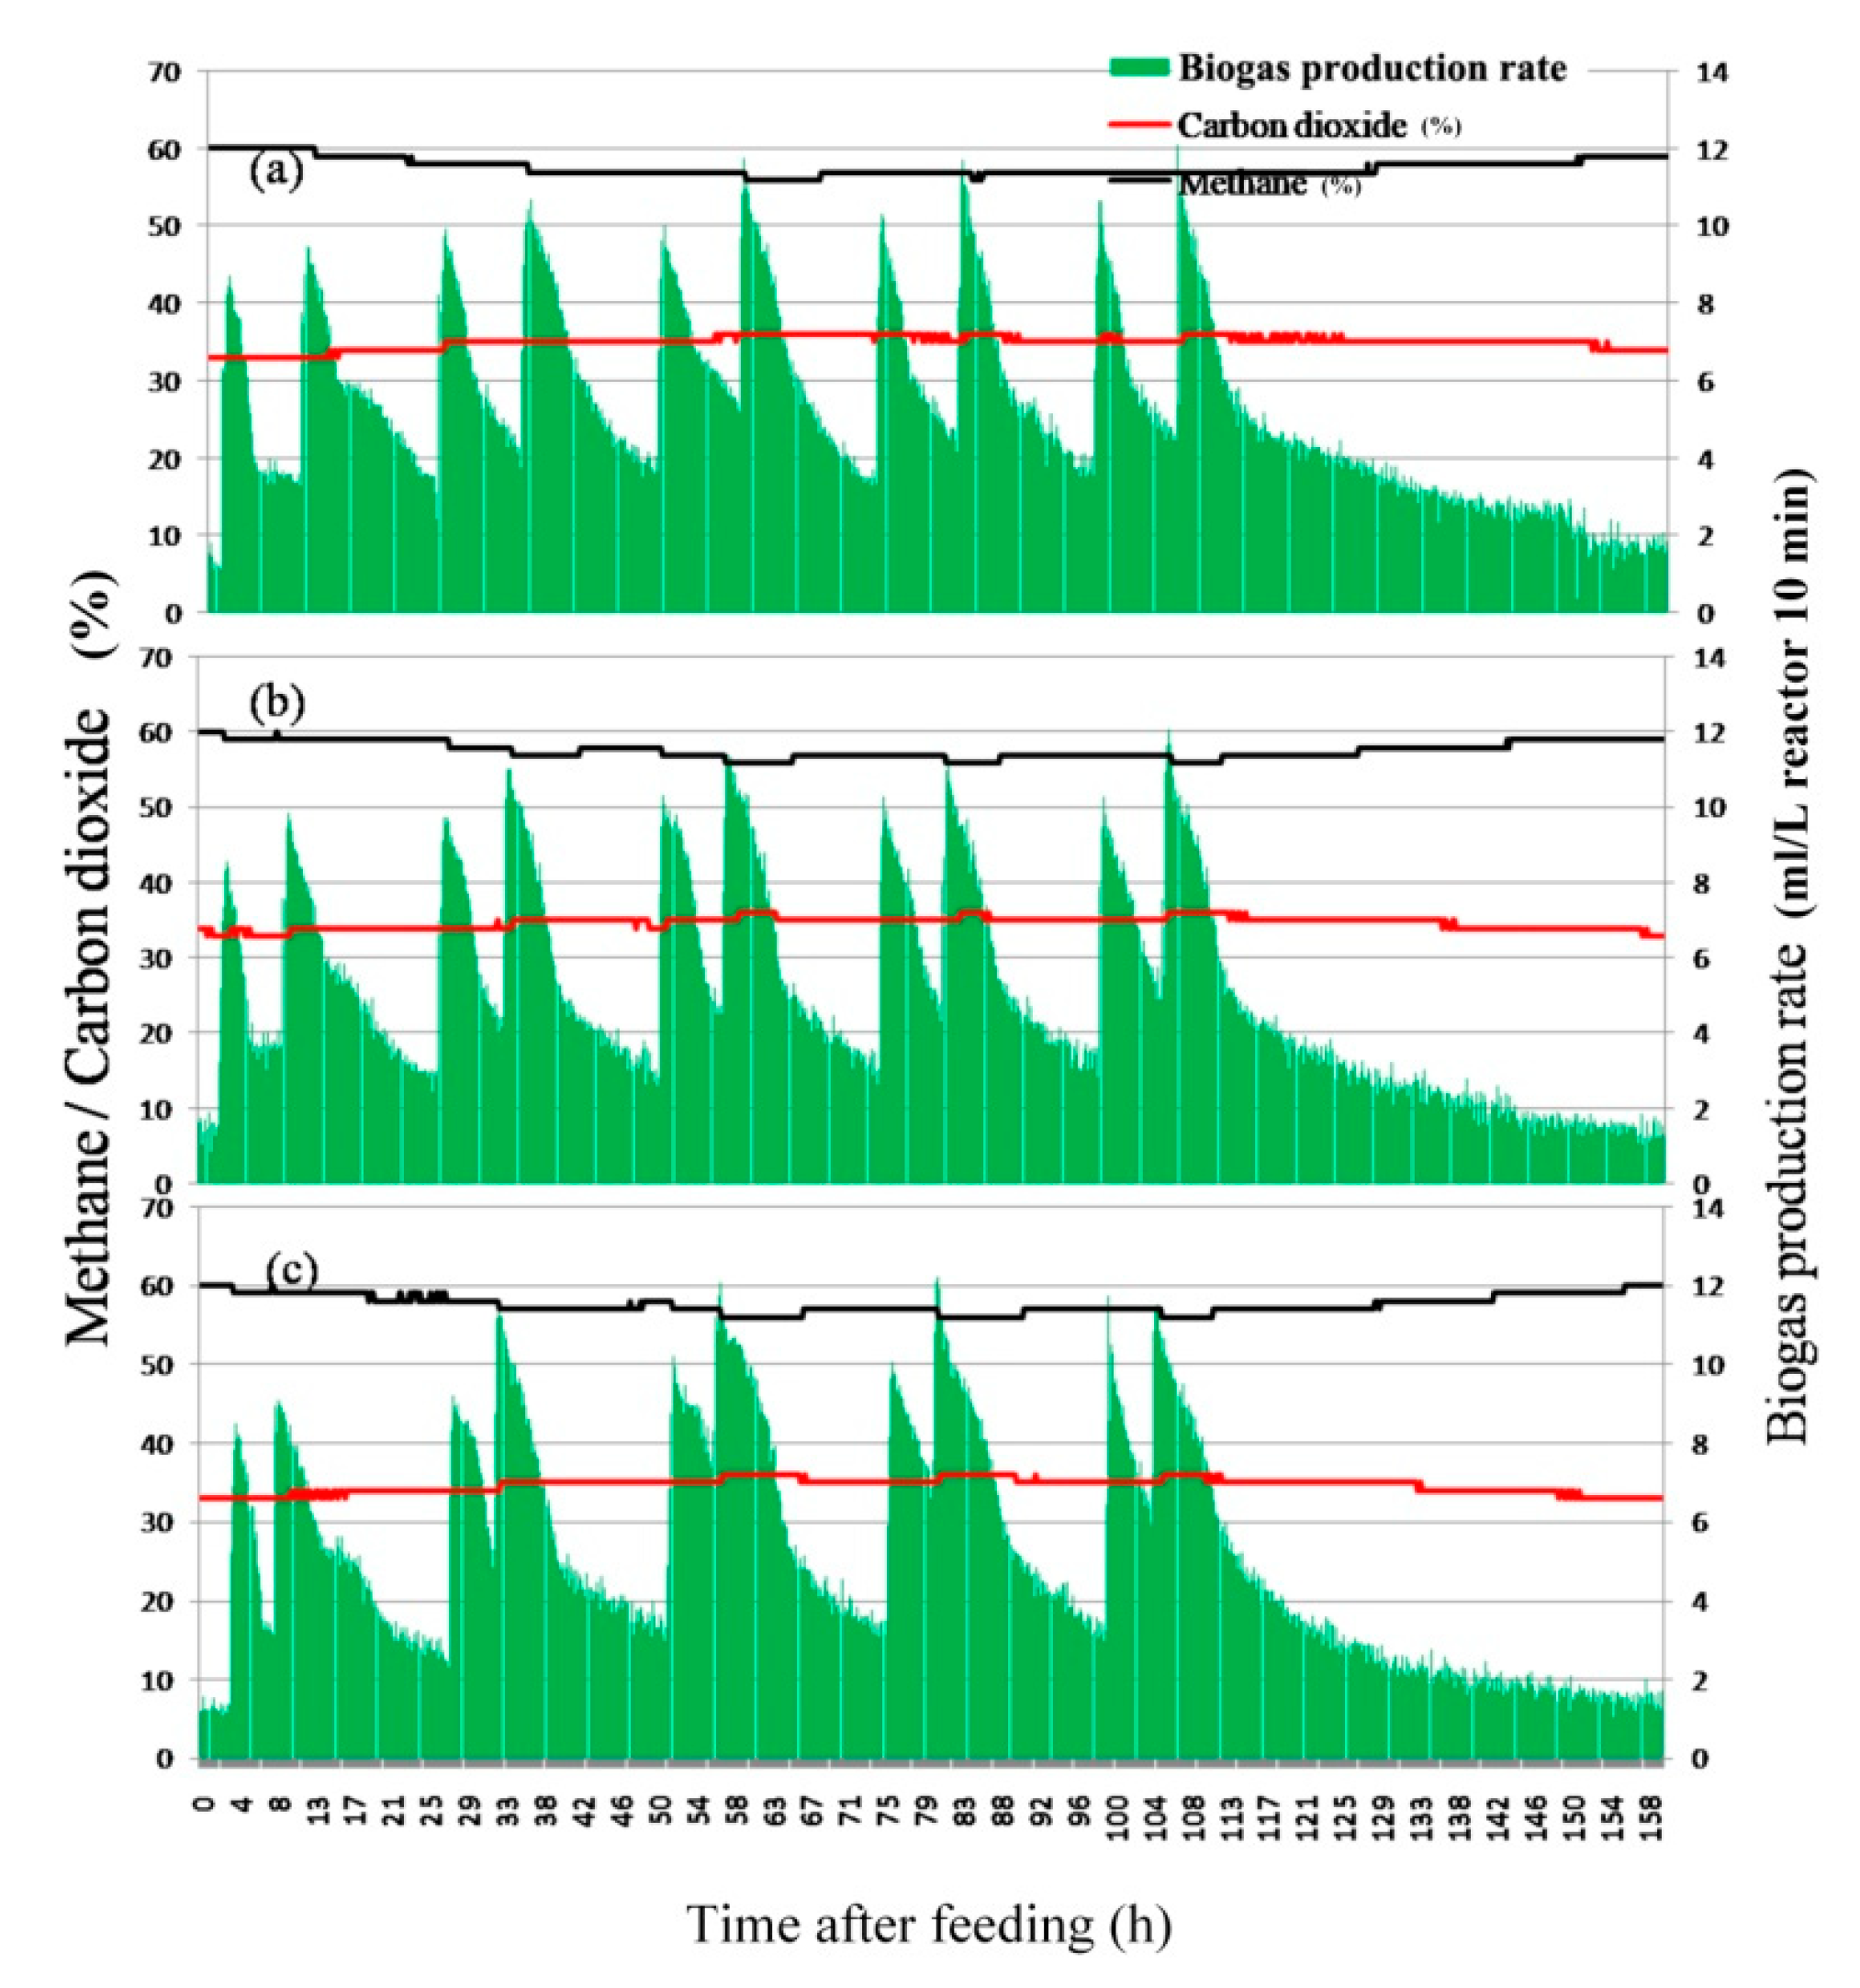
3.1. Effects of Targeted Variation of Feeding Scheme on Biogas and Methane Production

Results of biogas production with feeding once per day are shown in Figure 1. The daily methane production volume of each OLR group after transforming them into VS loading rate is 367 mL CH4 g−1 VS added 1 in OLR 2.86 g COD L−1 digester day−1, 285 mL CH4 g–1 VS added 1 for 1.90 g COD L−1 digester day−1 and 277 mL CH4 g–1 VS added 1 for 0.95 g COD L−1 digester day−1, respectively. According to the data summarized by Mehariya et al. [27], the VS loading rate obtained in existing researches of co-digestion of food waste and sewage sludge ranged from 157 to 439 mL CH4 g–1 VS added 1 under normal conditions; thus, the methane production obtained in our research can be regarded within the normal ranges. It can also be found that the maximal biogas production rates in different OLRs appears within 2 h, which indicates biogas production can respond quickly with variable time feedings by co-digestion of food waste and sludge.
Biogas production rates responded to feedings in different OLR groups, showing a similar variation trend that increase first and then decrease. The daily accumulative biogas production during the five feeding days increased initially, but then decreased in the latter part of the feeding days; the increment of biogas in the initial phase was caused by the accumulation of un-decomposed substrates left by prior feeding substrates with daily feedings. As the daily feedings continues, the digestive bacteria multiplied rapidly with the sufficient nutrient substance, thus the methane content began to rebound. However, the feeding substrates were soon unable to meet the demand for bacterial growth, the reactivity of bacteria then declined, which further led to decreasing biogas production. The variation trend of CO2 content was roughly in the opposite trend with CH4 during the whole process.
The average daily biogas volume at 2.86 g COD L−1 digester day−1 was 1.357 L L−1 digester day−1, which was 1.565 times that of the scenario of 1.9 g COD L−1 digester day−1 and 3.38 times the 0.95 g COD L−1 digester day−1. However, the CH4 content fell below 55% at 2.86 g COD L−1 digester day−1 due to the acidification caused by the high feeding OLR [40]. Therefore, this scenario is not recommended in operation because the low methane content will bring significant costs for methane extracting and utilization [41]. The content of CH4 in feeding OLR 1.90 g COD L−1 digester day−1 was kept above 55% during the entire feeding period, which states no significant inhibitions occur on anaerobic digestion reaction. In the scenario of feeding 0.95 g COD L−1 digester day−1, the methane content was maintained around 60%, which manifests a high methanation efficiency in low feeding OLR; however, the corresponding accumulative biogas production volume is critically low.
The results of feeding twice per day with feeding OLR 1.90 g COD L−1 digester day−1 and 0.95 g COD L−1 digester day−1 are shown in Figure 2 and Figure 3. It is obvious that two peaks have appeared corresponding to the daily two feedings in both scenario. The daily accumulative biogas production volumes were roughly the same with the scenario of feeding once per day, which indicates that the accumulative biogas production volume will not appreciably be affected by arbitrary feeding behavior. In the scenario of feeding OLR 1.90 g COD L−1 digester day−1 seen in Figure 3, with the shortening of feeding intervals, the majority of biogas production was slightly shifted to the second half of the day due to the increment of undecomposed substrates left by previous feedings. It could offer some basis for designing the specific feeding scheme in real application, for instance the scenario with shorter intervals can be used for the peak electricity demand that appears in the second half of the day. The variation trends in feeding 0.95 g COD L−1 digester day−1 were similar to the former scenarios, the only difference was that the biogas production volume of the first and second parts during one day were approximately the same in the 9 h interval (seen in Figure 3a), which indicates that the first feeding substrates with 0.1 kg COD can almost be decomposed completely within 9 h after feeding in this scenario.

3.2. Process Stability

The main digestive process parameters, pH and VS/TS of the effluent, are shown in Figure 4. The pH fluctuated within 7.04 and 7.47, which shows an initial accumulation of VFA after feeding, but the pH of the digestate was maintained within acceptable limits of 6.5 to 7.5 [42]. Other parameters all altered within acceptable ranges, i.e., ammonia-nitrogen varied between the value 100–1600 mg L−1 and a FOS/TAC ratio of 0.05–0.35 (not shown in the figure), which further proves that the long-term stability was not negatively affected by flexible feeding. The variation trend of the VS/TS parameter characterizes the content of organic matter in the digester, which showed an increasing trend with a decrease in feeding OLRs. This would be subject to the reducing of the bacteria groups in the digester caused by insufficient substrates when the OLR is reduced from 2.86 g COD L−1 digester day−1 to 0.95 g COD L−1 digester day−1, resulting in a lower decomposition rate of organic matter. Thus, some conclusions can be drawn as follows: When feeding a high organic load (for instance 2.86 g COD L−1 digester day−1), the process of methanation was inhibited and the CO2 content then increased due to the VFA accumulation, which reflected in the drop of the pH value from 7.28 to 7.04. However, when the feeding OLR is low, the activity of the bacteria was reduced, which will result in the reducing of the organic matter’s degradation rate, so that the embodied energy of the biomass cannot be fully recovered. Therefore, the 1.90 g COD L−1 digester day−1 is recommended as the optimal feeding scenario for real operations in this study.

4. Evaluation of the Flexibilization

The required biogas storage capacity was selected as the typical indicator for evaluating the theoretical effects of the flexible mode compared to constant feeding. In order to demonstrate its effects in a practical project, a biogas plant located in the Sichuan province, China, with a daily biogas production of approximately 25,000 m3 day−1 was selected as a typical case example. The biogas plant is operated with a CSTR reactor which feeds in an OLR of 2 kg COD m−3·day−1. With the biogas demand data collected from the plant’s operational report (as shown in Figure 5a), the flexible biogas production for satisfying the demand was simulated by using the former experimental data under the same total biogas volume level with the continuous operation mode.
The scenario of feeding twice per day with a 9 h interval was selected as the representative scenario for a feeding strategy based on the consideration ofthe two peaks of biogas demand and their occurring time interval. Due to the flexible biogas production, data were derived only from laboratory experiments, and this research assumes that the laboratory-scale biogas production data can be scaled-up to the practical-scale digester level based on the ratio of digesters. The result of required biogas storage capacity is shown in Figure 5b, in which the storage volume was calculated by the integration of the difference between biogas demand and actual biogas production amounts of the two modes.From the calculation result, the biogas storage capacity in flexible mode could be reduced 40.3% compared with the traditional mode, thereby a large number of operating costs could be saved.
Although the feasibility of flexible biogas production has been proved by the preliminary assessment, new problems hint at the possibilities for its practical application. This raises the uncertainty of whether the laboratory experimental results could be scaled up to practical-sized biogas plants. Further research is necessary to demonstrate flexibility in large-scale digesters through repeating the trials in a typical biogas plant.

5. Validation of the Proposed Biogas Prediction Model

For obtaining the functional expressions of parameters v max i and k i with the organic loadings in the reactor, the batch tests of one-time feeding from 0.95 g COD L−1 digester day−1 to 2.86 g COD L−1 digester day−1 were firstly conducted for employing the values of v max i and k i in different OLRs. In each OLR scenario, the variation of biogas volume with time was fitted by first-order equations using SPSS software. The obtained model parameters in each OLRs and fitting degrees are shown in Table 2.
It can be found that all the fitting degrees in different OLRs are more than 0.99, which proves that biogas production can be well modeled by first-order kinetics. In addition, all the values of parameter v max i in different experimental groups showed linear relationships with the amounts of organic matters in the digester, which can be supported by the high R2 (0.974) value via linear regression analysis, as shown in Figure 6. With the regression equation of v max i with organic matter in the digester (shown in Figure 6), the value of v max i can be determined as follows: Current OLRs in digesters should be firstly calculated by Equation (6), and then by using the functional expressions; the parameter v max i in Equation (3) can be gained. While for the parameter k i , the values in different experimental groups showed consistency at 0.001, indicating that the degradation rate barely fluctuates with OLRs. So, the value of k i is assigned to 0.001 for the proposed prediction model.
The results of the prediction model can be seen in Figure 7, in which the simulated biogas productions in different situations (i.e., different feeding OLRs in Figure 7a,b; different feeding regimes in Figure 7b,c; different time periods in the same experimental group in Figure 7c,d; and different feeding time intervals in Figure 7d,e) were taken for validating the model. All the errors between simulated results and real biogas production volume are below 10%, which validates the high accuracy of the proposed model.
Compared with the conventional prediction model like ADM1, the proposed model needs only two parameters ( v max i and k i ) from batch tests; therefore, it is not necessary to collect a large number of redundant data for the parameters. Apart from that, the model is valid for predicting the biogas production responses to any arbitrary feedings, and the model’s simplified form makes it easy for further simulating the biogas utilization strategies. However, there are still some uncertainties involved: Whether the accumulative biogas production still remains as linear relations in higher OLRs lacks the evidence from experiments due to the scope limits of this research; besides, for other types of substrates (i.e., agro-crops and livestock manure) with different mixing ratios, whether the model is still applicable needs further verification.

6. Conclusions

It is demonstrated that the highest biogas production rate appeared within 2 h after feeding in all experimental groups, which proved the system’s fast response to the pulse feedings by co-digestion of food waste and sewage sludge. Thus, the co-digested food waste and sewage sludge can be regarded as suitable substrates for flexible biogas production. The feeding organic loading rate of 1.90 g COD L−1 digester day−1 was identified as the optimal feeding scheme for demand-oriented operationsforensuring certain levels of biogas yield and methane concentrations. Methods foradjusting the feeding intervals according to power demands werealso discussed. After transforming into a flexible feeding regime, the required biogas storage capacitywas reduced by 40.3% compared with the continuous biogas production mode. Finally, a prediction model for biogas production under flexible operating conditions was established and verifiedbased on experimental data. This study is expected to provide the theoretical bases for future engineering practices of urban sewage sludge and food waste recycling, as well as improvingbiogas utilization efficiency.

Author Contributions

Conceptualization, Y.L.; data curation, X.L.; formal analysis, J.H.; investigation, D.P.; methodology, Y.L.; project administration, T.H. and M.K.; validation, Y.L.; writing—original draft, Y.L.; writing—review and editing, T.H., C.M. and M.K. All authors have read and agreed to the published version of the manuscript.

Funding

This work was funded by the Sichuan Provincial Key Technology Support (No. 2016HH0084; 18RKX0986) and the scholarship awarded by China Scholarship Council (CSC).

Acknowledgments

The authors acknowledge the financial support from Sichuan Science and Technology Agency, and the revision suggestions from all the reviewers.

Conflicts of Interest

The authors declare no conflict of interest.

Appendix A

Table A1. Additional amounts of the used substrates in different OLRs.
Noodles
(g)
Soy Flour
(g)
Oil
(g)
Salt
(g)
2.86 g COD L−1 digester day−12202006320
1.90 g COD L−1 digester day−11361273912.87
0.95 g COD L−1 digester day−14946144.62

References

  1. Sikora, J.; Niemiec, M.; Szeląg-Sikora, A.; Cupiał, M.; Klimas, A. Utilization of Post-Ferment from Co-Fermentation Methane for Energy Purposes. Ecol. Chem. Eng. A 2016, 23, 227–238. [Google Scholar]
  2. Szarka, N.; Scholwin, F.; Trommler, M.; Fabian Jacobi, H.; Eichhorn, M.; Ortwein, A.; Thrän, D. A novel rolefor bioenergy: A flexible, demand-oriented power supply. Energy 2013, 61, 18–26. [Google Scholar] [CrossRef]
  3. Budzianowski, W.M. A review of potential innovations for production, conditioning and utilization of biogas with multiple-criteria assessment. Renew. Sustain. Energy Rev. 2016, 54, 1148–1171. [Google Scholar] [CrossRef]
  4. Markard, J. The next phase of the energy transition and its implications for research and policy. Nat. Energy 2018, 3, 628–633. [Google Scholar] [CrossRef]
  5. Hahn, H.; Krautkremer, B.; Hartmann, K.; Wachendorf, M. Review of concepts for a demand-driven biogassupply for flexible power generation. Renew. Sustain. Energy Rev. 2014, 29, 383–393. [Google Scholar] [CrossRef]
  6. Lemmer, A.; Krümpel, J. Demand-driven biogas production in anaerobic filters. Appl. Energy 2017, 185, 885–894. [Google Scholar] [CrossRef] [Green Version]
  7. Mauky, E.; Weinrich, S.; Jacobi, H.F.; Nägele, H.J.; Liebetrau, J.; Nelles, M. Demand-driven biogas production by flexible feeding in full-scale–Process stability and flexibility potentials. Anaerobe 2017, 46, 86–95. [Google Scholar] [CrossRef]
  8. Saracevic, E.; Frühauf, S.; Miltner, A.; Karnpakdee, K.; Munk, B.; Lebuhn, M.; Wlcek, B.; Leber, J.; Lizasoain, J.; Friedl, A.; et al. Utilization of Food and Agricultural Residues for a Flexible Biogas Production: Process Stability and Effects on Needed Biogas Storage Capacities. Energies 2019, 12, 2678. [Google Scholar] [CrossRef] [Green Version]
  9. Ertem, F.; Martínez-Blanco, J.; Finkbeiner, M.; Neubauer, P.; Junne, S. Life cycle assessment of flexibly fed biogas processes for an improved demand-oriented biogas supply. Bioresour. Technol. 2016, 219, 536–544. [Google Scholar] [CrossRef]
  10. Linke, B.; Rodríguez-Abalde, Á.; Jost, C.; Krieg, A. Performance of a novel two-phase continuously fed leach bed reactor for demand-based biogas production from maize silage. Bioresour. Technol. 2015, 177, 34–40. [Google Scholar] [CrossRef]
  11. Lauer, M.; Thrän, D. Flexible biogas in future energy systems—Sleeping beauty for a cheaper power generation. Energies 2018, 11, 761. [Google Scholar] [CrossRef] [Green Version]
  12. Mulat, D.G.; Fabian Jacobi, H.; Feilberg, A.; Adamsen, A.P.S.; Richnow, H.H.; Nikolausz, M. Changing feedingregimes to demonstrate flexible biogas production: Effects on process performance, microbial communitystructure, and methanogenesis pathways. Appl. Environ. Microbiol. 2016, 82, 438–449. [Google Scholar] [CrossRef] [PubMed] [Green Version]
  13. Zealand, A.M.; Roskilly, A.P.; Graham, D.W. Effect of feeding frequency and organic loading rate on biomethane production in the anaerobic digestion of rice straw. Appl. Energy 2017, 207, 156–165. [Google Scholar] [CrossRef]
  14. Ahmed, S.; Kazda, M. Characteristics of on-demand biogas production by using sugar beet silage. Anaerobe 2017, 46, 114–121. [Google Scholar] [CrossRef]
  15. Barchmann, T.; Mauky, E.; Dotzauer, M.; Stur, M.; Weinrich, S.; Jakobi, H.F.; Liebetrau, J.; Nelles, M. Expanding the flexibility of Biogas plants—Substrate management, schedule synthesis and economicassessment. Landtechnik 2016, 71, 233–251. [Google Scholar]
  16. Laperrière, W.; Barry, B.; Torrijos, M.; Pechiné, B.; Bernet, N.; Steyer, J.P. Optimal conditions for flexible methane production in a demand-based operation of biogas plants. Bioresour. Technol. 2017, 245, 698–705. [Google Scholar] [CrossRef]
  17. Nghiem, L.D.; Nguyen, T.T.; Manassa, P.; Fitzgerald, S.K.; Dawson, M.; Vierboom, S. Co-digestion of sewage sludge and crude glycerol for on-demand biogas production. Int. Biodeterior. Biodegrad. 2014, 95, 160–166. [Google Scholar] [CrossRef] [Green Version]
  18. Feng, L.; Ward, A.J.; Guixé, P.G.; Moset, V.; Møller, H.B. Flexible biogas production by pulse feeding maize silage or briquetted meadow grass into continuous stirred tank reactors. Biosyst. Eng. 2018, 174, 239–248. [Google Scholar] [CrossRef]
  19. Olech, E.; Sikora, J.; Kuboń, M. The potential for biogas production using selected substrates of the agri-food industry. Agric. For. Eng. 2016, 68, 81–86. [Google Scholar]
  20. Qin, Y.; Wu, J.; Xiao, B.; Hojo, T.; Li, Y.Y. Biogas recovery from two-phase anaerobic digestion of food waste and paper waste: Optimization of paper waste addition. Sci. Total Environ. 2018, 634, 1222–1230. [Google Scholar] [CrossRef]
  21. Zhang, C.; Su, H.; Baeyens, J.; Tan, T. Reviewing the anaerobic digestion of food waste for biogas production. Renew. Sustain. Energy Rev. 2014, 38, 383–392. [Google Scholar] [CrossRef]
  22. Xu, F.; Li, Y.; Ge, X.; Yang, L.; Li, Y. Anaerobic digestion of food waste–Challenges and opportunities. Bioresour. Technol. 2018, 247, 1047–1058. [Google Scholar] [CrossRef]
  23. Meng, Y.; Li, S.; Yuan, H.; Zou, D.; Liu, Y.; Zhu, B.; Chufo, A.; Jaffar, M.; Li, X. Evaluating biomethane production from anaerobic mono-and co-digestion of food waste and floatable oil (FO) skimmed from food waste. Bioresour. Technol. 2015, 185, 7–13. [Google Scholar] [CrossRef]
  24. Li, X.; Huang, J.; Liu, Y.; Huang, T.; Maurer, C.; Kranert, M. Effects of Salt on Anaerobic Digestion of Food Waste with Different Component Characteristics and Fermentation Concentrations. Energies 2019, 12, 3571. [Google Scholar] [CrossRef] [Green Version]
  25. Chen, Y.; Cheng, J.J.; Creamer, K.S. Inhibition of anaerobic digestion process: A review. Bioresour. Technol. 2008, 99, 4044–4064. [Google Scholar] [CrossRef]
  26. Marañón, E.; Castrillón, L.; Quiroga, G.; Fernández-Nava, Y.; Gómez, L.; García, M.M. Co-digestion of cattle manure with food waste and sludge to increase biogas production. Waste Manag. 2012, 32, 1821–1825. [Google Scholar] [CrossRef]
  27. Mehariya, S.; Patel, A.K.; Obulisamy, P.K.; Punniyakotti, E.; Wong, J.W. Co-digestion of food waste and sewage sludge for methane production: Current status and perspective. Bioresour. Technol. 2018, 265, 519–531. [Google Scholar] [CrossRef]
  28. Lauven, L.P.; Geldermann, J.; Desideri, U. Estimating the revenue potential of flexible biogas plants in the power sector. Energy Policy 2019, 128, 402–410. [Google Scholar] [CrossRef]
  29. Vavilin, V.A.; Vasiliev, V.B.; Ponomarev, A.V.; Rytow, S.V. Simulation model ‘methane’ as a tool for effective biogas production during anaerobic conversion of complex organic matter. Bioresour. Technol. 1994, 48, 1–8. [Google Scholar] [CrossRef]
  30. Mauky, E.; Weinrich, S.; Nägele, H.J.; Jacobi, H.F.; Liebetrau, J.; Nelles, M. Model Predictive Control for Demand—Driven Biogas Production in Full Scale. Chem. Eng. Technol. 2016, 39, 652–664. [Google Scholar] [CrossRef]
  31. Löffler, D. Entwicklung Einer Regelungsstrategie für den Anaerob prozess am Beispiel Landwirtschaftlicher Biogasanlagen. Ph.D. Thesis, University of Stuttgart, Stuttgart, Germany, 2012. [Google Scholar]
  32. Mendes, C.; Esquerre, K.; Queiroz, L.M. Application of Anaerobic Digestion Model No. 1 for simulating anaerobic mesophilic sludge digestion. Waste Manag. 2015, 35, 89–95. [Google Scholar] [CrossRef] [PubMed]
  33. Nordlander, E.; Thorin, E.; Yan, J. Investigating the possibility of applying an ADM1 based model to a full-scale co-digestion plant. Biochem. Eng. J. 2017, 120, 73–83. [Google Scholar] [CrossRef]
  34. Rajendran, K.; Kankanala, H.R.; Lundin, M.; Taherzadeh, M.J. A novel process simulation model (PSM) for anaerobic digestion using Aspen Plus. Bioresour. Technol. 2014, 168, 7–13. [Google Scholar] [CrossRef] [PubMed] [Green Version]
  35. Rieke, C.; Stollenwerk, D.; Dahmen, M.; Pieper, M. Modeling and optimization of a biogas plant for a demand-driven energy supply. Energy 2017, 145, 657–664. [Google Scholar] [CrossRef]
  36. Hien, S.; Hansen, J.; Drewes, J.E.; Koch, K. BioTOOL—A Readily and Flexible Biogas Rate Prediction Tool for End-users. Environ. Model. Assess. 2019, 24, 87–94. [Google Scholar] [CrossRef]
  37. Yang, J. Study on the Medium Temperature Anaerobic Experiment of Meat Waste with Pig Manure as Inoculum. Master’s Thesis, Southwest Jiaotong University, Chengdu, China, 2012. [Google Scholar]
  38. Rao, M.S.; Singh, S.P. Bioenergy conversion studies of organic fraction of MSW: Kinetic studies and gas yield–organic loading relationships for process optimisation. Bioresour. Technol. 2004, 95, 173–185. [Google Scholar] [CrossRef]
  39. Xie, S.; Hai, F.I.; Zhan, X.; Guo, W.; Ngo, H.H.; Price, W.E.; Nghiem, L.D. Anaerobic co-digestion: A critical review of mathematical modelling for performance optimization. Bioresour. Technol. 2016, 222, 498–512. [Google Scholar] [CrossRef]
  40. Whitmore, T.; Lloyd, D.; Jones, G.; Williams, T. Hydrogen-dependent control of the continuous anaerobic digestion process. Appl. Microbiol. Biotechnol. 1987, 26, 383–388. [Google Scholar] [CrossRef]
  41. Ryckebosch, E.; Drouillon, M.; Vervaeren, H. Techniques for transformation of biogas to biomethane. Biomass Bioenergy 2011, 35, 1633–1645. [Google Scholar] [CrossRef]
  42. Lo, H.M.; Kurniawan, T.A.; Sillanpää, M.E.T.; Pai, T.Y.; Chiang, C.F.; Chao, K.P.; Liu, M.H.; Chuang, S.H.; Banks, C.J.; Wang, S.C.; et al. Modeling biogas production from organic fraction of MSW co-digested with MSWI ashes in anaerobic bioreactors. Bioresour. Technol. 2010, 101, 6329–6335. [Google Scholar] [CrossRef]
Figure 1. Experimental results of biogas production with feeding once per day: (a) Feeding organic loading rate (OLR) = 0.95g COD L−1 digester day−1; (b) feeding OLR = 1.90g COD L−1 digester day−1; (c) feeding OLR = 2.86g COD L−1 digester day−1.
Energies 13 00818 g001
Figure 2. Experimental results of biogas production with feeding twice per day, feeding OLR = 1.90g COD L−1 digester day−1: (a) 9 h feeding time interval; (b) 7 h feeding time interval; (c) 5 h feeding time interval.
Energies 13 00818 g002
Figure 3. Experimental results of biogas production with feeding twice per day, feeding OLR = 0.95 g COD L−1 digester day−1: (a) 9 h feeding time interval; (b) 7 h feeding time interval; (c) 5 h feeding time interval.
Energies 13 00818 g003
Figure 4. Variations of VS/TS and pH value during the experiments.
Energies 13 00818 g004
Figure 5. Comparison of required biogas storage capacity in continues and flexible biogas production mode based on the biogas demand of biogas plant. (a) Biogas demand of the biogas plant; (b) Comparison of the required biogas storage capacity.
Energies 13 00818 g005
Figure 6. Correlation between the amount of organic matter in the reactor and parameter Vmax.
Energies 13 00818 g006
Figure 7. Validation of the proposed model: (a) Feeding once per day with 0.95 g COD L−1 digester day−1; (b) Feeding once per day with 1.90 g COD L−1 digester day−1; (c) The initial phase in feeding twice per day with a 5 h time interval; (d) Later phase in feeding twice per day with a 5 h time interval; (e) Feeding twice per day with a 9 h time interval.
Energies 13 00818 g007
Table 1. Composition of the used feeding substrates.
ParametersSubstrates
NoodleSoybeanOilExcess Sludge
TS (%)88.588-0.84
VS (%)9993.399.969.1
VS (g/kg fresh substance)876.2821.049995.8
COD (gL−1)283.51053.72384.28.77
ρ j   (gL−1)0.930.80.911
Protein (%)1258.6--
Fat (%)1.22.1100-
Carbohydrate (%)7121.3--
Table 2. Fitting results of first-order kinetics from batch tests.
Parameters
Feeding COD
(g COD L−1 Digester day−1)
v max i
(mL BiogasL−1 Digester)
k i
(1 day−1)
Adjusted R2
0.95686.7990.0010.993
1.42792.0040.0010.997
1.901052.0100.0010.995
2.381358.8090.000450.997
2.861484.2870.0010.997

